Embed Size (px)
Citation preview

The report of Her Majesty’s Chief Inspector of Education, Children’s Services and Skills 2013/14
Schools

2
Figure 1: Number of providers and inspections carried out in 2013/14
Notes: Includes section 5 inspections and section 8 deemed section 5 inspections. Total number of schools based on Edubase at 3 September 2014.These statistics exclude three schools that were inspected during the academic year but where the inspection report had not been published by 6 October 2014.
Source: Ofsted and Department for Education
412schools
Nursery
120inspections
16,787schools
Primary
4,823inspections
3,372schools
Secondary
1,048inspections
1,039schools
Special
353inspections
1,082schools
Non-association independent
296inspections
365schools
Pupil referral units
125inspections
333in sector
Initial teacher education
62inspections
21,975schools
6,469inspections
3
ww
w.o
fste
d.go
v.uk
Data View: Inspection findings can also be viewed at www.dataview.ofsted.gov.uk. Data View enables users to compare the performance of providers over time from Ofsted inspection across England by region, local authority and constituency area.
Contents
Executive summary 4
What does the sector look like? 7
Ofsted’s inspection of schools 8
Enabling all children to succeed 13
More good teachers 20
Leadership makes the difference 26
Effective challenge and support 31
Key statistics 36

4
Sect
or re
port
201
3/14
: Sch
ools
Executive summary1. Primary schools in England are getting better, but improvement in
secondary schools has stalled. Eighty two per cent of primary schools are now good or outstanding, which is an increase of three percentage points over last year. By contrast, just 71% of secondary schools are at least good, a figure that has not changed since 2012/13. The proportion of pupils doing well in the national tests at the age of 11 has risen by three percentage points this year. In comparison, GCSE results have not risen over the last three years and the gap in attainment at GCSE between pupils from poorer backgrounds and their more affluent peers is not closing quickly enough.1
2. Strong leadership is crucial but not enough schools have good leaders. Inspection shows that, out of all schools, there are nearly 3,500 where leadership is not good enough. However, there is a disproportionately high number of secondary schools where leadership has been judged inadequate or as requires improvement. Twenty three per cent of secondary schools have weak leadership compared with 16% of primary schools.
3. The best schools focus on high-quality teaching. Successful primary headteachers and their staff know their pupils’ abilities well and they ensure that teaching is focused on getting the basics right, particularly literacy. In contrast, less successful secondary schools are struggling to identify the needs of their pupils accurately enough to teach the curriculum in a way that meets those needs. Weaker secondary headteachers fail to ensure that the quality of teaching is consistent across all subject areas. They have not developed staff or managed their performance effectively.
4. Good teachers are in short supply where they are needed most. Schools can only be as good as the people who work in them. However, our evidence shows that the areas of the country where standards are lowest not only have the most urgent need for strong leaders, but they are also not attracting or retaining teachers of the right calibre. The schools in these areas often also serve disproportionately high numbers of pupils from poorer backgrounds. The allocation of teacher training places needs to ensure that there is a sufficient supply of high quality teachers to meet the needs of disadvantaged areas. Schools will never succeed in narrowing the achievement gap unless this problem is solved.
1. Data for the 2014 attainment of pupils eligible for free school meals compared with other pupils will be published in January 2015.

5
ww
w.o
fste
d.go
v.uk
Executive summary
5. Secondary schools are not stretching our most able pupils. Too often, high-attaining 11-year-olds do not go on to achieve A and A* grades at GCSE. This year our inspectors looked carefully at how schools were challenging these pupils. In a third of all secondary schools inspected, they recommended that able pupils should be given more challenging work and that teaching should take better account of their abilities.
6. Although children from poor backgrounds are doing better, particularly at primary, they are still too far behind other pupils. The achievement gap between economically disadvantaged children and their peers is not closing quickly enough in secondary schools. The achievements of disadvantaged children from some ethnic backgrounds show that it is possible to close the gap, but poor White children continue to perform less well than all others. This year, inspectors focused sharply on what schools are doing to support the most disadvantaged children.
7. The right school culture is critical for improvement. Pupils need a structured learning environment where expectations are high if they are to succeed. Our recent report ‘Below the radar’ highlighted significant weaknesses in pupils’ attitudes.2 It identified low-level disruptive behaviour and persistent challenges to teacher authority, particularly in secondary schools. Parents and teachers told us that this is a major concern for them. In schools inspected this year, there was a substantial fall in the number of secondary schools in which behaviour was judged good or outstanding compared with those inspected in the previous year.
8. Without effective challenge, support and intervention, many underperforming schools do not improve. Where headteachers are not sufficiently supported and held to account, underperformance and failure often follow. This decline occurs regardless of whether a school is in a multi-academy trust (MAT) or maintained by a local authority. Our inspections of academies in weak MATs found a worrying lack of urgency to bring about improvement. Our inspections of weak local authorities identified that they know too little about the attainment and progress of pupils in their area. These MATs and local authorities are not giving enough support to underperforming schools and not challenging coasting schools adequately.
2. Below the radar: low-level disruption in in the country’s classrooms (140157), Ofsted, September 2014; www.ofsted.gov.uk/resources/below-radar-low-level-disruption-country%E2%80%99s-classrooms.

6
Sect
or re
port
201
3/14
: Sch
ools
9. It is too early to judge the overall performance of free schools. We have inspected 76 of the 237 free schools and therefore it is too early to draw firm conclusions. However, those inspected to date have a similar profile of inspection judgements to other schools and our inspections indicate that free schools succeed or fail for broadly the same reasons as all other types of school.
10. Too many academies do not receive effective challenge and support. More than 2,000 academies are not part of a MAT and some have become isolated. Isolation can lead to underperformance. Our analysis of academies that experienced a sharp fall in inspection grade last year shows that most had not made arrangements for external support and challenge until it was too late and serious decline had set in.
11. Schools have responded positively to the challenge of inspection. Two thirds of those schools re-inspected this year that were previously judged as requires improvement got to good or outstanding following a tailored programme of challenge and support from Her Majesty’s Inspectors.

7
ww
w.o
fste
d.go
v.uk
What does the sector look like?12. There are 21,975 schools in England, with over 450,0003 teachers
and 7,700,000 pupils.4 Six in 10 secondary schools are now academies and free schools, almost half of them in MATs. Of the 16,787 primary schools, 13% are now academies and free schools.
13. England’s school system is in a state of transition. Secondary schools have been taking on much more autonomy and primary schools are following suit, albeit in smaller proportions. This is against the backdrop of major educational reforms:
●● a new national curriculum coming into force
●● changes to pupil assessment and progress tracking as the previous national curriculum levels are phased out
●● new, tougher examinations at GCSE and A level.
Amidst these important changes, schools must continue to fulfil their basic purpose to teach pupils and prepare them successfully for the next stage of their lives.
3. Statistical first release: School workforce in England: November 2013, Department for Education, April 2014, updated August 2014; www.gov.uk/government/statistics/school-workforce-in-england-november-2013.
4. Pupils data taken from Edubase in September 2014 using Schools census data. Schools, pupils and their characteristics: January 2014, Department for Education, June 2014, updated July 2014; .
Primary schools Secondary schools
Local authority maintained schools
Academies in a MAT
Academies not in a MAT
Free schools, university technical collegesand studio schools
Primary schools Secondary schools
9%
24%
31%
5%
87%
40%
4%
1%
Figure 2: Types of primary and secondary school in England
Percentages in the chart are rounded and may not add to 100. School numbers, phase and type are based on Edubase at 3 September 2014. Information on whether an academy is in a MAT is provided by the Department for Education and is based on status as at 1 October 2014.Source: Ofsted and Department for Education
Local authority maintained schools
Academies in a MAT
Academies not in a MAT
Free schools, university technical collegesand studio schools
Primary schools Secondary schools
9%
24%
31%
5%
87%
40%
4%
1%

8
Sect
or re
port
201
3/14
: Sch
ools
Ofsted’s inspection of schools14. In 2013/14, Ofsted conducted 6,469 inspections of schools: 5,590 local
authority maintained schools;5, 6 817 academies; 53 free schools; and nine studio schools or university technical colleges. The large majority of these were inspected because they had reached the maximum interval since their previous inspection, although a proportion were selected on the basis of an assessment of risk.
Primary schools are improving but secondary schools are stalling15. Children in primary schools have a better chance than ever of attending
an effective school. Eighty-two per cent of primary schools are now good or outstanding, which means that 190,000 more pupils are attending good or outstanding primary schools than last year. However, the picture is not as positive for secondary schools: only 71% are good or outstanding, a figure that is no better than last year. Some 170,000 pupils are now in inadequate secondary schools compared with 100,000 two years ago.
16. This year, a greater proportion of secondary schools declined from good or outstanding than primary schools. Thirty five per cent of secondary schools that were previously good or outstanding declined to requires improvement or inadequate compared with 24% in 2012/13. For primary schools, that proportion was 30%.
17. In 2011/12, our inspectors found that leadership in primary schools was on average not as good as that in secondary schools. Today, the reverse is true: 84% of primary schools are judged good or outstanding for leadership and management compared with 77% of secondary schools.
18. The evidence from our inspections this year tell us that many primary schools are doing a number of important things well:
●● Leadership in primaries is improving rapidly. Good and outstanding primary schools create cohesive teams of leaders and teachers.
●● Governing bodies offer heads challenge as well as support. They are increasingly aware of their responsibility to evaluate how they spend the pupil premium funding and to monitor the school’s performance management process.
●● Teaching is focused on getting the basics right. The mission of primary schools is now clearer than it has ever been, particularly in relation to literacy. Better teaching of early reading is being evidenced by rising scores in the phonics screening check.
5. Some schools may have been inspected more than once.
6. These statistics exclude three schools that were inspected during the academic year but where the inspection report had not been published by 6 October 2013.

9
ww
w.o
fste
d.go
v.uk
Ofsted’s inspection of schools
●● Promoting good behaviour is a priority. The majority of primary schools create a well-defined culture where good attendance and positive attitudes to learning are the norm.
19. In contrast, our inspection evidence shows that many secondary schools have encountered a common set of problems that are preventing them from improving further:
●● Weak leadership – headteachers of inadequate secondary schools have been unable to ensure that the quality of teaching is consistent across all subject areas. They have not implemented staff development programmes or effective performance management systems.
●● Ineffective middle leaders – middle leaders in secondary schools have too little impact on teaching and learning. This can be because some lack experience, but it can also be because senior managers do not entrust them with leading
teaching – with all that involves – or do not hold them to account for the quality of learning in subject areas.
●● Transition of pupils – too often, the move from primary to secondary is not handled well enough and gains made in primary schools are not capitalised on in Key Stage 3.
●● Behaviour and culture – too often in secondary schools, these are not good enough to support effective learning. Pupil misconduct can be a significant challenge. Low-level disruption is a pressing problem and there is wide variability in the way behaviour is dealt with by some secondary schools.
●● Governance and oversight – schools need effective challenge and support regardless of whether they are academies or maintained by the local authority. Improving secondary schools tend to value independent challenge and support more highly than those in decline.
Figure 3: Primary schools: most recent overall effectiveness judgements
2012 (16,643)
2013 (16,409)
2014 (16,266)
Outstanding
Good
Requires improvement
Inadequate
17 64 16
2
17
51
61 19
2
18 29
2
Percentages in the chart are rounded and may not add to 100. Includes inspections that took place by 31 August 2014 and were published by 6 October 2014.Source: Ofsted
2012 (16,643)
2013 (16,409)
2014 (16,266)
Outstanding
Good
Requires improvement
Inadequate
17 64 16
2
17
51
61 19
2
18 29
2

10
Sect
or re
port
201
3/14
: Sch
ools
Schools requiring improvement20. Since Ofsted replaced ‘satisfactory’ with the
‘requires improvement’ judgement in September 2012, we have carried out 4,321 inspections that have resulted in a judgement of requires improvement. One thousand, nine hundred and seventy of these schools were judged as requires improvement this year.
21. Where inspectors have judged the school and its leadership and management as requires improvement, Her Majesty’s Inspectors (HMI) provide a tailored programme of challenge and support that includes monitoring visits, improvement surgeries for headteachers and governors, focused workshops for groups of schools, mathematics and English seminars for senior and subject leaders, and school reviews undertaken with leaders of other schools. Within two years, the school receives a full inspection, conducted by an inspector who has not been involved in the monitoring programme. At the end of 2013/14, there were 2,802 requires improvement schools eligible for support under the programme.
22. Early evidence suggests that ‘requires improvement’ schools are benefiting from this support and challenge. This year, 549 schools in the support programme were inspected. Two thirds improved to good or outstanding. Just 7% of schools declined and were placed in special measures or serious weaknesses (see Figure 5).
The effectiveness of school sixth forms23. Overall, sixth forms based in a school educate
almost three times as many young people as sixth form colleges. Outcomes of school sixth forms are very similar to those for sixth form colleges: between 92% and 93% of their academic cohorts attain at least two substantial level 3 qualifications (such as A levels).
24. However, not all school sixth forms offer a high standard of education. Some schools that struggle to provide good education for 11–16-year-olds also have ineffective sixth forms. For example, in inadequate sponsor-led academies that have sixth form provision, a third of the sixth forms were also found to be poor, with only one in 10 being good. Too often, these schools are failing to set aspirational standards for their young people.
Figure 4: Secondary schools: most recent overall effectiveness judgements
2012 (3,075)
2013 (3,119)
2014 (3,150)
Outstanding
Good
Requires improvement
Inadequate
21 49 23 6
23
40
48 24 5
26 30 3
Percentages in the chart are rounded and may not add to 100. Includes section 5 inspections and section 8 deemed section 5 inspections. School details based on Edubase at 3 September 2014. Includes inspections that took place between 1 September 2013 and 31 August 2014 and that were published by 6 October 2014.Source: Ofsted
2012 (3,075)
2013 (3,119)
2014 (3,150)
Outstanding
Good
Requires improvement
Inadequate
21 49 23 6
23
40
48 24 5
26 30 3

11
ww
w.o
fste
d.go
v.uk
Ofsted’s inspection of schools
25. In addition, where school sixth forms are very small, they frequently offer too narrow a range of subjects or teach those subjects poorly. The quality of teaching is variable and senior staff do not monitor this teaching effectively. In some cases, the success or failure of a course depends solely on one individual member of staff. Little attention is paid to providing specific, subject-related training to A-level teachers. Students in small school sixth forms achieve considerably poorer results than those in larger sixth forms.
26. We are concerned that small and ineffective sixth forms often guide young people onto the wrong courses because of the limited range available. These young people are encouraged to take up subjects at AS level for which they are not well prepared or academically suited. Often, young people end up abandoning an academic course they should not have started in the first place and leave sixth form with no additional qualifications. In one particularly poor example, inspectors noted that one in five of the students who started sixth form courses left with nothing.
Free schools: strong leadership is essential27. Ofsted has now inspected 76 free schools.7 As
with all schools, leadership in free schools is vitally important to their pupils’ attainment. These new
schools need highly able leaders who can get them to good quickly. It is still too early to reach a judgement on these schools as a group or compare their overall effectiveness with other types of schools.
28. Our inspectors found that, like other strongly performing schools, the best free schools demonstrate excellent leadership, including strong governance. They have experienced, ambitious leaders who have high aspirations and play a critical role in establishing the school’s vision. They are also relentless in their drive to raise standards and improve the quality of teaching. They are outward looking, fostering good networks with the local community so that they do not become isolated. They also welcome scrutiny and often seek external validation, including moderation of teachers’ assessments, to ensure that their judgements are robust.
29. In contrast, our inspectors found that the weakest free schools have ineffective leadership that inhibits improvement, with little challenge to tackle poor performance. They do not do enough to ensure that pupils are kept safe, particularly around monitoring attendance and behaviour.8
7. The number of free schools continues to increase. Seventy one of the 162 schools that were open but had not been inspected as at 3 September 2014 had opened on 1 September 2014.
8. Based on evidence from 39 inspections of free schools.
Figure 5: Reinspections of schools, in 2013/14, previously judged as satisfactory or requires improvement (RI)
All other previouslyRI or satisfactory
schools (1,852)
Previously RI,in the RI
programme (549)
Improved
Remained the same
Declined
67 26 7
23
40
48 24 5
50 9
Percentages in the chart are rounded and may not add to 100. Includes section 5 inspections and section 8 deemed section 5 inspections. Includes inspections that took place between 1 September 2013 and 31 August 2014 which were published by 6 October 2014.Source: Ofsted
All other previouslyRI or satisfactory
schools (1,852)
Previously RI,in the RI
programme (549)
Improved
Remained the same
Declined
67 26 7
23
40
48 24 5
50 9

12
Sect
or re
port
201
3/14
: Sch
ools
Inspection of independent schools30. In April 2014, Ofsted introduced a new framework for the inspection of
non-association independent schools.9 This brought inspection of these schools in line with all other maintained schools and academies, replacing the ‘adequate’ judgement with ‘requires improvement’. In the academic year, Ofsted inspected 296 independent schools in total. The proportion rated good or outstanding increased by eight percentage points to 72%. However, 11% were judged inadequate – a higher percentage than for most other types of school.
31. Ofsted verifies whether independent schools are conforming to the statutory standards laid down by the Department for Education. This year, a fifth failed to meet all these standards. Nine of the independent schools we inspected failed to meet half of the standards expected of them for quality of education, such as not providing a broad and balanced curriculum. This is four more schools than last year. Also, in the period between April and August 2014, 11 schools were judged inadequate for pupil behaviour and safety. Ten of the independent schools we inspected failed to meet the standard requiring schools to ‘encourage pupils to respect the fundamental British values of democracy, the rule of law, individual liberty and mutual respect, and tolerance of those with different faiths and beliefs’.
32. Ofsted proposes to tighten up inspections of independent schools. We are proposing that any school judged less than good will be re-inspected within two years, rather than the current three years. From September 2015, we also propose to inspect independent schools against the common inspection framework that we have been consulting on for all schools. This will allow us to assess more accurately how standards in independent schools compare with other schools across the country.
9. Ofsted inspects 1,082 independent schools where these are not part of an association that has an approved inspectorate of independent schools. Association independent schools are inspected by one of the Independent Schools Inspectorate (ISI), School Inspection Service (SIS) or the Bridge Schools Inspectorate (BSI). Ofsted monitors a sample of the reports of each inspectorate and reports annually on findings.
Figure 6: Free schools – most recent overall effectiveness judgements (number of schools)
Outstanding
Good
Requires improvement
Not yet inspected
Inadequate
21 49 23 6
18
40
35 19
4
162
26 30 3Includes section 5 inspections and section 8 deemed section 5 inspections. Includes the most recent inspections for all open schools that took place by 31 August 2014 and were published by 6 October 2014.The number of open schools is based on Edubase at 3 September 2014, and includes 71 schools that opened between 1 and 3 of September 2014. One school closed on 31 August 2014 and re-opened on 1 Sept 2014 with a new trust sponsor. In doing so it is included in both ‘inspection judgement’ and ‘not yet inspected’. .Source: Ofsted and Department for Education
Outstanding
Good
Requires improvement
Not yet inspected
Inadequate
21 49 23 6
18
40
35 19
4
162
26 30 3

13
ww
w.o
fste
d.go
v.uk
Enabling all children to succeed33. Every child, from the most disadvantaged to the most able, must have
the environment and opportunities they need to learn and succeed. To raise attainment, schools need to create a disciplined learning environment, teach a broad and balanced curriculum and support the needs of individual children, helping them to realise their potential.
34. Primary schools are increasingly getting the basics right. The introduction of the phonics screening check for six-year-olds has increased the attention being given to the essential early skills that pupils need for reading and writing. In 2014, 90% reached the expected standard in reading and 86% reached the expected standard in writing at Key Stage 1, an increase from 87% and 83% in 2012, respectively.
35. The improvement in attainment of pupils at a national level broadly reflects the overall difference in inspection grades between primary and secondary schools. The proportion of pupils achieving benchmark levels in Key Stage 2 tests increased this year from 76% to 79%. In contrast, the proportion of pupils achieving five GCSEs grades A* to C including English and mathematics fell to 55.9% after remaining fairly static at 58.8% in 2012 and 60.6% in 2013. However, the changes to GCSE outcomes in 2014 should be interpreted with care, as they are to some extent brought about by the government’s changes to performance tables and examinations. These reforms have had an impact on grade profile, that is not easy to separate from the impact of pupils’ individual performance.
Supporting the most disadvantaged children36. It is vitally important that schools play their part in helping the most
disadvantaged children to fulfil their potential. Unfortunately, national figures indicate that children from poor socioeconomic backgrounds, particularly those from White British backgrounds, are still most likely to be failed by the system. There has been some progress in primary schools, where the gap in mathematics attainment at the end of Key Stage 2 between disadvantaged pupils and those from better off backgrounds has narrowed by seven percentage points since 2007. However, the gap in attainment for disadvantaged secondary pupils is only one percentage point lower than it was in 2007.

14
Sect
or re
port
201
3/14
: Sch
ools
Case study: using the pupil premium effectively
Cardinal Hume Catholic School is a secondary converter academy in the North East that serves a largely White British community with slightly above average levels of deprivation. In this school all students, regardless of background, make outstanding progress and end up with GCSE results well above the national average. A large number of children are eligible for the pupil premium but there is little difference between their attainment and that of other students.
How does the school achieve this? Its senior leaders have adopted a range of initiatives that are monitored by governors to ensure that the pupil premium is spent effectively. These include:
●● teaching some students in smaller class sizes
●● targeted one-to-one support
●● mentoring of selected students by senior leaders and academic mentors
●● home tutoring for pupils in mathematics
●● coursework support
●● family learning opportunities
●● dedicated counsellors to work with pupils and their families
●● a school-wide focus on literacy
●● high expectations and standards of discipline for all, regardless of background and ability
●● focused special educational needs intervention and strategies that are tailor-made for vulnerable children.
37. Ofsted drew attention to this problem in June 2013 in ‘Unseen children: access and achievement 20 years on’,10 which made recommendations for action nationally, locally and at school level. There has been some welcome progress. Some areas are creating sub-regional challenges to raise the achievement of disadvantaged pupils. There are also plans for more National Leaders of Education to help challenging schools to improve. However, there needs to be a concerted effort to make sure that the best leaders and teachers are raising the performance of schools in poorer areas. More needs to be done to track the progress of disadvantaged pupils right through their education.
38. Ofsted has played its part by changing our inspection practice to put more emphasis on the achievement of those supported by the pupil premium. This year, our inspectors used new criteria for making judgements about pupil achievement at a school. Under these criteria, for a school to be judged outstanding for pupil achievement, disadvantaged pupils should be achieving at the same level as other pupils or their level of achievement should be rising rapidly.
10. Unseen children: access and achievement 20 years on (130155), Ofsted, June 2013; www.ofsted.gov.uk/resources/unseen-children-access-and-achievement-20-years.
15
ww
w.o
fste
d.go
v.uk
Enabling all children to succeed
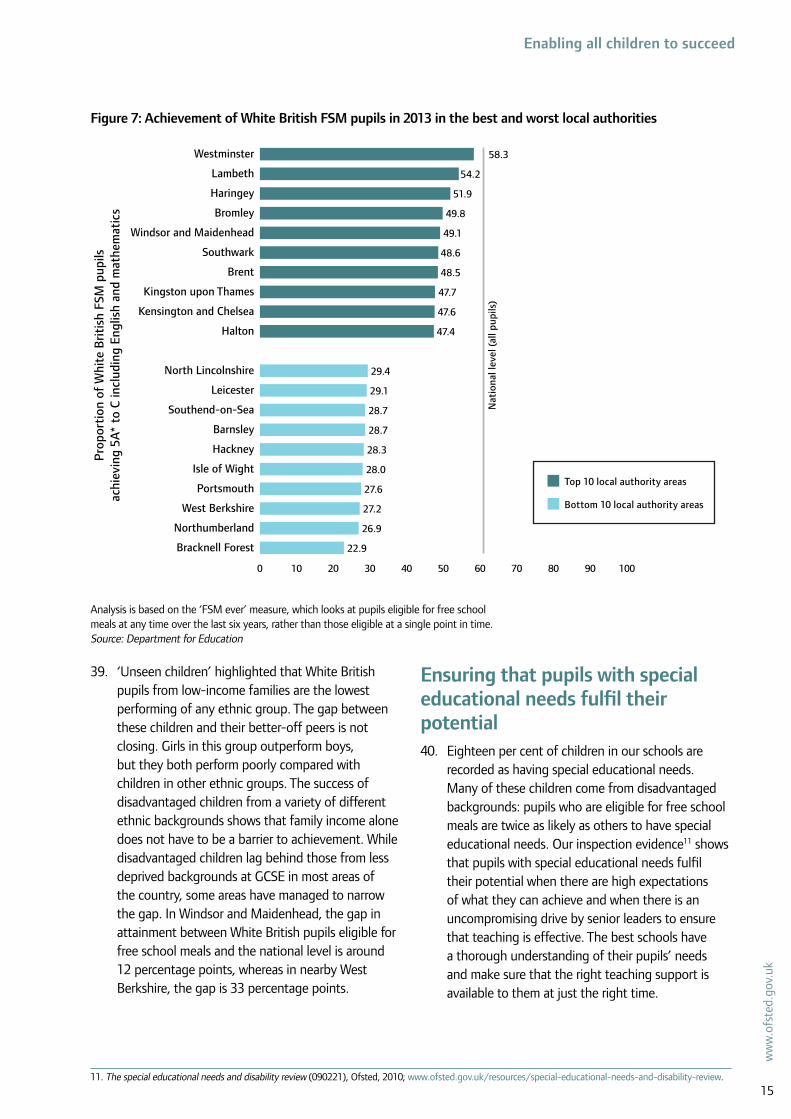
Figure 7: Achievement of White British FSM pupils in 2013 in the best and worst local authorities
0 10 20 30 40 50 60 70 80 90 100
Bracknell Forest
Northumberland
West Berkshire
Portsmouth
Isle of Wight
Hackney
Barnsley
Southend-on-Sea
Leicester
North Lincolnshire
Halton
Kensington and Chelsea
Kingston upon Thames
Brent
Southwark
Windsor and Maidenhead
Bromley
Haringey
Lambeth
Westminster
Top 10 local authority areas
Pro
port
ion
of W
hite
Bri
tish
FSM
pup
ilsac
hiev
ing
5A*
to C
incl
udin
g En
glis
h an
d m
athe
mat
ics
Bottom 10 local authority areas
58.3
54.2
51.9
49.8
49.1
48.6
48.5
47.7
47.6
47.4
Nat
iona
l lev
el (
all p
upils
)
29.4
29.1
28.7
28.7
28.3
28.0
27.6
27.2
26.9
22.9
Analysis is based on the ‘FSM ever’ measure, which looks at pupils eligible for free school meals at any time over the last six years, rather than those eligible at a single point in time.Source: Department for Education
39. ‘Unseen children’ highlighted that White British pupils from low-income families are the lowest performing of any ethnic group. The gap between these children and their better-off peers is not closing. Girls in this group outperform boys, but they both perform poorly compared with children in other ethnic groups. The success of disadvantaged children from a variety of different ethnic backgrounds shows that family income alone does not have to be a barrier to achievement. While disadvantaged children lag behind those from less deprived backgrounds at GCSE in most areas of the country, some areas have managed to narrow the gap. In Windsor and Maidenhead, the gap in attainment between White British pupils eligible for free school meals and the national level is around 12 percentage points, whereas in nearby West Berkshire, the gap is 33 percentage points.
Ensuring that pupils with special educational needs fulfil their potential40. Eighteen per cent of children in our schools are
recorded as having special educational needs. Many of these children come from disadvantaged backgrounds: pupils who are eligible for free school meals are twice as likely as others to have special educational needs. Our inspection evidence11 shows that pupils with special educational needs fulfil their potential when there are high expectations of what they can achieve and when there is an uncompromising drive by senior leaders to ensure that teaching is effective. The best schools have a thorough understanding of their pupils’ needs and make sure that the right teaching support is available to them at just the right time.
11. The special educational needs and disability review (090221), Ofsted, 2010; www.ofsted.gov.uk/resources/special-educational-needs-and-disability-review.
0 10 20 30 40 50 60 70 80 90 100
Bracknell Forest
Northumberland
West Berkshire
Portsmouth
Isle of Wight
Hackney
Barnsley
Southend-on-Sea
Leicester
North Lincolnshire
Halton
Kensington and Chelsea
Kingston upon Thames
Brent
Southwark
Windsor and Maidenhead
Bromley
Haringey
Lambeth
Westminster
Top 10 local authority areas
Pro
port
ion
of W
hite
Bri
tish
FSM
pup
ilsac
hiev
ing
5A*
to C
incl
udin
g En
glis
h an
d m
athe
mat
ics
Bottom 10 local authority areas
58.3
54.2
51.9
49.8
49.1
48.6
48.5
47.7
47.6
47.4
Nat
iona
l lev
el (
all p
upils
)
29.4
29.1
28.7
28.7
28.3
28.0
27.6
27.2
26.9
22.9

16
Sect
or re
port
201
3/14
: Sch
ools
41. Pupils with special educational needs do best when they are supported by excellent teachers. Unfortunately, however, they are often supported by staff with the least expertise in subject areas and teaching methods. Teaching that is not tailored appropriately to pupils’ individual needs – for example giving them work that is too difficult or too easy – can have a severe, long-term impact on their progress and confidence.
42. Most schools monitor closely the progress that disabled pupils and those with special educational needs make in their academic subjects, especially in English and mathematics. However, less attention is paid to the progress they make in developing personal and social skills and in becoming more independent. Parents value these achievements highly and success in them can make a substantial difference to the young person’s future. More attention should be paid to supporting pupils in these important aspects of their personal development.
Challenging the most able43. England’s schools are still not doing enough to help the most able
children realise their potential. Ofsted drew attention to this last year, but the story has yet to change signficantly. Almost two thirds of the pupils in non-selective schools who attained highly at primary school in English and mathematics did not reach an A* or A in those subjects at GCSE in 2013. Nearly a quarter of them did not even achieve a B grade and a disproportionate number of these are boys. Our brightest pupils are not doing as well as their peers in some other countries that are significantly outperforming England. In PISA 2012, fewer 15-year-olds in England were attaining at the highest levels in mathematics than their peers in Germany, Poland and Belgium. In reading, however, they were on a par.
44. This year, our inspectors looked carefully at how schools were challenging their most able pupils. Further action for individual schools was recommended in a third of our inspection reports. The majority of recommendations related to improved teaching of this group of pupils. Inspectors called on schools to ensure that the most able pupils are being given challenging work that takes full account of their abilities. Stretching the most able is a task for the whole school. It is important that schools promote a culture that supports the most able pupils to flourish, giving them opportunities to develop the skills needed by top universities and tracking their progress at every stage.
45. Ofsted will continue to press schools to stretch their most able pupils. Over the coming year, inspectors will be looking at this more broadly, taking into account the leadership shown in this area by schools. We will also further sharpen our recommendations so that schools have a better understanding of how they can help their most able pupils to reach their potential. Ofsted will follow up its 2013 publication on the most able in secondary schools with another survey focusing on non-selective primary and secondary schools. As part of this survey, we will examine the transition of the most able pupils from one phase to the next.

17
ww
w.o
fste
d.go
v.uk
Enabling all children to succeed
Too much low-level disruption in secondary schools46. In successful schools, headteachers and middle leaders work together to
establish a culture that expects the very highest standards of behaviour. Inspectors have found that, in the best schools, senior leaders set high expectations and enforce codes of conduct, recognising that good discipline is needed to create a positive climate for learning. They involve all staff in ensuring high standards of behaviour. Equally, staff, pupils and parents know what is expected of them and any transgressions are met with a robust response.
47. Yet in too many schools, poor behaviour continues to be a problem. Low-level disruption and persistent challenges to teacher authority make it hard for pupils to learn and teachers to teach.
48. Inspections carried out in 2013/14 identified a higher proportion of schools than last year where behaviour and safety were less than good. Behaviour was judged to be less than good in 28% of the secondary schools inspected, compared with 21% in 2012/13. There has also been a rise in the proportion of primary schools judged as having less than good behaviour, but that proportion is still lower than for secondary schools. Our inspections12 found that, in some schools, there were irregularities in the way behaviour was dealt with across different classes and not all teachers followed behaviour policies. In secondary schools, low-level disruption increased when teaching was uninteresting, particularly where the school’s ethos was not strong. Sometimes, teachers unhelpfully blurred the boundaries between friendliness and familiarity with a consequent loss of authority across the school staff.
49. In ‘Below the radar’,13 we published the results of a specially commissioned behaviour survey of over 1,000 teachers and 1,000 parents. The responses suggest that low-level disruption is likely to be worse in secondary schools than it is in primary schools. Almost three quarters of the secondary teachers polled – 72% – said that low-level disruption had a medium or high impact on learning compared with 62% of primary teachers. Common problems in secondary schools included pupils chatting, disturbing others, not having the correct equipment and using mobile technology inappropriately. Other issues identified were that:
●● 37% of teachers responding said that disruptive chatting occurred in almost every lesson and that many had come to expect some low-level disruption as part of everyday life in the classroom
●● 44% of parents responding said that their children’s learning was adversely affected by the behaviour of others
●● around half of teachers said their school’s behaviour policy was helpful, but only a third said it was being applied consistently throughout the school
●● only a third of teachers said that their headteacher provided them with sufficient support in managing poor behaviour.
12. Below the radar: low-level disruption in the country’s classrooms (140157), Ofsted, September 2014; www.ofsted.gov.uk/resources/below-radar-low-level-disruption-country%E2%80%99s-classrooms.
13. Ibid.

18
Sect
or re
port
201
3/14
: Sch
ools
A broad and balanced curriculum50. Children should enjoy a curriculum that provides a rich variety of
knowledge and experience in school, no matter what their skills and abilities, and regardless of their personal circumstances. For the past few years, the emphasis of Ofsted’s inspection has rightly been on standards in English and mathematics. It is now time to broaden our focus. As our inspections of schools in Birmingham showed this year, it is vitally important that schools offer a broad and balanced curriculum that contributes to the social, moral, spiritual and cultural development of pupils. It is essential to prepare pupils for life in Britain today.14 In addition to reporting on the quality of schools’ curricula in routine inspections, Ofsted will undertake a survey to identify the best examples of a broad and balanced curriculum in England this coming year.
Case study: a balanced curriculum
Keswick School in the North West offers a fantastic wealth of courses, visits and enrichment opportunities.
The curriculum ensures that pupils’ skills and talents are equally encouraged in activities that range from fell running to Russian and creative writing to catering. Any student who has an idea for a course, a club or a school visit is given every encouragement to make their idea become a reality.
The sixth form curriculum is excellent. Sixth formers are particularly well prepared for future employment and higher education through the outstanding programme of study they are given. They take full advantage of the myriad opportunities to take responsibility and consequently make a major contribution to the success of the school.
Poor careers advice is holding young people back51. Success for young people is not only about the examination results they
achieve, but also about learning what they need in order to succeed in the workplace and enjoy fulfilling careers. They need clear, appropriate careers advice that enables them to make informed choices. Good careers advice gives equal status to vocational and academic routes and prepares young people for further learning, employment or self-employment. Since September 2012, schools have been under a duty to secure this independent careers guidance for pupils in Years 9 to 11. In September 2013, this was extended to include pupils in Years 8 to 13. The 16 to 19 study programmes must also be designed to support learners into their planned next step.15
14. Advice note provided on academies and maintained schools in Birmingham to the Secretary of State for Education, Rt Hon Michael Gove MP, as commissioned by letter dated 27 March 2014, Ofsted, June 2014; www.ofsted.gov.uk/resources/advice-note-provided-academies-and-maintained-schools-birmingham-secretary-of-state-for-education-rt.
15. Transforming 16 to 19 education and training: the early implementation of the 16 to 19 study programmes (140129), Ofsted, September 2014; www.ofsted.gov.uk/resources/transforming-16-19-education-and-training-early-implementation-of-16-19-study-programmes.
19
ww
w.o
fste
d.go
v.uk
Enabling all children to succeed
52. Ofsted’s report ‘Going in the right direction’16 found that, in the first year of operation, the new arrangements for careers guidance were not working well in most of the 60 schools we visited. Most secondary schools were not making good quality careers guidance a priority for their students. Careers advice was not of the standard required in three quarters of the schools we surveyed. Schools’ links with employers were weak and too few students had opportunities to learn about a wide range of career pathways. This left able children from deprived backgrounds at a particular disadvantage.
53. Our report urged action by:
●● government to provide clear guidance to schools on what makes an effective strategy, securing independent careers guidance for students and monitoring its impact
●● employers and employer networks to improve their links with schools and provide information about job options
●● the National Careers Service to increase its role in updating careers guidance professionals about the full range of further and higher education and vocational training opportunities
●● local authorities to ensure that vulnerable young people are fully involved in careers guidance activities
●● schools to develop clear strategies for careers guidance that will support students to make informed choices; monitor the destination of students when they leave school; ensure that employers are represented on governing bodies; and ensure that vocational routes, including apprenticeships, are given equal status with academic routes and promote the full range of progression routes in further education and elsewhere.
The quality of education varies between regions54. Variations in the quality of education in different
parts of the country remain an issue. Unless tackled effectively, these will continue to hold our country back. For example, in Yorkshire and Humber, four in 10 secondary schools do not provide a good standard of education. In 2014, GCSE results in the region fell by more than in any other. Pupils in Yorkshire and Humber were less likely to achieve five GCSEs grades A* to C including English and mathematics than those in any other part of the country.
55. Despite the strong performance of primary schools overall, some local authority areas are poorly served. The table on pages 38 to 41 shows the proportion of pupils in each local authority area attending good or outstanding primary and secondary schools. In Medway, Doncaster and Bracknell Forest, fewer than 60% of children attend a good or outstanding primary school. By contrast, local authorities such as Telford and Wrekin, Dudley and South Gloucester show that it is possible to provide much greater proportions of children with a good education in similar circumstances.
56. Children in 13 local authority areas have a less than 50% chance of attending a good or outstanding secondary school. Some of these areas, such as the East Riding of Yorkshire, are improving: it’s a long journey but they have made a positive start towards better quality secondary education in their area. For others, such as Bradford, Stockton-on-Tees, Hartlepool and Oldham, the journey of improvement needs to start now. Local authorities and academy trusts both have their part to play.
16. Going in the right direction? Careers guidance in schools from September 2012 (130114), Ofsted, September 2014; www.ofsted.gov.uk/resources/going-right-direction-careers-guidance-schools-september-2012.

20
Sect
or re
port
201
3/14
: Sch
ools
More good teachers57. For our schools to compete with the best they need highly effective
teachers. Teachers need effective initial training that prepares them well for the classroom. But they also need high quality ongoing professional development and support throughout their careers to enable them to deliver excellent teaching and learning. Schools improve when there are high expectations of teaching staff and when staff and leaders work together to explore how they can improve every aspect of their practice. Our inspection evidence shows that, in schools that have made rapid improvement, leaders have put raising the quality of teaching and learning at the heart of what needs to be done.
Securing a sufficient supply of great teachers58. By 2023 there will be nearly 900,000 more pupils in schools in England.
This rise in numbers is on a scale not seen since the 1960s. Worryingly, the number of new entrants to teacher training has fallen by 16% since 2009/10 and was 7% below target in 2014/15. There were falls in the numbers of new entrants to primary and shortage subjects, including computer science and physics. More encouragingly, the proportion of new entrants into postgraduate teaching programmes who have first- or upper-second-class degrees has risen to 73%.17 There is, however, still some way to go to attract the best mathematics and physics graduates into teaching.
Providing high quality initial teacher education59. Standards of initial teacher education (ITE) in England are high.
Ofsted inspects two types of ITE partnership: higher education institutions (HEIs) and school-centred initial teacher training (SCITTs). Ofsted does not inspect the School Direct training programme for new teachers, although visits to schools involved in School Direct often form part of the inspection of HEIs or SCITTs. At their most recent inspection, 98% of ITE partnerships were judged good or outstanding. ITE provision tends to close if it is found wanting as it does not attract allocated places. This year, only four partnerships, all based in HEIs, were judged as requires improvement compared with 11 in 2012/13. Where our inspections have found that improvements are needed, these are largely to do with:
17. Initial teacher training census for the academic year 2014 to 2015, Department for Education and National College for Teaching and Leadership, November 2014; www.gov.uk/government/statistics/initial-teacher-training-trainee-number-census-2014-to-2015.

21
ww
w.o
fste
d.go
v.uk
More good teachers
●● engaging schools effectively in directing the work of the partnership
●● sharing good practice
●● improving the quality of mentoring and subject-specific feedback for trainees
●● ensuring that trainee teachers are stretched and challenged, with opportunities to spend time in other schools and in schools in disadvantaged areas
●● improving trainees’ use of assessment to tackle low attainment, narrow achievement gaps and stretch the most able pupils.
60. Inspections of ITE now focus on how well trainees are prepared for employment. In June 2014, Ofsted introduced a two-stage approach to these inspections. Stage one looks at the standard of teaching reached by trainees in the summer term near the end of their training. Stage two involves a follow-up visit in the autumn to observe how well those individuals are putting their training into practice, after they have qualified and started their employment. In this way, inspectors can see how well newly trained teachers deal with the realities of teaching and the rigours of the classroom early in their careers. This is a more direct way to assess the quality of the initial training they have received.
Well-trained teachers in the right places61. In many areas of the country there are shortages of the skilled and
committed teaching staff who can help children reach their full potential, especially in mathematics. Shortages are particularly acute in areas that most need the best teachers – disadvantaged areas and neglected areas such as coastal towns. Ofsted has conducted a survey of teacher recruitment in schools18 that has found that less than a third of schools had a good choice of well qualified applicants for all the teaching posts they advertised in 2013/14. Recruitment problems were acute in coastal areas, where more than a quarter of schools we surveyed reported that they struggled to attract applicants for teaching posts. Schools are also having problems recruiting to management positions.
18. Online survey of teacher recruitment in 350 schools conducted in October 2014.

22
Sect
or re
port
201
3/14
: Sch
ools
Figure 8: Teaching schools
London
Plymouth
Southampton
Bristol
Leicester
NottinghamStoke
-on-trent
Wolverhampton
Derby
Coventry
SheffieldLiverpool
Birmingham
Manchester
Bradford Hull
Newcastle Upon TyneSunderland
Leeds
Teaching schools information from the National College for Teaching and Leadership, as at 25 September 2014.Source: National College for Teaching and Leadership
Teaching schools
Key

23
ww
w.o
fste
d.go
v.uk
More good teachers
Figure 9: Distribution of the Index of Multiple Deprivation 2010
10% most deprived
11% to 20%
21% to 30%
31% to 40%
41% to 50%
51% to 60%
61% to 70%
71% to 80%
81% to 90%
91% to 100%
Contains Ordnance Survey data © Crown copyright and database right 2014
Distribution of the index of multiple deprivation 2010
LondonIsles of Scilly0 50 10025 75 Miles
Source: Department for Communities and Local Government
24
Sect
or re
port
201
3/14
: Sch
ools
62. Most newly qualified teachers obtain their first job in schools in the area where they trained, so teachers need to be trained in the areas that need them most to help address recruitment shortfalls in challenging schools. However, the current approach to allocating teacher training places does not always take account of regional needs. Whereas the South East and South West of England have a relatively high number of allocated initial teacher education places compared with the number of schools they have that are in challenging communities, other regions such as the North East and West Midlands are less well served.
63. Teach First is partly addressing this imbalance. Last year, it recruited just fewer than 1,000 secondary trainee teachers.19 This was approximately one trainee for every 1,200 secondary pupils in schools in challenging circumstances. However, these trainees were not distributed proportionately across the regions. In London, there was one Teach First trainee for every 850 secondary pupils in schools in challenging circumstances – which was double the proportion of trainees in the North East and North West. In other regions, including the South East and the East of England, Teach First is at an early stage of development. At the primary level, Teach First is still in its infancy, with only one Teach First trainee for every 8,400 primary pupils in schools in challenging circumstances.
The quality of teaching64. The proportion of teaching that is good or outstanding in primary
schools has risen from 71% in 2012 to 82% in 2014. The rate of improvement has been slower in secondary schools, rising from 68% to 72% over the same period.
65. This year, our inspectors20 have observed several features of good practice in schools that have improved their teaching and learning. We have seen examples of headteachers restructuring leadership roles in their school to free themselves up to focus personally on leading teaching. Most of the secondary schools we reviewed that improved to outstanding this year had teachers with excellent subject knowledge.
19. Over 14,000 training to teach in secondary schools through other routes.
20. Based on an analysis of inspection reports for 20 primary schools and 20 secondary schools that improved at their re-inspection in 2013/14.

25
ww
w.o
fste
d.go
v.uk
More good teachers
66. Schools that improved their quality of teaching and learning have tended to:
●● have high expectations of teaching staff and keep them enthused
●● engage governors in discussions about the effectiveness of teaching
●● ensure that middle leaders are trained in how to support and develop teaching staff
●● make good use of internal expertise and links with other schools to expose their staff to good practice
●● ensure that teachers assess pupils’ abilities accurately
●● put in place rigorous systems for monitoring pupils’ progress and diagnosing how teachers can be supported to improve their practice.
67. Conversely, our inspections have highlighted a number of problems that can hold schools back from making improvements to their teaching and learning. These include:
●● some headteachers passing over to middle leaders the accountability for the quality of teaching and learning, rather than taking the lead themselves
●● inconsistent approaches by those middle leaders to staff development
●● a lack of professional challenge and high quality feedback to staff on the extent of their subject knowledge
●● teachers not knowing their pupils well enough and giving them tasks that are not suitable for their level of ability.
68. In too many secondary schools, these problems have been particularly noticeable in teaching at Key Stage 3, where inspectors have observed a less rigorous approach to monitoring pupils’ progress. The gains that pupils make in primary school in literacy and numeracy are too often not being sustained.
69. The direct involvement of the headteacher as the leader of professional development is also vital in transforming schools.21 The best schools take advantage of their increased freedoms, using flexibility in contracts to set time aside to train and develop staff properly. One school we inspected that improved to outstanding provided two hours of training a week to every member of staff. Some schools organise staff into professional groups to discuss and exchange good practice, including between schools. Leaders target training on the school’s priorities, but also link it to the needs of individuals they have identified through monitoring and their personal targets.
21. Visible learning for teachers: Maximising impact on learning, John Hattie, Routledge, December 2011.

26
Sect
or re
port
201
3/14
: Sch
ools
Leadership makes the differenceAn urgent need for good leaders70. It is encouraging that around one in five schools has outstanding
leadership and management. This is critical at a time when headteachers have more opportunity than ever before to shape and plan the future of their schools. But not all the leaders in our schools are up to the task. There are 3,500 schools in England in which leadership and management have been judged by our inspectors to be less than good. The problem of weak leadership is greater in secondary schools than in primary schools. Twenty three per cent of secondary schools have leadership and management that are inadequate or requires improvement compared with 16% of primary schools. This shortage of good leaders needs to be addressed urgently otherwise improvements in secondary schools will continue to stall.
Geographical gaps71. The need for good leaders is most acute in neglected geographical
areas, including Norfolk, Suffolk and parts of the south coast. These areas have large numbers of challenging schools that need the very best leaders to improve. In 2015 and 2016, Future Leaders will recruit, train and support 100 experienced headteachers of outstanding schools, deploying them in England’s most challenging areas. Teaching Leaders is training talented middle leaders in Norfolk for the first time this year and increasing its presence in other rural and coastal areas across the country. This is a promising start and is in line with Ofsted’s recommendations in ‘Unseen children’, but can fulfil only a small fraction of the total need.
The difference between good and bad leadership72. Our inspectors have observed that good headteachers have a relentless
focus on high standards. They refuse to be distracted from their core purpose of school improvement and they take decisive steps to ensure that their vision is not compromised by weak teaching or poor leadership and management within the school. They communicate their high expectations of staff and pupils effectively and they lead by example, modelling the standards of behaviour they want across their school. Typically, these headteachers are not afraid to take a directed approach when first building the leadership capacity of senior and middle leaders within their school. They also ensure that they have robust management systems to hold staff to account for their leadership and teaching and to track pupils’ progress.

27
ww
w.o
fste
d.go
v.uk
Leadership makes the difference
73. This year, Ofsted studied 114 schools that had declined from good or outstanding to requires improvement or inadequate. The main problem common to these schools was that the headteacher, who in several cases had recently left, had allowed the school to lose focus on quality – schools had simply drifted along and become out of date. Often, they had not kept up with developments in education and were not challenged sufficiently by governors or their senior team. In several schools, a powerful headteacher had resisted external intervention and also restricted the development of promising senior and middle leaders. As a result, processes such as the performance management of teachers were ineffective. In some cases, the wrong headteacher had been appointed, often on internal promotion of a candidate who had little or no recent experience of working in a high quality school elsewhere. In other cases, the governing body had appointed a promising candidate but left them to find their own way without guidance, training or support. Although one in 10 schools sampled had potentially effective middle managers, they were hampered by senior staff and so the leadership of teaching was poor.
Case study: leading from the front
Mayflower Primary School in Harwich, a deprived coastal town with a mainly White British population, was put into special measures in September 2012. A year later it was re-inspected and judged to be outstanding, as ‘an exciting and vibrant place where learning is valued by everyone’. How did the school manage this?
The key to the school’s transformation is leadership. A new headteacher succeeded in transforming the outlook of staff and students. He and a deputy head worked hard to develop teacher skills. They coach all staff, explaining clearly what is good about their work and precisely how to improve it further. They have given more responsibility to middle leaders, which has allowed them to grow as professionals.
Under their leadership, the school does not stop thinking about how it can get even better. Everyone in the school knows that the classroom is the most important place in the school and everything is geared towards what happens there. Every initiative is focused on improving pupils’ achievement to make sure they are ready for the next stage of their education. Teaching assistants, for instance, are trained to make an excellent contribution to all lessons. They use open questions to find out exactly what pupils know and encourage them to think problems through for themselves.
The governors, led by a new chair and buttressed by an additional specialist governor appointed by the local authority, are also highly knowledgeable. They keep every aspect of the school’s work under sharp scrutiny and know precisely when to be supportive and when to be challenging.

28
Sect
or re
port
201
3/14
: Sch
ools
Exceptional leaders look beyond their own school74. Ofsted has come across some exceptional leaders across the country
who go beyond our current definition of outstanding. These leaders have an impact beyond their own school. Not only is their own school outstanding, but they also stake their reputation on helping other schools to improve. In particular, they work with other schools in which there are significant numbers of disadvantaged young people.
75. More of these excellent leaders need to emerge if England’s schools are to become world class.
Case study: outstanding leaders supporting other schools
Heath Park, a secondary academy in the West Midlands, is not only achieving excellent results for its own pupils, but its leaders are supporting other schools in the area to improve. While the school formed a multi-academy trust, which now includes three primary schools, it also became the sponsor for a neighbouring secondary school that was struggling.
In forming the trust, the headteacher took on a combination of new challenges and opportunities, all of which have been of great benefit to the young people in the local community and beyond. The school has supported the rapid improvement of the other secondary school by improving the quality of teaching through supporting teachers in developing their skills, raising achievement for students and developing leadership capacity. This has resulted in a school that was in special measures before joining the trust improving to good at its next inspection.
The relationship with other schools in the trust has also brought added benefits that have contributed to a rapid improvement in the progress made by pupils. Each year, many pupils join the school from a local primary school that is one of the schools in the trust. By working closely with this primary school, curriculum leaders at the sponsor academy have been able to design a Key Stage 3 curriculum that acknowledges what pupils can already do well and builds on this during Year 7. This means no time is wasted when pupils start Year 7 and so they make accelerated progress.
Pupils achieve exceptionally well in this school and make outstanding progress in English and in mathematics.

29
ww
w.o
fste
d.go
v.uk
Leadership makes the difference
Collaboration between schools76. Schools that have started to support others have seen the benefits
that it can bring not just to the school they are supporting, but to their own school, enriching their staff and the quality of teaching. There are examples of schools, particularly primaries, that are now involved in more than one collaboration. Typically, these provide different types of school-to-school support, such as being part of a teaching school alliance, collaborating with a local secondary school or buying business services from another school. These different types of relationship can all benefit schools through sharing of resources and expertise, giving the schools more scope to succeed than would be possible if they worked in isolation.
Case study: the right partnerships can be transformational
Berkeley Primary School, Hounslow, was judged as requires improvement two years ago. Inspectors found that planning was often poor and higher ability pupils were not being challenged. A few months later, inspectors found that the executive headteacher and a new head of school had set a demanding improvement agenda, with a clear emphasis on teacher performance and training.
A strong and effective partnership between the school, the local authority and the executive headteacher’s own secondary academy was critical to success. The local authority and its team of specialist advisers worked effectively with the headteacher. The executive headteacher used experienced staff from his outstanding academy to develop the quality of teaching and leadership skills. And visits to outstanding primary schools helped develop better teaching in the Early Years Foundation Stage.
When the school was re-inspected in June 2014 it was judged outstanding. Inspectors said that the staff development programme based on links to other schools was central to its success.
The best leaders understand inspection77. Engaging in inspection work is an excellent way for practitioners to
develop a keener sense of good practice. In 2013/14, 56% of Ofsted’s inspections were carried out by a team that included at least one current practitioner. From 1 September 2015, we will be changing the way we contract with inspection service providers to deliver our education inspections. These new arrangements will open up opportunities for more practitioners to broaden their leadership skills by becoming Ofsted inspectors.

30
Sect
or re
port
201
3/14
: Sch
ools
The power of good governance78. Our inspection evidence points to the importance of having in place
strong governing bodies that provide effective challenge and support to headteachers. The successful governing bodies we have seen have made sure they have the skills needed to fulfil their strategic and supervisory roles. They are clearly focused on priorities for their school’s improvement. The best governing bodies provide independent challenge to the headteacher effectively – for example through independent analysis of performance data. In schools that have improved to outstanding, governors review performance management arrangements in a systematic way, seeking external views where necessary. As schools become more autonomous than ever, this rigorous approach to assessing the strengths and weaknesses of a school is increasingly important.
79. Schools are less likely to succeed if their governance is poor. This is clear from the results of our study of 114 schools that had declined to be less than good. The governing bodies of almost all those schools had failed to provide strategic leadership or hold the headteacher to account. They relied heavily on the judgement of the headteacher, and the chair of governors often had too close and ‘cosy’ a relationship with the headteacher. When we analysed what had been happening in these schools before their inspection, we found that governors were entirely unaware of problems or had discovered them too late to secure improvement by the time of the inspection. In some cases, this was because the schools’ leaders had not given governors access to the full performance information. In others, it appeared likely to the inspectors that governors had been presented with partial or misleading data. In circumstances like this, it is hard to see how governors can hold schools to account for their performance or fulfil their vital strategic role.
80. Reviews of governance are having a limited impact. Ofsted will sometimes recommend that a school has an external review of its governance in order to improve to good. This year, we recommended this course of action to around 700 schools that we judged to be less than good.
81. Unfortunately, our evidence suggests that these reviews have had varying levels of impact, often taking too long to arrange and not being carried out in a robust way. In about half of these schools, there had been problems with governor recruitment or a lack of training for governors and this had limited the impact of the review. In some cases, schools had refused even to engage with the review’s findings.

31
ww
w.o
fste
d.go
v.uk
Effective challenge and support82. Schools that receive robust external challenge and
support tend to improve and ultimately succeed. The source of this challenge is not necessarily important: our inspectors have seen good examples of effective independent challenge to schools by local authorities, academy sponsors and multi-academy trusts. The key thing is for schools to have strong connections with others around them that they can draw on for support as well as scrutiny. This year, Ofsted has considered what the best MATs and local authorities are doing well to support and challenge their schools. We have also conducted focused inspections of schools in four academy trusts and 10 local authorities and identified some common weaknesses. Half of academies are not part of a MAT and our evidence shows that some academies are not doing enough to build networks with other schools.
Sponsored academies have a sustained impact83. Overall, sponsor-led academies have had a positive
and sustained impact on attainment in challenging areas. The first academies took over tough schools where aspirations were low, the predecessor school had failed and many of the children came from disadvantaged families. Sponsored academies addressed these challenges with new investment, new leaders and a relentless focus on raising standards. As Figure 10 shows, these academies had the greatest impact in the first few years that they were open. In 2012/13 they continued to raise educational standards. However, improvement in those that have been open the longest is beginning to slow as they reach national levels of attainment and results are declining in some individual sponsored academies.
Figure 10: GCSE attainment in sponsor-led academies over time
30
35
40
45
50
55
60
65
201320122011201020092008% o
f pu
pils
att
aini
ng 5
GCS
Es g
rade
s A
* to
Cin
clud
ing
Engl
ish
and
mat
hem
atic
s
2008/09 (47)
2009/10 (64)
2010/11 (63)
2011/12 (42)
National – all schools
Year school established
(number of schools)
2007/08 (30)
Notes: School details based on Edubase at 3 September 2014.Source: Department for Education

32
Sect
or re
port
201
3/14
: Sch
ools
Successful multi-academy trusts and local authorities84. Over half of academies are in MATs and the best
of these are having a positive impact across the country. The size of MATs varies considerably but there are now 11 MATs that have 20 or more schools and 18 that have 10 or more schools. Although GCSE benchmark attainment results in the majority of the larger MATs in 2013 were below the national level of 60.6%, some MATs have been successful in improving results across their schools. Successful MATs include The David Ross Education Trust, The Diocese of Westminster Academy Trust, the Harris Federation and Outwood Grange Academies Trust, all of which had GCSE results that were above the national average in 2013. The Harris Federation is now a well established MAT and has gradually grown to 35 secondary schools. Attainment in Harris’s secondary schools has risen from 68.1% in 2011 to 73.3% in 2013. At 67.6%,
attainment for children eligible for free school meals is well above the national level for both FSM and non-FSM children nationally. GCSE data for 2014 for MATs is not yet publicly available.
85. The best local authorities build networks among schools of all types. They build connections between the strongest and weakest and broker support to tackle underperformance in failing schools. They perform this role while also fulfilling their statutory duty to secure efficient primary and secondary education to meet the needs of the population of their area. Although nationally the proportion of pupils achieving five good GCSEs including English and mathematics in 2013/14 is similar to that seen in 2009/10, 19 local authorities have improved their attainment by at least five percentage points during this period.
0 450 900 1,350 1,800 2,250 2,700 3,150 3,600 4,050 4,500
2014
2013
2012
2011
Academies not in a MAT
Number of schools
Academies in a MAT
Figure 11: Growth in academies over time
Number of open academies is based on extracts from the Edubase database as close to the end of each academic year as possible. For instance, 2014 data is based on Edubase at 3 September 2014. Includes all phases (primary, secondary, special and pupil referral units) and all types of academies (converters, sponsor-led, free schools, university technical colleges, studio schools) so differs from other figures in this report. Excludes a small number of schools who closed since becoming an academy as MAT/non-MAT information is not available for these schools. Information on whether an academy is in a MAT is provided by the Department for Education and is based on their status as at 1 October 2014, which may be different from their status in earlier years.Source: Department for Education
33
ww
w.o
fste
d.go
v.uk
Effective challenge and support
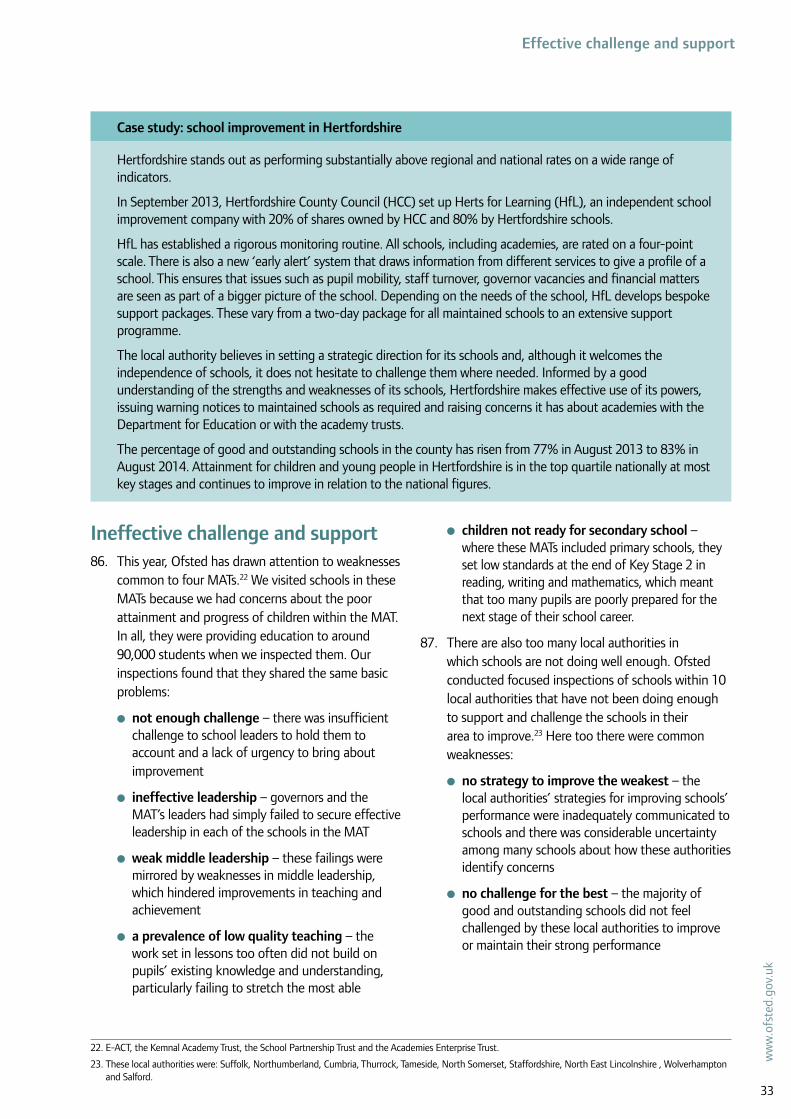
Ineffective challenge and support86. This year, Ofsted has drawn attention to weaknesses
common to four MATs.22 We visited schools in these MATs because we had concerns about the poor attainment and progress of children within the MAT.
In all, they were providing education to around 90,000 students when we inspected them. Our inspections found that they shared the same basic problems:
●● not enough challenge – there was insufficient challenge to school leaders to hold them to account and a lack of urgency to bring about improvement
●● ineffective leadership – governors and the MAT’s leaders had simply failed to secure effective leadership in each of the schools in the MAT
●● weak middle leadership – these failings were mirrored by weaknesses in middle leadership, which hindered improvements in teaching and achievement
●● a prevalence of low quality teaching – the work set in lessons too often did not build on pupils’ existing knowledge and understanding, particularly failing to stretch the most able
●● children not ready for secondary school – where these MATs included primary schools, they set low standards at the end of Key Stage 2 in reading, writing and mathematics, which meant that too many pupils are poorly prepared for the next stage of their school career.
87. There are also too many local authorities in which schools are not doing well enough. Ofsted conducted focused inspections of schools within 10 local authorities that have not been doing enough to support and challenge the schools in their area to improve.23 Here too there were common weaknesses:
●● no strategy to improve the weakest – the local authorities’ strategies for improving schools’ performance were inadequately communicated to schools and there was considerable uncertainty among many schools about how these authorities identify concerns
●● no challenge for the best – the majority of good and outstanding schools did not feel challenged by these local authorities to improve or maintain their strong performance
22. E-ACT, the Kemnal Academy Trust, the School Partnership Trust and the Academies Enterprise Trust.
23. These local authorities were: Suffolk, Northumberland, Cumbria, Thurrock, Tameside, North Somerset, Staffordshire, North East Lincolnshire , Wolverhampton and Salford.
Case study: school improvement in Hertfordshire
Hertfordshire stands out as performing substantially above regional and national rates on a wide range of indicators.
In September 2013, Hertfordshire County Council (HCC) set up Herts for Learning (HfL), an independent school improvement company with 20% of shares owned by HCC and 80% by Hertfordshire schools.
HfL has established a rigorous monitoring routine. All schools, including academies, are rated on a four-point scale. There is also a new ‘early alert’ system that draws information from different services to give a profile of a school. This ensures that issues such as pupil mobility, staff turnover, governor vacancies and financial matters are seen as part of a bigger picture of the school. Depending on the needs of the school, HfL develops bespoke support packages. These vary from a two-day package for all maintained schools to an extensive support programme.
The local authority believes in setting a strategic direction for its schools and, although it welcomes the independence of schools, it does not hesitate to challenge them where needed. Informed by a good understanding of the strengths and weaknesses of its schools, Hertfordshire makes effective use of its powers, issuing warning notices to maintained schools as required and raising concerns it has about academies with the Department for Education or with the academy trusts.
The percentage of good and outstanding schools in the county has risen from 77% in August 2013 to 83% in August 2014. Attainment for children and young people in Hertfordshire is in the top quartile nationally at most key stages and continues to improve in relation to the national figures.

34
Sect
or re
port
201
3/14
: Sch
ools
●● a lack of knowledge and insight – in most of these focused inspections, schools actively raised significant concerns about their local authority’s lack of knowledge about pupils’ attainment and progress across year groups; often, the quality of performance data provided by the local authority was too poor to promote improvement
●● little support for teachers – schools perceived that the move away from centralised local authority provision for continuing professional development meant that there was insufficient support to drive improvements in teaching
●● inconsistent personnel – staff changes in some of the local authorities left some schools unsure about who to contact when they need help.
Too many academies are isolated88. A recent survey by the Department for Education found that 87% of
academies said that they were supporting other schools and for 60% of academies this took the form of formal partnerships.24 This means, however, that some academies are still not reaching out to other schools in their area. Ofsted conducted a survey of 250 academies in summer 2014 in which less than a quarter mentioned partnerships as a significant benefit of conversion and most of those were schools that had joined a MAT. When they inspected requires improvement schools this year, our inspectors found very few cases where school-to-school support had been used, either formally or informally. In contrast, nine out of 10 of these schools had received some form of support from the local authority.
89. Those academies improving most quickly engage outside support to challenge them on standards. Our analysis of academies that experienced a sharp fall in inspection grade last year shows that most had not made any arrangement for external support and challenge until it was too late and serious decline had set in. The academies in question had an overly optimistic view of their current position. For these schools, collaboration was likely to be used as a way to pool resources and save money, rather than as a way of driving up standards. In contrast, many academies that improved their grade from good to outstanding had retained external advisers to inform the debate between headteacher and governors about accurate self-evaluation. This injected a crucial reality check to the conversation.
Clear local oversight of schools is needed90. In an increasingly autonomous school system, it is more important than
ever to ensure that there are sharp, effective accountability arrangements in every local area. This year, the government appointed eight regional schools commissioners and tasked them with holding academies to account. This is encouraging and is in line with Ofsted’s recommendations in ‘Unseen children’ for tackling inequalities in educational attainment across the regions, although the commissioners are being set a challenging task, with relatively few resources of their own. In addition, these arrangements do not embrace maintained schools or further education and skills providers.
24. Do academies make use of their autonomy?, Department for Education, July 2014; www.gov.uk/government/publications/do-academies-make-use-of-their-autonomy

35
ww
w.o
fste
d.go
v.uk
Effective challenge and support
Inspection makes a difference91. As international studies have made clear,25 an effective inspection
framework can make a real difference, but there is always much for Ofsted to do to accommodate a fast-evolving education landscape while maintaining rigour.
92. To that end, we have made substantial changes to our inspection regime over the past few years. We have slimmed down the inspection framework to focus on priority areas and we have introduced the ‘requires improvement’ grade. This has been challenging, but, on the whole, schools have responded well. Two thirds of the 549 schools that were judged as requires improvement and were part of the support programme improved to good or outstanding on re-inspection this year. This is a higher conversion rate than for the previously ‘satisfactory’ schools that were not part of the programme. Only half of those schools improved at re-inspection this year.
93. This year, almost 4,900 schools told us about the impact of their inspection. Ninety per cent of schools agreed that their inspection judgements were fair and accurate, along with 97% agreeing that the recommendations provided for improvement were clear. Nearly all schools (97%) indicated that they would use the recommendations from the inspection to move the quality of their school and teaching forward. Schools were also happy with the engagement of pupils in the inspection process, with 97% satisfied that the views of pupils were explored. Four out of five schools agreed that the benefits of the inspection outweighed the negative aspects.
94. Ofsted already uses current practitioners on over half of our inspections, which allows us to benefit from greater expertise and to be more responsive to the challenges that schools and colleges face. From next year, inspection will no longer be outsourced but will be contracted directly by Ofsted. This will provide us with further opportunities to involve current practitioners in inspection.
95. We also recognised that, to be more effective and respond to local conditions, we needed to gather local intelligence of standards across the country, hence the introduction of the new Ofsted regional structure two years ago. The eight regional directorates enable inspectors to get to know their local area more thoroughly, allowing them to focus on regional weaknesses and to tackle local issues.
25. Review and synthesis of evidence on the (mechanisms of) impact of school inspections, R. Nelson and M. Ehren, February 2014; http://schoolinspections.eu/wp-content/uploads/downloads/2014/02/Review-and-synthesis-of-evidence-on-the-mechanisms-of-impact-of-school-inspections.pdf.

36
Sect
or re
port
201
3/14
: Sch
ools
Key statisticsOverall effectiveness of open maintained schools and academies at their most recent inspection as at 31 August 2014, by phase and type
Total number
inspected
Percentage of providers
Outstanding
Good
Requires improvement
Inadequate
Nursery schools 413 57 39 4 0
Primary schools (total) 16,266 17 64 16 2
Of which local authority maintained 14,640 16 65 17 2
academy converters 1,416 30 59 10 1
sponsor-led academies 175 7 47 37 9
free schools 35 20 49 29 3
Secondary schools (total) 3,150 21 49 23 6
Of which local authority maintained 1,383 13 51 29 8
city technology colleges 3 67 33 0 0
academy converters 1,338 33 52 13 2
sponsor-led academies 381 13 38 35 15
free schools 34 24 41 26 9
university technical colleges 5 0 40 40 20
studio schools 6 17 50 33 0
Special schools (total) 1,018 36 54 8 2
Of which local authority maintained 843 34 55 9 2
non-maintained special schools 69 33 57 9 1
academy converters 98 53 39 6 2
sponsor-led academies 5 0 40 20 40
free schools 3 33 67 0 0
Pupil referral unit (total) 350 14 69 13 4
Of which local authority maintained 324 13 69 13 4
academy converters 22 23 68 5 5
free schools 4 50 50 0 0
All provision 21,197 20 61 17 3
Percentages are rounded and do not always add to exactly 100.Includes section 5 inspections and section 8 deemed section 5 inspections.School details based on Edubase at 3 September 2014.Includes inspections that took place by 31 August 2014 and were published by 6 October 2014.These statistics exclude three schools which were inspected during the academic year but where the inspection report had not been published by 6 October 2014. For these schools, the previous inspection is included.Source: Ofsted

37
ww
w.o
fste
d.go
v.uk
Key statistics
Overall effectiveness of maintained schools and academies inspected between 1 September 2013 and 31 August 2014, by phase and type
Total number
inspected
Percentage of providers
Outstanding
Good
Requires improvement
Inadequate
Nursery schools 120 52 42 6 1
Primary schools (total) 4,823 7 57 31 5
Of which local authority maintained 4,469 6 57 32 5
academy converters 166 17 61 17 5
sponsor-led academies 169 8 47 36 9
free schools 19 16 37 42 5
Secondary schools (total) 1,048 11 40 36 14
Of which local authority maintained 545 7 39 41 14
city technology colleges 1 0 100 0 0
academy converters 307 18 50 24 8
sponsor-led academies 159 7 23 45 25
free schools 27 30 37 22 11
university technical colleges 4 0 50 25 25
studio schools 5 20 60 20 0
Special schools (total) 353 30 54 12 3
Of which local authority maintained 312 30 54 13 3
non-maintained special schools 23 35 57 9 0
academy converters 12 42 42 8 8
sponsor-led academies 3 0 33 0 67
free schools 3 33 67 0 0
Pupil referral unit (total) 125 12 60 21 7
Of which local authority maintained 120 10 61 22 8
academy converters 1 100 0 0 0
free schools 4 50 50 0 0
All provision 6,469 9 54 30 7
Percentages are rounded and do not always add to exactly 100.Includes section 5 inspections and section 8 deemed section 5 inspections.School details based on Edubase at 3 September 2014.Includes inspections that took place between 1 September 2013 and 31 August 2014 and were published by 6 October 2014.These statistics exclude three schools which were inspected during the academic year but where the inspection report had not been published by 6 October 2014. Source: Ofsted

38
Sect
or re
port
201
3/14
: Sch
ools
Primary schools
Local authority (education)2014
%
Change from 2013
(%pts)
Camden 98 4
North Tyneside 98 10
Newcastle upon Tyne 96 4
Wandsworth 96 2
Trafford 96 3
Bedford 95 -1
Kensington and Chelsea 94 15
Richmond upon Thames 94 0
South Tyneside 93 18
Gateshead 93 8
Stockport 93 6
Cheshire East 92 2
Gloucestershire 92 6
Sutton 92 -3
Darlington 91 -6
Barnet 91 2
Westminster 91 12
Stockton-on-Tees 91 7
Tower Hamlets 91 4
Hackney 91 6
Ealing 90 1
Islington 90 1
Northumberland 90 3
Hartlepool 89 4
Central Bedfordshire 89 4
St. Helens 89 0
Durham 89 6
Worcestershire 89 6
Lewisham 89 0
Wigan 88 5
Sefton 88 -6
Calderdale 88 7
Wirral 88 3
Manchester 88 7
Waltham Forest 87 10
Cumbria 87 4
Somerset 87 7
Kingston upon Thames 87 8
Lambeth 87 -3
Greenwich 87 5
Brent 87 11
Lancashire 87 6
Primary schools
Local authority (education)2014
%
Change from 2013
(%pts)
Bolton 87 1
Poole 87 -1
Sunderland 86 3
Cheshire West and Chester 86 5
Devon 86 1
York 86 10
Harrow 86 -5
Southwark 86 0
Halton 86 6
Lincolnshire 86 5
Cornwall 86 6
Liverpool 86 1
Haringey 86 1
Newham 85 -2
Hammersmith and Fulham 85 -4
Knowsley 85 -3
Leeds 85 2
Buckinghamshire 84 3
Hertfordshire 84 7
Bury 84 4
Solihull 84 1
Southampton 84 3
Salford 84 9
Dudley 84 12
Warrington 84 5
Leicestershire 83 3
Herefordshire 83 11
Rochdale 83 0
Nottinghamshire 83 3
Redbridge 83 10
Blackburn with Darwen 83 1
Hampshire 82 -2
Milton Keynes 82 2
Wiltshire 82 -1
South Gloucestershire 82 -1
Sandwell 82 0
Middlesbrough 81 1
Hillingdon 81 3
Bromley 81 6
Shropshire 81 7
Oxfordshire 81 8
Bath and North East Somerset 81 6
Percentage of pupils attending good or outstanding primary schools

39
ww
w.o
fste
d.go
v.uk
Key statistics
Primary schools
Local authority (education)2014
%
Change from 2013
(%pts)
Telford and Wrekin 81 7
Swindon 81 0
Dorset 81 -9
City of Bristol 81 -2
Blackpool 81 5
Redcar and Cleveland 81 0
Rutland 80 7
Havering 80 0
Oldham 80 3
Tameside 80 8
Birmingham 80 1
Torbay 80 -5
Bexley 80 -3
Peterborough 80 20
Brighton and Hove 79 -1
Barnsley 79 2
City of Kingston upon Hull 79 9
North Somerset 79 5
Warwickshire 78 5
North Yorkshire 78 4
Derbyshire 78 6
Windsor and Maidenhead 78 -17
Staffordshire 77 6
Plymouth 77 -8
Enfield 77 4
Luton 76 6
Bournemouth 76 4
West Sussex 76 0
Merton 76 -6
Surrey 76 1
Cambridgeshire 76 9
Croydon 75 3
Wokingham 75 -2
Nottingham 75 1
North Lincolnshire 74 -1
Kirklees 74 -2
Coventry 74 10
Reading 74 2
Thurrock 74 14
Essex 74 4
Rotherham 73 3
Wakefield 73 11
Primary schools
Local authority (education)2014
%
Change from 2013
(%pts)
Southend-on-Sea 73 13
Bradford 73 -8
Derby 73 4
Northamptonshire 72 3
Kent 71 4
East Riding of Yorkshire 71 4
Suffolk 71 5
Norfolk 71 8
Isle of Wight 71 0
Leicester 70 -5
Sheffield 70 1
Portsmouth 70 3
Hounslow 69 -7
West Berkshire 69 -8
Barking and Dagenham 68 6
Walsall 68 8
North East Lincolnshire 68 1
Stoke-on-Trent 68 -3
Slough 68 -1
Wolverhampton 68 11
East Sussex 62 -6
Bracknell Forest 59 -7
Doncaster 58 -3
Medway 53 -6
Includes section 5 inspections and section 8 deemed section 5 inspections. Includes inspections that took place by 31 August 2014 and were published by 6 October 2014.Source: Ofsted and Department for Education.

40
Sect
or re
port
201
3/14
: Sch
ools
Secondary schools
Local authority (education)2014
%
Change from 2013
(%pts)
Haringey 100 2
Hounslow 100 0
Islington 100 0
Kensington and Chelsea 100 0
Rutland 100 0
Westminster 100 0
Wokingham 99 8
Hackney 98 -1
Bath and North East Somerset 96 -4
Southwark 96 1
Harrow 94 1
Wandsworth 94 1
Tower Hamlets 94 -6
Surrey 93 3
North Somerset 93 5
Bromley 93 4
Thurrock 93 1
York 93 2
Lambeth 92 17
Bury 91 -3
Trafford 91 1
South Tyneside 91 1
Rotherham 91 20
Greenwich 90 16
Barnet 90 -8
Telford and Wrekin 89 0
Newham 89 11
Leicester 88 -1
Wiltshire 88 7
North Tyneside 88 17
Durham 88 2
Poole 87 0
Sutton 87 -7
Derby 86 13
Merton 86 16
Oxfordshire 86 -2
Rochdale 85 12
Slough 85 1
Kent 85 4
Redbridge 85 -2
Medway 84 -5
East Sussex 84 0
Cornwall 84 2
Secondary schools
Local authority (education)2014
%
Change from 2013
(%pts)
Dorset 84 -2
Newcastle upon Tyne 84 9
Enfield 83 -3
Worcestershire 83 2
Herefordshire 83 -6
Luton 83 -1
Bournemouth 83 30
Camden 83 -17
Stockport 82 10
Wakefield 82 21
Kingston upon Thames 82 -1
Hammersmith and Fulham 81 -19
Nottinghamshire 81 1
Lancashire 81 4
Plymouth 81 9
Solihull 80 0
Brighton and Hove 80 -8
Warwickshire 80 10
Hertfordshire 79 5
Devon 79 3
West Berkshire 79 24
Cheshire West and Chester 78 -4
Cheshire East 78 1
Wigan 77 -3
Liverpool 77 -4
Halton 77 20
Richmond upon Thames 77 -10
Lincolnshire 77 -1
Bedford 77 -2
Knowsley 77 26
North Yorkshire 76 2
Hillingdon 76 -5
Somerset 76 9
Southampton 75 10
Shropshire 75 1
Milton Keynes 75 3
Hampshire 75 -4
Ealing 75 1
Gateshead 74 -4
Barking and Dagenham 74 -16
Essex 74 2
Suffolk 74 1
Percentage of pupils attending good or outstanding secondary schools

41
ww
w.o
fste
d.go
v.uk
Key statistics
Secondary schools
Local authority (education)2014
%
Change from 2013
(%pts)
Croydon 74 5
Leeds 74 4
Birmingham 73 -5
Bexley 73 -13
Bracknell Forest 73 16
Leicestershire 73 0
Central Bedfordshire 72 16
Waltham Forest 72 -19
Buckinghamshire 72 -5
Calderdale 72 -8
Sunderland 72 9
Staffordshire 72 4
City of Bristol 71 -1
Gloucestershire 71 6
North Lincolnshire 70 -14
Kirklees 70 -11
West Sussex 69 -2
Southend-on-Sea 69 1
Wirral 69 -2
Cumbria 68 5
Blackburn with Darwen 68 0
Warrington 68 -8
Peterborough 68 14
Wolverhampton 67 -4
Lewisham 67 -10
Reading 66 1
Coventry 66 -22
Havering 66 -7
Northumberland 66 -1
Northamptonshire 66 1
Manchester 64 2
Bolton 64 -5
Norfolk 63 1
Brent 63 -23
Windsor and Maidenhead 60 -1
Salford 59 12
Torbay 59 -20
Walsall 57 -20
Sheffield 57 -1
Nottingham 57 -18
Cambridgeshire 56 -23
City of Kingston upon Hull 55 0
Secondary schools
Local authority (education)2014
%
Change from 2013
(%pts)
Sefton 55 -1
Dudley 55 0
North East Lincolnshire 54 13
Darlington 54 -20
Portsmouth 53 0
Sandwell 53 -21
Stoke-on-Trent 52 18
Redcar and Cleveland 52 -8
South Gloucestershire 51 -13
Swindon 50 0
Tameside 49 3
Middlesbrough 48 6
Barnsley 48 25
East Riding of Yorkshire 46 8
Stockton-on-Tees 46 -16
Derbyshire 42 -13
Bradford 40 -8
Blackpool 38 -8
Doncaster 37 -6
Oldham 36 -21
St. Helens 35 -12
Hartlepool 35 0
Isle of Wight 17 3
Includes section 5 inspections and section 8 deemed section 5 inspections. Includes inspections that took place by 31 August 2014 and were published by 6 October 2014.Source: Ofsted and Department for Education

The Office for Standards in Education, Children’s Services and Skills (Ofsted) regulates and inspects to achieve excellence in the care of children and young people, and in education and skills for learners of all ages. It regulates and inspects childcare and children’s social care, and inspects the Children and Family Court Advisory Support Service (Cafcass), schools, colleges, initial teacher training, work-based learning and skills training, adult and community learning, and education and training in prisons and other secure establishments. It assesses council children’s services, and inspects services for looked after children, safeguarding and child protection.
If you would like a copy of this document in a different format, such as large print or Braille, please telephone 0300 123 1231, or email [email protected].
You may reuse this information (not including logos) free of charge in any format or medium, under the terms of the Open Government Licence. To view this licence, visit www.nationalarchives.gov.uk/doc/open-government-licence/, write to the Information Policy Team, The National Archives, Kew, London TW9 4DU, or email: [email protected].
This publication is available at www.ofsted.gov.uk/resources/140178.
To receive regular email alerts about new publications, including survey reports and school inspection reports, please visit our website and go to ‘Subscribe’.
Piccadilly Gate Store Street Manchester M1 2WD
T: 0300 123 1231 Textphone: 0161 618 8524 E: [email protected] W: www.ofsted.gov.uk
No. 140178
© Crown copyright 2014