Embed Size (px)
Citation preview

Schouw & Co.2015 first halfInvestor presentation
AUGUST/SEPTEMBER 2015
CEO JENS BJERG SØRENSENIR KASPER OKKELS

2015 H1 at a glance: Continued progress
revenue
5.9bnGrowth 16% // 2014H1: 5.1bnImpact from volatile raw material prices
EBIT
303m26% growth from 2014H1Positive effect from forex and raw materials
cash flow from operations
224m2014H1: 243mUnsatisfactory increase in NWC in BioMar
NIBD/EBITDA
0.1xSmall increase in NIBD y/yVery strong and solid financial position
profit from associates and JVs
47m2014H1: -7mNo PPA effect in Kramp, Xergi 8% EBIT
return on invested capital
17.0%ROIC incl. goodwill 14.1%Progress in all companies except BioMar
31.08.2015Interim Report 2015H1 2

200
220
240
260
280
300
320
340
360
380
Jan Mar May Jul Sep Nov Jan Mar May Jul
Schouw & Co. share price
C20 CAP indexed to Schouw & Co.
MidCap indexed to Schouw & Co.
2014 2015
Key figures
Revenue and income 2015H1 2014H1 2014FY
Revenue 5,888 5,064 11,784
EBITDA 494 415 1,070
- margin 8.4% 8.2% 9.1%
EBIT 303 239 708
- margin 5.1% 4.7% 6.0%
Profit after tax in associates and JVs 47 -7 28
Cash flows 2015H1 2014H1 2014FY
Cash flows from operating activities 224 243 628
Cash flows from investing activities -184 -81 -355
Of which investment in PPE -165 -95 -233
Cash flows from financing activities -116 56 -563
Invested capital and financing 2015H1 2014H1 2014FY
Working capital 2,013 1,541 1,775
Net interest bearing debt (NIBD) 134 24 44
Total equity 6,366 5,740 6,074
ROIC excl. goodwill 17.0% 18.1% 16.9%
ROIC incl. goodwill 14.1% 15.0% 14.0%
NIBD/EBITDA 0.1 0.0 0.0
30%increase in share price
in 2014
31.08.2015Interim Report 2015H1 3
21%increase in share price
in ’15H1

BioMar
Volume flat compared to 2014H1 Same total y/y volume in both Q1 and Q2 21% revenue increase due to higher raw material prices Increase in Norwegian volumes (final deliveries, contract base) Decrease in Chilean volumes (declining market, smaller fish, early harvest) Continental Europe on par despite challenges in Greece
Chile remains the key challenge Entire farming industry in financial difficulties Debtor management increasingly important Lower market share but no loss of customers Chile main reason to surge in NWC (forex, payment terms, inventory, etc.) Market volume expected to decline in next quarters
Maintaining 2015 outlook Contract base in Norway as expected (volumes and margins) Debtor risk and low volumes in Americas but positive
effect from USD exchange rate Greece seems towards a sustainable solution No effect from Chinese JV with Tongwei (but good progress) Outlook raised after Q1 following a strong first quarter
31.08.2015Interim Report 2015H1 4
RevenueLTM
EBITLTM
GuidanceRevenue 2014 8,4517m
org. 2015 ~8.5bnafter Q1 2015 ~9.0bn
EBIT 2014 434morg. 2015 360-410m
after Q1 2015 375-425m

BioMar 2015-H1 financials31.08.2015Interim Report 2015H1 5
Q2 YTDLTM 2014
2015 2014 D 2015 2014 D
Revenue 2,230 1,837 21% 4,139 3,430 21% 9,161 8,451
EBITDA 115 114 1% 201 183 10% 592 574
EBITDA% 5.1% 6.2% -17% 4.9% 5.3% -9% 6.5% 6.8%
EBIT 78 79 -1% 127 112 13% 449 434
EBIT% 3.5% 4.3% -18% 3.1% 3.3% -6% 4.9% 5.1%
Profit before tax 69 73 -5% 120 102 18% 417 398
Cash Flow from operations -96 148 NA -101 84 NA 81 266
Equity 1,929 1,665 16% 1,902
- in % of total assets 36.9% 36.4% 1% 39.3%
Inv. Capital (ex goodwill) 2,219 1,784 24% 1,931
- ROIC 21.8% 24.4% -10% 22.9%
Net Working Capital 1,260 802 57% 983
- in % of LTM revenue 13.8% 9.2% 49% 11.6%
NIBD 686 539 27% 386
- times LTM EBIDTA 1.2x 0.9x 26% 0.7x

Fibertex Personal Care
Small decline in revenue and volume Volume growth in Denmark but decline in Malaysia Lower raw material prices affects revenue negatively Positive effect from consolidation of Innowo Print Strong cash flow from operations of DKK 220m (2014H1: 100m) ROIC of 15.8% following significant lowering of NWC
Volatile raw material prices Pass-through mechanisms with some months lag About DKK +30m EBIT effect in Q1, about DKK -25m in Q2, minor effect expected in Q3 PP prices seems to have stabilized
Innovation and value-add Starting up print production in Malaysia Ongoing innovation in softer, lighter and loftier products Growing with Japanese premium diaper manufactures
Narrowing EBIT guidance Raising lower end of interval High capacity utilisation required Industry remains dynamic
31.08.2015Interim Report 2015H1 6
RevenueLTM
EBITLTM
GuidanceRevenue 2014 1,787m
2015 ~1.7bnEBIT 2014 171m
org. 2015 160-180mnew 2015 170-180m

Fibertex Personal Care 2015-H1 financials
Q2 YTDLTM 2014
2015 2014 D 2015 2014 D
Revenue 404 421 -4% 832 847 -2% 1,772 1,787
EBITDA 70 66 5% 169 136 24% 340 308
EBITDA% 17.3% 15.8% 10% 20.3% 16.1% 26% 19.2% 17.2%
EBIT 34 34 0% 98 73 35% 197 171
EBIT% 8.5% 8.1% 4% 11.8% 8.6% 37% 11.1% 9.6%
Profit before tax 29 31 -4% 94 64 46% 199 169
Cash Flow from operations 129 29 347% 220 100 119% 345 226
Equity 738 630 17% 730
- in % of total assets 41.6% 36.0% 16% 38.8%
Inv. Capital (ex goodwill) 1,225 1,195 3% 1,336
- ROIC 15.8% 12.9% 23% 14.4%
Net Working Capital 225 268 -16% 293
- in % of LTM revenue 12.7% 16.8% -24% 16.4%
NIBD 560 646 -13% 688
- times LTM EBIDTA 1.6x 2.3x -29% 2.2x
31.08.2015Interim Report 2015H1 7

Fibertex Nonwovens
Another strong quarter Growth in auto and high-value segments Substantial progress in EBIT and gross margin Effect from acquisitions, forex, scale and transformed business model One-off gain of DKK 3m following acquisition of shares in South Africa
Consolidating strong international position State-of-the-art equipment at all sites US platform contributes positively Significant long-term potential in South Africa Promising product development pipeline Proven strong ability to drive industry consolidation
2015 guidance raised for the 2nd time Effect from strong H1 (H2 always low season) Still challenges from upgrades and installation of new line Consolidation of South Africa (negative EBIT in 2015) Uncertainty about raw material prices
31.08.2015Interim Report 2015H1 8
RevenueLTM
EBITLTM
GuidanceRevenue 2014 1,048m
2015 ~1.2bnEBIT 2014 62m
org. 2015 65-75mafter Q1 2015 70-80m
new 2015 75-85m

Fibertex Nonwovens 2015-H1 financials
Q2 YTDLTM 2014
2015 2014 D 2015 2014 D
Revenue 328 267 23% 634 539 18% 1,143 1,048
EBITDA 44 31 40% 89 64 38% 153 128
EBITDA% 13.4% 11.8% 14% 14.1% 12.0% 18% 13.4% 12.2%
EBIT 25 16 59% 52 33 58% 81 62
EBIT% 7.6% 5.9% 29% 8.2% 6.1% 34% 7.1% 5.9%
Profit before tax 22 13 76% 45 27 70% 69 50
Cash Flow from operations 23 32 -29% 51 51 0% 82 82
Equity 463 331 40% 385
- in % of total assets 33.0% 33.8% -2% 32.7%
Inv. Capital (ex goodwill) 1,034 730 42% 874
- ROIC 9.4% 7.1% 33% 8.4%
Net Working Capital 349 283 23% 319
- in % of LTM revenue 30.5% 28.5% 7% 30.4%
NIBD 593 409 45% 522
- times LTM EBIDTA 3.9x 3.6x 8% 4.1x
31.08.2015Interim Report 2015H1 9
Hydra-Grene
Strong H1 and high activity in wind ~45% of revenue comes from wind segment
Very strong wind sales to USA
Significant effect from good utilisation of capacity
Danish OEM market on par with 2014H1
Offshore oil/gas remains small compared to OEM and Wind
Business development Increasingly complex products and system solutions
Investments required to build strong offshore segment
New ERP system implemented and running
Looking to strengthen growth platform
Better outlook for 2015 Better than expected/awarded sales to wind
Increased competition in all segments
Plunging sales to agricultural sector
31.08.2015Interim Report 2015H1 10
RevenueLTM
EBITLTM
GuidanceRevenue 2014 566m
org. 2015 ~500mnew 2015 ~550m
EBIT 2014 60morg. 2015 45-55mnew 2015 50-60m

Hydra-Grene 2015-H1 financials
Q2 YTDLTM 2014
2015 2014 D 2015 2014 D
Revenue 151 147 2% 299 281 7% 584 566
EBITDA 23 22 4% 43 41 5% 80 78
EBITDA% 15.2% 14.9% 2% 14.2% 14.5% -2% 13.7% 13.8%
EBIT 19 18 9% 35 32 11% 64 60
EBIT% 12.6% 11.9% 6% 11.8% 11.3% 5% 10.9% 10.6%
Profit before tax 17 17 2% 36 30 18% 67 61
Cash Flow from operations -5 -12 -59% 40 10 285% 89 60
Equity 176 164 8% 188
- in % of total assets 44.3% 39.0% 14% 48.0%
Inv. Capital (ex goodwill) 289 309 -6% 292
- ROIC 23.8% 22.3% 7% 22.6%
Net Working Capital 188 195 -3% 187
- in % of LTM revenue 32.2% 37.1% -13% 33.1%
NIBD 101 145 -30% 96
- times LTM EBIDTA 1.3x 1.9x -34% 1.2x
31.08.2015Interim Report 2015H1 11

Kramp
Strong development in H1 Revenue up 4.6% and EBIT 17% driven by the big markets in PL, FR, NL
EBIT margin of 11.7% in Q2
Robust business model: high share of wearables and repair parts
Agro customers facing difficulties in selected markets
Harvesting the merger synergies Integration of Grene and Kramp progresses as planned
Expected level of synergies confirmed so far
Investments in IT required as expected
Maintaining 2015 outlook Full effect in Schouw & Co. P/L as PPA depreciations are eliminated
Disclosed 2017 revenue target of EUR 1bn requires M&Abut 13% EBITDA target remains intact
31.08.2015Interim Report 2015H1 12
GuidanceRevenue 2014 4,905m
2015 ~5.25bnEBIT 2014 405m
2015 425-450m
New warehouse in Poland
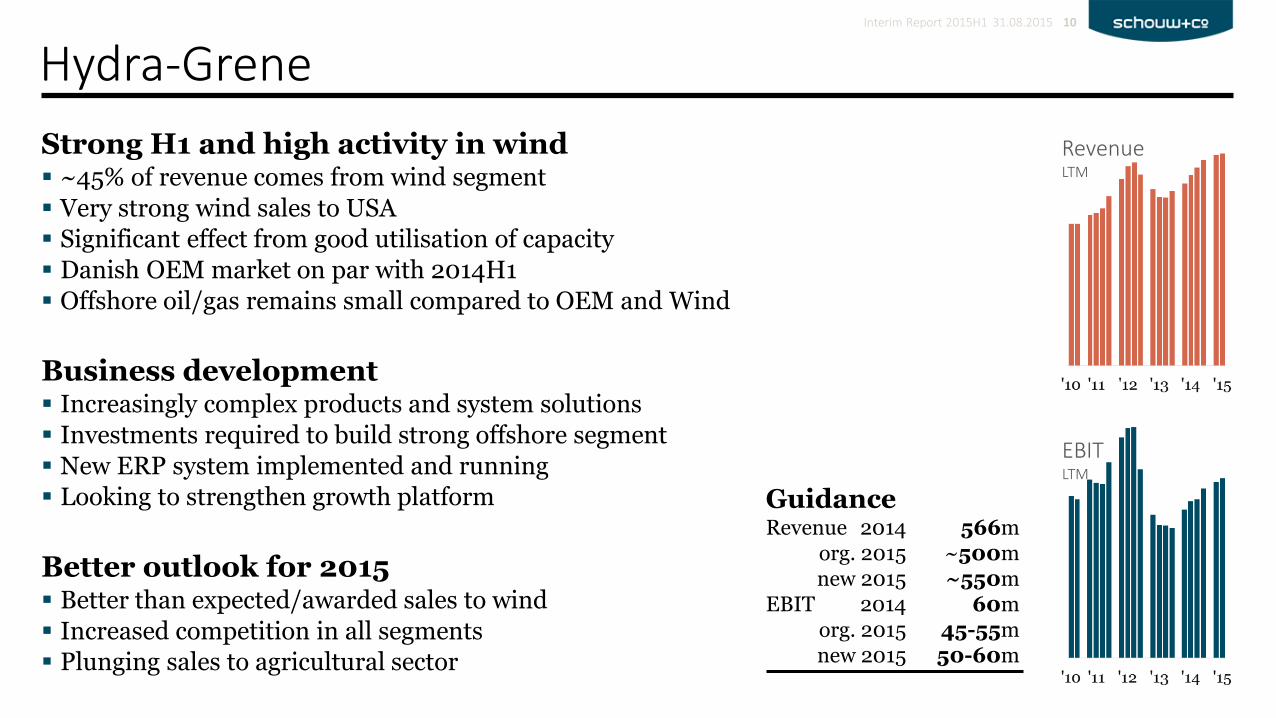
Kramp 2015-H1 financials
Q2 YTDLTM 2014
2015 2014 D 2015 2014 D
Revenue 1,439 1,360 6% 2,693 2,576 5% 5,023 4,905
EBITDA 201 179 13% 345 287 16% 576 529
EBITDA% 14.0% 13.1% 6% 12.8% 11.5% 11% 11.5% 10.8%
EBIT 169 150 12% 281 241 17% 445 405
EBIT% 11.7% 11.0% 6% 10.4% 9.3% 12% 8.9% 8.3%
Profit before tax 157 138 14% 261 212 23% 395 346
Equity 1,267 1,214 4% 1,063
- in % of total assets 39.2% 40.6% -3% 38.1%
Inv. Capital (ex goodwill) 2,578 2,479 4% 2,434
- ROIC 17.6% 17.5% 0% 16.6%
Net Working Capital 1,544 1,511 2% 1,434
- in % of LTM revenue 30.7% 31.6% -3% 29.2%
NIBD 1,311 1,265 4% 1,371
- times LTM EBIDTA 2.3x 2.4x -7% 2.6x
31.08.2015Interim Report 2015H1 13

Other activities
Xergi Significant progress in 2015
Revenue up to DKK 235m (2014H1: 86m)
EBIT margin about 8% (2014H1: loss)
Maintaining high activity level also in 2015
Effect from many years of investing in technology and markets as well as strong Danish market
Unchanged good prospects for biogas
Focus on international markets
Incuba Invest Small profit (as in 2014H1)
Properties HQ at Chr. Filtenborgs Plads in Aarhus
Two factories in Frederikshavn (Martin Prof.)
Small property in Aarhus rented to former Grene Industri service
31.08.2015Interim Report 2015H1 14

2015 guidance
REVENUE DKK million
2015 F
after Q2
2015 F
original
2014
actual
BioMar c. 9,000 c. 8,500 8,451
Fibertex Personal Care c. 1,700 c. 1,700 1,787
Fibertex Nonwovens c. 1,200 c. 1,200 1,048
Hydra-Grene c. 550 above 500 566
Other/eliminations - - -68
Total revenue c. 12.5bn c. 12bn 11,784
Kramp (100%) c. 5,250 c. 5,250 4,905
EBIT DKK million
2015 F
after Q2
2015 F
original
2014
actual
BioMar 375-425 360-410 434
Fibertex Personal Care 170-180 160-180 171
Fibertex Nonwovens 75-85 65-75 62
Hydra-Grene 50-60 45-55 60
Other c. -20 c. -20 -20
Total EBIT 650-730 610-700 708
Associates etc. 65-75 60-70 28
Financial items, net c. -10 c. -35 -35
Profit before tax 705-795 635-735 701
Kramp EBIT (100%) 425-450 425-450 405
31.08.2015Interim Report 2015H1 15
Upwards adjusted after Q1Upwards adjusted after Q2

Strategic goals31.08.2015Interim Report 2015H1 16
Growth Substantial growth every year
Profit Benchmark level profitability
Return ROIC > 15%, but dependent on level of risk
Leverage Comfort zone for NIBD is 1-2 times EBITDA
Payout Constant/increasing dividends and share buybacks
Portfolio A ’handful’ of big and strong businesses

AppendixSelected introductory presentation material

Merger
Grene/Kramp
Merger
NEG/Vestas
M&A activity31.08.2015Interim Report 2015H1 18
MartinEV: 500m60+40%
2000 2002 2004 2006 2008 2010 2012 2014
SchulstadEV: 2.700m
62%
FibertexEV: 660m
100%
ProvimiEV: 675m
100% (BioMar)
TharreauEV: 300m
100% (FIN)
ElopakEV: 1.200m
50%
SjøtrollEV: 1.200m
51%
Hydro-power
MartinEV: 900m
100%
Merger
Xergi
BioMarEV: 1.800m68%+32%
GreneIndustri-service
NWSEV: 150m
100% (FIN)
InnowoEV: 100m85% (FPC)
Bigger and stronger portfolio
Bigger and stronger businesses in the portfolio
Consolidating theconglomerate
Deal flow is not a target
Acquisitions and mergerspart of consolidation
and to create bigger and stronger businesses
Divestments due to no longer being best owner
Fibertex South Africa+48% (FIN)

The Schouw agenda31.08.2015Interim Report 2015H1 19
Develop big and strong businesses
Leading companies do perform better
Expand in growth markets
A global outlook is key
Constantly increase capacity
Balancing profit and growth
Maintain focus on innovation
Secure #1 positions
Think long-term
Ensuring high return on capital
Attract talent
“Results are created through people”

Conglomerate value creation31.08.2015Interim Report 2015H1 20
FOCUSED OPERATIONS TRANSFORMATION
STRUCTURE AND DEVELOP OPTIMIZE OWNERSHIP
Delivering solid performance and growthTight/optimal capital allocationOngoing efficiencyEnsure innovation
Structural and strategic initiativesDevelopment of products and servicesGeographical expansionBolt-on acquisitions
Attractive acquisitionsLong-term planningAdd Schouw DNASecure leading positions
Necessary exits with good timingParticipate in value-added consolidationsConsider mergers, JVs, minority stakesValue-creating ownership structures
minimum as benchmark ambitious plans
risk and span of control best owner philosophy
Bu
sin
ess
leve
lG
rou
p le
vel

2005Acquisition of BioMar
2007Acquisition of Provimi
2012JV in
Costa Rica
2014JV in
Turkey
2011Expansion
in Myre
2002Acquisition of Fibertex
2003 Green-field in
Malaysia
2011 Acquisitionin France
EUR +300minvestments
in cap.
2004 Acquisition
in Czech
2011 FPC and FIN
demerger
1988Acquisition
of Grene
~1990Internatio-nalisation
2009 Grene/Hydra
demerger
2010 Hydra in China
and India
~1995 A strong focus
on industry
2015-Growth andacquisitions
2013 Grene/Krampcombination
10 years of strong growth and profitable development
14 years of transformation and expansion
27 years of active and developing ownership
31.08.2015Interim Report 2015H1 21

Our mantra31.08.2015Interim Report 2015H1 22
Businesses owned by Schouw & Co. should…secure and maintain a leading position
…develop after our active ownership model
…have a long-term growth strategy
…take part in value-creating consolidations
…generate ROIC above 15%
…have visible values and a strong culture
…be prepared for change

Investment guidelines (for platform investment)
We have a long-term investment strategy and is open to attractive acquisitions and appropriate divestments of companies
We have no predetermined exit strategy for the investments we make
We want to keep and develop its businesses as long as we are the best owner
We have clear targets for return on capital and profit for all investments
Area Criteria
IndustryB2B, preference for process industry and logistics/distribution
SizeRevenue – now or short-term realizable – of more than DKK 1bn
GeographyDanish headquartered (but international focus)
OwnershipPreferable wholly owned, but open to value-creating structures
Leading position
Within top 5 in its niche/segment
Manage-ment
Strong and ambitious. No operational resources at Schouw & Co. HQ
Need for a new owner
We need to bring something to the business
Possible to be active
Plans for development and transformation
31.08.2015Interim Report 2015H1 23

Two main long-term shareholders Increase in share price and trading volume
31.08.2015Interim Report 2015H1 24
Ownership
Givesco+EE32%
Hornsylds Legat15%
Treasury shares
8%
Danish (27%) and foreign (18%)
institutional and retail investors
45%
Sole purpose is owning shares in Schouw & Co.
Administrated by the Board of Directors in Schouw & Co.
Danish active family-owned business fund with activities
within bakery, industrial equipment, food/chocolate
and hardware.
75 75 84 77 77 102 128 153
115 81 101 15476 0
0
180
0
100
200
300
400
2007 2008 2009 2010 2011 2012 2013 2014
Dividends paid (DKK million) Share buy-back (DKK million)
Strong historical yield
0
2.000
4.000
6.000
8.000
10.000
12.000
0
50
100
150
200
250
300
350
400
Jan2012
Mar2012
May2012
Jun2012
Aug2012
Oct2012
Dec2012
Feb2013
Apr2013
Jun2013
Aug2013
Oct2013
Dec2013
Feb2014
May2014
Jul2014
Sep2014
Nov2014
Jan2015
Trading/day (3M average) Share price
2012
+61%
2013
+49%
2014
+30%
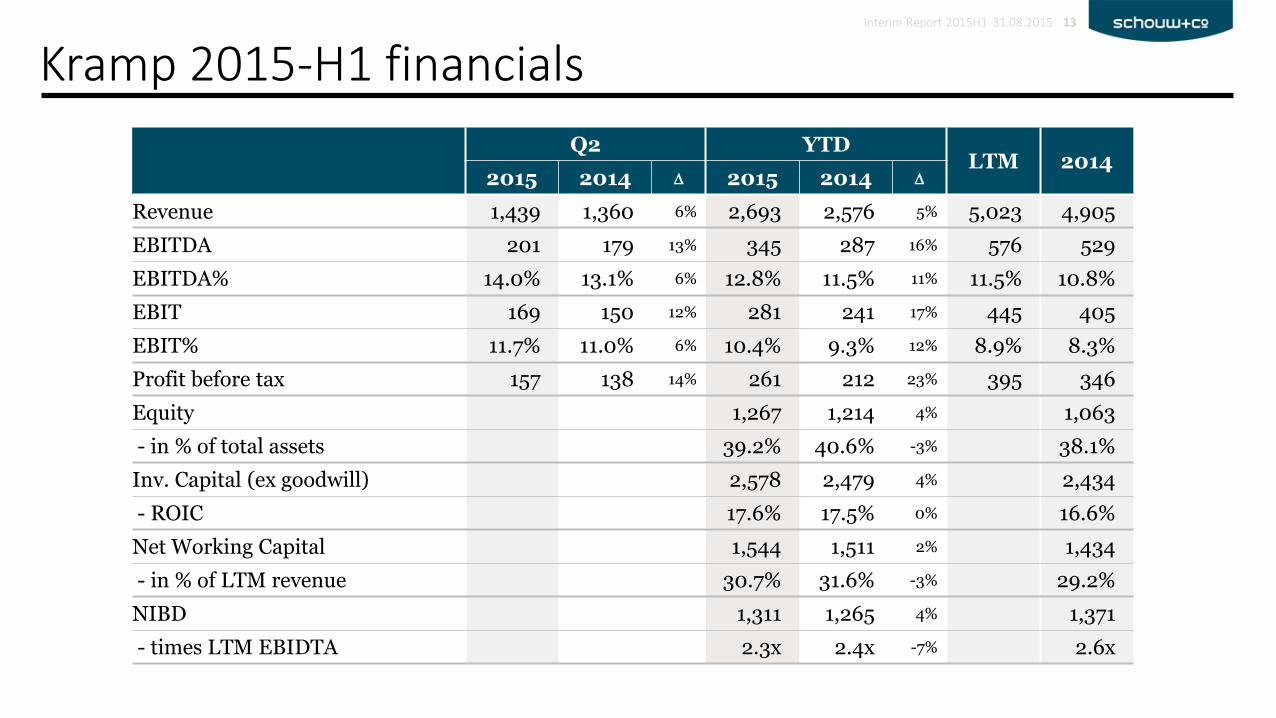
Strategic highlights in the businesses
BioMarContinued growth in existing marketsImproving profitability in NorwayLimiting risk throughout the value chainSalmon is below 5% of global farmed seafoodM&A to fuel volume ambition in new marketsConstantly above 5% EBIT margin
Fibertex Personal CareContinued growth in Asian demand for nonwovensSustaining superior quality and customer relationsFocus on improving profitability and returnLevering on full ownership in printing business15% ROIC and EBIT > 12%
Fibertex NonwovensIntegration and consolidation of investmentsContinuing transition from volume to value-addGrowth – both in and outside Europe8-9% EBIT target remains realistic
Hydra-GreneAdapting to volatility in global wind supplyGrowing in new segments, e.g. offshoreMaintaining ROIC > 15%
KrampHarvesting synergies and growing the integrated biz.Investing in new markets (West+East Europe)Revenue ambition of EUR 1bn and 13% EBITDA
31.08.2015Interim Report 2015H1 25
Capital structure
It is not a target to remain debt-free Investments in our businesses (capex and bolt-on acquisitions)
will likely be the main use of liquidity
Comfort zone for NIBD is 1-2 times EBITDA
In 2015 dividends increased by 33% to DKK 8 DKK 8 corresponds to 2.8% of market cap end of 2014
or 48% of 2014 profit for the year
Dividends have been raised annually in four successive years
Share buybacks is periodically on the agenda Gross share buyback in 2014 was DKK 180m
Total buyback in 2010-2014 amounts to DKK 410m
31.08.2015Interim Report 2015H1 26
Schouw & Co. aims to pay stable or growing dividends, always with due consideration for the company's earnings and any potential major investments or acquisitions.
Dividend policy

BioMar

Fish farming/feed geography31.08.2015Interim Report 2015H1 28
Atlantic salmon, trout Atlantic salmon, coho, trout, tilapia
Sea bass, sea bream, portiontrout, eel, a.o.
Shrimp, tilapia, catfish, pangasius, etc.
Market size ~2.0m tMarket growth* 5-6%Market share 20-25%
Market size ~1.4m tMarket growth* 5-6%Market share 25-30%
Market size ~0.7m tMarket growth 0-1%Market share 25-30%
Market size +10m tMarket growth 4-5%Market share -
2014 revenue DKK 4.1bn 2014 revenue DKK 2.6bn 2014 revenue DKK 1.8bn 2014 revenue N/A
Brande, Denmark Dueñas, Spain
Nersac, FranceVolos, Greece
Castro, Chile
Pargua, Chile
Myre, Norway
Karmøy, Norway Grangemouth, UK Guanacaste, Costa Rica
*Long-term market growth over the ‘salmon cycle’; flat/negative volume development in 2015
Pargua, Chile
NORTH SEA AMERICAS CONTINENTAL EUROPE ASIA
BioMar has in 2015 establisheda Joint Venture with ChineseTongwei. First step is to build a 100.000 ton factory in China.

BioMar’s strategy31.08.2015Interim Report 2015H1 29
Organisationally and geographically
Focus on current daily
business
Actively utilise competences
across BioMar units
New geographies and species
Grow organically in line with existing markets
Establish units (incl. production) in 2-4 new geographies before 2017, to the extent possible focusing on a limited number of species (< 5)
Strengthen global capabilities
More well defined structures and systems
ELEMENTS DIRECTION AND PRIORITIES

Ambitions from 2012 strategy plan31.08.2015Interim Report 2015H1 30
0
200
400
600
800
1.000
1.200
1.400
1.600
1.800
2002 2003 2004 2005 2006 2007 2008 2009 2010 2011 2012 2013 2014 2015 2016 2017
Volume (1000 tons)
Sales of approx. 1.7 m tons in 2017 Approx. half through organic growth The other half in new markets (acquisitions/JV’s/green fields) 5-6% EBIT margin ROIC > 15%
‘Beyond the limits’
‘Going for Profitable Global Growth’
‘Going for Global Growth’
BioMar group strategy:

0
2
4
6
8
10
196
0
196
4
196
8
197
2
197
6
198
0
198
4
198
8
199
2
199
6
20
00
20
04
20
08
20
12
20
16
20
20
20
24
20
28
20
32
20
36
20
40
20
44
20
48
Mega-trend driven demand31.08.2015Interim Report 2015H1 31
The only sustainable way to increase the supply of fish is by fish farming.
It is not possible to increase the wild catch without environmental consequences.
Salmon is healthy
High content of vitamins and healthy fatty acids (Omega 3)
Effective growth
Low feed conversion ratio 1 kg feed gives almost 1 kg fish Fish adapts to temperature High yield (few bones and fins)
Stable supply
Multiple slaughtering periods and good forecasting systems
BioMarEWOSSkrettingMarine HarvestAustevoll/LerøyMultiple farmers
Africa
Asia
Population, billion
0,0
0,5
1,0
1,5
2,0
2,5
3,0
3,5
4,0wild catch aquaculture
Source: FAO, 2013, farmed and wild salmonids
GLOBAL POPULATION GROWTH
GROWTH IN AQUACULTURE
Revenue 8,451mEBITDA 574m- margin 6.8%
EBIT 434m- margin 5.1%
ROIC 22.9%Employees 904
AQUACULTURE BENEFITS
FOCUSED FISH FEED PRODUCER
2014 FINANCIALS
Revenue ~9,000mEBIT 375-425m
2015 GUIDANCE
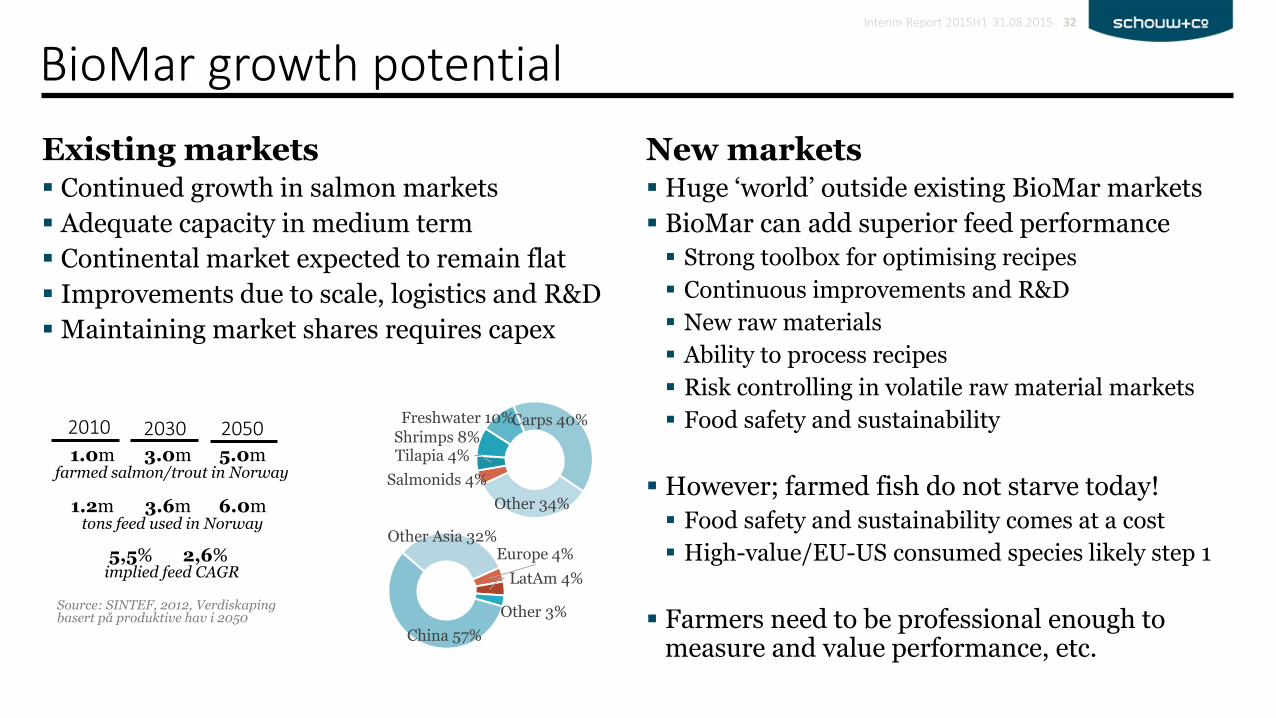
BioMar growth potential
Existing markets Continued growth in salmon markets
Adequate capacity in medium term
Continental market expected to remain flat
Improvements due to scale, logistics and R&D
Maintaining market shares requires capex
New markets Huge ‘world’ outside existing BioMar markets
BioMar can add superior feed performance
Strong toolbox for optimising recipes
Continuous improvements and R&D
New raw materials
Ability to process recipes
Risk controlling in volatile raw material markets
Food safety and sustainability
However; farmed fish do not starve today!
Food safety and sustainability comes at a cost
High-value/EU-US consumed species likely step 1
Farmers need to be professional enough to measure and value performance, etc.
31.08.2015Interim Report 2015H1 32
1.0m 3.0m 5.0mfarmed salmon/trout in Norway
1.2m 3.6m 6.0mtons feed used in Norway
5,5% 2,6%implied feed CAGR
Europe 4%
LatAm 4%
Other 3%
China 57%
Other Asia 32%
Salmonids 4%
Tilapia 4%Shrimps 8%Freshwater 10%Carps 40%
Other 34%
Source: SINTEF, 2012, Verdiskapingbasert på produktive hav i 2050
2010 2030 2050

The otherbusinesses in the portfolio

Fibertex Personal Care31.08.2015Interim Report 2015H1 34
Global top 5 producer of nonwovens for hygiene
Supplies fabrics used in baby diapers, feminine hygiene and incontinence care products
Spunbond/spunmelt technology, an integrated one-step process – from raw material to fabric
Polypropylene is the key raw material
Strong regional business
3 production lines in Denmark
4 production lines in Malaysia
Printing facilities in Germany
Growing and staying market (no alternatives)
A regional industry ∙ customers and suppliers
Simple supply chain ∙ from PP to rolls of fabric
Large investments ∙ DKK +300m for a new line
High level of competence ∙ efficiency/quality
Low margin ∙ high volume
Service and innovation makes the difference
"Preferred" partner ∙ customized activities
Core business: Spunbond for hygiene
Large customers requiring good relationship
Sensitive, small and autonomous industry
Raw materials (few suppliers, linked to oil)
One supplier of machinery (Reifenhäuser)
Customers (limited number)
Commodity products (low-margin business)
Salary and level of energy in Denmark
Radical innovations are very difficult
HIGHLIGHTS THE BUSINESS MODEL
INDUSTRY CHARACTERISTICS
Revenue 1,788mEBITDA 308m- margin 17.2%
EBIT 171m- margin 9.6%
ROIC 14.4%Employees 447
2014 FINANCIALS
Asian market continues to grow and requires significant capex
Increasing focus on value-added products (softer, bulkier, loftier and printed)
Revenue ~1,700mEBIT 170-180m
2015 GUIDANCE
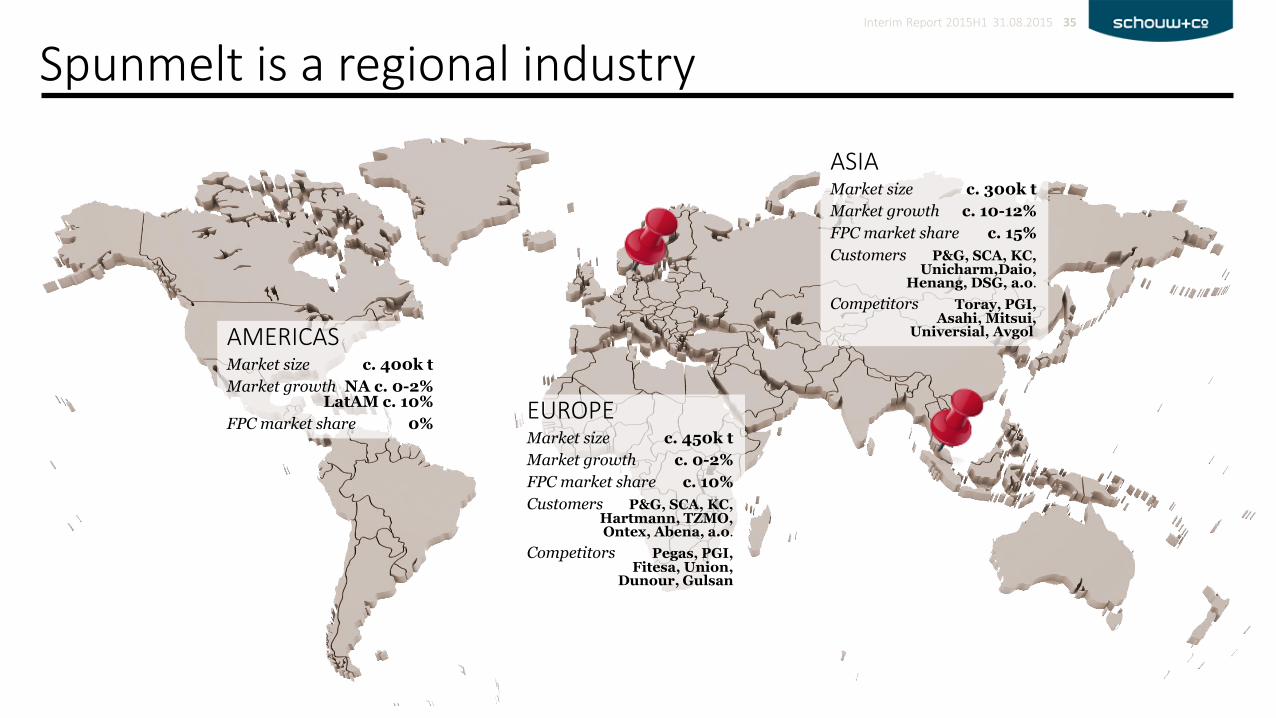
Spunmelt is a regional industry31.08.2015Interim Report 2015H1 35
EUROPEMarket size c. 450k t
Market growth c. 0-2%
FPC market share c. 10%
Customers P&G, SCA, KC,Hartmann, TZMO,Ontex, Abena, a.o.
Competitors Pegas, PGI,Fitesa, Union,
Dunour, Gulsan
ASIAMarket size c. 300k t
Market growth c. 10-12%
FPC market share c. 15%
Customers P&G, SCA, KC,Unicharm,Daio,
Henang, DSG, a.o.
Competitors Toray, PGI,Asahi, Mitsui,
Universial, AvgolAMERICASMarket size c. 400k t
Market growth NA c. 0-2%LatAM c. 10%
FPC market share 0%

Fibertex Nonwovens31.08.2015Interim Report 2015H1 36
European top supplier of industrial nonwovens
Huge versatility in product applications
Needle punching and spunlacing technology
State-of-the-art technology on all sites
Ensure critical mass / continue profit increase
Leverage on European market leader position and increase global presence
Strong competitiveness through operational improvements and state-of-the art techonology
Continue transformation; reducing dependency on volume/commodity products and growing value-added/specialty products
Building Composites
Geotextiles Concrete
About ⅓ of revenue
Infrastructure growing in emerging markets
Value added products e.g. within composites
Geotex. is commodity
Bedding Flooring
Furniture Acoustics
Hood insulation Trunk carpets
Parcel trays Wheel housing
About ⅓ of revenue
Market leader after French 2011 acquisition
Significant pipeline
Substitutes existing fabrics and part of car construction
About ⅓ of revenue
Dependent on economic cycles
Volume products
Ongoing application extension e.g. nano
16kt capacity10kt capacity 16kt capacity
7kt capacity 4kt capacity
HIGHLIGHTS AUTO
Revenue 1,048mEBITDA 128m- margin 12.2%
EBIT 62m- margin 5.9%
ROIC 8.4%Employees 547
2014 FINANCIALS
2015 will be a year of transition where new capacity will beinstalled and existingproduction lines will beupgraded.
EBIT target is 8-9%.
Revenue ~1,200mEBIT 75-85m
2015 GUIDANCE
STRATEGIC PRIORITIESCONSTRUCTION
INDUSTRIAL

Hydra-Grene31.08.2015Interim Report 2015H1 37
Leading Danish supplier of hydraulic components
Specialised trade and engineering business
Strong R&D resources taking active part in customer product development
Solid base in Danish aftermarket and OEM
Long-term growth and huge potential in the global wind turbine industry
Aftermarket customers (~25% of total revenue) Both premium and low-cost items at stock Predominantly distributed through dealers End customers within agro, lift/truck, transport
OEM customers (~25% of total revenue) Product know-how and customer support key Component distribution and own production Prod. of blocks, pipes and pump stations End customers are manufacturers of agricultural equipment, lift/trucks, boats, etc.
Hydra-Grene’s position Present in Europe, China, India and USA Strong within gear (filter blocks and systems) Total solutions in water cooling and pumps
Trends and drivers Turbine manufacturers wants fewer suppliers Established manufacturers setting the standards Increased documentation and quality More focus on aftermarket services
HIGHLIGHTS THE DANISH INDUSTRIAL BUSINESS
Revenue 566mEBITDA 78m- margin 13.8%
EBIT 60m- margin 10.6%
ROIC 22.6%Employees 230
2014 FINANCIALS
The offshore segment is gradually gainingimportance and willbecome a ‘thrid leg’.
Revenue >500mEBIT 50-60m
2015 GUIDANCE
SELECTED PRODUCTS AND BRANDS
THE GLOBAL WIND TURBINE INDUSTRY

Kramp
Leading European supplier of spare parts and accessories for the agricultural sector #1 in BeNeLux, Germany, Poland and Nordic countries
9 central warehouses covering 22 European countries
Combination of Kramp and Grene Grene wholly owned by Schouw & Co. since 1988
20% ownership in Kramp from non-cash merger between Grene and Kramp in 2013
Schouw & Co. owns 20%, management 50% and NPM Capital (Dutch long-term PE) 30%
Integration and harvesting synergies A perfect geographical match…
Expanding product ranges
Growing OEM business (partnerships)
Margin improvement through scale
Best practice (warehouse, IT, logistics)
Optimizing working capital (stockturn)
Potential annual synergies EUR 10-30m
31.08.2015Interim Report 2015H1 38
Nine distribution centers covers 22 European countries. Former Kramp in blue, former Grene in orange and Russian JV in turquoise
Revenue 4,906mEBITDA 529m- margin 10.8%
EBIT 405m- margin 8.3%
Employees 2,604
2014 FINANCIALS
Revenue ~5,250mEBIT 425-450m
2015 GUIDANCE

Contact
Investor Relations CEO/President
Kasper Okkels Jens Bjerg Sørensen
[email protected] schouw @ schouw.dk
+45 87 34 58 24 +45 86 11 22 22