Embed Size (px)
Citation preview

__________
QUALITY SPECIFICATIONS FOR ROADWAY BRIDGES, STANDARDIZATION AT A EUROPEAN LEVEL
Scientific Report on Short Term Scientific Mission
Researcher Sérgio Pereira [email protected] Home Institution IP – Infraestruturas de Portugal, S.A http://www.infraestruturasdeportugal.pt Host Institution Egnatia Odos S.A. http://www.egnatia.eu Start Date September 3, 2018 http://www.cost.eu End Date September 12, 2018 Reference Code TU1406_STSM_41681

2
CONTENTS
1. Aims and Objectives .................................................................................................................... 3
2. Work carried out........................................................................................................................... 3
2.1. Background ............................................................................................................................. 3
2.2. Summary of the work carried out ............................................................................................. 5
2.2.1. Activities proposed for this mission ..................................................................................... 5
2.2.2. Chronogram of the activities................................................................................................ 5
3. Main results ................................................................................................................................. 6
3.1. The EGNATIA ODOS S.A. Quality Control Plan for roadway bridges ..................................... 6
3.1.1. The Egnatia Motorway Network .......................................................................................... 6
3.1.2. THE EGNATIA ODOS S.A. Bridge Management System ................................................... 9
3.1.3. General Procedure for Assessing the Condition of Bridges .............................................. 16
3.1.4. Case Studies ..................................................................................................................... 26
3.2. Analysis of EGNATIA ODOS S.A. Quality Control Plan in view of COST TU1406 – WG3 Technical Report ................................................................................................................................. 30
3.2.1. General considerations ..................................................................................................... 30
3.2.2. Key Performance Indicators .............................................................................................. 31
3.2.3. Evaluation of Reliability based on Static QC Framework .................................................. 32
3.2.4. Dynamic QC Framework ................................................................................................... 38
3.2.5. Gradual Damage Processes and Sudden Events ............................................................. 43
3.2.6. Human Resources and Equipment ................................................................................... 45
3.3. Conclusions and Recomendations ........................................................................................ 48
4. Future collaboration ................................................................................................................... 49
5. Foreseen publications/articles ................................................................................................... 49
6. Additional acknowledgements ................................................................................................... 49
7. References ................................................................................................................................ 49
8. ANNEXES .................................................................................................................................. 49
8.1. Confirmation by the Host Institution on the sucessful execution of the STSM ....................... 49
3
1. AIMS AND OBJECTIVES
The main goal of this mission was to implement a practical application of the WG3 report (Establishment of a QC plan for roadway bridges) with a roadway agency - Egnatia Odos S.A. Aims and objectives of this STSM are the study of a real QCP and agency own process, as well as to carry out an independent analysis of the WG3 report with case studies, in order to simulate a possible improvement with regard to the achievements of WG1, WG2 and WG3 of this Cost Action.
2. WORK CARRIED OUT
2.1. BACKGROUND
The main objective of COST Action TU1406 is to develop a guideline for the establishment of quality control plans in roadway bridges, focusing on bridge maintenance and life-cycle performance at two levels: performance indicators and performance goals. This work has been developed through different working groups. Each Working Group has several outcomes form the action:
• WG1 – performance indicators • WG2 – report performance goals • WG3 – Establishment of a QC plan • WG4 – implementation in a case study • WG5 – Drafting of guideline / recommendations
Within the work develop by WG1, each participating country has provided information regarding which performance indicators (KPI) are used in their national assessment procedures and also how they are used. This information has been complemented with the results from the work developed within WG2 concerning bridge performance goals. All this data is the basis of WG3, WG4 and WG5. The WG3 Report defines a set of criteria on which the definition of quality control of road bridges is based. In addition to the obvious definition for users it is suggested that quality is also related to economic efficiency, environmental friendliness and social responsibility. Thus, in case of road infrastructure, the quality control plan defines the extent and the interval of inspections or investigations and data necessary to estimate key performance indicators (KPI) and forecast their future development. Quality control plan also includes decision model that suggest maintenance action based on the forecast of key performance indicators. The KPIs considered for WG3 were:
• Reliability - the probability of structural failure (i.e. safety) or operational failure (i.e. serviceability);
• Availability - the proportion of time a system is in a functioning condition. It is not reliability-related disruption of bridge users but originates from planned maintenance interventions (e.g. additional travel time due to an imposed traffic regime on bridge);
• Safety - related to minimizing or eliminating the harm to people during the service life of a bridge. The loss of life and limb due to structural failure is not included (see Reliability);
• Economy - related to minimizing long-term costs and maintenance activities over the service life of a bridge;
• Environment - associated with minimizing the harm to environment during the service life of a bridge;

4
The proposal of the report for the evaluation of these KPIs takes the form of the following diagram:
This diagram indicates that for an assessment of the quality of the bridges, each report should structure and register the inspector’s reasoning. This means that is not enough for the inspector to say that the bridge is on a certain level. Thus, it must be indicated and registered some factors that support the KPI assigned:
• “Observation”: What is observed;
• “Vulnerable zone”: If the anomaly occurs in a particular part of the structure (for example, where the value of bending moment are maximum);
• “Component”: What is the element in question;
• “Damage Process”: What is the damage process that is behind the anomaly (for example, vehicle overload);
• “Failure mode”: What is the failure mode associated to that damage. This diagram is also related to the entity Time. This means that this diagram can be used in the scope of an inspection to know the current state of a bridge and, using those inspection’s reasoning, it can be applied to assess the future state of the same bridge by application of degradation models. The WG3 Report also attempts to relate the quality of inspections with requirements for human resources and equipment, based on a survey conducted to experienced bridge engineers from different countries within Europe.

5
2.2. SUMMARY OF THE WORK CARRIED OUT
2.2.1. ACTIVITIES PROPOSED FOR THIS MISSION
This STSM develop the following topics within the agency's procedures:
• Task 1: Register the general procedure of the agency for assessing the condition of bridges;
• Task 2: Identify if this procedure focus only on structural reliability or if it focus also on the other KPIs mentioned in the WG3report;
• Task 3: Identify if the agency’s assessment or forecast of the state of bridges are based on the framework developed by the WG3 (diagram above), that is, if it takes into account with “observations”, “damage processes” or “failure modes;
• Task 4: To know how is this assessment framed the entity Time, and know how is the prediction of degradation or the remaining life of the bridge;
• Task 5: Identify whether the agency has any scenario formulation after assigning the condition of bridges (for example, “Do nothing until next inspection ","rehabilitate " or "replace");
• Task 6: Identify whether the agency distinguishes between gradual damage processes and sudden or extreme events;
• Task 7: Compare, in terms of human resources and equipment used, the agency's methodology and the best practices identified in the WG3 report;
• Task 8: Compare what is indicated in the WG3 report with the existing methodologies in the agency, and identify how could these methodologies be improved to approach the report's suggestions (if this could be done in stages, in simple steps, what should be the suggestions to indicate, in order of ease of implementation);
• Task 9: Writing of a report which will compile all the obtained results so it can be shared with all the members of COST TU1406 project.
2.2.2. CHRONOGRAM OF THE ACTIVITIES
Days 3 4 5 6 7 8 9 10 11 12 13 14 15 16
Task 1
Task 2
Task 3
Task 4
Task 5
Task 6
Task 7
Task 8
Task 9
Week 1 Week 2
March
6
3. MAIN RESULTS
3.1. THE EGNATIA ODOS S.A. QUALITY CONTROL PLAN FOR ROADWAY BRIDGES
3.1.1. THE EGNATIA MOTORWAY NETWORK
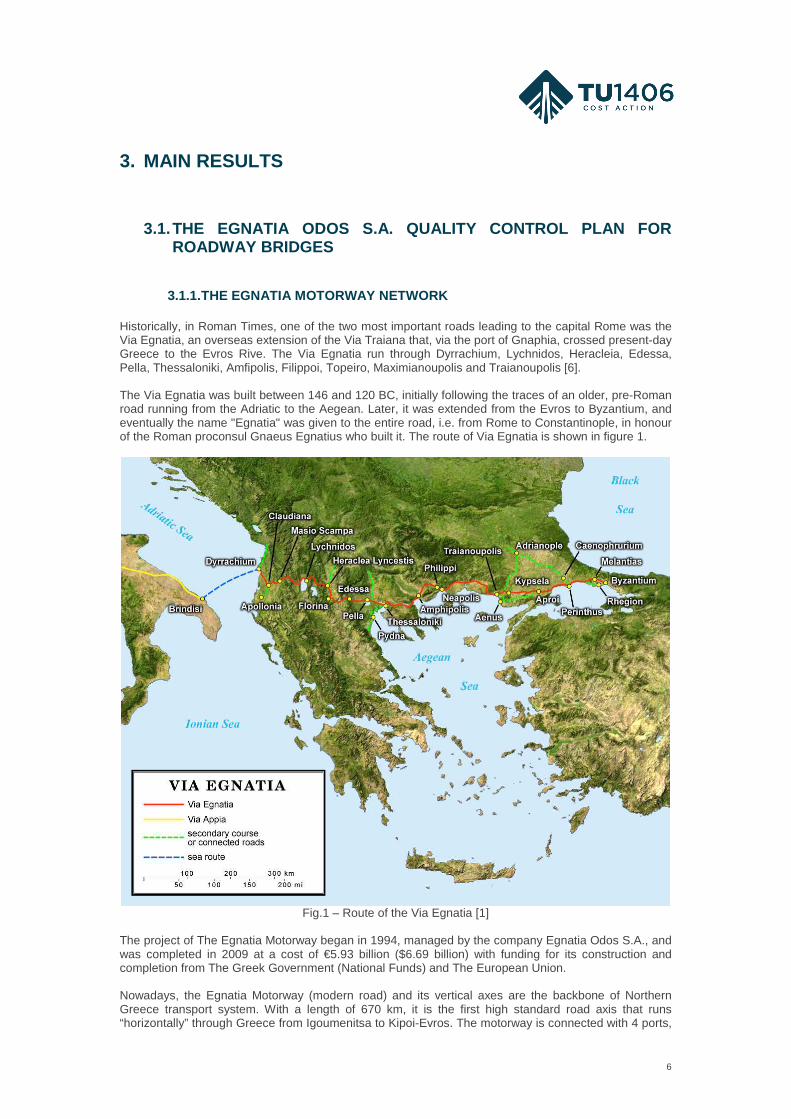
Historically, in Roman Times, one of the two most important roads leading to the capital Rome was the Via Egnatia, an overseas extension of the Via Traiana that, via the port of Gnaphia, crossed present-day Greece to the Evros Rive. The Via Egnatia run through Dyrrachium, Lychnidos, Heracleia, Edessa, Pella, Thessaloniki, Amfipolis, Filippoi, Topeiro, Maximianoupolis and Traianoupolis [6]. The Via Egnatia was built between 146 and 120 BC, initially following the traces of an older, pre-Roman road running from the Adriatic to the Aegean. Later, it was extended from the Evros to Byzantium, and eventually the name "Egnatia" was given to the entire road, i.e. from Rome to Constantinople, in honour of the Roman proconsul Gnaeus Egnatius who built it. The route of Via Egnatia is shown in figure 1.
Fig.1 – Route of the Via Egnatia [1]
The project of The Egnatia Motorway began in 1994, managed by the company Egnatia Odos S.A., and was completed in 2009 at a cost of €5.93 billion ($6.69 billion) with funding for its construction and completion from The Greek Government (National Funds) and The European Union. Nowadays, the Egnatia Motorway (modern road) and its vertical axes are the backbone of Northern Greece transport system. With a length of 670 km, it is the first high standard road axis that runs “horizontally” through Greece from Igoumenitsa to Kipoi-Evros. The motorway is connected with 4 ports,

7
6 airports and 9 vertical axes that ensure access to the countries of South-Eastern Europe. The Map of the Egnatia Motorway network is shown in figure 2.
Fig.2 – Map of the Egnatia Motorway network [2]
It is part of the Trans-European Transport Network and one of the 14 priority projects in the European Union. The Egnatia Motorway is also a collector route for the Balkan and South-eastern European transport system. Pan-European Corridors IV (Berlin - Sofia - Thessaloniki), IX (Helsinki - Alexandroupolis) and X (Vienna - Belgrade - Thessaloniki) all end at the Egnatia Motorway. The Map of the Trans-European Transport Network is shown in figure 3.
Fig.3 – Map of the Trans-European Transport Network [2]

8
The technical characteristics of the main axis consists in a dual carriage way with central reserve. There are two traffic lanes for each branch with 2,5m wide emergency lane. The typical cross section is 24,5m. An overview of the Egnatia Motorway is shown in figure 4.
Fig.4 – Overview of the Egnatia Motorway [2]
The diverse terrain crossed by the Egnatia Motorway together with the special environmental conditions encountered imposed the construction of a large number of bridges with a combined length of 42 km (measured as single carriageway). This means that 6% of the road axis length runs over bridges, the construction cost of which corresponds to 15% of the total motorway construction cost. There are 1856 highway structures along the main axis which 646 are considered as bridges (all structures over 6m in length, including bridges, underpasses and overpasses) and more than a thousand small culverts of a span of up to 6m. Figure 5a and 5b shows the breakdown between bridge types and the length distribution of the bridges on the main axis of the Egnatia Motorway.
a) Breakdown between bridge types b) Length distribution of the bridges
Fig.5 – Highway Structures in the Egnatia Motorway [2] Besides bridges there are 73 tunnels in with a total length of 50km (7,5% of the total length of Egnatia Motorway). With the construction of tunnels of Egnatia Motorway, Greece becomes the 4th country in European Union in number of long tunnels in the TransEuropean road Network. In summary, the Egnatia Motorway Network (including vertical axes) has about one thousand bridges, underpasses and overpasses. All bridges have a design life of 120 years and their structural solutions are mainly made of prestressed and reinforced concrete. The majority of this structures is quite new, with less than 20 years old. In some particular cases, the Egnatia Motorway Network included older bridges that belonged to existing roads and are now integrated in one of the two branches of the main road. Figure 6 shows several bridge types in the Egnatia Motorway.

9
a) Bridge [2] b) Underpass c) Overpass
Fig.6 – Bridge types in the Egnatia Motorway
3.1.2. THE EGNATIA ODOS S.A. BRIDGE MANAGEMENT SYST EM
The Egnatia Odos S.A. Bridge Management System (E_BMS) is ensured by the Major Structures Maintenance Monitoring Department (Bridge Division) and its responsibility is to define and to operate the Quality Control Plan for roadway bridges. Figure 7 shows the general structure of the E_BMS.
Fig.7 – Schematic Representation of the E_BMS [2]
1. Data Base In order to have a reliable Quality Control Plan (QCP), it is essential to have a consistent and well-organized database. In this sense, to manage the inspection and maintenance of bridges and structures of Egnatia Odos (EO) a code has been established by following the Linear Reference System of the Maintenance and Operation (LRS) of the EOSA. This system has been exclusively developed to meet the needs of the company. Designed to be easy to use, flexible to accommodate possible amendments and finally be able to related to other road chainage systems, which will be used at the EO in the future. For its proper application the following conditions should meet: 1. The motorway interchanges should be uniquely numbered and 2. definition of the motorway code up to 3 characters (i.e. EO is coded with code A2).
10
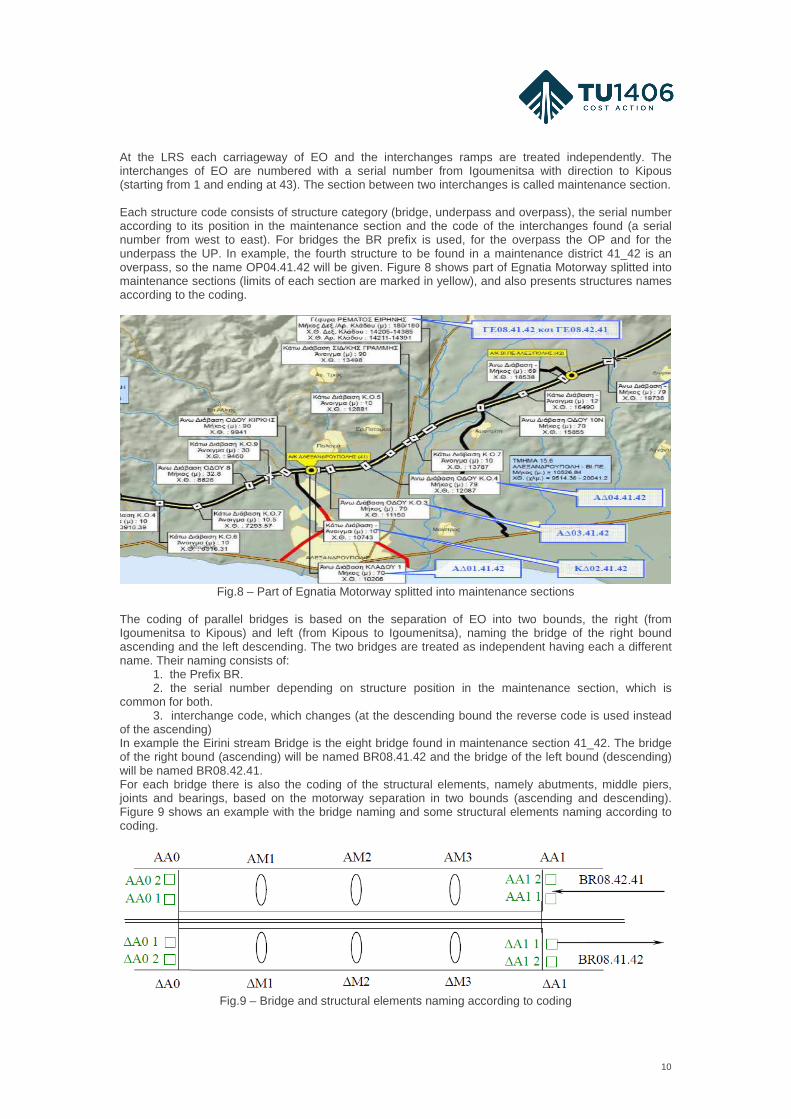
At the LRS each carriageway of EO and the interchanges ramps are treated independently. The interchanges of EO are numbered with a serial number from Igoumenitsa with direction to Kipous (starting from 1 and ending at 43). The section between two interchanges is called maintenance section. Each structure code consists of structure category (bridge, underpass and overpass), the serial number according to its position in the maintenance section and the code of the interchanges found (a serial number from west to east). For bridges the BR prefix is used, for the overpass the OP and for the underpass the UP. In example, the fourth structure to be found in a maintenance district 41_42 is an overpass, so the name OP04.41.42 will be given. Figure 8 shows part of Egnatia Motorway splitted into maintenance sections (limits of each section are marked in yellow), and also presents structures names according to the coding.
Fig.8 – Part of Egnatia Motorway splitted into maintenance sections
The coding of parallel bridges is based on the separation of EO into two bounds, the right (from Igoumenitsa to Kipous) and left (from Kipous to Igoumenitsa), naming the bridge of the right bound ascending and the left descending. The two bridges are treated as independent having each a different name. Their naming consists of: 1. the Prefix BR. 2. the serial number depending on structure position in the maintenance section, which is common for both. 3. interchange code, which changes (at the descending bound the reverse code is used instead of the ascending) In example the Eirini stream Bridge is the eight bridge found in maintenance section 41_42. The bridge of the right bound (ascending) will be named BR08.41.42 and the bridge of the left bound (descending) will be named BR08.42.41. For each bridge there is also the coding of the structural elements, namely abutments, middle piers, joints and bearings, based on the motorway separation in two bounds (ascending and descending). Figure 9 shows an example with the bridge naming and some structural elements naming according to coding.
Fig.9 – Bridge and structural elements naming according to coding

11
With all information well-structured and organized in the EO bridges inventory (data base and GIS - Geographic Information System), the E_BMS is able to plan and specify all activities needed to control quality, which are described below (2 and 3). EO has also almost full information from the bridges design phase (including drawings) of Egnatia Motorway Network (90-95%).
2. Data and Measurements Collection This field covers all activities included in EO Quality Control Plan in order to verify, check and inspect the quality of bridges. EO has the experience, the know-how and the special equipment to carry out all types of inspections of on service highway structures, as it actually performs for the hundreds of bridges, tunnels and geotechnical structures of Egnatia Motorway. All activities are carried out by a team with 4 engineers, which mostly consists in visual inspections of bridges, following a detailed inspection manual for detecting deterioration, cracking, other structural or functional problems. The general procedure for assessing the conditions of bridges, based on visual inspections, is described with more detail in sub-chapter 3.1.3. To assess quality of bridges, in addition to visual inspections, this team is also qualified to execute (if deemed necessary) Destructive and Non-Destructive Tests, Structural Health Monitoring (SHM) and in-depth investigations based on Structural Analysis of bridges using adequate software. These information are later inserted in the database for each bridge, according to its specific code. All activities are described below:
• Visual Inspection The by touch visual check of the external surfaces of all the basic structural and functional bridge elements, using a big variety of special tools and being equipped by the suitable access machinery (if required). All the basic dimensions are accurately measured on site to verify the as built drawings. The concrete reinforcement of all the critical element sections could be detected by using bar detectors or/and by catastrophically reveal bars in representative element sections. Residual displacements, deformations, inclinations of the basic structural elements can be measured by using the proper measuring devices. All forms and areas of deterioration and distress along all the basic structural elements can be located, inspected and recorded as to type, location and degree of severity. Special attention is given to identify and map areas of excessive cracking or spalling of the concrete, corrosion of mild or prestressing steel bars. All the data is recorded during inspection by filling electronic inspector’s check lists, in accordance with the standards used, in order to produce all the required input for recording and coding the structural defects. The visual inspection includes in detail by touch examination of all the following structural elements of the bridge: Substructure (piers, bearing beam, nodes of monolithic connection), Superstructure (beam, deck slab, section box, underbridge area), Foundation (footings, pile-cap), Surface (asphalt surface course), Joints; Bearings, Hydraulic protection of piers- bank slopes-river bedding, etc. Figure 10 shows pictures of bearings inspection using special tolls and access boom lift. In general, the frequency of bridge inspection is 5 years (Primary Inspection). For the most important bridges (length distribution of the bridges L>200m) the frequency is 3 years. Depending on the condition of the bridge, the next primary inspections may be more frequent (although no fixed periods are established between inspections). Another inspection type is the Surface Elementary Inspection which must be performed once a year (without use of access equipment), used mainly for road surface and joints observation. There are also patrol teams that cross the motorway permanently and they can reproduce damage reports in some bridge components (for example in joints) to the Major Structures Maintenance Monitoring Department (Bridge Division). The E_BMS only sets visual inspections for culverts after flood events. At this stage of the motorway network (quite new), E_BMS doesn’t execute visual inspections for tunnels.

12
a) Measurement using special tolls b) Access boom lift
Fig.10 – Bearings Inspection using special tolls and access boom lift [3]
• Destructive and Non-Destructive Tests The following non-destructive tests are often carried out in combination with the visual inspections, targeting in reducing the number of cores to be taken from the existing bridge structural elements (figure 11 shows 3 examples of concrete non-destructive testing):
a) Rebound tests: Extended rebound testing on the concrete surfaces, free of painting or protective mortar, will be carried out in order to detect weak areas with strength that doesn’t conform to the design considerations;
b) Pulse velocity: Extended surface, direct and indirect pulse velocity measurements for determining dynamic modulus of concrete elasticity, as well as crack depth and concrete cover measurement will be carried out;
c) Reinforcement Bar Detection: For verifying the installed quantity and identifying the actual arrangement of the installed reinforcement, the surface concrete scanning will be carried out using special bar detector devices;
d) Half cell: semi – catastrophic check of the electric potential of the reinforcement bars. This type of test will be carried out in cases that signs of steel bar corrosion is detected, to determine the extent and rate of steel corrosion.
a) Rebound Hammer
b) ultrasonic
c) Bar Detector
Fig.11 – Concrete non-destructive testing [3] The following destructive tests will follow visual inspection of the existing bridges, if deemed necessary (figure 12 shows 3 examples of concrete destructive testing):
a) Samples of concrete for assessing the actual concrete strength of the structural elements of the existing bridges will be removed by core drilling. Equipment, number, size, core diameter, core length and locations of the cores will be in accordance with the standards and norms as established in the Inception Report;
b) Samples of concrete for determining the actual properties and characteristics of the concrete of the structural elements of the existing bridges are being removed by core drilling. Equipment, number, size, core diameter, core length and

13
locations of these cores will be in accordance with the standards and norms used, in order the required petrographic and chemical laboratory analyses to be carried out properly. Among others, petrographic analysis will provide the required information for properties of aggregates, density of the cement paste, homogeneity of the concrete, presence of deterioration caused by exposure to freezing and thawing, occurrence and distribution of fractures and voids etc, while chemical tests can determine depth of carbonation and chloride content etc;
c) Local removal of the concrete cover to locate and determine the size of the embedded reinforcing steel at locations of minimum stress;
a) Core sampling (sidewalks) b) Core sampling on the abutments c) Carbonation test
Fig.12 – Concrete destructive testing [3]
• Structural Health Monitoring (SHM) As visual or other non-destructive tests give only local information of the inspected bridges and as for some structures the environmentally induced deteriorations may affect (decrease) their load capacity/strength, the application of global non catastrophic experimental assessment methods is necessary in order to prove that their actual load capacity is sufficient or confronts to the as built/as designed considerations. To identify and evaluate the actual load capacity and strength/stiffness of bridges and determine the performance levels that should not be exceeded during their remaining life, the following methods could be used in combination or as alternative activities:
a) Supplementary load Test is intended to supplement the analytical method of assessment based on calculation (FEModel) and the use of codes of practice. The results provide a strong indication of how the structure is actually behaving under load and how the loads are being distributed through the various structural member. Then the mathematical model representing the bridge can be modified so that the results obtained from analyses more closely conform to those obtained form the load test. Finally by using the modified mathematical model the ultimate load capacity of the bridge can be predicted;
b) Dynamic Load Testing, using either ambient or forced vibrations, is another form of load testing which is used to evaluate the performance of a structure. The results, which are usually a measure of stiffness rather than strength, may be used to validate the prediction of design calculations or, alternatively, a comparison of results over time may be used to monitor any deterioration or serious damage to the structure (figure 13 shows 2 examples of SHM);

14
a) Strain monitoring and crack monitoring b) Ambient vibration monitoring
Fig.13 – Structural Health Monitoring of bridges [3]
• Structural Analysis of bridges The structural analysis of bridges using adequate software relies on information from design phase and eventually from in-depth investigations (Destructive and Non-Destructive Tests). This methodology intents to determine the effect of deterioration and damages in any structural element by changing section and material properties (for example, in the superstructure, the loss of section in a beam due to corrosion) in order to assess bridge condition with more accuracy. In this sense, it is possible to determine relevant failure modes of the structure, critical loads situation and vulnerable zones (for each failure modes). At the limit, this analysis may even lead to the closure of some lane of the road (over the bridge). Figure 14 shows an example of a Structural Analysis of a bridge with prestressed concrete T-Beams deck.
a) Bridge Structural Model b) Section Properties c) Tendon modeling
Fig.14 – Structural Analysis of a prestressed concrete T-Beams superstructure
3. Repair program and maintenance plan After assigning the condition of bridges, the Major Structures Maintenance Monitoring Department as also the responsibility to establish a repair program and a maintenance plan. The condition rating of all bridge components is defined from 1 to 9 (1 is the worst and 9 is the best condition). Depending on condition rating (CR), E_BMS has a general scenario formulation with alternative maintenance actions (CR ≥ 7 “Do Nothing”; 3 < CR < 7 “Maintenance Actions”; CR ≤ 3 “Heavy Repair or/and strengthen or replace”). The general procedure for assessing the condition of bridges, based on visual inspections, is described with more detail in sub-chapter 3.1.3. Following the condition rating assigned from the visual inspection (or other methodology), the Major Structures Maintenance Monitoring Department has the responsibility to define quantities and technical specifications for maintenance actions as well to design structural solutions for the necessary repairs (for example: fill and seal cracks, concrete repairs, joints maintenance works, etc). In this sense, EO has a permanent contract with a specialized company for maintenance actions (AKTOR S.A.), in order to assure quality of bridges.

15
As an experienced bridge management agency, EO intends to establish a maintenance plan in order to minimize its costs. EO considers that maintenance actions should be done as soon as possible, within the annual financial resources available, as shown in its publication “Life–cycle maintenance cost prediction for concrete bridges based on inspection data” presented at TRA – Transport Research Arena 2014, Paris – which concluded that high repair costs are reduced as the worst damage states take place later that it was expected. This paper refers the difficulty to determine deterioration models, in conjunction with bridge condition rating and maintenance cost assessment methods, in order to predict future needs during the life cycle of concrete bridges. These models and methods produce accurate predictions only when based on extensive real condition and deterioration data, obtain in similar natural environment by systematic inspection of bridges built under common technical standards. Therefore, if the models to be used do not incorporate real bridge condition evolution, they may be overestimate or underestimate future bridge maintenance expenses. In this sense, E_BMS considerations and models to predict life-cycle maintenance costs, presented at TRA, were evaluated using field data gathered from the inspection of 216 old concrete bridges in Greece. A detailed visual inspection of these concrete bridges, built from 1935 to 1995 and serving the old Greek national road network, was carried out. Their structural and functional condition was rated using US guidelines (AASHTO, 2011, and California, 1996) and relevant codes as NBI 1-9 rating scale and sufficiency rating method (FHWA, 1995 and FHWA, 2002). New inspection and condition evaluation manuals were developed based on the experience of applying US codes (Panetsos et al., 2010). Based on the condition rating scores given to the inspected old Greek road bridges, a set of empirical curves relating the bridge condition stage to age were built. These empirical curves show that the ultimate condition state 3, for which a major rehabilitation action is mandatory for the bridge superstructure or its replacement, is expected 72 years after being set on service. The empirical deterioration curves were compared by well-known experts and responsible agencies as well with stochastic (markovian) deterioration prediction curve for bridge superstructures (shown in figure 15).
a) Versus international agencies b) Versus markovian deterioration prediction
Fig.15 – Greek empirical life-cycle performance for superstructure versus other deterioration models [4] For all the 216 old Greek concrete bridges, based on visual inspections, additional non-destructive and destructive tests, as well as analytical assessments for their load capacity under traffic or seismic loads, the necessary interventions were designed and their cost was estimated (maintenance costs, including strengthening or the rehabilitation of the superstructure, the replacement of the deck, the replacement of the water proofing membrane, of the safety barriers, of the sidewalks and of the asphaltic pavement). Figure 16 shows the results of E_BMS cost model which predicted high repair costs much earlier than worst condition states take place (repair cost curve increases deeply between 7-8 condition rating score). This reasoning is the basis of EO maintenance plan, which the necessary actions should be done as soon as possible, within the annual financial resources available (as stated before). All these data were studied mainly for the bridge superstructure since it is (by far) the most costly component in the maintenance actions comparing with other components (for example: infrastructure, bearings).

16
a) Repair Cost Curve b) % Repair Cost Curve
Fig.16 – Superstructure maintenance cost versus age and versus condition state [4]
3.1.3. GENERAL PROCEDURE FOR ASSESSING THE CONDITIO N OF BRIDGES
The general procedure for assessing the condition of bridges is based mainly in 3 stages. Firstly, field inspection (usually visual inspection) based on a detailed manual, in order to identify their geometry, their actual functional and mechanical properties, to detect any defects and to recognize their deterioration/damage. Secondly, the data extracted by all types of filed inspection, is interpreted by the Bridge Division for determining the actual condition of the inspected bridges. The evaluation of the structural and functional sufficiency of the inspected bridges is analytically carried out based on condition results and following international guidelines and standards. Thirdly, all these information should be stored in a specific data base. These 3 steps are detailed below:
1. Visual Inspection This activity is based in the Visual Inspection Manual for Bridges, developed by EO, specifically for all types of bridges in its network. This document specifies with detail the duties of the bridge inspection teams:
o Planning the inspection (determination of the specific structures for inspection, inspection sequence, time schedule);
o Preparation for inspection (review bridge design and previous reports, selection of tools an equipment);
o Visual inspection; o Preparing the visual inspection reports; o Evaluation of the structural and operational condition based on the findings of the
visual inspection; o Update the bridge electronic database (BRIDGE) with the condition evaluations
of the structural elements and any variations found (dimensions of structural components, bearing type, etc) of the already constructed bridge compared to the design drawings or project record;
o Recognition of the structural elements locations that need repair and maintenance proposal for additional destructive and non-destructive tests;
o Proposal for routine maintenance actions (action type, cost, extent). The procedure of a visual inspection includes a detail examination of each structure element. The structure is divided into 6 structural parts:
o Substructure (structure elements: abutment, middle pier, shallow foundation, foundation with piles);
o Superstructure (structure elements: T-section beam, slab, box girder); o Foundation o Bearings o Joints o Road surface (elements: pavement, sidewalk, drainage system);
There is also specific inspection sheets to record all observations and findings during the visual inspection. These sheets are designed to record the most common and possible damages that can occur in EO bridges, for superstructure and infrastructure (concrete deterioration, concrete cracks,

17
settlements, scour, collisions, etc), as well for bearings and joints. Figures 17 and 18 show visual inspection sheets included on the Visual Inspection Manual for Bridges developed by EO.
a) Front page of the manual b) Visual inspection sheet for the deterioration recording
Fig.17 – Visual Inspection Manual for Bridges developed by EO [3]
a) Joints visual inspection sheet b) Bearings visual inspection sheet
Fig.18 – Visual inspection sheets [3] This manual also takes into account the deterioration of concrete bridges and structures (mechanical, physical and chemical processes) and explain with detail types of concrete deterioration (carbonation, discoloration, cover debonding), efflorescence, chloride ions penetration into concrete, spalling, cracking and collisions (also describes the types of deterioration for joints and bearings).

18
EO manual detail guidelines for visual inspection, specifically for all types of bridges in its network. This guidelines are divided in 4 parts: A – Substructure inspection; B – Superstructure inspection; C – Joints and Sewerage System; D – Bearings. For each part, all elements are accurately described, the type of each element, the construction methods and materials and its reinforcement design, and guidelines of the methods and locations for inspection (to check displacements, concrete deterioration, scour, type of cracks, etc). Figure 19 shows possible problems in infrastructure described in EO manual. The elements identified for the structural part of the bridge are:
o A – Substructure: Abutments, middle piers; o B – Superstructure: Slab bridges, T-Beams, Concrete box girder cross sections,
Frame type (monolithic connection between substructure - superstructure);
a) Differential displacements (abutment) b) Vertical displacement (middle pier)
Fig.19 – Possible problems in infrastructure described in EO manual [3] Following this procedure, bridge inspectors are guided to check specific zones of each structure, which are considered essential for a good structural functionality (anchorage areas, shear zones, tension zones, etc.). This procedure has also defined a clear failure criteria for some structural damages like cracks (crack width severity scale), depending on different type of superstructures (prestressed or reinforced concrete). Figure 20 shows some parts of the EO manual, which it is presented the construction materials and reinforcement design for a T-Beam superstructure, and a scale with crack width severity for a prestressed concrete box girder.
a) Reinforcement design (T-Beam) b) Crack width severity scale (prestressed concrete box girder)
Fig.20 – Parts of the EO manual for superstructure inspection [3] Figure 21 shows some drawings included in the EO manual, which is indicated the specific zones to be checked and inspect for frame bridges (shear zones and tension/compression zones).

19
a) Shear zones b) Tension and compression zones
Fig.21 – Inspection methods and locations for Frame bridges (Part of EO manual) [3] Based on these guidelines and the know-how of the bridge inspection team (with engineering reasoning), any EO bridge condition is assessed according to its specific structural functionality.
2. Evaluation of the Condition of Bridges EO has a methodology concerning the evaluation of the bridges structural and operational adequacy, which is based mainly on the qualitative evaluation of the deterioration, as the latter is defined at the regular visual inspection. The methodology is based both on international standards, particularly in those bridges management systems of the U.S.A., the NBI and PONTIS, and significant experience during inspection, evaluation and maintenance of thousands of constructed bridges in Greece. The specific way of evaluating bridges and structures of EO starts from the lowest rating with condition rate of each element that form the structure and the operation of the bridge. Uses a 9-grade rating scale for compliance with the spirit of the U.S. regulations and Evaluation Manuals, in which is based. The element level rating is needed in addition to qualitative and quantitative evaluation of the extent and intensity of the deterioration, in the spirit of the PONTIS system, which is widely used software and management system for bridges maintenance in the U.S. The evaluation is completed by having the rate of each element and bridge in the spirit of the applicable Federal NBI Evaluation System, in order to take into account the significance of the deterioration, regardless of the extent. In combination with other criteria (based on the Sufficient Rating system by F.H.W.A of the U.S.A), the rating of the bridge is a clear vulnerability and inadequacy rating which will be used in order to set priorities for the bridges maintenance management network. This procedure is described in the Bridges Structural and Operational Adequacy Manual (Bridge Evaluation Manual), developed by EO. The system used, rates the elements of the bridge, while proposing actions to restore the proper operation where necessary. It relies on using two kinds of tables, the Primary and the Special. The Primary tables evaluate the elements condition and suggest depending on the significance of the deteriorations and problems, specific actions for primary maintenance purposes. The Special tables evaluates the significance of certain basic problems which are not mentioned in the primary tables. The evaluation is made by using a 9-grade rating scale and implemented in four stages. In the first all the individual elements are rated (for example: abutments ∆A0, AA0; middle piers ∆M1, ∆M2, ∆M3). In the second stage the various groups of the same elements are rated (for example: all abutments, all middle piers, etc.). Following in the third stage the rating of the superstructure and substructure is performed, as structural parts. In the fourth stage, finally, the bridge is rated with one grade. The transition from one stage to another is performed in many alternative ways, one of which (the simplest and most conservative) is implemented through the agreement of the total score of each stage with the worst score of each element (structural element, structural part, etc.), meaning that emphasis is given at the structural elements and parts with significant problems and these determine the rating of the group to which they belong. Then, the group affects in the next stage the Superstructure or Substructure rating where it belongs.

20
Figure 22 shows a table, included in the EO evaluation manual, with the relation between evaluation tables and structural elements.
Fig.22 – Relation between evaluation tables and structural elements (EO Evaluation Manual) [5]
The Primary and the Special tables evaluate the following subjects:
o Table P1: Reinforced/Prestressed Concrete Structural Elements o Table S1: Settlement/Rotation o Table S2: Scour in foundation substructure’s elements o Table S3: Bottom face of the bridge’s deck slab o Table P2: Evaluation of the Wearing Surface o Table P3: Joints o Table P4: Bearings o Table P5: Collisions o Table S4: Vertical Clearance of the Structure o Table S5: Lateral Clearance of the Structure o Table S6: Transition with the road o Table S7: Flood risk
Figure 23 shows a part of the Table P1, which is used to evaluate several elements for superstructure or infrastructure. Following the description of the concrete deterioration (for example: cracks, reinforcement corrosion, efflorescence, etc.), its causes (for example: structural or non-structural cracks caused by traffic loads) and its severity (for example: crack width, loss of reinforcement cross section, etc.), all inspection teams are able to assign the condition rate with uniformity and the same criterion. For each rating, the deterioration that has been the on-site inspected and one or more required alternative actions (maintenance or repair/replacement actions), is corresponded. After the rating of the structural condition of the basic structural elements of the bridge, but also after the rating of the settlement (table S1) and scour phenomena (table S2) and operational features of the bridge (by using the tables described before) and the final rating of the structural condition of the four primary structural parts (substructure, scour, superstructure and bearings), it is necessary for the overall adequacy evaluation of the bridge to take into account a set of parameters that expect from the structural safety they concern the operation but also the importance of the bridge. The method of weighting the influence of these three primary parameters for evaluating the overall adequacy of bridges is based on the Sufficient Rating system by F.H.W.A of the U.S.A. The overall sufficiency rating of the bridge is a 100-point rating scale (0-100), where 100 is given when the bridge has full adequacy, while rating below 50 is given when the bridge requires immediate heavy repair or replacement.

21
Fig.23 – Part of Table P1 - Reinforced/Prestressed Concrete Structural Elements [5]
22
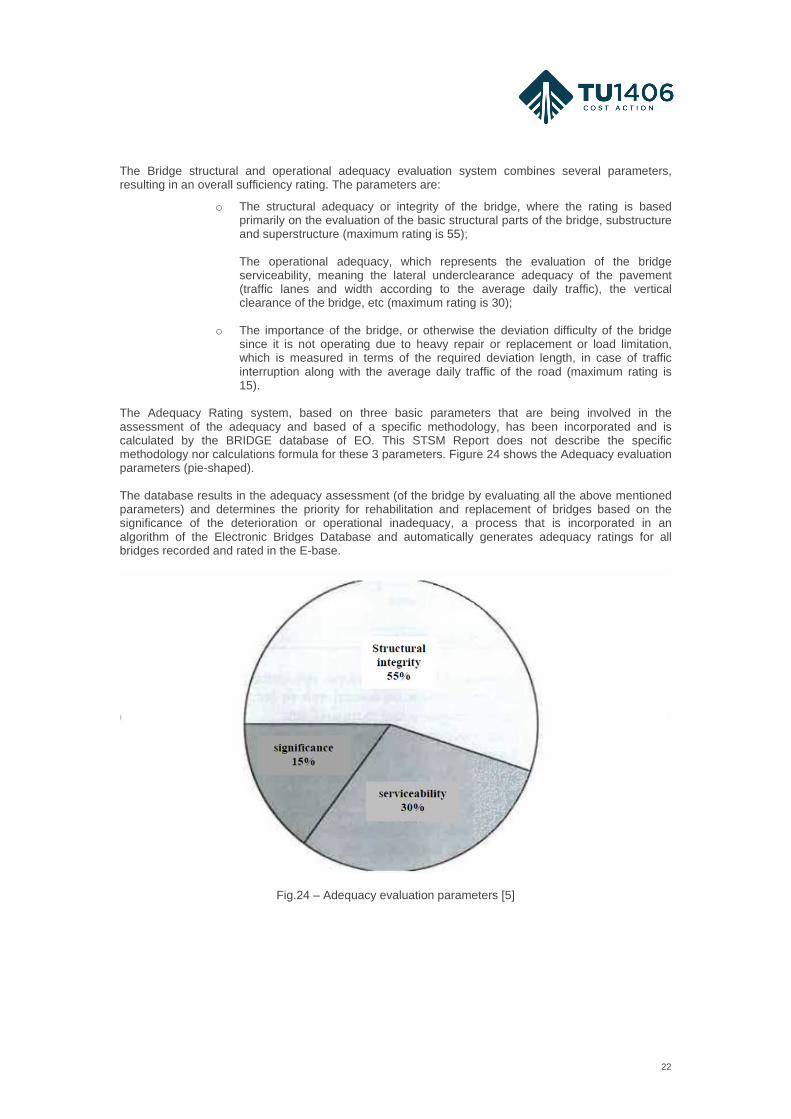
The Bridge structural and operational adequacy evaluation system combines several parameters, resulting in an overall sufficiency rating. The parameters are:
o The structural adequacy or integrity of the bridge, where the rating is based primarily on the evaluation of the basic structural parts of the bridge, substructure and superstructure (maximum rating is 55); The operational adequacy, which represents the evaluation of the bridge serviceability, meaning the lateral underclearance adequacy of the pavement (traffic lanes and width according to the average daily traffic), the vertical clearance of the bridge, etc (maximum rating is 30);
o The importance of the bridge, or otherwise the deviation difficulty of the bridge since it is not operating due to heavy repair or replacement or load limitation, which is measured in terms of the required deviation length, in case of traffic interruption along with the average daily traffic of the road (maximum rating is 15).
The Adequacy Rating system, based on three basic parameters that are being involved in the assessment of the adequacy and based of a specific methodology, has been incorporated and is calculated by the BRIDGE database of EO. This STSM Report does not describe the specific methodology nor calculations formula for these 3 parameters. Figure 24 shows the Adequacy evaluation parameters (pie-shaped). The database results in the adequacy assessment (of the bridge by evaluating all the above mentioned parameters) and determines the priority for rehabilitation and replacement of bridges based on the significance of the deterioration or operational inadequacy, a process that is incorporated in an algorithm of the Electronic Bridges Database and automatically generates adequacy ratings for all bridges recorded and rated in the E-base.
Fig.24 – Adequacy evaluation parameters [5]

23
3. Organization and Storage of the Data Base All relevant information and data collected from the visual inspection are explained with detail in a written report, including photos of all relevant observations/damages on which the bridge assessment was based (with engineering reasoning). Figure 25 shows an example of a bridge inspection report.
Fig.25 – Overview of one of the bridge inspection reports
Then, the Evaluation of the structural and operational condition based on the findings of the visual inspection is organized in excel sheets for each bridge. Figure 26 shows an example of a bridge evaluation excel sheet, which it is possible to see the condition of the four primary structural parts (substructure, scour/foundation, superstructure and bearings), and the final evaluation (pie-shaped, 0-100% scale) with the structural adequacy, the operational adequacy and the importance of the bridge.
Fig.26 – Inspection methods and locations for Frame bridges (Part of EO manual) [3]

24
Finally, the bridge electronic database (BRIDGE) is updated with the condition evaluations of the structural elements and any variations found (dimensions of structural components, bearing type, etc) of the already constructed bridge compared to the design drawings or project record.
a) Data entry tool b) Bridge data overview
Fig.27 – Bridge electronic database (BRIDGE) used by EO EO also has an excel sheet with the evaluation of all bridges over the years. This file includes the evaluation of each component (9-grade rating scale) and the final evaluation (0-100% scale). Figure 28 shows a part of this excel sheet, and each bridge is identified by its code. With a well-organized data, in the future, EO is able to define the deterioration curves of all components over time, including the variation of the condition rate of each bridge (and its elements) with maintenance actions. Fig.29 shows the variation over time of the condition rate of a bridge (and its elements) with maintenance actions (cobweb format).
Fig.28 – Excel sheet with the evaluation of all bridges over the years, developed by EO
EO has developed an excel sheet which indicate, for each bridge, the main damage observed in the visual inspection which justifies the assignment of the condition state (the written report of visual inspection describes all damages observed). Fig.30 shows the variation over time of the condition rate of a bridge (and its elements) with maintenance actions (cobweb format). Figure 30 shows part of excel sheet with the main damage observed in the visual inspection for each bridge. There are also maps with the location of all bridges with a specific damage (for example: cracks, corrosion, etc). Figure 31 shows a map with all EO bridges with corrosion damage, separated by 3 levels of severity (marked with different colors).

25
Fig.29 – Variation over time of the condition rate of a bridge (and its elements) with maintenance actions
Fig.30 – Part of excel sheet with the main damage observed in the visual inspection for each bridge
Fig.31 – Map with all EO bridges with corrosion damage
26
3.1.4. CASE STUDIES
Generally, the bridges of Egnatia Motorway network are in good condition. However, there are some interesting particular cases, namely the following observations collected during visual inspections:
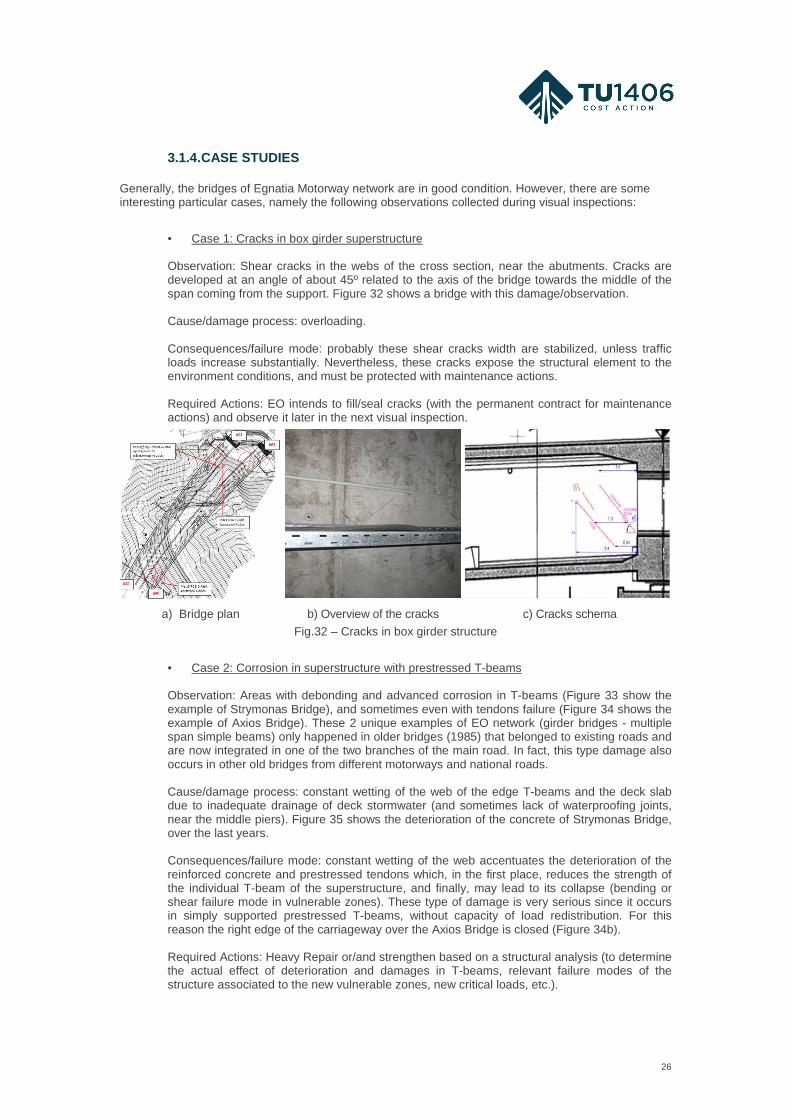
• Case 1: Cracks in box girder superstructure
Observation: Shear cracks in the webs of the cross section, near the abutments. Cracks are developed at an angle of about 45º related to the axis of the bridge towards the middle of the span coming from the support. Figure 32 shows a bridge with this damage/observation. Cause/damage process: overloading. Consequences/failure mode: probably these shear cracks width are stabilized, unless traffic loads increase substantially. Nevertheless, these cracks expose the structural element to the environment conditions, and must be protected with maintenance actions. Required Actions: EO intends to fill/seal cracks (with the permanent contract for maintenance actions) and observe it later in the next visual inspection.
a) Bridge plan b) Overview of the cracks c) Cracks schema
Fig.32 – Cracks in box girder structure
• Case 2: Corrosion in superstructure with prestressed T-beams
Observation: Areas with debonding and advanced corrosion in T-beams (Figure 33 show the example of Strymonas Bridge), and sometimes even with tendons failure (Figure 34 shows the example of Axios Bridge). These 2 unique examples of EO network (girder bridges - multiple span simple beams) only happened in older bridges (1985) that belonged to existing roads and are now integrated in one of the two branches of the main road. In fact, this type damage also occurs in other old bridges from different motorways and national roads. Cause/damage process: constant wetting of the web of the edge T-beams and the deck slab due to inadequate drainage of deck stormwater (and sometimes lack of waterproofing joints, near the middle piers). Figure 35 shows the deterioration of the concrete of Strymonas Bridge, over the last years. Consequences/failure mode: constant wetting of the web accentuates the deterioration of the reinforced concrete and prestressed tendons which, in the first place, reduces the strength of the individual T-beam of the superstructure, and finally, may lead to its collapse (bending or shear failure mode in vulnerable zones). These type of damage is very serious since it occurs in simply supported prestressed T-beams, without capacity of load redistribution. For this reason the right edge of the carriageway over the Axios Bridge is closed (Figure 34b). Required Actions: Heavy Repair or/and strengthen based on a structural analysis (to determine the actual effect of deterioration and damages in T-beams, relevant failure modes of the structure associated to the new vulnerable zones, new critical loads, etc.).

27
a) Overview of the new and old bridges b) Areas with advanced corrosion in T-beams (old bridge)
c) Corrosion in T-Beam and middle pier d) Advanced reinforcement corrosion and loss of section
Fig.33 – Strymonas Bridge
a) Overview of the bridge b) Right edge of the carriageway closed
c) Wetting of the web of the edge T-beam b) Advanced corrosion and tendons failure
Fig.34 – Axios Bridge

28
a) Deterioration of concrete in a middle pier b) Deterioration of concrete in T-beam
Fig.35 – Damage evolution of Strymonas Bridge
• Case 3: Scour near shallow foundation
Observation: Scour near shallow foundation of the abutment. Figure 36 shows a bridge with this damage/observation (bridge superstructure with prestressed concrete T-beams and continuous deck slab). Cause/damage process: erosion of soil around the base of abutment due to inefficient stormwater drainage system. Consequences/failure mode: settlement of the abutment and lack of support of the superstructure. Figure 37 shows the weight of the scour/foundation condition rating (1 to 9) in the final evaluation of the bridge (0 to 100%). In this particular case, the scour condition rating should be 5 (non-severe erosion / need protection) as the rest primary structural parts of the bridge (superstructure, infrastructure and bearings) have condition rating 9/8/8, and the final evaluation is over 80%. For instance, if the scour condition rating was 3, the final evaluation should be 55%, which means bridge requires immediate repair actions. Required Actions: protection of the soils around the abutment and install a drainage system for stormwater (with the permanent contract for maintenance actions, to be executed within 2 years) and observe it later in the next visual inspection.
a) Overview of the bridge b) Inefficient drainage system c) Erosion of soil
Fig.36 – Scour near shallow foundation

29
Fig.37 – Final evaluation of the bridge (0-100%) depending on scour condition rate (1-9)
For the reasons stated above (especially case 2), EO prioritizes all necessary maintenance actions for drainage and expansion joints in order to preserve the superstructure of bridges, as well for the bearings. Expansion joints is the bridge component that most concerns EO with maintenance actions, because of its reduced durability and for safety reasons. Figures 38a b and c show respectively, an example of inadequate drainage of deck stormwater in a new bridge, an example of expansion joint deterioration (covered by asphalt for safety reasons), and a bearing in good condition after maintenance actions.
a) Inadequate drainage b) Joint deterioration c) Bearing after maintenance actions
Fig.38 – Damages and maintenance actions in EO bridges

30
3.2. ANALYSIS OF EGNATIA ODOS S.A. QUALITY CONTROL PLAN IN VIEW OF COST TU1406 – WG3 TECHNICAL REPORT
This sub-chapter intends to analyze the Egnatia Odos S.A. Quality Control Plan (E_QCP) in the view of COST TU1406, based on the comparison of E_BMS with the recommendations indicated in the sections of the WG3 Technical Report. This sub-chapter also explain the reasons why the E_QPC does not use certain concepts suggested by the WG3 Report, and indicates the necessary procedures in order to improve E_BMS. On other hand, this sub-chapter is an independent analysis and review of the WG3 report, with case studies, in order to simulate a possible improvement of this Cost Action.
3.2.1. GENERAL CONSIDERATIONS
According with the section 2 of WG3 report, it can be said with certainty that E_QCP is sufficient and adequate to ensure quality of Egnatia Motorway network bridges, where are specified all activities and tools needed (extent and interval of inspections or investigations to estimate KPIs and forecast future development, maintenance action based on the forecast of KPIs, etc.). Comparing with the section 3 of WG3 report, in order to ensure Quality of Bridges, EO has almost full information from the bridges design phase (including drawings) of Egnatia Motorway Network (90-95%), which includes valid codes, relevant loading cases, etc (see WG3 report, section 3.1 Design and construction – acceptance criteria). EO also has inspection/monitoring/tests to determine if bridges meet the desired/required quality which can differ from the one ate the time of commissioning (so-called static quality assessment – snapshot – included in section 3.2 Inspection and monitoring of WG3 report). WG3 report also suggests that BMS (section 3.3 Operation and maintenance) must include maintenance planning & execution, with short-term maintenance and mid- to long-term maintenance planning. Short-term maintenance is based on detailed specifications for interventions that are to be taken shortly thereafter. The mid- to long-term maintenance planning develop different scenarios in order to choose different interventions among preventative, corrective and operation actions. WG3 also says that these interventions are not specified in detail and their costs are rough estimates backed by experience. The general approach to mid- to long-term maintenance planning is based in 2 interventions (1 – TOP, lower long term costs; 2 – TUL, intervention needs to be executed no later than at that point in time). E_BMS includes maintenance planning & execution, based on visual inspections and other in-depth investigations (snapshot) as well EO is aware of the Commissioning dates and the expected life-cycle of their bridges (120 years). Of what is known, EO does not define the 2 interventions (Top and Tul) to complement its snapshots (visual inspections), in order to have a mid- to long-term maintenance planning as WG3 report describes. However, EO is aware about its bridges life-cycle and considers that maintenance actions should be done as soon as possible, within the annual financial resources available, as explained in sub-chapter 3.1.2 of this STSM report (E_BMS - Repair program and maintenance plan). As an experienced bridge management agency, EO intends to avoid unpleasant surprises and, if it is possible, to choose optimal time for interventions in order to minimize its costs. This subject will be discussed with more detail in sub-chapter 3.2.4 of this STSM report (Dynamic QC Framework – Maintenance Scenarios). For now, it is important to distinguish 3 different considerations:
• Remaining service life: As stated in WG3 report, it represents a point in time at which reliability or safety will reach some threshold value (Reliability rating 5 in WG3 Scale, which means unacceptable return of period for a failure – structural failure or operational failure; intervention needs to be executed no later than at that point in time – TUL intervention).
• Design Structural life-cycle: time period which probability of failure is not exceeded (according to valid codes that supports design of bridges), taking into account the characteristic values for actions and the degradation of the resistant materials within this period (for instance, the beginning of the oxidation of concrete reinforcing steel).
• Design Functional life-cycle: time period in which a bridge fits in its purpose, taking into
account the grown of traffic, based in economy studies (serviceability of the bridge).

31
3.2.2. KEY PERFORMANCE INDICATORS
Comparing with WG3 report (section 3.4 Key Performance Indicator for existing bridges), E_BMS takes into account only the Reliability as a Key Performance Indicator (KPI).
• Reliability
As mentioned in WG3 report, Reliability is the probability of structural failure (i.e. safety) or operational failure (i.e. serviceability). EO bridges evaluation is focus on the structural adequacy or integrity of the bridge (structure safety) and the operational adequacy (bridge serviceability), which is very similar with this WG3 KPI (Reliability). EO distinguish these 2 different evaluations, unlike WG3 Reliability which unite both concepts (structural safety and serviceability). This STSM report considers that concept “Serviceability” is not directly related with “Safety” because, even with the worst rating of “Serviceability” in a bridge, is it considered that additional safety maintenance actions are applied immediately in order to guarantee the users safety. The operational adequacy evaluation of EO (serviceability) takes into account with wearing surface condition, superstructure geometry, joints condition, hydraulic adequacy, or transition with the road. For instance, if a bridge has a wearing surface in poor condition, a deep and dangerous transition with the road or deformation of superstructure (assuming that is the worst possible condition rating for “serviceability”), it is considered that road signs and signals will be placed immediately in order to reduce the velocity of vehicles (thus ensuring the safety of users and reducing Level of service - LOS).
• Safety
As mentioned in WG3 report, Safety is related to minimizing or eliminating the harm to people during the service life of a bridge. The loss of life and limb due to structural failure is not included (see Reliability). The most common problems related to Safety in Egnatia Motorway Network are joints deterioration and damaged railings because of the circulation and impacts of vehicles. EO intends to eliminate immediately all this kind of damages in bridge components. As stated above, EO has patrol teams that cross the motorway permanently and a permanent contract with a specialized company in order to take the necessary maintenance actions in short term. In this sense, E_BMS doesn’t consider the KPI-Safety because its priority is to eliminate permanently the harm to people during service life of bridges and no other scenarios are considered. In case of joints, sometimes and for safety reasons, some part of this element can be taken off the road and be replaced by asphalt (short term maintenance action) as is it shown in figure 38b (sub-chapter 3.1.4. Case Studies). Thus, for this situation, in the view of WG3 report Safety level should be 1 but the Reliability level should at least 3, because some part of the joints aren’t waterproofing and doesn’t protect the superstructure. Generally, Egnatia Motorway Network are quite new and they don’t have yet any falling chunks situation in reinforced concrete (deck), which is another typical safety problem in this kind of bridges.
• Economy
As mentioned in WG3 report, Economy is related to minimizing long-term costs and maintenance activities over the service life of a bridge. Of what is known, E_BMS doesn’t consider the KPI-Economy. However, as explained in sub-chapter 3.1.2 of this STSM report (E_BMS - Repair program and maintenance plan), EO is aware that the superstructure repair cost curve increases deeply after 7-8 condition rating score, and the required maintenance actions should be done as soon as possible. Taking into account the sub-chapter 3.1.4. Case Studies of this STSM report (Case 2), the most relevant damage in superstructure is corrosion, being originated by constant wetting of the web of the beams and the deck slab due to inadequate drainage of deck stormwater (and sometimes lack of waterproofing joints, near the abutments and middle piers). In this sense, in order to minimize long-term costs and maintenance activities over the service life of EO bridges and assuming that these necessary interventions are not specified in detail and their costs are rough estimates backed by experience (view of WG3 report), it can be said

32
that the optimal/logical procedure (until this period of life of EO bridges) is to do regular maintenance actions in drainage system for stormwater and expansion joints (which in fact is the management strategy of EO). It would be interesting to know the average life-cycle of these components (joints and drainage system) and to establish the optimal time between interventions, in order to preserve the Structural life-cycle (120 years as predicted by design).
• Availability
As mentioned in WG3 report, Availability is the proportion of time a system is in a functioning condition. It is not reliability-related disruption of bridge users but originates from planned maintenance interventions (e.g. additional travel time due to an imposed traffic regime on bridge). E_BMS doesn’t consider the KPI-Availability. Depending on the average annual daily traffic in the Egnatia Motorway Network, it would be interesting to know the additional travel time due to expansion joints maintenance actions (in order to guarantee Safety-KPI ate level 1 permanently), as well due to the closure of the right edge of the carriageway over the Axios Bridge (Case 2 – edge T-beam with advanced corrosion areas and with tendons failure).
• Environment
As mentioned in WG3 report, Environment is associated with minimizing the harm to environment during the service life of a bridge. E_BMS doesn’t consider the KPI-Environment.
3.2.3. EVALUATION OF RELIABILITY BASED ON STATIC QC FRAMEWORK
WG3 considers the evaluation of KPIs based on “engineering judgement”. The QCP in WG3 includes both static (snapshot) and dynamic quality control where it accounts for diverse maintenance scenarios and KPI development over time (section 7.10 of WG3 report). This sup-chapter intends to compare the Egnatia Odos S.A. general procedure for assessing the condition of bridges (Reliability) with the WG3 Quality Control Framework (sections 5, 6, 7 and 8 of WG3 report). This sup-chapter just compare the first stage of QCP – Static (snapshot). The static approach (snapshot) of WG3 contemplates several tasks: Preparatory Work including inventory information, conceptual weakness (vulnerable zones), comparison between current traffic loads with load model (original design), analysis of previous inspections, evaluate a priori reliability; Inspection on site (identify damages, measure on site material properties, collect samples); Lab test; Assessment of reliability KPI. E_QCP includes all these activities in order to evaluate Reliability of each bridge (sub-chapter 3.1. of this STSM report). The proposal of WG3 report for the evaluation of KPIs takes the form of a diagram exposed in the sub-chapter 2.1 of this STSM report. In order to evaluate Reliability, WG3 also considers that some factors included in its diagram must be registered: Component; Observation; Vulnerable zone; Failure mode. Damage Process and Time are omitted in this sub-chapter since it is of no importance for the snapshot assessment.
• Component
As stated in sub-chapter 3.1 of this STSM report, each EO bridge is divided into 6 structural parts and each one has several components: Substructure (components: abutment, middle pier, shallow foundation, foundation with piles); Superstructure (components: T-section beam, slab, box girder); Foundation/scour; Bearings; Joints; Road surface (components: pavement, sidewalk, drainage system). EO has a reliable inventory with the information of construction type of all bridges as well the design and construction dates (90-95%). EO overall adequacy evaluation of the bridge is based in the final rating of the structural condition of the four primary structural parts: substructure, scour, superstructure and bearings.

33
Table 8.1 of WG3 report suggests girder and frame bridges to be divided in 3 groups: superstructure, substructure (including abutments, piers and foundations) and equipment (including bearings and joints). Comparing EO evaluation with WG3 report, the obvious difference are the bearings, because EO considers it as a structural element and for WG3 bearings are mainly mechanical replaceable parts of the structure. WG3 Quality Control Framework does not count with “scour” (which is included in the section 10. Quality Control Framework to sudden events, of WG3 report) unlike EO evaluation that considers “scour” as a primal factor for bridge condition rating.
Organization and Storage of this Data Base: Of what is known, E_BMS register each structural part (substructure, superstructure, etc) in a excel sheet associated to its final evaluation (9-grade rating scale rating). However, the information of the components that support the evaluation of each structural part (e.g. abutments, middle piers, etc) is only available in the written report.
• Observation
As stated in sub-chapter 3.1 of this STSM report, EO has a specific manual which defines a clear failure criteria for some structural damages like cracks (crack width severity scale), depending on different type of superstructures (prestressed or reinforced concrete). Based on the evaluation Tables (P1, P2, S1, etc.), its description about material deterioration (for example: cracks, reinforcement corrosion, efflorescence, etc.), its causes (for example: structural or non-structural cracks caused by traffic loads) and its severity (for example: crack width, loss of reinforcement cross section, etc.), as well taking into account the know-how of the bridge inspectors (with engineering reasoning), EO inspection teams are able to assign the condition rate with uniformity and the same criterion. This EO procedure matches with the section 5 (Performance indicators and observations) of WG3 report, which say that the relationship between observations in bridge inspections and PIs is essential part of quality control for bridges (interpretation of observations impact on a bridge performance). WG3 report considers that all observations (including irrelevant damages) should be recorded for future reference, but only observations related to vulnerable zones (regarding structural reliability) must be in a excel framework. The most critical observation are highlighted (orange colour). Organization and Storage of this Data Base: Of what is known, EO has developed an excel sheet which indicate, for each bridge, the main damage observed in the visual inspection which justifies the assignment of the condition state. There are also maps with the location of all bridges with a specific damage (for example: cracks, corrosion, etc) based on organized information in excel sheet. However, other non-critical observations (in other components) are only available in the written report.
• Vulnerable zone
WG3 report considers that “vulnerable zones are those segments and/or elements of a bridge structure in which damages have the largest impact on safety and serviceability. One vulnerable zone may be related to several failure modes”. WG3 also says that “experienced inspectors know intuitively where the vulnerable zones are, but they can reassure themselves with readily available information”. As stated in sub-chapter 3.1 of this STSM report, EO has experienced inspectors and a specific manual with guidelines to check specific zones of each structure (“inspection locations”), which are considered essential for a good structural functionality (anchorage areas, shear zones, tension zones, etc.). These so-called "inspection locations" by EO, are the same as WG3 report calls "vulnerable zones".

34
WG3 report considers that “damages outside vulnerable zones can also trigger failures, but for them to occur the extent of damages need to be significantly larger than in the vulnerable zones. If this seems likely, one needs to define an additional failure mode that can be triggered by the observed damages”. As stated in sub-chapter 3.1.4.Case Studies of this STSM report, in Case 2, damages are outside vulnerable zones (Axios Bridge and Strymonas Bridge). Figure 39 compare the typical locations of vulnerable zones (WG3 report) in girder bridges (multiple span simple beams) along relationship to a failure mode (bending, shear) with the observed damages in Strymonas Bridge, outside typical vulnerable zones. These observed damages can trigger many different failure modes. Organization and Storage of this Data Base: Of what is known, EO information about vulnerable zones or the observed damages outside typical vulnerable zones is only available in the written report of each bridge inspection (without excel sheet data base).
Fig.39 – Damages outside vulnerable zones (case study 2)
• Failure mode
WG3 report considers “Failure mode” as the structural collapse mechanism of the bridge associated to each damage observed in visual inspection. As stated above, EO evaluation of Reliability is based on “engineering judgement”, taking into account the know-how of the bridge inspectors (with engineering reasoning). EO experienced inspectors know intuitively what may be the possible failure modes associated to several kind of damages, as they know the different type of bridge structures in its network (90-95% of bridges have design phase information). Usually, EO doesn’t report the possible failure mode associated to each damage observed in visual inspection, as those damages are not so sever and its bridges are quite young and in good condition (in general). A good example is the Case 1 stated in sub-chapter 3.1.4 of this STSM report, which considers that shear cracks in box girder superstructure, eventually because of overloading, probably are stabilized (unless traffic loads increase substantially). However, in Case 2, the observed damages (more sever) can trigger many different failure modes. In this situation, EO prefers to perform a structural analysis using adequate software, with information from design phase and eventually from in-depth investigations (Destructive and Non-Destructive Tests). This methodology intents to determine the effect of deterioration and damages by changing section and material (in damage zones), in order to assess bridge condition with more accuracy. In this sense, it is possible to determine the critical failure mode associated to a certain vulnerable zone and the respective critical load. Figure 40 shows many different failure modes that can be triggered by with the observed damages in Strymonas Bridge, outside typical vulnerable zones. There are 4 possible failure modes: bending failure in zone A or B; shear failure in zone A or B. Another possible failure mode could be the bending failure in HMS zone due to a tendon failure in any section of the prestressed beam. The critical failure mode, among these failure possibilities only can be determined with more accuracy based on structural analysis results.

35
Fig.40 – Possible failure modes (case study 2)
In Case 3, the observed damages (scour near shallow foundation of the abutment) can trigger a failure mode without any bending or shear failure in typical vulnerable zones of superstructure (prestressed concrete T-beams and continuous deck slab). This failure mode, which consists in the settlement/displacement of the abutment (zone D), is more related firstly with the serviceability of the bridge (because of the possible deep transition between road and bridge, which could lead to additional maintenance actions like inserting new road signs and signals in order to reduce the velocity of vehicles). Structural collapse (structure safety) only occur if this damage causes the lack of support of superstructure. Figure 41 shows the typical vulnerable zones of the bridge (case 3) and the possible failure modes in association with the damage observed: FM1 associated to the displacement of the superstructure (Reliability affected by serviceability factor); FM2 associated to the lack of support of the superstructure (Reliability affected by structure safety factor). EO bridges evaluation can distinguish these 2 “failure modes” with structural adequacy or integrity of the bridge (structure safety) and the operational adequacy (bridge serviceability). In case of WG3 Reliability, only with two different scales (1 to 5) created for each of these different concepts (structural safety and serviceability) it is possible to distinguish both concepts. Of what is known, WG3 Reliability evaluation is conditioned by the worst condition between these 2 concepts (e.g. on mid- to long-term maintenance planning, the TUL - Intervention 2 – is triggered by the failure mode of serviceability and safety is fulfilled). In fact, WG3 report only considers “scour” in the section 10. Quality Control Framework to sudden events. However, in Table 5.3 (Common drivers for the selected Performance Indicators), “displacement”, as an observation / performance indicator, can be associated to “changing geotechnical properties”, as a damage process. In this Case 3, “scour” or “changing geotechnical properties” has the same effect in the structure.

36
Fig.41 – Possible failure modes (case study 3)
Organization and Storage of this Data Base: Of what is known, EO information about failure modes is only available in the inspection written report or in structural analyses software for each bridge (without excel sheet data base).
• Reliability
Reliability is usually so-called as “condition rating” in most countries, mainly on an element level, as a measure of the deviation from the “as new” condition. The global condition rating of a whole bridge structure is commonly calculated by summing up the weighted contributions of the element condition ratings. WG3 draws attention to the fact that, commonly, the condition rating (reliability) is given without a more detailed explanation, and thus the information of specific damages are lost. As stated in sub-chapter 3.1 of this STSM report, EO overall adequacy evaluation of the bridge is based in the final rating of the structural condition of the four primary structural parts: substructure, scour, superstructure and bearings. Comparing EO evaluation with WG3 report, the obvious difference are the bearings, because EO considers it as a structural element and for WG3 bearings are mainly mechanical replaceable parts of the structure (bearing are in Equipment group - Table 8.1 of WG3 report). WG3 doesn’t define with detail the weight that should have each component (e.g. bearings). WG3 Quality Control Framework does not count with “scour” (which is included in the section 10. Quality Control Framework to sudden events, of WG3 report) unlike EO evaluation that considers “scour” as a primal factor for bridge condition rating.
Organization and Storage of this Data Base: Of what is known, E_BMS register the evaluation (Reliability – 9-grade rating scale rating) of each structural part (substructure, superstructure, foundation/scour, bearings, joints, etc.) in a excel sheet, as well the final evaluation focus on the structural adequacy or integrity of the bridge (structure safety – 0-55%) and the operational adequacy (bridge serviceability – 0-30%).
In summary, taking into account all the analyzed factors included in WG3 diagram and comparing with the protocol (static), included on WG3 QC Framework, Figure 42 show what should be the aspect of the EO organization and storage of Data Base (for the three case studies stated above). All data indicated in figure 42 are merely exemplary for the case studies and do not represent the real evaluation of EO (component; year; KPI; Performance Indicator). Performance Indicator (PI) of Reliability is presented with the EO evaluation rates (0-100% in general, or 9-grade rating scale for each component). EO chose this 9-grade rating scale in order to distinguish better the priorities in its network. The cells in white color represent all EO data base which are organized in excel format. The green cells indicate the information that E_BMS doesn’t have available in excel sheet, namely the failure modes and the vulnerable zones. WG3 report considers that all observations (including irrelevant damages) should be recorded for future reference, but only observations related to vulnerable zones (regarding structural reliability) must be in a excel framework. The most critical observation are highlighted (orange colour).

37
Of what is known, E_BMS register all damages in written reports of visual inspections (word format). EO register the most critical observation for each bridge in a excel framework, but is not related to any mode of failure or vulnerable zone. Other damages (non-critical – with higher evaluation rating) aren’t register in excel. For instance, in Case 1, if critical observations (shear cracks) are similar in both spans, near the abutments (PI=6 for superstructure), these 2 observations are registered in excel sheet. In Case 2, without a structural analysis it is possible to approach several failure modes (with different probabilities of collapse) and related them with PI evaluations (e.g. FM1 - PI=6; FM2 - PI=6; FM3 - PI=3; FM4 - PI=3; FM5 - PI=5 – superstructure evaluation). EO only register the lowest PI associated to the critical failure mode (or critical load) taking into account the structural analysis results. Other possible failures (green cells) are omitted in excel sheet (only available in the structural analysis software). In Case 3, the critical observation is the scour. However this observation can be related with different failure modes: FM1 - regarding serviceability; FM2 - regarding structural reliability. For FM1, taking into account the operational failure (i.e. serviceability), the critical observation should be (for instance) the transition between road and bridge (because of abutment displacement/settlement) and this evaluation is from 0 to 30% (including many other evaluations such as road surface, joints, hydraulic adequacy) For FM2, taking into account the structural adequacy (i.e. structure safety), the critical observation should be scour and this evaluation is from 0 to 55% (including many other evaluations such as superstructure, infrastructure, bearings).
Fig.42 – Protocol (static) of WG3 QC Framework for EO case studies
Component Construction type Year Failure ModeVulnerable
ZoneObservation KPI
Span ΔA0 - ΔM1prestressed
concrete2000
Shear Failure
modeHSS Crack
Reliability
(structure safety)6
Span ΔM3 - ΔA1prestressed
concrete2000
Shear Failure
modeHSS Crack
Reliability
(structure safety)6
FM1 - Bending
Failure (B)B
Corroded
reinforcement
Reliability
(structure safety)4
FM2 - Shear
Failure (B)B
Corroded
reinforcement
Reliability
(structure safety)4
FM3 - Bending
Failure (A)A
Corroded
reinforcement
Reliability
(structure safety)3
FM4 - Shear
Failure (A)A
Corroded
reinforcement
Reliability
(structure safety)3
FM5 - Bending
FailureHMS
presstressing
cable failure
Reliability
(structure safety)5
Infrastructure Abutment ΔA1
reinforced concrete
(shallow
foundation)
2000FM1 -
DisplacementD
displacement
(deep transition
between road
and bridge)
Reliability
(serviceability)
0-30%
Foundation or
ScourAbutment ΔA1
reinforced concrete
(shallow
foundation)
2000
FM2 - Lack of
support of
superstructure
D Scour
Reliability
(structure safety)
0-65%
T-beam 1 (Span
AM6 - AM7)
prestressed
concrete1985 3
86%T-beam
bridge
Case 1
Case 2
Case 3
SuperstructureT-beam
bridge
Performance IndicatorStructure
Concrete
box girder
bridge
Superstructure 6

38
3.2.4. DYNAMIC QC FRAMEWORK
The second stage of QC Framework is the dynamic quality control where it accounts for diverse maintenance scenarios and KPI development over time (section 7.10 of WG3 report). The dynamic approach of WG3 contemplates several tasks: Assessment of the remaining service life, including assessment of speed of active Damage Process, damage forecast, reliability and safety development over Time; Maintenance scenarios, including reference scenario (intervention at the end of service life), preventive scenario, estimate of long term cost – both scenarios, estimate of availability for both scenarios; estimate an effect of maintenance on Reliability and safety. This sup-chapter intends to compare the Egnatia Odos S.A. with the WG3 Quality Control Framework, in order to know if EO has maintenance scenarios and how is assessed the remaining service life of bridges (taking into account with “Damage process” and “Time” included in the diagram exposed in the sub-chapter 2.1 of this STSM report).
• Assessment of the Remaining service life
As stated in WG3 report, Remaining service life represents a point in time at which reliability or safety will reach some threshold value (Reliability rating 5 in WG3 Scale, which means unacceptable return of period for a failure – structural failure or operational failure; intervention needs to be executed no later than at that point in time – TUL intervention).
Of what is known, WG3 Reliability evaluation is conditioned by the worst condition between 2 concepts: structure safety (structural failure) and serviceability (operational failure). This means that it may exist 2 different Remaining service life.
The first option for remaining service life – structure safety (structural failure) – doesn’t match necessarily with Design Structural life-cycle (e.g. EO bridges with design life of 120 years) because the concepts of return of period for a failure are quite different. For instance, after the expiry of the period the Design Structural life-cycle of a bridge, it means the probability of failure (according to valid codes) is now exceeded, but for sure this probability is within acceptable return of period for a failure (e.g. Reliability = 2 in WG3 Scale).
The second option for remaining service life – serviceability (operational failure – LOS service) – doesn’t match with Design Structural life-cycle (e.g. excessive deflection, Vibration, Local deformation, also because of different concepts of return of period for a failure) but it can match eventually with Design Functional life-cycle (time period in which a bridge fits in its purpose, taking into account the grown of traffic, based in economy studies).
In order to assess remaining service life of bridges, following the diagram exposed in the sub-chapter 2.1 of this STSM report, two concepts must be taking into account: “Damage process” and “Time”.
o Damage Process and Time
Table 5.3 of WG3 report indicates Common drivers for the selected Performance Indicators. For each observation (e.g. cracks, spalling, displacement, prestressing cable failure, etc.) made during a visual inspection, several and possible damage process are associated (overloading of an element, corrosion related to reinforcement steel, changing geotechnical properties, corrosion related to prestressing steel, etc.). In WG3 report, there are no suggestions for speed of active Damage Process, in order to stablish a future damage forecast and reliability/safety development over Time. In the Design phase, in order to determine the Structural life-cycle, some speed of damage process are estimated, but not so many (e.g. corrosion related to reinforcement steel in association with the carbonation of concrete, corrosion related to reinforcement steel in association with attack of chlorides, velocity of corrosion in unprotected steel in marine environment, etc.). However, this speed is not linear and it can increase sharply after the first damages occur (after expiry of the period the Design Structural life-cycle).

39
As stated in sub-chapter 3.1 of this STSM report, EO evaluation of bridges is aware of damage process for each observation, and as well has a specific manual for visual inspections which takes into account the deterioration of concrete bridges and structures (mechanical, physical and chemical processes) and explain with detail types of concrete deterioration (carbonation, discoloration, cover debonding), efflorescence, chloride ions penetration into concrete, spalling, cracking and collisions (also describes the types of deterioration for joints and bearings). EO knows the importance of the relation between Damage Process and Time, in order to determine the remaining service life of bridges, as its empirical models to predict life-cycle maintenance costs were presented at TRA. Nevertheless, those evaluation was based on the inspection of 216 old concrete bridges in Greece (from 1935 to 1995), which are quite different (e.g. different durability design valid codes) of the new bridges of Egnatia Motorway Network (design life of 120 years). For instance, an example like the Case 1 (stated in sub-chapter 3.1.4 of this STSM report), with cracks in the superstructure (Observation / Performance Indicator) eventually because of overloading (damage process), the speed of active Damage Process is very difficult to predict in order to stablish a future damage forecast and the reliability development over Time. In this sense, a mid- to long-term maintenance planning based on these estimates of “Damage Process” and “Time”, may not be reliable. In this situation, EO procedure is the same as any responsible agency, using instrumentation (fissurometer) to observe crack width over time. Usually, agencies like EO and others (e.g. in Portugal, IP – Infraestruturas de Portugal) only predict damages and reliability of bridges over time until the next programmed inspection.
a) Overview of the vertical crack b) Fissurometer
Fig.43 – EO crack width control with instrumentation
Organization and Storage of this Data Base: Of what is known, EO information about damage process is only available in written reports of visual inspections. EO doesn’t have any information about Time, which means no information about Remaining Service Life. EO also has an excel sheet with the evaluation of all bridges over the years, which means if each evaluation is associated with the respective damage process, in future, EO is able to define the deterioration curves of all components over time, including the variation of the condition rate of each bridge (and its elements) with maintenance actions. Probably, for the component “joints” it can be less difficult to predict the Remaining Service Life, since life-cycle of these elements are quite shorter (comparing with structural components) and there will be more statistical data.

40
• Maintenance Scenarios
As stated above, WG3 report suggests that BMS must include maintenance planning & execution, with short-term maintenance and mid- to long-term maintenance planning. The general approach to mid- to long-term maintenance planning is based in 2 interventions (1 – TOP, lower long term costs; 2 – TUL, intervention needs to be executed no later than at that point in time). Of what is known, EO does not define the 2 interventions (Top and Tul) to complement its snapshots (visual inspections), in order to have a mid- to long-term maintenance planning as WG3 report describes. After assigning the condition of bridges, EO establish a repair program and a maintenance plan. For each component rating, the deterioration that has been on-site inspected and one or more required alternative actions (maintenance or repair/replacement actions), is corresponded (as shown in figure 23). Depending on condition rating, E_BMS has a general scenario formulation with alternative maintenance actions (CR ≥ 7 “Do Nothing”; 3 < CR < 7 “Maintenance Actions”; CR ≤ 3 “Heavy Repair or/and strengthen or replace”). However, after the assessment of CR, no deadlines are set for the execution of the necessary maintenance actions / repairs, probably because EO doesn’t know precisely the speed of the respective damage process (and also it depends on the annual financial resources available). EO just has a rough estimate based on the empirical life-cycle performance for superstructures of old Greek bridges (paper presented at TRA), which repair cost curve increases deeply between 7-8 condition rating score. In this sense, EO considers that the necessary actions should be done as soon as possible, within the annual financial resources available (as stated before), but no TUL (intervention 2) is defined. As an experienced bridge management agency, EO intends to avoid unpleasant surprises. The first visual inspections of the bridges and the structures of EO were carried out very soon (2005-2008), right after the Commissioning. Based on the engineering reasoning (and in fact it is common sense too), it is obvious that TOP intervention (preventive) is always less expensive than the TUL intervention (reactive/corrective), and this should be the logical choice of each road bridges management agency. Unfortunately, in some situations, due to very late visual inspections (long after the commissioning) and taking into account an unexpected speed of some damage process (e.g. corrosion – deterioration velocity faster than the predicted in design phase), some unpleasant surprises can occur. Figure 44 shows an example of corrugated steel culverts which life-cycle predicted by design phase were overestimated due to unexpected speed of the damage process (corrosion – deterioration velocity of steel). In this sense, there are 2 Reliability curves over time: the curve provided by design phase (e.g. design structural life-cycle – 50 years) and the real curve. The first visual inspection was only carried out 25 years after commissioning. The snapshot were made very late (e.g. WG3 Reliability = 4) and so, only the TUL intervention can be predicted with the estimate of the Remaining Life Service (e.g. 10 years). The TOP intervention isn’t relevant at this stage because the first visual inspection should be done 5 years after the commissioning. Thus, risk mitigation should be applied until TUL intervention is executed (e.g. trucks load control, improve weight restriction signaling, etc.). All data indicated in figure 44 are merely exemplary and is based on field experienced. Figure 45 shows another interesting example about possible maintenance scenarios. This could be a typical case of an old steel bridge (centenary) with a very narrow lane and alternating circulation of vehicles, in which a visual inspection is made 100 years after the commissioning date. After this visual inspection it can be predicted 2 different Reliability curves over time: Real Reliability regarding structure safety; Real Reliability regarding serviceability. As stated in WG3 report, Reliability is conditioned by the worst condition between these 2 options, in order to determine the remaining service life. If Reliability is conditioned by the serviceability of the bridge, its remaining service life match with the end of the functional life-cycle of the bridge, and the necessary intervention should be substitution of the bridge. In this sense, the best scenario could be to intervene in the bridge only at the end of its functional life-cycle, which TOP intervention coincides with the TUL intervention (substitution of the bridge), and it doesn’t matter the evolution of some structural damages (if within safety limits) because

41
the costs will be the same at the end (costs of the substitution of the bridge). All data indicated in figure 45 are merely exemplary and is based on field experienced.
Fig.44 – Reliability curves over time and maintenance scenarios of corrugated steel culverts
Fig.45 – Reliability curves (structural and operational failure) over time and maintenance scenarios

42
Considering EO reality and assuming that the Case 2 (stated in sub-chapter 3.1.4 of this STSM report) is the most important regarding EO bridges reliability, in figure 46 it is shown a possible mid- to long-term maintenance planning. In this diagram there are 2 primal reliability curves over time (All data indicated in figure 46 are merely exemplary and it is not directly related with real EO evaluation):
o Reliability provided by design phase, in which it is considered a structural life-cycle of 120 years (durability), assuming the general and linear deterioration of reinforced/prestressed concrete over time (e.g. corrosion related to reinforcement steel in association with the carbonation of concrete);
o Real Reliability without maintenance actions, in which it is considered that some local damages can occur faster in the superstructure due to the deterioration of some components with short life-cycle (e.g. local corrosion related to reinforcement steel due to inadequate drainage of deck stormwater and lack of waterproofing joints);
During the first 20 years after the commissioning, if Reliability is less than 2, for WG3 scale, or more than 7, in EO evaluation scale, EO has the maintenance scenario “Do Nothing”. When the snapshot (visual inspection) evaluate Reliability with 7 or less (EO evaluation), maintenance actions should be done. In this sense, TOP and TUL interventions must be estimated in time. The TUL intervention can be predicted in time with the same criteria used for old Greek bridges (rough estimate – 60 years of remaining service life). The TOP intervention (preventive scenario) can be predicted based on the life-cycle of joints and drainage system, which can be determine by comparing the time passed (more or less 30 years in this example) between commissioning and the first evaluation of the bridge with less than 7 or 6 condition rating (due to these damage process in superstructure). Thus, maintenance actions should be done in every 30 years (rough estimate), which includes substitution of joints, drainage elements, and local repairs of reinforced concrete. After each maintenance action the Reliability of the bridge should be leveled with Reliability curve provided by design phase, at that point in time, because it was executed only local repairs but the majority of the structure continues its process of concrete degradation over time.
Fig.46 – Reliability curves over time and maintenance scenarios suggested for EO

43
3.2.5. GRADUAL DAMAGE PROCESSES AND SUDDEN EVENTS
In section 4 of WG3 report it is considered 2 different approaches for Damage Processes: Gradual observable / non-observable Damage Process and Sudden Events (natural hazards like earthquake events or floods). Within the scope of WG3, the flood hazard and the related local scour are addressed in section 10 of WG3 report (Quality control framework to sudden events). EO doesn’t have any quality control framework for sudden events regarding the flooding and local scour. Based on the almost full information about its bridges design phase (including drawings), EO knows exactly the type of foundations of any bridge of Egnatia Motorway Network (90-95%). Of what is known, in all EO bridges, the substructure elements in the floodplain have deep foundation with piles. Some abutments rests in shallow foundations when soil has enough resistant. The biggest risk, in this case, is the erosion of soil around the base of abutment due to inefficient stormwater drainage system (e.g. case 3 of sub-chapter 3.1.4. Case Studies). On the other hand, for what it was stated by EO, flood events are very rare in north of Greece. Nevertheless, EO distinguishes very well gradual damage processes and sudden or extreme events, as its concerns are centered on another natural hazard: Earthquake events. EO has developed a Seismic Risk Assessment, which it is considered as one of the major risks that affect the serviceability and the integrity of EO bridges. EO bridges design and built are according with the latest national seismic code. However, catastrophic seismic event could lead to major damages on some of the more vulnerable bridges. This Risk Assessment intents to identify sections of the road most at risk form seismic activity, to assess the damage resulting from various earthquake scenarios and to make emergency plans for the aftershock situation. This STSM Report does not describe this specific methodology for Seismic Risk Assessment (with many stages: Seismic hazard model of Egnatia motorway, Seismic vulnerability analysis of bridges, seismic risk assessment software, probabilistic analysis, damage estimate, vulnerability curves, etc.). In September of 2017 a highway bridge collapses in Rodopi (Northeast of Greece) due to an extreme flood event. This bridge, spanning the Kompsatos River, wasn’t in the Egnatia Motorway Network. However, EO was called to inspect many bridges around this area, in order to evaluate their condition rating and to detect other relevant damages due to this extreme event. In this sense, it was possible to analyze and present this interesting bridge in STSM report. Figure 47 shows the overview of the bridge, before and after the collapse.
a) View of the road over the bridge (before collapse) b) News about bridge collapse (2017)
Fig.47 – Bridge over the Kompsatos River (before and after collapse) The Bridge over the Kompsatos River is quite new (no more than 20 years) and the superstructure consists in a girder bridge type, with 3 multiple span simple beams (prestressed concrete T-beams). For what is known, the infrastructure is based on shallow foundations (no design drawings were available). The flood event probably caused scour/turbulence near shallow foundation of one middle pier, and consequently this element settled or rotated. The failure mode consists in the lack of support of superstructure (one span) triggered by the settlement/rotation of the middle pier. Figure 48 shows the typical vulnerable zones of this bridge and the failure mode in association with the flood event.
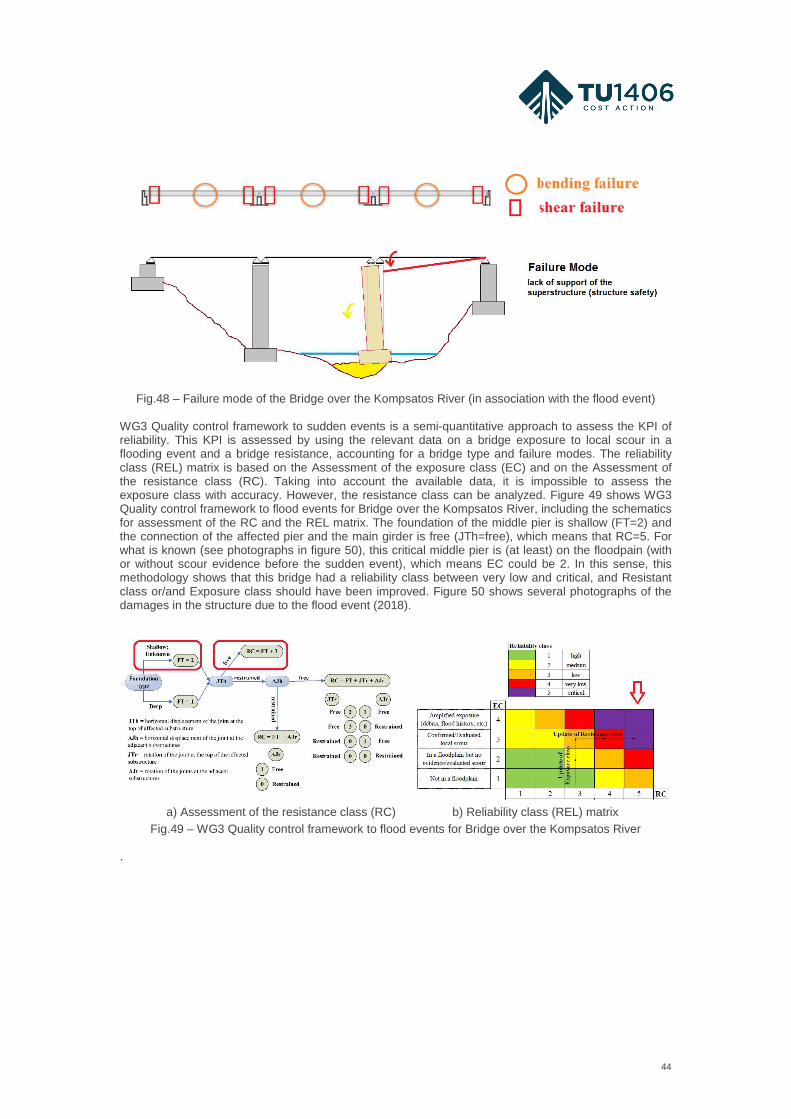
44
Fig.48 – Failure mode of the Bridge over the Kompsatos River (in association with the flood event)
WG3 Quality control framework to sudden events is a semi-quantitative approach to assess the KPI of reliability. This KPI is assessed by using the relevant data on a bridge exposure to local scour in a flooding event and a bridge resistance, accounting for a bridge type and failure modes. The reliability class (REL) matrix is based on the Assessment of the exposure class (EC) and on the Assessment of the resistance class (RC). Taking into account the available data, it is impossible to assess the exposure class with accuracy. However, the resistance class can be analyzed. Figure 49 shows WG3 Quality control framework to flood events for Bridge over the Kompsatos River, including the schematics for assessment of the RC and the REL matrix. The foundation of the middle pier is shallow (FT=2) and the connection of the affected pier and the main girder is free (JTh=free), which means that RC=5. For what is known (see photographs in figure 50), this critical middle pier is (at least) on the floodpain (with or without scour evidence before the sudden event), which means EC could be 2. In this sense, this methodology shows that this bridge had a reliability class between very low and critical, and Resistant class or/and Exposure class should have been improved. Figure 50 shows several photographs of the damages in the structure due to the flood event (2018).
a) Assessment of the resistance class (RC) b) Reliability class (REL) matrix
Fig.49 – WG3 Quality control framework to flood events for Bridge over the Kompsatos River
.

45
a) Overview of the bridge (west to east) b) middle pier rotation and span collapse
c) road over the bridge (after collapse) d) span collapse e) Joint (JTh=free)
Fig.50 – Photographs of the damages in the Bridge over the Kompsatos River due to the flood event
3.2.6. HUMAN RESOURCES AND EQUIPMENT
According to section 11 of WG3 Report, there are four main approaches in damage detection and assessment: visual inspection, non-destructive testing, probing and structural health monitoring. As outlined in sub-Chapter 3.1.2, EO is able to implement all these procedures, although the most common and least expensive are the visual inspections. In this sense, it was established a conversation with the Manager of Major Structures Monitoring Department (Bridge Division), Mr. Panagiotis Panetsos, in order to compare his opinion with the guidelines described in WG3 Report for inspectors, inspection processes and equipment (Figures 51 and 52 show the WG3 guidelines for inspectors and inspection processes, with the EO considerations signed with blue arrows).
• Inspection Frequency
EO considers that the suitable frequency for bridge inspection is 5 years (Primary Inspection). Only for the most important bridges (length distribution of the bridges L>200m) the frequency should be 3 years. Thus, the frequency of the bridge inspections should depend on bridge importance to the network (even if some bridges are located on national roads with less traffic), as well should depend on bridge condition rating (bridges with low reliability should be inspected more frequently).
• Inspectors Education and Experience
EO argues that bridge inspectors should be more qualified as possible because, even with the support of technical manuals and guidelines, some bridges have different/exceptional structural solutions and all inspectors must have a profound knowledge in this field as well an engineer reasoning. As indicated in WG3 guidelines EO considers an inspector as experienced after 5

46
years of work on field, but it is desirable that each experienced inspector, within that time (5 years), has inspected as many different bridges as possible. Important bridges do not necessarily have to be inspected by an inspector with even higher degree, but all bridges (important or not) must be observed by experienced professionals. EO agrees that there should be a mandatory initial inspectors training to improve uniformity among inspectors, and also recommends that inexperienced inspectors conduct inspections jointly with experienced inspectors in the first year.
• Refresh Training for inspectors
EO agrees with refresh trainings for inspectors and it must be conducted on field as well (not only in class). EO encourages the improvement of its professionals, and considers it is also important for inspectors to diversify their tasks and not only to perform bridge inspections, in order to develop their skills and technical knowledges (for example: execute non-destructive tests, structural analysis with software, etc.).
Fig.51 – WG3 guidelines for inspectors and inspection processes, with EO considerations
• Inspectors Rotation
EO considers that an inspector should inspect as many different bridges as possible in order to be more experienced. Nevertheless, EO agrees that it is better the same inspectors inspect the

47
same bridges as they can better assess damages over time. EO doesn’t agree that inspector rotation should be a mandatory because EO don’t believe that the same inspector might overlook other damages in a bridge over the years.
• On field
On this topic, EO agrees with the WG3 guideline. Some performance indicators require more time to be detected and assessed than others, and that’s why EO is equipped with NDT tools in order to support visual inspections. EO considers the whole report regarding inspection shouldn’t be completed on field, as it is stated in sub-Chapter 3.1.2.
• Review
Also on this topic, EO agrees with the WG3 guideline. All bridge reports must be reviewed in the office as well some part of bridge inspections must be reviewed on field (10%), preferably the most critical bridges, but this selection must also ensure every inspector is reviewed.
• Equipment
EO considers Results’ Reliability as the most important criterion for the selection of a Non-Destructive Test. For instance, EO prefers to use the ultrasonic pulse velocity test instead of the rebound hammer (unreliable).
Fig.52 – WG3 guidelines for inspectors and inspection processes, with EO considerations

48
3.3. CONCLUSIONS AND RECOMENDATIONS
According with all considerations stated above, it can be concluded that Egnatia Odos S.A. has a very good Quality Control Plan, more than sufficient and adequate to ensure quality of Egnatia Motorway network bridges, and where are specified all activities and tools needed in E_BMS. Comparing with WG3 report, in order to ensure Quality of Bridges, E_BMS includes maintenance planning & execution, based on visual inspections and other in-depth investigations (snapshot) as well EO is aware of the Commissioning dates and the expected life-cycle of their bridges (120 years). However, EO does not define the 2 interventions (Top and Tul) to complement its snapshots (visual inspections), in order to have a mid- to long-term maintenance planning as WG3 report describes. Comparing with WG3 report, E_BMS takes into account only the Reliability as a Key Performance Indicator (KPI). The general procedure of EO for assessing the condition of bridges is quite similar with the static stage (snapshot) of quality control framework of WG3. The obvious difference are the bearings, because EO considers it as a structural element and for WG3 bearings are mainly mechanical replaceable parts of the structure. WG3 Quality Control Framework does not count with “scour” phenomenon, unlike EO evaluation that considers “scour” as a primal factor for bridge condition rating. For the snapshot, WG3 report considers that all observations (including irrelevant damages) should be recorded for future reference, but only observations related to vulnerable zones (regarding structural reliability) must be in a excel framework. The most critical observation are highlighted (orange colour). E_BMS register all damages in written reports of visual inspections (word format). EO register the most critical observation for each bridge in a excel framework, but is not related to any mode of failure or vulnerable zone. Other damages (non-critical – with higher evaluation rating) aren’t register in excel. For the dynamic quality control, WG3 contemplates several tasks like Assessment of the remaining service life and Maintenance scenarios (reference and preventive). Despite doesn’t register in excel framework, EO knows the importance of the relation between Damage Process and Time (concepts of WG3), in order to determine the remaining service life of bridges. However, the speed of active Damage Process is very difficult to predict in order to stablish a future damage forecast and the reliability development over Time. In this sense, a mid- to long-term maintenance planning based on these estimates of “Damage Process” and “Time”, may not be reliable. Like many other agencies, EO only predict damages and reliability of bridges over time until the next programmed inspection (sometimes using instrumentation). EO distinguishes very well gradual damage processes and sudden/extreme events, but its concerns more are centered on earthquake events than in flooding. EO's procedure for human resources and equipment are quite similar with the guidelines described in WG3 Report for inspectors, inspection processes and equipment. Despite its very good Quality Control Plan, and taking into account that all E_BMS Data and Measurements Collection are carried out by a small team with 4 engineers, the following recommendations described below intends to be helpful for a mid- to long-term maintenance planning:
• Complement EO excel sheet with the evaluation of all bridges over the years with the evaluation of each component (already existing), but also with the respective observation, vulnerable zones, failure mode and damage process. With a well-organized data, in the future, EO is able to define/calibrate the deterioration curves of all components over Time, including the variation of the condition rate of each bridge (and its elements) with maintenance actions (and its respective costs). In this sense, in the medium term, there will be more statistical data about life-cycle of each components. This information will help to calibrate the optimal maintenance scenario (with lower long term costs) taking into account the usual and predictable “observations”, “vulnerable zones”, “damages process” and “Time” of the specific EO bridges (just better known after some decades of statistical data);
• Set visual inspections for culverts more often and not only after flood events. This type of structure is usual related with several and possible gradual damage processes due to fluvial current (aggradation and water flow section reduction, abrasion, changing geotechnical properties, corrosion of reinforcement steel), unlike other bridges (underpasses and overpasses).

49
4. FUTURE COLLABORATION
The future collaboration with the host institution will be guaranteed once, during the period spent at EGNATIA ODOS S.A., good relationship with Mr. Panagiotis Panetsos and all the team he manage at Major Structures Monitoring Department (Bridge Division). This STSM had a mutual benefit with the specific activities performed together and also strengthened the cooperation between the Home and Host institutions.
5. FORESEEN PUBLICATIONS/ARTICLES
The results will help to foresee adjustment needs in the WGs ongoing work as well as to contribute to a clear view of how to draft guidelines and recommendations for the implementation of a QC plan for roadway bridges that could be adopted by several roadway agencies. The obtained results will be disseminated within TU1406, namely to all the members
6. ADDITIONAL ACKNOWLEDGEMENTS
Many thanks to Host institution Egnatia Odos S.A. and to Mr. Panagiotis Panetsos for making possible this STSM, including as well the friendship and work contributes given by Theodoros Asimakopoulos, Zoi Mparmpa and Emmanouil Chatzimaroulas. Also thanks to COST office for giving me this opportunity.
7. REFERENCES
[1] https://en.wikipedia.org/wiki/Via_Egnatia [2] Structural Health Monitoring of Egnatia Odos bridges (PANOPTIS Kick-off Meeting, Thessaloniki, Greece 19-20.6.2018) [3] EGNATIA ODOS S.A. (2010). Visual Inspection Manual for Bridges [4] P. Panetsos, S. Lambropoulos. (2014). Life –cycle maintenance cost prediction for concrete bridges based on inspection data. TRA – Transport Research Arena 2014. Paris. [5] EGNATIA ODOS S.A. (2010). Bridges Structural and Operational Adequacy Manual [6] http://www.egnatia.eu [7] COST ACTION TU1406. (2018). WG3 Technical Report Establishment of a Quality Control Plan
8. ANNEXES
8.1. CONFIRMATION BY THE HOST INSTITUTION ON THE SUCESSFUL EXECUTION OF THE STSM
The confirmation letter is attached at the end of the report.

WWW.TU1406.EU


![LA VIA EGNATIA NELL TERRITORIO DI MACEDONIA [2009] - by MICHAELE FASOLO.pdf](https://img.pdfslide.net/doc/110x75/55cf919a550346f57b8ef089/la-via-egnatia-nell-territorio-di-macedonia-2009-by-michaele-fasolopdf.jpg)

