Embed Size (px)
Citation preview
Sea Ice-associated Diet ChangeIncreases the Levels of Chlorinatedand Brominated Contaminants inPolar BearsM E L I S S A A . M C K I N N E Y , *E L I Z A B E T H P E A C O C K , A N DR O B E R T J . L E T C H E R *
Wildlife Toxicology and Disease Program, Science andTechnology Branch, Environment Canada, Ottawa, OntarioK1A 0H3, Canada, Department of Chemistry, CarletonUniversity, Ottawa, Ontario K1S 5B6, Canada, andDepartment of Environment, Government of Nunavut,Igloolik, Nunavut X0A 0L0 Canada
Received February 13, 2009. Revised manuscript receivedApril 17, 2009. Accepted April 22, 2009.
Two global environmental issues, climate change andcontamination by persistent organic pollutants, representmajor concerns for arctic ecosystems. Yet, it is unclear howthese two stressors interact in the Arctic. For instance, theinfluence of climate-associated changes in food web structureon exposure to pollutants within arctic ecosystems is presentlyunknown. Here, we report on recent changes in feedingecology (1991-2007) in polar bears (Ursus maritimus) fromthe western Hudson Bay subpopulation that have resulted inincreases in the tissue concentrations of several chlorinated andbrominated contaminants. Differences in timing of the annualsea ice breakup explained a significant proportion of the dietvariation among years. As expected from climate changepredictions, this diet change was consistent with an increasein the consumed proportions of open water-associated sealspecies compared to ice-associated seal species in years ofearlier sea ice breakup. Our results demonstrate that climatechange is a modulating influence on contaminants in this polarbear subpopulation and may pose an additional and previouslyunidentified threat to northern ecosystems through alteredexposures to contaminants.
Introduction
There is an established link between recent climate changeand phenological, geographical, and compositional changesto ecosystems across many regions of the world (1, 2). Themagnitude of warming is regionally variable, though, and isnearly twice the global average in the Arctic (3, 4). There arereports of recent and drastic climate-related shifts in thecomposition of arctic and subarctic marine ecosystems. Innorthern Hudson Bay, there has been an increase in subarcticfish relative to arctic fish (as measured by the diet of thick-billed murre (Uria lomvia)) with decreasing July ice coverfrom 1980 to 2002 (5). Reduced sea ice, along with warmerair and ocean temperatures, has shifted the previously
benthic-dominated Northern Bering Sea ecosystem to a morepelagic, Southern Bering Sea-type (subarctic) ecosystem (6).
Environmental contamination by persistent organic pol-lutants (POPs) is also a major concern for northern ecosys-tems, despite substantial distances from source regionsfurther south (7, 8). Contamination of subarctic and arcticregions by POPs occurs mainly through long-range transportfrom lower latitudes (9). Polychlorinated biphenyls (PCB) aswell as organochlorine pesticides (OCP) including dichlo-rodiphenyltrichloroethane (DDT), hexachlorocyclohexane(HCH), and chlordane (CHL) have long been observed ascontaminants in northern biota (10, 11). Lesser known, morerecently monitored chemicals such as polybrominateddiphenyl ether (PBDE) flame retardants and perfluorinatedcontaminants (PFCs) are now also a concern in the Arctic(12, 13). As upper trophic level consumers, polar bears, aswell as humans consuming a local diet, accumulate hightissue concentrations of, e.g., PCB and CHL contaminants,which have been related to biological effects (14-16). Forinstance, endocrine, immune, and reproductive biomarkershave been correlated with tissue levels of PCBs and certainOCPs in polar bears (15, 16 and references therein).
Polar bears from the western Hudson Bay (WHB) sub-population exist near the southern limit of the range of thisspecies (Figure 1), and appear to be more impacted by recentclimate warming than their more northerly located conspe-cifics (17). Hudson Bay polar bears (as well as those from theEuropean Arctic) also have generally elevated adiposeconcentrations of organohalogen contaminants relative toother circumpolar populations (18). For this subpopulation,movement, mating and feeding depends in part on the timingand conditions of seasonal sea ice in the bay (19). In thisregion, the mean annual air temperature is on average about1.5 °C warmer (as measured at Churchill, Manitoba, 58.3°N,93.8°W) (20), and the summer sea ice breakup is aroundthree weeks earlier (20), than thirty years ago in the westernpart of the bay. Over the same period, there has been nosignificant trend in the timing of fall sea ice freeze-up inwestern Hudson Bay (20). There have been no significanttrends in winter maximum land-fast ice thickness and timingat Churchill from 1960 to 1987 (21). The increasingly earlierbreakup of the summer sea ice has been linked to lowerbody condition, birth, and survival rates in WHB bears overthe past two decades (19, 22). We hypothesized that this sea
* Address correspondence to either author. Phone: 613-998-6688(M.A.M.); 613-998-6696 (R.J.L.). Fax: 613-998-0458 (M.A.M., R.J.L.);E-mail: [email protected] (M.A.M.); [email protected] (R.J.L.).
FIGURE 1. Map of study site. The western Hudson Bay polar bearsubpopulation, indicated by the striped area, is bounded by63.10°N, 88.30°W, and by the western Hudson Bay coastal region.
Environ. Sci. Technol. 2009, 43, 4334–4339
4334 9 ENVIRONMENTAL SCIENCE & TECHNOLOGY / VOL. 43, NO. 12, 2009 10.1021/es900471g CCC: $40.75 2009 American Chemical SocietyPublished on Web 05/07/2009

ice change is also impacting WHB polar bear feeding ecology,as measured by stable isotope and fatty acid dietary tracers.Since diet is the main route of exposure to contaminants, wealso hypothesized that feeding changes would, in turn, impacttheir tissue contaminant levels.
Experimental MethodsStudy Site and Sample Details. We analyzed archived WHBpolar bear adipose tissues from seven available years overthe 17 year period of 1991-2007: 1991 (n ) 14), 1992 (n )15), 1994 (n ) 15), 1995 (n ) 15), 2001 (n ) 9), 2003 (n ) 12),and 2007 (n ) 12). Supporting Information (SI) Table S2provides further sample details. The 1990s samples wereadipose biopsies taken during polar bear tagging operations,whereas the 2000s samples were mainly pieces of adiposetissue taken from bears harvested by Inuit hunters. It hasbeen shown that there are no differences POPs patterns andconcentrations or fatty acid composition among majoradipose depots in polar bear (23, 24). All samples were initiallyand during shipment kept frozen and stored at -40 °C overthe long term at Environment Canada’s Wildlife SpecimenBank. There appears to be no change in fatty acid concen-trations and patterns between samples stored at -40 and-80 °C (25). To focus on the effect of diet on the contaminantconcentrations over time, we selected and corrected (seealso the Data Analysis Section, SI Table S2) the data set tominimize confounding factors that could contribute tointerindividual variation in contaminant levels. We selectedsamples collected in fall/winter, which were at least 3 yearsold and 80% of which were female to minimize seasonal, ageand gender related variability.
Determination of Sea Ice Breakup Timing. We calculatedthe timing of annual sea ice breakup with establishedmethods (19, 26). In brief, we determined the date when theice cover in WHB (Figure 1) was at 50% by interpolation ofweekly sea ice data from the Canadian Ice Service (http://ice-glaces.ec.gc.ca).
Diet Analysis. Traditional methods of studying feedingbehavior, such as observation of kills and analysis of gutcontents, may be biased and are limited to recently consumeditems. We thus examined changes in polar bear feeding usingtwo established dietary tracers (27, 28).
Stable carbon isotope ratios (δ13C, in ‰)
δ13C ) [( 13C/12Csample
13C/12CPeedee belemnite standard) - 1] × 1000
are not altered substantially through a food web, but maydistinguish carbon sources (29). For instance, δ13C is enrichedin benthic versus pelagic food webs; France (30) reviewedliterature on 876 marine and freshwater benthic and pelagic(phytoplankton) algae and found consistent δ13C enrichmentin benthic algae (and consumers) versus phytoplankton. Wetherefore used δ13C variation as an indicator of changes inthe proportions of benthic-foraging versus pelagic-foragingprey species in the polar bear diet. The lipid extract from thegravimetric lipid determination was used for δ13C determi-nation. Using the tip of a solvent-cleaned, unfolded paperclip,150-300 µg of lipid was weighed accurately into a 5 × 3.5mm tin capsule. Stable isotopes were combusted with anelemental analyzer and analyzed by a coupled continuousflow isotope ratio mass spectrometer (Environmental IsotopeLaboratory, University of Waterloo, Waterloo, ON, Canada).
Fatty acid (FA) patterns in mammalian predators reflectthe FA composition of their diet (28). The FA patterns ofpotential polar bear prey species from a large number (n )20-281) of individuals collected between 1992 and 2004across the Canadian Arctic and Subarctic was recentlypublished; despite some intraspecies geographic differences,the differences in FA patterns between species were larger
(31). Thus, we used changes in polar bear FA patterns overtime, in conjunction with this published prey FA data, toinfer alterations in the proportions of prey species consumed.Extraction and analysis of FAs from adipose tissue has beendescribed previously. In short, 10-20 mg of inner adiposetissue was used to avoid potentially oxidized outer tissue(32). Lipids were extracted thrice using 2:1 CHCl3:MeOH (33)containing 0.01% 2,6-di-t-butyl-4-methylphenol as antioxi-dant. 5-R-Cholestane was used as internal standard. Theextract was evaporated to dryness under N2, and lipid wasredissolved in toluene. FAs were methylated via the Hilditchreagent (32). After addition of 2% KHCO3, the organic layerwas collected and fatty acid methyl esters (FAMEs) werecompletely collected by two further extractions with hexane.FAMEs were analyzed by GC-FID equipped with a Supelco-2560 bis-cyanopropyl column and quantified against aSupelco 37 component FAME external standard (25). Here,we report only on the “dietary” FAs (i.e., those that areincorporated relatively unchanged from prey to predatoradipose tissues for a monogastric predator) (28, 32) that wereavailable for quantification based on the external standard.Each FAME was calculated as the % of total dietary FAME.
Organohalogen Contaminant Analysis. We extractedbrominated and chlorinated contaminants from polar bearadipose tissue as described previously (34) with modificationsoutlined here. We homogenized around 0.5 g of fat withsodium sulfate and spiked it with a mixture of 13C-PCBs,13C-p,p’-DDE and BDE30 internal standards. We thenextracted the contaminants with 1:1 DCM:hexane using anaccelerated solvent extractor at 100 °C and 1500 psi for onecycle. A 10% portion of the extract was used for gravimetricdetermination of lipid content. From the remainder, lipidsand other bioorganics were removed by automated gelpermeation chromatography. The extract was further cleanedup on a preconditioned (6 mL of 10% MeOH in DCM, followedby 8 mL of 5% DCM in hexane) silica (500 mg) solid phaseextraction cartridge with 8 mL of 5% DCM in hexane (35).Analysis of PCBs and OCPs by GC-MS in electron impactionization mode has been detailed elsewhere (36). PBDEswere analyzed by GC-MS in electron capture negativeionization mode as per Gauthier et al. (37), except that thesource temperature was set to 250 °C. Each contaminantconcentration (or sum of contaminant class) was calculatedon a lipid weight basis.
Quality Control for Diet and Contaminant Data. Forδ13C, duplicate analysis was performed on 13% of the samples;the mean difference between repeated measurements was0.16‰. For FA analysis, the internal standard recovery was107 ( 5%. A blank, duplicate and two reference materials,a Great Lakes herring gull egg pool and the NIST Pilot Whaleblubber SRM1945, were extracted with each batch. The %RSDfor all dietary FA values was on average 5% for the herringgull egg. The pilot whale blubber FA values were on averagewithin 15% of our laboratory results from the 2007 NIST/NOAA Interlaboratory Comparison Exercise Program forOrganic Contaminants in Marine Mammal Tissues. Thedietary FA values were on average 6% different for the polarbear duplicate analyses.
For contaminant analysis, the internal standard recoverieswere 85 ( 5%, 88 ( 8%, and 87 ( 12% for 13C-PCBs, 13C-p,p’-DDE, and BDE30, respectively. ΣPCB, ΣOCP, and ΣPBDEconcentrations in repeated analyses of SRM1945 were within5(4%, 7(3%, and 14(7%, respectively, of the NIST certifiedvalues (38, 39). In the same order, polar bear duplicateanalyses were on average 7%, 15%, and 21% different. Forthe individual or sum of contaminant classes reported inthis study, there were no values below the detection limits.
Data Analysis. As it is the overall pattern of FA thatprovides diet information (28), we performed principlecomponents analysis on a suite of dietary FAs: linoleic acid
VOL. 43, NO. 12, 2009 / ENVIRONMENTAL SCIENCE & TECHNOLOGY 9 4335
(18:2n-6), γ-linolenic acid (18:3n-6), R-linolenic acid (ALA;18:3n-3), cis-11,14,17-eicosatrienoic acid (ETA; 20:3n-3),arachidonic acid (ARA; 20:4n-6), cis-5,8,11,14,17-eicosapen-taenoic acid (EPA; 20:5n-3), cis-7,10,13,16,19-docasapen-taenoic acid (DPA; 22:5n-3), and cis-4,7,10,13,16,19-docasa-hexaenoic acid (DHA; 22:6n-3). The values of the first andsecond principles components, which accounted for 51% ofthe total FA variation, are herein referred to as FA-Index1and FA-Index2 and used in subsequent analyses.
We used simple correlation analysis to investigate therelationship of the dietary tracers (δ13C, FA-Index1 and FA-Index2) to ice breakup date. However, due to the limitednumber of years of available data, we also tested theseassociations by performing correlation analysis on the rankeddata (Table S1).
We then determined the impact of dietary changes onthe concentrations of POPs in WHB bears by comparing theannual % change in the concentration of each contaminantbefore and after diet correction. Prior to these analyses, forcontaminants consistently observed to differ in concentrationbetween sexes (ΣPCB, ΣCHL, ΣDDT), data from the smallnumber of male samples was converted to female equivalents(36). In addition, all contaminant concentrations were log(x+1)-transformed to approximate normal distribution (testedusing Shapiro-Wilk W). Annual % change controlling for dietwas calculated as (1-10b) × 100%, where b is the slope of therelationship between the contaminant concentration andthe year from a multiple regression of the log-transformedcontaminant concentration versus the dependent variables,δ13C, FA-Index1, FA-Index2 and year. Actual annual % change(i.e., without diet correction) was calculated as (1-10b) ×100%, where b is the slope of the simple regression of thelog-transformed contaminant concentration versus year. Todetermine whether the diet-controlled versus actual annual% change for each contaminant were significantly different,we compared the two b-values (slopes) using a Student’st-test. All tests were deemed statistically significant at p <0.05, marginally significant at p < 0.10 and were two-tailed.We used Statistica V6.0 (StatSoft, 2003; Tulsa, OK) for allstatistical analyses. Here, we report only on the change incontaminant concentrations; actual contaminant concentra-tions and congener patterns are outside the scope of thisstudy.
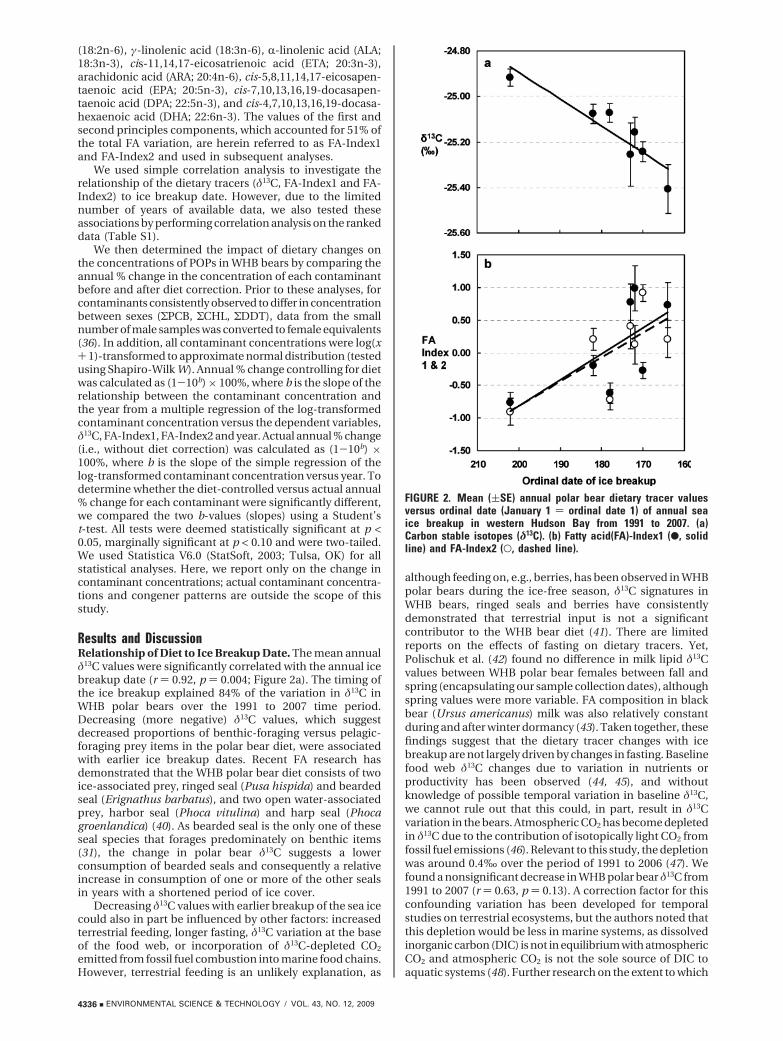
Results and DiscussionRelationship of Diet to Ice Breakup Date. The mean annualδ13C values were significantly correlated with the annual icebreakup date (r ) 0.92, p ) 0.004; Figure 2a). The timing ofthe ice breakup explained 84% of the variation in δ13C inWHB polar bears over the 1991 to 2007 time period.Decreasing (more negative) δ13C values, which suggestdecreased proportions of benthic-foraging versus pelagic-foraging prey items in the polar bear diet, were associatedwith earlier ice breakup dates. Recent FA research hasdemonstrated that the WHB polar bear diet consists of twoice-associated prey, ringed seal (Pusa hispida) and beardedseal (Erignathus barbatus), and two open water-associatedprey, harbor seal (Phoca vitulina) and harp seal (Phocagroenlandica) (40). As bearded seal is the only one of theseseal species that forages predominately on benthic items(31), the change in polar bear δ13C suggests a lowerconsumption of bearded seals and consequently a relativeincrease in consumption of one or more of the other sealsin years with a shortened period of ice cover.
Decreasing δ13C values with earlier breakup of the sea icecould also in part be influenced by other factors: increasedterrestrial feeding, longer fasting, δ13C variation at the baseof the food web, or incorporation of δ13C-depleted CO2
emitted from fossil fuel combustion into marine food chains.However, terrestrial feeding is an unlikely explanation, as
although feeding on, e.g., berries, has been observed in WHBpolar bears during the ice-free season, δ13C signatures inWHB bears, ringed seals and berries have consistentlydemonstrated that terrestrial input is not a significantcontributor to the WHB bear diet (41). There are limitedreports on the effects of fasting on dietary tracers. Yet,Polischuk et al. (42) found no difference in milk lipid δ13Cvalues between WHB polar bear females between fall andspring (encapsulating our sample collection dates), althoughspring values were more variable. FA composition in blackbear (Ursus americanus) milk was also relatively constantduring and after winter dormancy (43). Taken together, thesefindings suggest that the dietary tracer changes with icebreakup are not largely driven by changes in fasting. Baselinefood web δ13C changes due to variation in nutrients orproductivity has been observed (44, 45), and withoutknowledge of possible temporal variation in baseline δ13C,we cannot rule out that this could, in part, result in δ13Cvariation in the bears. Atmospheric CO2 has become depletedin δ13C due to the contribution of isotopically light CO2 fromfossil fuel emissions (46). Relevant to this study, the depletionwas around 0.4‰ over the period of 1991 to 2006 (47). Wefound a nonsignificant decrease in WHB polar bear δ13C from1991 to 2007 (r ) 0.63, p ) 0.13). A correction factor for thisconfounding variation has been developed for temporalstudies on terrestrial ecosystems, but the authors noted thatthis depletion would be less in marine systems, as dissolvedinorganic carbon (DIC) is not in equilibrium with atmosphericCO2 and atmospheric CO2 is not the sole source of DIC toaquatic systems (48). Further research on the extent to which
FIGURE 2. Mean ((SE) annual polar bear dietary tracer valuesversus ordinal date (January 1 ) ordinal date 1) of annual seaice breakup in western Hudson Bay from 1991 to 2007. (a)Carbon stable isotopes (δ13C). (b) Fatty acid(FA)-Index1 (b, solidline) and FA-Index2 (O, dashed line).
4336 9 ENVIRONMENTAL SCIENCE & TECHNOLOGY / VOL. 43, NO. 12, 2009
this confounding factor impacts δ13C studies of marine foodwebs is warranted.
Given the variety of other factors that may affect δ13C, wealso studied FA patterns in WHB polar bears. Increasinglyearlier ice breakup date explained 46% and 53% of theincreases in FA-Index1 (r ) -0.68, p ) 0.09) and FA-Index2(r )-0.73, p ) 0.07), respectively (Figure 2b). The main FAsthat loaded positively on Index1 (ALA and DPA) and Index2(DHA) have been found in higher proportions in harbor andharp seal than in bearded seal (31). The main FAs that loadednegatively on FA-Index1 (EPA, γ-linoleic acid) have beenfound at lower proportions in harbor and harp seal than inbearded seal (31). However, these FA patterns did not suggestchanges in the proportion of ringed seal consumed. Theseresults, in combination with the δ13C changes, suggest arelative decrease in the proportion of bearded seals consumedand increases in the proportion of harbor and harp sealsconsumed in years with a longer period of open water. Thisshift in the proportions of ice-associated to open-waterassociated prey is largely consistent with an observed dietshift for WHB bears using FA tracers of the bears and of theirprey over the 1994-2004 period which, though, also foundrelatively constant ringed seal consumption (40).
Changes in WHB polar bear consumption patterns couldbe related to changes in accessibility to prey and/or preyabundance with altered ice conditions in the region. Ringedseals and bearded seals are considered ice-seals; yet, land-fast ice is more important habitat for ringed seals comparedto pack ice habitat for bearded seals (49). Land-fast ice in theregion appears to be stable, but pack ice conditions havechanged (20, 21). It is possible that accessibility of WHB polarbears to bearded seals (but not ringed seals) has changed asa result. Harbor seals in Hudson Bay are year-roundinhabitants, but stay in areas of open water (50). Harp sealsare migratory, moving from the North Atlantic to, amongother regions, Hudson Bay when open-water conditionsprevail (49). Archaeological evidence from Inuit settlementsin Labrador showed a higher ratio of harbor seal to ringedseal in centuries with lighter ice conditions (51), suggestingthat open-water seals may be more abundant in northernregions in years of lighter ice conditions. Further study ofpolar bear prey in Hudson Bay is required to address thesepossible explanations. It is important to note, however, thatthe changes in polar bear dietary tracers may reflect not onlyshifts near the top of this food web, but also more extensiveecosystem composition changes in Hudson Bay (5).
Influence of Diet Change on Chlorinated and Bromi-nated Contaminant Concentrations. All contaminants (ex-ceptR-HCH) were correlated with FA-Index1 and FA-Index2,and ΣDDT and ΣPBDE were also correlated with δ13C,implying that diet explained a significant amount of thevariation in WHB polar bear contaminant levels (Table 1).Similarly, Bentzen et al. (52, 53) used stable carbon and
nitrogen isotopes to demonstrate that southern Beaufort Seapolar bears show interyear differences in diet, and that δ15Nand to a lesser extent δ13C explained a significant proportionoftheinterindividualvariationinorganochlorineconcentrations.
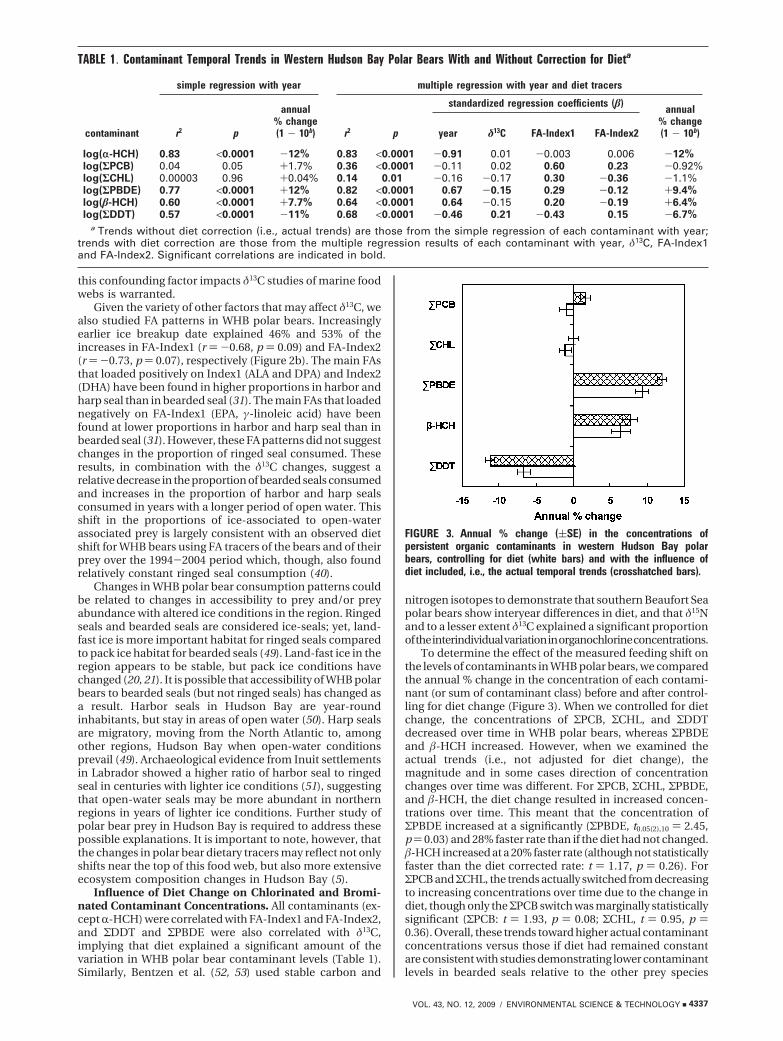
To determine the effect of the measured feeding shift onthe levels of contaminants in WHB polar bears, we comparedthe annual % change in the concentration of each contami-nant (or sum of contaminant class) before and after control-ling for diet change (Figure 3). When we controlled for dietchange, the concentrations of ΣPCB, ΣCHL, and ΣDDTdecreased over time in WHB polar bears, whereas ΣPBDEand �-HCH increased. However, when we examined theactual trends (i.e., not adjusted for diet change), themagnitude and in some cases direction of concentrationchanges over time was different. For ΣPCB, ΣCHL, ΣPBDE,and �-HCH, the diet change resulted in increased concen-trations over time. This meant that the concentration ofΣPBDE increased at a significantly (ΣPBDE, t0.05(2),10 ) 2.45,p) 0.03) and 28% faster rate than if the diet had not changed.�-HCH increased at a 20% faster rate (although not statisticallyfaster than the diet corrected rate: t ) 1.17, p ) 0.26). ForΣPCB and ΣCHL, the trends actually switched from decreasingto increasing concentrations over time due to the change indiet, though only the ΣPCB switch was marginally statisticallysignificant (ΣPCB: t ) 1.93, p ) 0.08; ΣCHL, t ) 0.95, p )0.36). Overall, these trends toward higher actual contaminantconcentrations versus those if diet had remained constantare consistent with studies demonstrating lower contaminantlevels in bearded seals relative to the other prey species
TABLE 1. Contaminant Temporal Trends in Western Hudson Bay Polar Bears With and Without Correction for Dieta
simple regression with year multiple regression with year and diet tracers
standardized regression coefficients (�)
contaminant r2 p
annual% change(1 - 10b) r2 p year δ13C FA-Index1 FA-Index2
annual% change(1 - 10b)
log(r-HCH) 0.83 <0.0001 -12% 0.83 <0.0001 -0.91 0.01 -0.003 0.006 -12%log(ΣPCB) 0.04 0.05 +1.7% 0.36 <0.0001 -0.11 0.02 0.60 0.23 -0.92%log(ΣCHL) 0.00003 0.96 +0.04% 0.14 0.01 -0.16 -0.17 0.30 -0.36 -1.1%log(ΣPBDE) 0.77 <0.0001 +12% 0.82 <0.0001 0.67 -0.15 0.29 -0.12 +9.4%log(�-HCH) 0.60 <0.0001 +7.7% 0.64 <0.0001 0.64 -0.15 0.20 -0.19 +6.4%log(ΣDDT) 0.57 <0.0001 -11% 0.68 <0.0001 -0.46 0.21 -0.43 0.15 -6.7%
a Trends without diet correction (i.e., actual trends) are those from the simple regression of each contaminant with year;trends with diet correction are those from the multiple regression results of each contaminant with year, δ13C, FA-Index1and FA-Index2. Significant correlations are indicated in bold.
FIGURE 3. Annual % change ((SE) in the concentrations ofpersistent organic contaminants in western Hudson Bay polarbears, controlling for diet (white bars) and with the influence ofdiet included, i.e., the actual temporal trends (crosshatched bars).
VOL. 43, NO. 12, 2009 / ENVIRONMENTAL SCIENCE & TECHNOLOGY 9 4337
(54-56) and with the observed diet shift to less bearded sealconsumption by WHB polar bears. Not unexpectedly, thediet shift had more impact on the concentrations ofcontaminants that are highly biomagnified in polar bears(e.g., ΣPCB, ΣPBDE) relative to contaminants that biomagnifyto a lesser extent (e.g., �-HCH) (57, 58). Similarly, the changefor R-HCH, which demonstrates relatively low persistenceand bioaccumulation, remained at-12% per year regardlessof diet correction (Table 1).
Surprisingly, ΣDDT concentrations decreased more rap-idly (64% faster; t ) 2.69, p ) 0.02) in response to the polarbear diet change. Although the major burden of POPs innorthern regions is from long-range transport (9), DDT wasalso sprayed in the 1950s and 1960s at military installationsand communities within our study site. Resulting terrestrialrunoff likely led to DDT contamination of the local marinebenthos. For example, PCB use at DEW-line sites in theCanadian Arctic resulted in elevated PCB concentrations innearby marine sediments and benthic species (59). Inaddition, a study of the White Sea in the Russian Arctic, aregion much closer to urban and industrial pollution sourcesthan the Canadian Arctic, found that benthic foragers(bearded seals) had higher ΣPCB and ΣDDT concentrationsthan more pelagic foragers (ringed and harp seals) (60). Thusin our study, the more rapid decrease in polar bear ΣDDTconcentrations is consistent with the decreased contributionof benthic-foraging prey to their diet, as measured by δ13Cchanges.
Adipose contaminant concentrations may be affected bydecreased fatness (body condition), as has been documentedin this subpopulation over the same time period (19). Wewere unable to investigate this possibility as accepted fatnessindicators, e.g., Quetelet Index (mass/length2), were notavailable for most samples. However, we did measure adiposelipid content in our analyses, which has recently beensuggested to be an adequate marker of fatness in polar bears(61). In contrast, other studies have demonstrated that anincrease in fatness of a polar bear is due solely to an increasein adipocyte number not volume (62), which would not leadto an increase in adipose lipid content. Regardless, we didnot find a significant correlation of adipose lipid contentwith year or with ice breakup date.
We expect that this observed temporal change in the WHBpolar bear diet/food web, which resulted in increasedcontaminant levels over the 1991-2007 period (relative tolevels had diet not changed), may continue with increasinglywarmer temperatures and diminished sea ice under predictedclimate change scenarios (3). To date, the biological impactof climate change has largely focused on direct changes toecosystems (2). Yet, our results indicate that there is a needto further investigate the interrelationships between climatechange and other ecological stressors, and perhaps moreurgently so in vulnerable populations and species of the Arcticand Subarctic.
AcknowledgmentsWe thank Nunavut Hunters and Trappers Organizations,Nunuvut Department of Environment Conservation Officers(J. Savikataaq, J. Coutu-Autut) and Canadian Wildlife Service(I. Stirling, N. Lunn, D. Andriashek) for sample collection.Thanks to Environment Canada’s Wildlife Specimen Bankand Lab Services, and to the University of Waterloo Envi-ronmental Isotopes Laboratory (W. Mark) for carbon stableisotopes analysis. This study was supported by the NorthernContaminants Program (Department of Indian and NorthernAffairs Canada) (to R.J.L.), the Canadian International PolarYear Secretariat (to E.P., R.J.L.), the Molson Foundation (toR.J.L.) and a Natural Sciences and Engineering ResearchCouncil of Canada (NSERC) Discovery Grant (to R.J.L.) andan NSERC Canada Graduate Scholarship (to M.A.M.).
Supporting Information AvailableTable S1 provides results of the ranked correlation analysisof dietary tracers versus ice breakup date. Table S2 providesbiometric data, sample collection date, ice breakup date,and polar bear mean δ13C, FA-Index1, and FA-Index2 for thesampling years. This material is available free of charge viathe Internet at http://pubs.acs.org.
Literature Cited(1) Walther, G. R.; Post, E.; Convey, P.; Menzel, A.; Parmesan, C.;
Beebee, T. J. C.; Fromentin, J. M.; Hoegh-Guldberg, O.; Bairlein,F. Ecological responses to recent climate change. Nature 2002,416, 389–395.
(2) Parmesan, C.; Yohe, G. A globally coherent fingerprint of climatechange impacts across natural systems. Nature 2003, 421, 37–42.
(3) Johannessen, O. M.; Bengtsson, L.; Miles, M. W.; Kuzmina, S. I.;Semenov, V. A.; Alekseev, G. V.; Nagurnyi, A. P.; Zakharov, V. F.;Bobylev, L. P.; Pettersson, L. H.; et al. Arctic climate change:observed and modelled temperature and sea-ice variability.Tellus, Ser. A 2004, 56, 328–341.
(4) Graversen, R. G.; Mauritsen, T.; Tjernstrom, M.; Kallen, E.;Svensson, G. Vertical structure of recent Arctic warming. Nature2008, 451, 53–56.
(5) Gaston, A. J.; Woo, K.; Hipfner, J. M. Trends in forage fishpopulations in Northern Hudson Bay since 1981, as determinedfrom the diet of nestling thick-billed murres Uria lomvia. Arctic2003, 56, 227–233.
(6) Grebmeier, J. M.; Overland, J. E.; Moore, S. E.; Farley, E. V.;Carmack, E. C.; Cooper, L. W.; Frey, K. E.; Helle, J. H.; McLaughlin,F. A.; Mcnutt, S. L. A major ecosystem shift in the northernBering Sea. Science 2006, 311, 1461–1464.
(7) Ottar, B. The transfer of airborne pollutants to the Arctic region.Atmos. Environ. 1981, 15, 1439–1445.
(8) Wania, F.; Mackay, D. Global fractionation and cold condensa-tion of low volatility organochlorine compounds in polar regions.Ambio 1993, 22, 10–18.
(9) Macdonald, R. W.; Barrie, L. A.; Bidleman, T. F.; Diamond, M. L.;Gregor, D. J.; Semkin, R. G.; Strachan, W. M. J.; Li, Y. F.; Wania,F.; Alaee, M.; et al. Contaminants in the Canadian Arctic: 5years of progress in understanding sources, occurrence andpathways. Sci. Total Environ. 2000, 254, 93–234.
(10) Jensen, S.; Johnels, A. G.; Olsson, M.; Otterlind, G. DDT andPCB in marine animals from Swedish waters. Nature 1969, 224,247–250.
(11) Muir, D. C. G.; Wagemann, R.; Hargrave, B. T.; Thomas, D. J.;Peakall, D. B.; Norstrom, R. J. Arctic marine ecosystem con-tamination. Sci. Total Environ. 1992, 122, 75–134.
(12) de Wit, C. A.; Alaee, M.; Muir, D. C. G. Levels and trends ofbrominated flame retardants in the Arctic. Chemosphere 2006,64, 209–233.
(13) Houde, M.; Martin, J. W.; Letcher, R. J.; Solomon, K. R.; Muir,D. C. G. Biological monitoring of polyfluoroalkyl substances: Areview. Environ. Sci. Technol. 2006, 40, 3463–3473.
(14) Dewailly, E.; Nantel, A.; Weber, J. P.; Meyer, F. High-levels ofPCBs in breast-milk of Inuit women from Arctic Quebec. Bull.Environ. Contam. Toxicol. 1989, 43, 641–646.
(15) Letcher, R. J.; Bustnes, J. O.; Dietz, R.; Jenssen, B. M.; Jorgensen,E. H.; Sonne, C.; Verreault, J.; Vijayan, M. M.; Gabrielsen, G. W.Effects assessment of persistent organohalogen contaminantsin Arctic wildlife and fish. Sci. Total Environ. 2009, submitted.
(16) Fisk, A. T.; de Wit, C. A.; Wayland, M.; Kuzyk, Z. Z.; Burgess, N.;Letcher, R. J.; Braune, B.; Norstrom, R. J.; Polischuk Blum, S.;Sandau, C.; et al. An assessment of the toxicological significanceof anthropogenic contaminants in Canadian Arctic wildlife. Sci.Total Environ. 2005, 351-352, 57–93.
(17) Thiemann, G. W.; Derocher, A. E.; Stirling, I. Polar bear Ursusmaritimus conservation in Canada: An ecological basis foridentifying designatable units. Oryx 2008, 42, 504–515.
(18) de March, B. G. E.; de Wit, C. A.; Muir, D. C. G.; Braune, B. M.;Gregor, D. J.; Norstrom, R. J.; Olsson, M.; Skaare, J. U.; Stange,K. Persistent organic pollutants. In AMAP Assessment Report,Arctic Pollution Issues; Arctic Monitoring and AssessmentProgramme: Oslo, 1998; pp 183-372.
(19) Stirling, I.; Lunn, N. J.; Iacozza, J. Long-term trends in thepopulation ecology of polar bears in western Hudson Bay inrelation to climate change. Arctic 1999, 52, 294–306.
(20) Gagnon, A. S.; Gough, W. A. Trends in the dates of ice freeze-upand breakup over Hudson Bay, Canada. Arctic 2005, 58, 370–382.
4338 9 ENVIRONMENTAL SCIENCE & TECHNOLOGY / VOL. 43, NO. 12, 2009

(21) Gagnon, A. S.; Gough, W. A. East-west asymmetry in long-termtrends of land-fast ice thickness in the Hudson Bay region,Canada. Climate Res. 2006, 32, 177–186.
(22) Regehr, E. V.; Lunn, N. J.; Amstrup, S. C.; Stirling, I. Effects ofearlier sea ice breakup on survival and population size of polarbears in western Hudson Bay. J. Wildl. Manage. 2007, 71, 2673–2683.
(23) Thiemann, G. W.; Iverson, S. J.; Stirling, I. Seasonal, sexual andanatomical variability in the adipose tissue of polar bears (Ursusmaritimus). J. Zool. 2006, 269, 65–76.
(24) Verreault, J.; Norstrom, R. J.; Ramsay, M. A.; Mulvihill, M.;Letcher, R. J. Composition of chlorinated hydrocarbon con-taminants among major adipose tissue depots of polar bears(Ursus maritimus) from the Canadian high Arctic. Sci. TotalEnviron. 2006, 370, 580–587.
(25) Hebert, C. E.; Arts, M. T.; Weseloh, D. V. C. Ecological tracerscan quantify food web structure and change. Environ. Sci.Technol. 2006, 40, 5618–5623.
(26) Etkin, D. A. Break-up in Hudson Bay: its sensitivity to airtemperatures and implications for climate warming. Climatol.Bull. 1991, 25, 21–34.
(27) Kelly, J. F. Stable isotopes of carbon and nitrogen in the studyof avian and mammalian trophic ecology. Can. J. Zool. 2000,78, 1–27.
(28) Iverson, S. J.; Field, C.; Bowen, W. D.; Blanchard, W. Quantitativefatty acid signature analysis: a new method of estimatingpredator diets. Ecol. Monogr. 2004, 74, 211–235.
(29) Post, D. M. Using stable isotopes to estimate trophic position:models, methods, and assumptions. Ecology 2002, 83, 703–718.
(30) France, R. L. Carbon-13 enrichment in benthic compared toplanktonic algae: foodweb implications. Mar. Ecol.: Prog. Ser.1995, 124, 307–312.
(31) Thiemann, G. W.; Iverson, S. J.; Stirling, I. Variation in blubberfatty acid composition among marine mammals in the CanadianArctic. Mar. Mammal Sci. 2008, 24, 91–111.
(32) Budge, S. M.; Iverson, S. J.; Koopman, H. N. Studying trophicecology in marine ecosystems using fatty acids: a primer onanalysis and interpretation. Mar. Mammal Sci. 2006, 22, 759–801.
(33) Folch, J.; Lees, M.; Sloane-Stanley, G. H. A simple method forthe isolation and purification of total lipids from animal tissues.J. Biol. Chem. 1957, 226, 497–509.
(34) Verreault, J.; Muir, D. C. G.; Norstrom, R. J.; Stirling, I.; Fisk,A. T.; Gabrielsen, G. W.; Derocher, A. E.; Evans, T. J.; Dietz, R.;Sonne, C.; et al. Chlorinated hydrocarbon contaminants andmetabolites in polar bears (Ursus maritimus) from Alaska,Canada, east Greenland, and Svalbard: 1996-2002. Sci. TotalEnviron. 2005, 351, 369–390.
(35) Saito, K.; Sjodin, A.; Sandau, C. D.; Davis, M. D.; Nakazawa, H.;Matsuki, Y.; Patterson, D. G., Jr. Development of a acceleratedsolvent extraction and gel permeation chromatography analyti-cal method for measuring persistent organohalogen compoundsin adipose and organ tissue analysis. Chemosphere 2004, 57,373–381.
(36) Norstrom, R. J.; Belikov, S. E.; Born, E. W.; Garner, G. W.; Malone,B.; Olpinski, S.; Ramsay, M. A.; Schliebe, S.; Stirling, I.; Stishov,M. S.; et al. Chlorinated hydrocarbon contaminants in polarbears from eastern Russia, North America, Greenland, andSvalbard: biomonitoring of Arctic pollution. Arch. Environ.Contam. Toxicol. 1998, 35, 354–367.
(37) Gauthier, L. T.; Hebert, C. E.; Weseloh, D. V. C.; Letcher, R. J.Current-use flame retardants in the eggs of herring gulls (Larusargentatus) from the Laurentian Great Lakes. Environ. Sci.Technol. 2007, 41, 4561–4567.
(38) Schantz, M. M.; Koster, B. J.; Oakley, L. M.; Schiller, S. B.; Wise,S. A. Certification of polychlorinated biphenyl congeners andchlorinated pesticides in a whale blubber standard referencematerial. Anal. Chem. 1995, 67, 901–910.
(39) Stapleton, H. M.; Keller, J. M.; Schantz, M. M.; Kucklick, J. R.;Leigh, S. D.; Wise, S. A. Determination of polybrominateddiphenyl ethers in environmental standard reference materials.Anal. Bioanal. Biochem. 2007, 387, 2365–2379.
(40) Thiemann, G. W.; Iverson, S. J.; Stirling, I. Polar bear diets andarctic marine food webs: insights from fatty acid analysis. Ecol.Monogr. 2008, 78, 591–613.
(41) Hobson, K. A.; Stirling, I.; Andriashek, D. S. Isotopic homogeneityof breath CO2 from fasting and berry-eating polar bears:implications for tracing reliance on terrestrial foods in a changingArctic. Can. J. Zool. 2009, 87, 50–55.
(42) Polischuk, S. C.; Hobson, K. A.; Ramsay, M. A. Use of stable-carbon and -nitrogen isotopes to assess weaning and fasting in
female polar bears and their cubs. Can. J. Zool. 2001, 79, 499–511.
(43) Iverson, S. J.; Oftedal, O. T. Fatty acid composition of black bear(Ursus americanus) milk during and after the period of winterdormancy. Lipids 1992, 27, 940–943.
(44) Laws, E. A.; Popp, B. N.; Bidigare, R. R.; Kennicutt, M. C.; Macko,S. A. Dependence of phytoplankton carbon isotopic compositionon growth-rate and [CO2]aq: theoretical considerations andexperimental results. Geochim. Cosmochim. Acta 1995, 59, 1131–1138.
(45) O’Reilly, C. M.; Alin, S. R.; Plisnier, P. D.; Cohen, A. S.; Mckee,B. A. Climate change decreases aquatic ecosystem productivityof Lake Tanganyika, Africa. Nature 2003, 424, 766–768.
(46) Francey, R. J.; Allison, C. E.; Etheridge, D. M.; Trudinger, C. M.;Enting, I. G.; Leuenberger, M.; Langenfelds, R. L.; Michel, E.;Steele, L. P. A 1000-year high precision record of δ13C inatmospheric CO2. Tellus, Ser. B 1999, 51, 170–193.
(47) Allison, C. E.; Francey, R. J. Verifying Southern Hemispheretrends in atmospheric carbon dioxide stable isotopes. J. Geophys.Res., [Atmos.] 2007, 112, D21304.
(48) Long, E. S.; Sweitzer, R. A.; Diefenbach, D. R.; Ben David, M.Controlling for anthropogenically induced atmospheric varia-tion in stable carbon isotope studies. Oecologia 2005, 146, 148–156.
(49) Laidre, K. L.; Stirling, I.; Lowry, L. F.; Wiig, O.; Heide-Jorgensen,M. P.; Ferguson, S. H. Quantifying the sensitivity of arctic marinemammals to climate-induced habitat change. Ecol. Appl. 2008,18, S97–S125.
(50) Mansfield, A. W. Distribution of harbor seal Phoca Vitulinalinnaeus, in Canadian Arctic waters. J. Mammal. 1967, 48, 249–257.
(51) Woollett, J. M.; Henshaw, A. S.; Wake, C. P. Palaeoecologicalimplications of archaeological seal bone assemblages: casestudies from Labrador and Baffin Island. Arctic 2000, 53, 395–413.
(52) Bentzen, T. W.; Follmann, E. H.; Amstrup, S. C.; York, G. S.;Wooller, M. J.; O’Hara, T. M. Variation in winter diet of southernBeaufort Sea polar bears inferred from stable isotope analysis.Can. J. Zool. 2007, 85, 596–608.
(53) Bentzen, T. W.; Follmann, E. H.; Amstrup, S. C.; York, G. S.;Wooller, M. J.; Muir, D. C. G.; O’Hara, T. M. Dietary biomag-nification of organochlorine contaminants in Alaskan polarbears. Can. J. Zool. 2008, 86, 177–191.
(54) Hoekstra, P. F.; O’Hara, T. M.; Fisk, A. T.; Borgå, K.; Solomon,K. R.; Muir, D. C. G. Trophic transfer of persistent organochlorinecontaminants (OCs) within an Arctic marine food web from thesouthern Beaufort-Chukchi Seas. Environ. Pollut. 2003, 124,509–522.
(55) Bang, K.; Jenssen, B. M.; Lydersen, C.; Skaare, J. U. Organochlo-rine burdens in blood of ringed and bearded seals from north-western Svalbard. Chemosphere 2001, 44, 193–203.
(56) Krahn, M. M.; Becker, P. R.; Tilbury, K. L.; Stein, J. E. Orga-nochlorine contaminants in blubber of four seal species:Integrating biomonitoring and specimen banking. Chemosphere1997, 34, 2109–2121.
(57) Muir, D. C. G.; Norstrom, R. J.; Simon, M. Organochlorinecontaminants in arctic marine food chains: accumulation ofspecific polychlorinated biphenyls and chlordane-related com-pounds. Environ. Sci. Technol. 2000, 22, 1071–1079.
(58) Muir, D. C. G.; Backus, S.; Derocher, A. E.; Dietz, R.; Evans, T. J.;Gabrielsen, G. W.; Nagy, J.; Norstrom, R. J.; Sonne, C.; Stirling,I.; et al. Brominated flame retardants in polar bears (Ursusmaritimus) from Alaska, the Canadian Arctic, East Greenland,and Svalbard. Environ. Sci. Technol. 2006, 40, 449–455.
(59) Bright, D. A.; Dushenko, W. T.; Grundy, S. L.; Reimer, K. J. Effectsof local and distant contaminant sources: polychlorinatedbiphenyls and other organochlorines in bottom-dwelling ani-mals from an Arctic estuary. Sci. Total Environ. 1995, 160-161,265–284.
(60) Muir, D. C. G.; Savinova, T.; Savinov, V.; Alexeeva, L.; Potelov,V.; Svetochev, V. Bioaccumulation of PCBs and chlorinatedpesticides in seals, fishes and invertebrates from the White Sea,Russia. Sci. Total Environ. 2003, 306, 111–131.
(61) Stirling, I.; Thiemann, G. W.; Richardson, E. Quantitative supportfor a subjective fatness index for immobilized polar bears. J.Wildl. Manage. 2008, 72, 568–574.
(62) Pond, C. M.; Mattacks, C. A.; Colby, R. H.; Ramsay, M. A. Theanatomy, chemical composition, and metabolism of adiposetissue in wild polar bears (Ursus maritimus). Can. J. Zool. 1992,70, 326–341.
ES900471G
VOL. 43, NO. 12, 2009 / ENVIRONMENTAL SCIENCE & TECHNOLOGY 9 4339