Embed Size (px)
Citation preview

OCt..] •9ss• 385
SEASONAL CHANGES IN THE ENERGY BALANCE OF THE ENGLISH SPARROW
BY EARLE A. DAVIS, JR.
IN attempting to explain why an organism is to be found in a given habitat at a given time of the day or year, the ecologist is actually trying to indicate how the organism's physiological, anatomical, and behavioristic adaptations are integrated to permit it to maintain a favorable energy balance with its environment.
The study of bioenergetics in birds is simplified by the fact that they are homoiothermic. Kendeigh (1944), using the English Sparrow (Passer domesticus), found that the body temperatures of acclimated birds during the winter did not change after exposures from 37 ø C. to --40 ø C.; therefore, the rate of heat production must have been equal to the rate of heat loss. Later, again using English Sparrows in the winter phase of the yearly cycle, Kendeigh (1949) found that the food energy absorbed per gram bird per day on a 10-hour photoperiod in- creased linearly with a drop in temperature at the rate of 0.0108 Calories per degree Centigrade (Figure 1). Realizing the possible im- portance of feeding time (photoperiod) in this problem, Seibert (1949) subjected winter-adapted English Sparrows to 15 hours of light, simu- lating local summer daylight hours. The data thus obtained gave a linear regression when metabolized energy was plotted against the temperature to which the bird was subjected. However, this re- gression slope was not as steep as that for the 10-hour birds, being 0.0046 Calories per degree Centigrade.
The purpose of the present investigation is to study the energy balance of summer-adapted English Sparrows on 10-hour and 15-hour photoperiods and to compare the data obtained therefrom with that obtained on winter-adapted birds. It should then be possible to state quantitatively the general trend of the changes of energy balance oc- curring in this species throughout the yearly cycle as it exists in nature.
This paper is based on a doctoral dissertation, research for which was performed in the Zoology Department of the University of Illinois under the guidance of Dr. S. Charles Kendeigh to whom I am indebted for supervision and criticism through frequent consultation. I am also indebted to the following men for giving so generously of their time and advice: Doctors J. W. A. Brant, R. M. Forbes, T. S. Hamil- ton, H. W. Norton, and H. M. Scott. I also wish to express my gratitude to Dr. Hamilton for allowing the use of the Animal Science Department's Parr adiabatic oxygen bomb calorimeter and to Mr.

386 DAms, Changes in Energy Balance of English Sparrow [ Auk [Vol. 72
A. Kosowski for help in the construction and maintenance of ex- perimental equipment.
I.I-
o.s-
0.•-
0.•-
0.5-
0.4-
0.2-
0.1-
-30 -20
F•GUR}• 1.
I I I
-IO o IO 20 30 TEMPERATURE ('C)
Comparison•of energy balance of summer-adapted and winter-adapted English Sparrows. Regression lines for summer-adapted birds (broken lines) are averages for individuals exposed to 10- and 15-hour photoperiods; those for winter- adapted birds (solid lines) are for individuals exposed to 10-hour photoperiod (Kendeigh, 1949). The following formulae apply to summer-adapted birds: gross energy in Cal./gm. bird/day: 1.27-0.0167 T.; excretory energy: 0.26-0.0040 T.; metabolized energy: 1.02-0.0127 T.; productive energy: 0.0127 T.
EFFECT OF CONSTANT TEMPERATURE AND PHOTOPERIOD
Procedure.--Data for the present studies are limited largely to re- sults obtained within the months of May through October and with birds captured during those months. Experiments were run for four summers, 1949 to 1952 inclusive. Most of the birds were caught in nets placed at night over the entrance to the nest; however, a few were also caught by drop traps and funnel traps. New individuals

Oct.1 19ss• DAVIS, Changes in Energy Balance of English Sparrow 387
were used for each set of temperatures, except in a few instances. Equal numbers of males and females were employed to permit detec- tion of any sex differences in response. Although there is some un- certainty concerning the correct differentiation of immature and adult female birds during the first summer, checking the ossification of the skull at the termination of each experiment verified age deter- minations in all later experiments.
In determining energy balance, the method followed in this study has been to measure food consumption and excrement loss. The energy intake, viz., food consumption or gross energy (G.E.), is limited to daylight hours (Seibert, 1949; Eyster, 1952). The ex- cretory energy (E.E.) is subtracted from gross energy to determine the metabolized energy (M.E.).
Existence energy is the composite of energy required for the main- tenance of standard metabolism plus the energy involved in physical and chemical heat regulation, in securing food and drink under most favorable conditions, and in the heat increment or "specific dynamic action" incident to digestion and assimilation. Both Kendeigh and Seibert assumed that metabolized energy under the conditions of their experiments was equivalent to existence energy since their birds maintained a constant weight and no surplus work was performed. If the processes of anabolism and catabolism are equal, all of the food absorbed is being utilized. Therefore, in the discussion which follows, the term metabolized energy has been substituted for the term meta- bolizable energy commonly used by nutritionists.
Productive energy represents that portion of the total potential food absorption which is over and above the energy required for ex- istence at any particular temperature. This energy is expendable for growth, locomotion other than that involved in obtaining food and drink under optimum conditions, migration, reproduction, molt, and fat deposition. Within the temperature range employed in these ex- periments, the birds required the least existence energy at the highest temperatures and progressively more energy with decreasing tempera- tures, reaching presumably the maximal metabolized energy intake at the lowest temperatures they were able to endure. Then, as was stated by Kendeigh (1949: 120-121): "If this 'maximum' energy intake could also be attained at higher temperatures when demands for purposes other than heat production required it, the productive energy would be the difference between the potential energy intake and the energy required for existence."
In an effort to maintain the birds at the existence energy level, they were placed in small one-half inch hardware cloth cages identical

388 DAws, Changes in Energy Balance of English Sparrow [ Auk [Vol. 72
in size (10" X 10.5" X 5") with those used by Kendeigh (1949) and Seibert (1949). Following confinement after capture, the bird's weight typically fell rapidly for two to four days, then leveled off to a constant weight within six to ten days, the rate and duration of fall being proportional to the total weight loss. The average amount of weight lost by birds following confinement was 3.3 grams (11.4 per cent), with females losing an average of 1.7 grams (5.5 per cent) more than males (Table 1). The maximum difference in weight loss
TABLE 1
COMPARISON OF INITIAL AND AVERAGE EXPERIMENTAL WEIGHTS. EXPERIMENTAL BIRDS WERE CAUGHT BETWEEN APRIL AND JULY. HOWEVER, AVERAGE EXPERI-
MENTAL WEIGHTS WERE OBTAINED THROUGH OCTOBER
Initial Average Per cent average experimental of weight
Number weight weight loss Month of birds Sex in grams in grams
April 4 Female 32.6 25.2 21.4 2 Male 28.3 25.2 11.3 6 Female & Male 30.4 25.2 16.4
May 12 Female 28.7 25.2 12.2 8 Male 28.0 25.1 10.4
20 F eraale & Male 28.4 25.1 11.3
June 12 Female 27.0 24.8 8.1 9 Male 27.6 25.8 6.5
21 Female & Male 27.3 25.3 7.3
July 10 Female 27.8 24.4 12.2 9 Male 27.2 25.4 6.6
19 Female & Male 27.5 24.9 9.4
Final Female 29.0 24.9 14.1 average Male 27.8 25.4 8.6
Female & Male 28.4 25.1 11.4
between males and females, amounting to 4.3 grams (10.1 per cent), occurred in the month of April. Visual comparison of the sex organs of freshly caught birds with those of birds sacrificed at the termin- ation of experiments suggested that the greater weight loss of the females was due in part to the comparatively greater retrogression of the ovary and accessory organs. After the weight leveled off, the bird was maintained under experimental conditions for about three weeks. Averages of data were made only for periods when the birds maintained a constant weight and energy exchange. For purposes of investigating the effects of prolonged cage confinement, several birds were maintained under constant conditions for four months or
longer. It was necessary to place only one bird in a cage in order to maintain a minimum of activity.
Each cage was set in a four-inch-deep metal tray with a double thickness of full-size newspaper between the cage and the tray. One-

Oct.1 19S51 DAws, Changes in Energy Balance of English Sparrow 389
half inch wooden blocks were used to elevate the cage above the paper. This arrangement caught grain particles tossed or kicked out by the birds and provided greater cage sanitation. In spite of the eight- to ten-inch-high curtain made by the newspaper and various ways of offering the food, some slight amount of food was lost by scattering. In all instances every effort was made to arrange the cages so that the lighting within was as uniform as possible.
The birds were weighed at three-day intervals, the cages were cleaned, the papers were changed, and weighed amounts of fresh food were given the birds. The food offered was not dried, but the dry weight was calculated. The food and excrement which had fallen to the newspapers were dried overnight in an incubator maintained at 55 ø C. The following day the uneaten food and the feces were separated, first by sifting the mixture through a sieve and then sorting through the siftings for small pellets. Since the substances were dry, it was possible to take the pellets between the finger tips and rub off adhering food particles. This permitted a more accurate separation of the two substances than had been possible in the work done by Kendeigh and Seibert, who had done their separating immediately after cleaning the cages. The food and feces were then dried for two or three more days in a 95 ø C. dry-heat oven until a constant weight was attained on successive daily readings. All measurements of the bird's weights, food, and excrement were done on a triple beam balance to the closest one-tenth gram.
The food used was the same ground, mixed chicken mash, Univer- sity of Illinois Number 393, used by Kendeigh and Seibert. On an average, their mixture contained 15 per cent protein, 11 per cent moisture, and had an energy value of 4.4 Calories per gram of dry weight. For the present investigation, tests were made on the caloric value and water content of each 100 pound sack of feed. The caloric value of the feecl (and feces) was determined in a Parr adiabatic oxygen calorimeter. In making computations of gross energy, the specific caloric value obtained for each sack of food was used. The average of these values was 4.261 Calories per gram, which approxi- mates the figure (4.4 Calories per gram) used by Kendeigh and Seibert. Since the moisture content of the food varied only two per cent during the years 1949 through 1951, the average (12.0 per cent) was used to compute the dry weight of the gross energy consumed for these years. The moisture content of the food used in 1952 was definitely less, averaging 9.4 per cent; therefore, this figure was used for this latter year.
The amount of food supplied each bird varied with the tempera-

390 DAVis, Changes in Energy Balance of English Sparrow [ Auk [Vol. 72
ture to which the bird was being subjected. Occasionally at lower temperatures it was necessary to introduce an additional amount of weighed food before the end of a three-day period. Only as much food was provided as the bird would likely eat; for, if a surplus of food is supplied, an animal may eat selectively (Forbes and Grindley, 1923).
Water was made available in cups suspended from the side of the cage. Fresh water was provided each day.
The temperature range employed in this experiment was 0 ø to 34 ø C. The maximum temperature is that at which this species sur- vives longest without food (Kendeigh, 1934). The lower limit was set by the fact that summer birds placed at temperatures below 0 ø C. on a 10-hour photoperiod failed to survive more than a few days. In determining the lower limit, two freshly caught summer-adapted birds and two birds previously held at 10 ø C. for one month were subjected to a temperature of --10 ø C. on a 10-hour photoperiod. Since all four of these birds died within two or three days, a similar group of four birds was placed at --5 ø C. These birds also died within three to four days. Birds placed at 0 ø C. succeeded in main- taining themselves. Kendeigh (1934) found that at --10 ø C. birds without food can survive only 10 to 11 hours. Even on a 15-hour photoperiod with nine hours darkness, the birds would be very weak at daybreak and feeding probably would be reduced during the day.
Temperatures of 34 ø, 18 ø, 10% and 4 ø C. were maintained through the use of constant temperature units of the walk-in type. Experi- ments at 0 ø C., and occasionally 4 ø and 10 ø C., were conducted in a smaller refrigerator unit. Experiments at 26 ø C. were run in a base- ment room well insulated from the out-of-doors where fluctuations in
temperature between night and day did not vary more then •=2 ø C. All rooms were light-proof, and each was illuminated by two 100
watt, incandescent, frosted bulbs. The average light intensity in- side the cages was 11 footcandles, which approximates the minimum of 10 stated by Burger (1949) as being adequate for normal activity. The light period was regulated by an automatic time switch. The 10-hour photoperiod, 7 A.m. to 5 a.m., was used to simulate winter conditions, and the 15-hour period, 7 A.m. to 10 a.m., to simulate summer conditions. Since no molt of feathers comparable to that obtained by Lesher and Kendeigh (1941) resulted from sudden changes in the photoperiods, birds were shifted immediately from one photoperiod to another without intervening gradual steps.
Results.--Useful records were obtained from 70 birds, 33 of these being at the 10-hour photoperiod and 37 at the 15-hour photoperiod.

109•t•] DAVIS, Changes in Energy Balance of English Sparrow 39 1
The valid readings obtained from these individuals were the equiva- lent of 1962 individual bird days, 1153 from birds exposed to 10 hours of light, while 809 came from the 15-hour group.
A. Weights.--The extreme range in average body weights for in- dividual birds was 8.0 grams, or from 29.0 to 21.0 grams. Com- parisons of weights between the various temperature groups and within the groups themselves are shown in Table 2. There is no significant difference in the average weight of birds at different tem- peratures.
TABLE 2
COMPARISON ON AVI•RAGI• WI•IGHTS DURING CONSTANT TI•MPERATURI• EXPI•RIMI•NTS AT I]IFFERI•NT PHOTOPERIODS
Average Temperature Number weights Standard
("C) of birds in grams deviation
10-hour photoperiod 0 6 25.6 4- 0.54 1.32 4 4 26.6 4- 0.94 1.87
10 4 25.1 4- 1.04 2.09 18 5 24.9 4- 0.59 1.31 26 7 25.1 4- 0.60 1.58 34 7 25.4 4- 0.72 1.91
15-hour photoperiod 0 6 24.6 4- 0.91 2.23
10 7 24.9 4- 0.26 0.70 18 8 26.0 4- 0.70 1.99 26 10 24.1 4- 0.57 1.79 34 6 25.2 4- 0.69 1.70
Data on weights, gross energy, excretory energy, and metabolized energy obtained on birds which were confined at constant tempera- tures for long periods were not sufficient in number nor in uniformity of occurrence to permit significant statistical analyses. Two birds kept for about two and one-half months maintained approximately the same energy balance throughout the duration of the experiment. One bird kept for four months showed a negative energy balance as indicated by a decline in weight, gross energy, excretory energy, and metabolized energy; another individual was able to maintain the same weight while its gross energy and excretory energy declined and its metabolized energy increased slightly.
B. Gross energy.--Kleiber and Daugherty (1934), working with domestic fowl chicks, found that with decreasing air temperature the amount of food consumed per day increased as a straight line. Similar results have been obtained in the current series of experiments (Table 3). Figure 1 indicates that in the present investigation the

392 DAvis, Changes in Energy Balance of English Sparrow [ Auk [Vol. 72
TABLE 3
GROSS ENERGY CONSUMPTION PER BIRD PER DAY UNDER CONSTANT TEMPERATURE CONDITIONS
ture Number Total days Average Calories Standard (øC) of birds feeding gross energy deviation
10-hour photoperiod 0 6 221 33.3 :• 1.24 3.05 4 4 135 30.4 :• 1.78 3.57
10 4 97 30.2 :• 1.30 2.59 18 5 117 22.3 -4- 0.84 1.87 26 7 176 18.8 :• 0.83 2.21 34 7 407 17.5 :• 1.46 3.88
15-hour photoperiod 0 6 139 29.3 :• 0.89 2.17
10 7 177 29.6 :• 1.01 2.68 18 8 145 25.1 :• 1.42 4.02 26 10 213 18.8 4- 1.33 4.22 34 6 135 20.3 :k 1.24 3.49
TABLE 4
GROSS ENERGY CONSUMPTION PER BIRD PER I-IOLrR UNDER CONSTANT TEMPERATURE CONDITIONS
Temperature 10-hour 15-hour Per cent (ø C ) photoperiod photoperiod difference
0 3.33 1.95 41.4 4 3.04 -- --
10 3.02 1.97 34.8 18 2.23 1.67 25.1 26 1.88 1.25 33.5 34 1.75 1.35 22.9
linear relationship between the amount of food ingested (G.E.) and temperature changes at the rate of 0.0167 Calories per gram bird per day per degree C.
On comparing gross energy consumed per day by winter-adapted birds on a 15-hour and a 10-hour day at the same temperature inter- vals, Seibert (1949) found that they ate more at high and moderate temperatures on the longer photoperiod but that at low temperatures they ate equivalent amounts. In the present investigation there were no significant differences in the amount of food consumed on the 10- as compared with the 15-hour day at any given temperature.
If a given amount of food is to be consumed in a unit of time, while in another similar set of conditions it is to be consumed in a shorter
length of time, naturally the rate of consumption will be more rapid in the second case than in the first. While the exact amount of time--
number of hours--that the birds actually were feeding at each photo- period is not known, on an average the amount of food eaten per

Oct.] 19ssl DAvis, Changes in Energy Balance of English Sparrow 393
TABLE 5
•)ETERMINATIONS ON CALORIC CONTENT O1• i•ECES O1• BIRDS MAINTAINED AT CONSTANT TEMPERATURES
.4 vetage Temperature Number number of Standard
(øC) of tests Cal./gm. deviation
10-hour photoperiod 0 4 3.740 q- 0.025 0.049 4 2 3.439 q- 0.061 0.086
10 2 3.664 q- 0.032 0.045 18 5 3.893 q- 0.053 0.117 26 3 3.682 q- 0.064 0.110 34 5 3.546 q- 0.094 0.209
15-hottr photoperiod 0 6 3.699 q- 0.025 0.062
10 5 3.734 q- 0.049 0.109 18 8 3.841 q- 0.020 0.056 34 6 3.730 q- 0.049 0. 120
hour may be obtained by dividing the total amount consumed by the number of hours of light. Seibert (1949) found that at temperatures of 34 ø, 22 ø, and -13 ø C. English Sparrows consistently consumed more energy per hour on the shorter photoperiod. In the present investigation similar results were obtained (Table 4). Seibert's studies also indicated that at -13 ø C. the increased hourly rate was sufficient to enable the bird to eat only 2.6 per cent less on a 10-hour than on a 15-hour photoperiod.
C. Excretory energy.--Bird excrement consists of undigested food, digested but unabsorbed food, plus nitrogenous wastes from the kidneys. Ninety-two caloric tests were run on the feces (Table 5), two tests being made on the fecal collection of an individual bird to check for accuracy; thus, forty-six birds are represented in these tests. As a further check on accuracy, five duplicate samples (10 tests) were measured by a professional calorimetrist, his results differ- ing from the author's by an average of only 0.07 per cent.
The maximum range between fecal values for individual birds was 0.639 Calories, or 3.966 to 3.327; the maximum range between in- dividual temperature groups was 0.454 Calories, or 3.893 to 3.439. If the customary allowance of 3.8 per cent is made for mechanical in- accuracies attributable to the calorimeter, there are no significant differences in the caloric values of a gram of feces at any temperature or photoperiod. There is no evidence of a direct relationship be- tween temperature and the per gram fecal energy content.
When excretory energy values for 10- and 15-hour photoperiods are combined and plotted against temperature, the linear regression slope obtained changes at the rate of 0.0964 Calories per bird per day

394 DAvis, Changes in Energy Balance of English Sparrow [ Auk [Vol. 72
TABLE 6
CALORIES LOST IN I•ECES PER BIRD PER DAY UNDER CONSTANT TEMPERATURE CONDITIONS
Tempera- Average ture Number excretory Standard Digestive (øC) of birds energy deviation coe2•cient
10-hour photoperiod 0 6 8.4 q- 0.58 1.41 74.8 4 4 7.0 q- 0.79 1.58 77.0
I0 4 6.0 q- 0.60 1.21 80.1 18 5 3.6 q- 0.37 0.82 83.9 26 7 3.6 q- 0.32 0.86 80.9 34 7 3.8 q- 0.50 1.33 78.3
15-hour photoperiod 0 6 5.0 q- 0.43 1.05 82.9
I0 7 4.5 q- 0.48 1.27 84.8 18 8 2.9 q- 0.25 0.70 88.4 26 I0 4.9 q- 0.26 0.81 73.9 34 6 4.0 q- 0.27 0.66 79.6
TABLE 7
CALORIES LOST IN FECES PER BIRD PER I-IouR UNDER CONSTANT TEMPERATURE CONDITIONS
Temperature 10-hour 15-hour Per cent (ø C) photoperiod p hotoperiod difference
0 0.84 0.33 60.7 4 0.70 -- --
I0 0.60 0.30 50.0 18 0.36 0.19 47.2 26 0.36 0.33 8.3 34 0.38 0.27 29.0
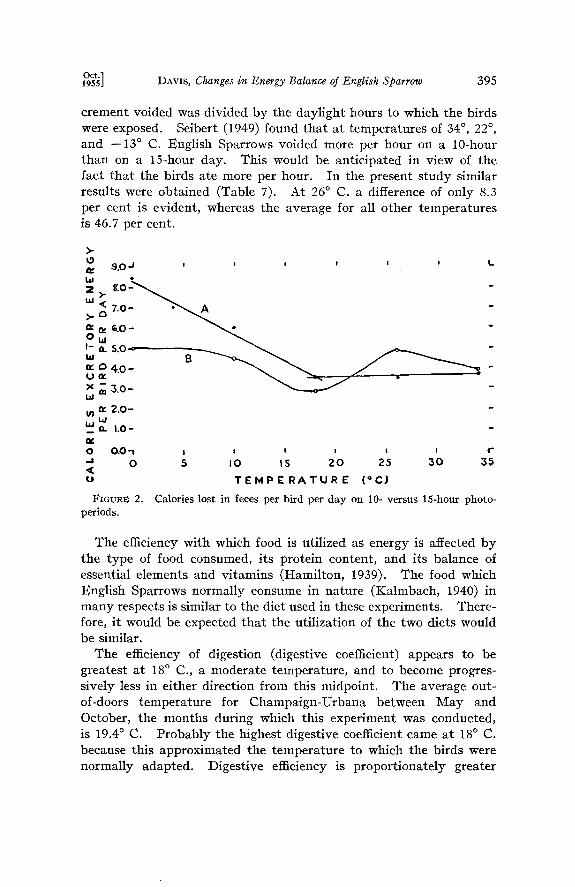
per degree C. On a per-gram-bird basis this is equal to a change of 0.004 Calories (Figure i). A graphical comparison of the daily ex- crement production as given in Table 6 is made in Figure 2. A broken line best fits the points for the 10-hour photoperiod (Brandt, 1950). Analysis of the data for the 15-hour photoperiod group by routine orthogonal polynomial analysis is not feasible because un- equal size groups are involved. Therefore, the points on the graph for the latter group have been connected by a curved line. The two lines for excretory energy diverge at 10 ø C. and below, which may be the accumulative effects of slightly greater bulk of food consumed and lower efficiency of digestion.
Repeated observations showed that the voiding of excrement es- sentially ceases shortly after dark and does not begin again until after the bird has resumed feeding in the morning; the bulk of the excrement is thus voided during the daylight hours. To derive the calories of excrement lost per hour, the total caloric value of the ex-
g•t•] DAVIS, Changes in Energy Balance of English Sparrow 395
crement voided was divided by the daylight hours to which the birds were exposed. Seibert (1949) found that at temperatures of 34 ø, 22 ø, and --13 ø C. English Sparrows voided more per hour on a 10-hour than on a 15-hour day. This would be anticipated in view of the fact that the birds ate more per hour. In the present study similar results were obtained (Table 7). At 26 ø C. a difference of only 8.3 per cent is evident, whereas the average for all other temperatures is 46.7 per cent.
x m 3.0-
u• ,• 2.0 - L• •J _m 1.0-
0 0.0 •
"• 0
FIGUP• 2.
periods.
5 I0 is 20 25 30
TEMPERATURE (•C)
Calories lost in feces per bird per day on 1 O- versus 15-hour photo-
The efficiency with which food is utilized as energy is affected by the type of food consumed, its protein content, and its balance of essential elements and vitamins (Hamilton, 1939). The food which English Sparrows normally consume in nature (Kalmbach, 1940) in many respects is similar to the diet used in these experiments. There- fore, it would be expected that the utilization of the two diets would be similar.
The efficiency of digestion (digestive coefficient) appears to be greatest at 18 ø C., a moderate temperature, and to become progres- sively less in either direction from this midpoint. The average out- of-doors temperature for Champaign-Urbana between May and October, the months during which this experiment was conducted, is 19.4 ø C. Probably the highest digestive coefficient came at 18 ø C. because this approximated the temperature to which the birds were normally adapted. Digestive efficiency is proportionately greater

396 ]DAVIS, Changes in Energy Balance of English Sparrow [ Auk [Vol. 72
on the 15-hour photoperiod, since, for the digestion of a given volume of food, the nutritive processes may work more leisurely.
One would expect some energy utilization by bacteria in the ali- mentary tract, but to date, little progress has been made in the quantitative measurement of this energy. One may assume that it would be no different in the experimental birds than it is in wild birds under natural conditions.
D. Metabolized energy.--For determining the relationship between calories of metabolized energy per bird and temperature (Table 8), a covariance analysis was run in which the weights of all birds were equalized to the actual weighted average (25.15 grams). The re- gression on temperature was linear and equal to --0.346 4. 0.0474 Calories per degree C. The regression on temperature was the same for 10-hour as for 15-hour photoperiods, that is, the slopes of the two lines were the same.
TABLE 8
]•NERG¾ METABOLIZED PER BIRD PER DAY UNDER CONSTANT TEMPERATURE CONDITIONS
Average Temperature Number metabolized Standard
(øC) of birds energy deviation
10-hour photoperiod 0 6 24.9 4- 0.72 1.77 4 4 23.4 4- 1.00 1.99
10 4 24.2 4- 1.04 2.07 18 5 18.7 4- 0.64 1.43 26 7 15.2 4- 0.57 1.52 34 7 13.7 4- 1.01 2.70
15-hour photoperiod 0 6 24.3 q- 0.79 1.93
10 7 25.1 4- 0.75 1.98 18 8 22.2 4- 1.29 3.67 26 10 13.8 4- 1.26 4.01 34 6 16.4 4- 1.19 2.92
It is interesting, however, to note that the value of metabolized energy at the mean temperature, 17.7 ø C., adjusted by covariance analysis, was 19.59 4- 0.554 Calories, while the unadjusted metabo- lized energy at the same temperature, computed from the regression slope drawn from the raw statistics, was 19.65 Calories. There- fore, a simple analysis of variance is tenable and may, in view of the highly significant degree of correlation, apply to the analysis of gross energy and excretory energy.
Furthermore, ranking the metabolized energy values at the dif- ferent temperatures in both photoperiods from h/ghest to lowest is identical before and after adjustment, which, according to Shedecor

•0o•t•] DAws, Changes in •Energy Balance of •English Sparrow 397
TABLE 9
EFFFECTS OF MOLT ON TItE METABOLIZED ENERGY VALUES OF BIRDS SUBJECTED TO CONSTANT TEMPERATURE CONDITIONS
Before molting process began During process of molting
10-hour photoperiod 0 4 80 24.7 -i- 0.98 1.97 2 141 25.4 -i- 1.30 1.84 4 2 45 23.4 -•- 0.95 1.34 2 90 23.4 -•- 2.25 3.18
34 5 88 15.0 -•- 0.75 1.67 4 301 12.9 4- 1.32 2.63
15 -hour photoperiod 34 5 96 16.0-•- 1.16 2.58 3 39 15.34-2.99 5.18
(1946: 322), is another indication in this case of the tenability of using simple analysis of variance.
The fact that the regression coefficient of metabolized energy on temperature was the same for 10- and 15-hour birds indicates that photoperiod does not effect metabolized energy in summer-adapted English Sparrows. Although digestion in summer birds is more complete and efficient on a 15-hour photoperiod, a proportionately faster rate of food consumption may occur on the shorter day. Sei- bert (1949) found the metabolized energy of winter-adapted birds at higher temperatures (34 ø, 24 ø, and 22 ø C.) to be significantly greater on 15-hour rather than on 10-hour days. However, at lower tempera- tures (-13 ø C.) there was no significant difference between the two photoperiods. These differences in effect of photoperiod on summer and winter birds, which may be due to seasonal variations in acclima- tion of the birds, merit further investigation.
Observations on freshly-caught English Sparrows show that molt- ing sometimes begins in the latter part of June and occasionally ex- tends into early November, with most of the molt occurring between July and mid-October. Anticipating a possible correlation between molt and energy balance, records on molt were kept during the course of the investigation. They seem to indicate that cage existence retards the onset of molt and lengthens the molting period. This effect was most pronounced at the lowest temperature employed. In one bird maintained on a 10-hour photoperiod at 0 ø C., molt of the primaries was still only one-half completed on December 21 when the experiment terminated. It should be noted that, although records were kept on weight and molt beyond October, no attempt was made to follow changes in energy balance.

[ Auk 398 DAVIS, Changes in Energy Balance of English Sparrow tVol. 72
TABLE 10
COMPARISON O1' METABOLIZED ENERGY VALUES O1' MALE AND FEMALE ENGLISH SPARROWS AT CONSTANT TEMPERATURE CONDITIONS
i•EGARDLESS OF PHOTOPERIOD
Aver. Cal.
Temperature Number M.E./bird Standard (øC) of birds Sex per day deviation
0 6 Female 25.2 4- 0.87 2.13 6 Male 24.0 4- 0.51 1.25
4 1 Female 24.4 3 Male 23.1 4- 1.32 2.30
10 5 Female 25.3 4- 1.15 2.58 6 Male 24.4 4- 0.58 1.42
18 7 Female 21.3 4- 1.42 3.77 6 Male 20.3 4- 1.33 3.25
26 9 Female 14.6 4- 0.91 2.72 8 Male 14.1 4- 1.41 3.90
34 7 Female 13.5 4- 1.13 2.99 6 Male 16.6 4- 0.87 2.14
Since most of the data were collected between late April and August and since cage life seemed to retard the onset of molt, only 11 of the 70 birds used in the experiments molted. The metabolized energy values of birds before and during molt did not differ significantly (Table 9). No attempt was made to compare metabolized energy values of post-molting conditions with molting and pre-molting con- ditions, since only 18 daily records on one individual out of a total of 1962 records on 70 individuals were obtained after molt was completed.
When an analysis of variance was run on the data in Table 10, the t value 2.73 for 70 individuals--showed by a wide margin no signifi- cant difference between the sexes as regards metabolized energy.
EFFECT OF FLUCTUATING TEMPERATURES
Procedure.--Experiments designed to study the effects of tempera- ture on organisms are usually run at constant temperatures. How- ever, in nature the environmental temperature encountered by most organisms is not constant but undergoes daily as well as seasonal fluctuations. Therefore, for comparison, experiments were run in which the birds were subjected to variable temperatures.
Sixteen birds were kept for a total of 868 bird-days out-of-doors in cages identical with those used in the constant-temperature units, supplied with the same food and water, and otherwise given similar treatment. Since the birds were exposed to normal out-of-doors fluctuations in temperature, humidity, length of day, and light in- tensity, they serve in some measure as controls for the experiments performed under constant conditions.
•}t•] DAws, Changes in Energy Balance of English Sparrow 399
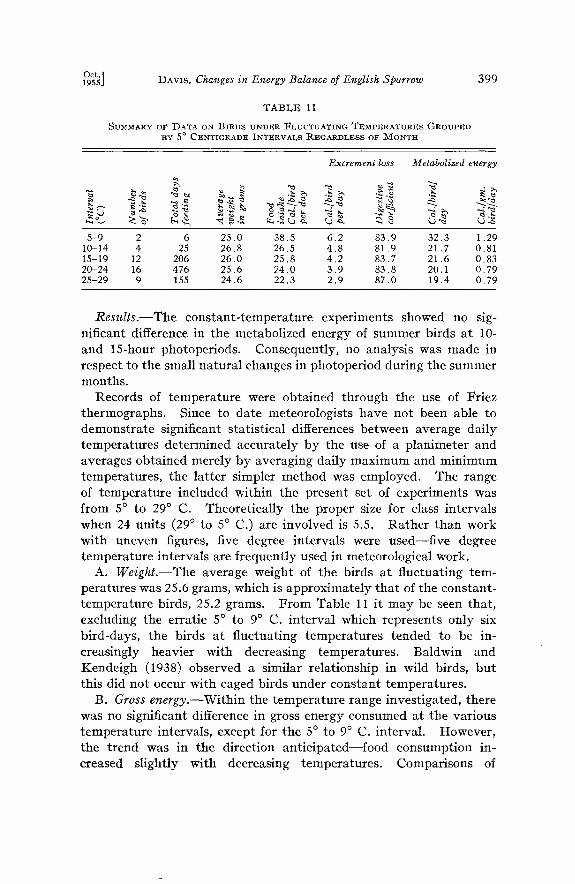
TABLE 11
SUMMARY OF DATA ON BIRDS UNDER FLUCTUATING TEMPERATURES GROUPED BY 5 ø CENTIGRADE INTERVALS REGARDLESS OF MONTH
Excrement loss Metabolized energy
5-9 2 6 25.0 38.5 6.2 83.9 32.3 1.29 10-14 4 25 26.8 26.5 4.8 81.9 21.7 0.81 15-19 12 206 26.0 25.8 4.2 83.7 21.6 0.83 20-24 16 476 25.6 24.0 3.9 83.8 20.1 0.79 25-29 9 155 24.6 22.3 2.9 87.0 19.4 0.79
Results.--The constant-temperature experiments showed no sig- nificant difference in the metabolized energy of summer birds at 10- and 15-hour photoperiods. Consequently, no analysis was made in respect to the small natural changes in photoperiod during the summer months.
Records of temperature were obtained through the use of Friez thermographs. Since to date meteorologists have not been able to demonstrate significant statistical differences between average daily temperatures determined accurately by the use of a planimeter and averages obtained merely by averaging daily maximum and minimum temperatures, the latter simpler method was employed. The range of temperature included within the present set of experiments was from 5 ø to 29 ø C. Theoretically the proper size for class intervals when 24 units (29 ø to 5 ø C.) are involved is 5.5. Rather than work with uneven figures, five degree intervals were used--five degree temperature intervals are frequently used in meteorological work.
A. Weight.--The average weight of the birds at fluctuating tem- peratures was 25.6 grams, which is approximately that of the constant- temperature birds, 25.2 grams. From Table 11 it may be seen that, excluding the erratic 5 ø to 9 ø C. interval which represents only six bird-days, the birds at fluctuating temperatures tended to be in- creasingly heavier with decreasing temperatures. Baldwin and I(endeigh (1938) observed a similar relationship in wild birds, but this did not occur with caged birds under constant temperatures.
B. Gross energy.--Within the temperature range investigated, there was no significant difference in gross energy consumed at the various temperature intervals, except for the 5 ø to 9 ø C. interval. However, the trend was in the direction anticipated--food consumption in- creased slightly with decreasing temperatures. Comparisons of

400 DAVIS, Changes in Energy Balance of English Sparrow [ Auk [Vol. 72
food consumption at fluctuating temperatures of 25 ø to 29 ø C. versus a constant temperature of 26 ø C., 15 ø to 19 ø C. versus 18 ø C., and 10 ø to 14 ø C. versus 10 ø C. showed no significant differences.
C. Excretory energy.--Although the range of daily temperature over which the caloric value of the feces was measured was small
(22 ø to 26 ø C.), the values obtained in 11 tests averaged 3.868 Calories per gram which is slightly higher than the mean for those obtained at comparable constant temperatures, 3.682 Calories. The difference, however, has no statistical significance. As in the case of birds at constant temperatures, the total daily excretory energy of the control birds increased as the temperature decreased.
Whereas the percentage of food intake lost in the excrement by the birds at constant temperatures showed considerable irregular vari- ations, this percentage loss was relatively consistent in the control birds (Table 11). The greatest digestive efficiency was found at the temperature interval 25 ø to 29 ø C. in the controls, instead of 18 ø C. as in the birds at constant temperatures.
TABLE 12 METABOLIZED ]•NEROY OF BIRDS UNDER FLUCTUATING TEMPERATI/RE
CONDITIONS GROUPED AT 5 ø CENTIGRADE INTERVALS OF AVERAGE DAILY TEMPERATURE
Average Cal. metabolizable
Class Number of Number of energy/bird intervals birds bird days per day
April 5 ø- 9 ø 2 6 32.3 Cal. May 10ø-14 ø 3 9 25.0 May 15ø-19 ø 8 84 22.6 May 20ø-24 ø 8 63 20.8 June 10ø-14 ø 1 4 19.5 June 15ø-19 ø 7 47 23.0 June 20o-24 ø 11 118 21.7 June 25ø-29 ø 6 78 21.0 July 20o-24 ø 11 124 19.5 July 25ø-29 ø 9 71 20.6 Aug. 15ø-19 ø 5 18 19.9 Aug. 20o--24 ø 5 117 18.8 Aug. 25ø-29 ø 2 6 18.6 Sep. 10ø-14 ø 2 6 21.0 Sep. 15ø-19 ø 3 36 20.1 Sep. 20o-24 ø 3 45 19.2 Oct. 10%14 ø 2 6 21.0 Oct. 15ø-19 ø 3 21 20.8 Oct. 20o-24 ø 2 9 19.5
D, Metabolized energy.--With the exception of the 5 ø to 9 ø inter- val, the metabolized energy per bird per day increased only slightly with drop in temperature (Table 11). When an analysis of variance is made of the metabolized energy of the controls, having them grouped

oct.1 19ssl DAvzs, Changes in Energy Balance of JEnglish Sparrow 401
by months as well as by temperatures (see Table 12) the F tables show a highly significant difference between class intervals--the calculated F value (3.00) was greater than the table values (2.00 and 2.71) at both the 5 per cent and 1 per cent levels. However, when a similar test is run omitting the 5 ø to 9 ø interval for April, individual groups did not differ significantly from one another. Except for July, within each month a tendency for metabolized energy to decline slightly with increased temperatures is apparent. This change is in the direction anticipated.
'-'-' •,, ;31- ',,
=36- MAY JUNE JULY AOGUST SEPT.
"---, " "'" V'' ;- ",, ,". • '
21- •, •_J
MAY JUNE JULY AUGUST -qEPT.
Fmu• 3. Gross energy consumption (broken liues) in relation ro environmental temperature (solid lines) during 1950. Top graph, Bird 8b, male; middle graph, Bird 9b, female; bottom graph, Bird 12b, male.
In an effort to determine whether a bird utilized the same energy at the same temperature interval in different months, an analysis of variance was made for the interval 20 ø to 24 ø C. This analysis showed no significant difference between months.
Figure 1 indicates that a summer bird kept constantly at 12 ø C. would have a metabolized energy of about 0.85 Calories per gram bird per day. Under fluctuating temperatures, birds kept at an average range of 10 ø to 14 ø C. would require about the same amount, or 0.81 Calories (Table 11). Again referring to Figure 1, it can be seen that at a constant temperature of 27 ø C. a summer bird would have a metabolized energy of about 0.65 Calories per gram bird per day; while Table 11 indicates that under fluctuating temperatures,

402 DAvis, Changes in Energy Balance of English Sparrow [ Auk [Vol. 72
birds kept at an average of 25 ø to 29 ø C. still require about the same amount of energy as they required at 12 ø C., 0.79 Calories. The con- stancy of food consumption in spite of changes in environmental tem- perature is illustrated in Figure 3 and offers an explanation for the constancy of metabolized energy. When the environmental tem- perature rises, the bird continues to consume approximately the same amount of food as it did at the lower temperature because of the lag in its physiological response to higher temperature. Conse- quently, it will have a higher metabolized energy than is character- istic of a bird held at a comparable, constant high temperature. Under fluctuating out-of-doors conditions there is little or no chance for the bird to encounter the five to ten days necessary to adjust its feeding to a given temperature (see page 388). Therefore, the energy intake does not adjust fully to day by day variations in temperature but only to the general trend from week to week or month to month. There are some indications that changes in energy balance were com- pensated for by change in weight or in aetivlty. This could be detected in some eases by changes in weight at the end of a three-day interval, but the correlation with weight was not consistent because of probable variations in activity which were not measured.
DISCUSSION
Some twenty years ago Kendeigh initiated a series of researches to determine the manner in which the energy balance of the bird is affected by environmental factors, hoping thereby to gain a better understanding of the causes regulating the distribution, migration, abundance, reproduction, and other aspects of bird behavior. It was suggested that, by determining in the laboratory the effect of air temperature and photoperiod upon energy balance, it would be possible to calculate what changes may occur in this balance from month to month under natural conditions out-of-doors. Accordingly, Kendeigh (1949) performed a number of constant-temperature, constant-photoperiod experiments with English Sparrows in the winter phase of their annual cycle. This paper is concerned with the summer phase in the annual cycle of the same species.
Although a covariance analysis and a comparison of metabolized energy values before and after adjustment by covariance showed that it was not necessary to adjust for differences in weight within the narrow range of variability encountered in birds maintained at constant temperatures (see page 396), the great seasonal variability in weights of birds living out-of-doors does necessitate adjustment for differences in their weights. In the discussion which follows,

109}t•] DAWS, Changes in Energy Balance of English Sparrow 403
this adjustment is made by first expressing energy balance in units of per gram bird, rather than per bird. Seibert accomplished the same purpose by computing his results for each bird on the basis of per 1000 gram bird weight.
When the metabolized energy for the present series of investi- gations is plotted against temperature (Figure 1), the regression coefficient is 0.0138 q-0.00188 Calories per gram bird per day per degree change of temperature. Assuming an equal precision for the two experiments--(I used 70 birds; Kendeigh, 53) the regression coefficient of winter birds, 0.0108 Calories per gram bird per day, would have a standard error of q- 0.00214. Since the difference
between the two coefficients, 0.0030 q- 0.00285 Calories per gram bird per day, is only slightly more than one standard error, there is no significant difference between the two regression slopes and either of them may be used. As the regression line for summer birds runs only from 34 ø to 0 ø C., while that for winter birds continues to -31 ø C., the longer of the two lines has been used in correlating energy exchanges of laboratory birds with out-of-doors birds. This avoided the discrepancy which would have arisen at 0 ø C. had the line for summer birds been used as a reference line for 34 ø to 0 ø C. and the line for winter birds been used for 0 ø to --31 o C. The metab-
olized energy per gram bird per day for winter-adapted birds at 0 ø C. is 0.99 Calories, while that for summer birds at the same temperature is 1.02 Calories.
Kendeigh and Seibert reasoned that confining the birds individually to small cages resulted in minimizing the expenditure of energy to a point where energy was used for little other than for the maintenance of existence. Therefore, it appeared that there would be no particular productive energy involved and that the metabolized energy in these experiments was equivalent to existence energy.
On this basis, knowing the mean monthly temperature, the existence energy in Calories per gram bird per day for English Sparrows at Champaign, Illinois, could be read directly from Figure i. However, the computation of existence energy per bird per day may not be computed merely by multiplying Calories per gram bird per day by actual out-of-doors weight. By plotting Calories of metabolized energy per bird per day against individual bird weights at each temperature, Kendeigh (1949) determined that, for each additional gram of weight above the average of 23.8 grams, approximately 0.7 Calories of metabolized energy was required at any temperature to keep the bird in energy balance. Therefore, the effective weight of the birds would be equal to 0.7 (gram weight --23.8)q-23.8.

404 DAVIS, Changes in Energy Balance of English Sparrow [ Auk [Vol. 72
The following formula was used for converting Calories per gram bird per day of metabolized or existence energy into Calories per bird per day: Cal./bird/day = Cal./gm. bird/day (23.8) q-0.7 (gm. wt. -23.8). Average monthly weights for birds existing in nature were computed by combining data obtained by Baldwin and Kendeigh (1938) with those which I secured (Table 13).
TABLE 13
COMPILATION OF DATA ON WEIGHTS OF FRESHLY CAUGHT BIRDS
*Baldwin and
Davis Kendeigh Total No. Wt. No. Wt. number Average
Feb.
April
May
July
Aug.
Sep.
Females 7 27.1 33 28.2 40 28.0 Males 8 28.4 34 29.9 42 29.6 Both 82 28.8
Females 17 28.0 20 28.3 37 28.1 Males 16 28.4 19 28.6 35 28.5 Both 72 28.3
Females 7 28.2 6 29.0 13 28.6 Males 8 28.8 6 29.7 14 29.2 Both 27 28.9
Females 18 30.0 2 30.0 20 30.0 Males 6 28.6 1 26.5 7 28.3 Both 27 29.2
Females 22 28.3 22 28.3 Males 13 27.8 1 27.0 14 27.8 Both 36 28.0
Females 20 26.5 3 28.1 23 26.7 Males 16 27.7 4 27.2 20 27.6 Both 43 27.2
Females 12 28.0 6 26.2 18 27.4 Males 11 27.1 7 26.5 18 26.9 Both 36 27.2
Females 1 26.4 2 32.3 3 30.0 Males 3 28.7 4 26.1 7 27.2 Both 10 28.6
Females 1 26.7 1 26.7 Males 3 27.1 3 27.1 Both 4 26.9
* Baldwin, S. P., and S.C. Kendeigh, 1938.

Oct.1 19551 DAVIS, Changes in Energy Balance of English Sparrow
TABLE 13--Continued
COMPILATION OF DATA ON WEIGHTS OF FRESHLY CAUGHT BIRDS
405
*Baldwin and
Davis Kendeigh Total No. Wt. No. Wt. number A vetage
Oct.
Females Males Both
Nov.
Females 4 27.8 Males 12 27.6 Both
Dec.
Females 7 27.6 Males 5 29.4 Both
Summary Females 115 28.0 Males 98 28.5 Both 213 28.2
3 25.4 3 25.4 3 27.1 3 27.1
6 26.2
4 27.8 12 27.6 16 27.7
1 26.7 18 27.6 7 28.4 12 28.8
20 28.2
77 27.8 192 27.9 89 28.7 187 28.6
166 28.2 379 28.2
* Baldwin, S. P., and S.C. Kendeigh, 1938.
TABLE 14
VARIATIONS IN MONTHLY •NVIRONMENTAL CONDITIONS AND ENERGy BALANCE oi* ENGLISH SPARROWS AT CHAMPAIGN, ILLINOIS
Maximum potential Pro- Actual Effective metabolized energy Existence energy ductire
Mean average bird Cal./gm. Cal.[bird Cal. per Cal. per energy temp. bird wt., weight, bird per per day gm. bird bird per Cal./bird (øC) in grams in grams day per day day per day
Jan. -2.9 28.8 27.3 1.31 35.76 1.019 27.82 7.94 Feb. --1.9 28.3 27.0 1.26 34.02 1.006 27.16 6.86 Mar. 4.3 28.9 27.4 1.20 32.88 0.940 25.76 7.12
Apdl 10.5 29.2 27.6 1.15 31.74 0.872 24.07 7.67 May 16.3 28.0 26.7 1.10 29.37 0.810 21.63 7.74 June 21.6 27.2 26.2 1.04 27.25 0.752 19.70 7.55 July 24,0 27.2 26,2 0.99 25.94 0.727 19.05 6,89 Aug. 23.0 28.6 27.2 1.04 28.29 0.738 20.07 8,22 Sep. 19.0 26.9 26.0 1.10 28.60 0.780 20.28 8.32 Oct. 12.3 26.2 25.5 1.15 29.32 0,853 21.75 7.57 Nov. 4,9 27.7 26.5 1.20 31.80 0.933 24.72 7.08 Dee. --1,0 28.2 26.9 1.26 33.89 0.998 26.85 7.04
The maximum metabolized energy per gram bird per day obtained for winter birds at -31 ø C. is 1.31 Calories, while for summer birds at 0 ø C. it is 0.99 Calories, a difference of 0.32 Calories. There appears to be no evidence that would indicate a sharp break in the

406 DAVIS, Changes in Energy Balance of English Sparrow [ Auk [Vol. 72
maximum potential amounts of metabolized energy available per gram bird per day in summer as compared with winter. So in pre- paring this column in Table 14 the difference of 0.32 Calories between these maxima was distributed evenly among the intervening months, 0.053 Calories being added accumnlatively each month in either direction from the 0.99 Calories characteristic of July. Potential energy is computed by multiplying effective weight by the monthly maximum potential metabolized energy. Knowing the potential energy, it is then possible to compute productive energy by sub- tracting existence energy from the potential energy.
The data thus obtained have been plotted graphically in Figure 4, the straight lines being fitted to the observed points by the least squares method. The lines for potential and existence energy parallel one another, being lowest in the summer and highest in the winter. Existence energy is greatest in January when 78 per cent of the poten- tial intake is used for this purpose; it is least in July, 73 per cent of the potential intake being used at that time. Graphically there is a difference of about 9.3 Calories of metabolized energy per bird per day between the minimum summer and maximum winter existence requirements; on the basis of actual statistics, this difference is 8.77. If the birds were actually at existence energy, this difference would represent the additional amount of energy required to enable the bird to be a permanent resident.
Although Kendeigh (1949) realized that the number 1.31 for maxi- mum metabolized energy for winter birds might not also be applicable to summer birds, he used it tentatively for preparing curves similar to those in Figure 4. While Kendeigh's graph indicated a drop in existence energy and rise in productive energy during the warm, sum- mer months and an increase in existence energy requirements, ac- companied by decreased productive energy during the cold, winter months, the graph plotted from a compilation of Kendeigh's data with data obtained in the present investigation has a curve for exis- tence energy similar to Kendeigh's but has a flat line representing productive energy. Such a flat line suggests that the productive energy of non-migratory birds is constant throughout the year. Ap- parently energy-demanding activities are spaced so as to make the best use of this energy at different times.
Experiments performed by Baldwin and Kendeigh (1932), Kendeigh (1939), and Scholander et al, (1950) indicate the value of feathers as heat insulators. Since the more heavily feathered winter birds had to absorb as much food as the summer-adapted birds to maintain homeostasis at the same environmental temperature--their metabo-

DAVIS, Changes in Energy Balance of English Sparrow 407
15-
IO- PRODUCTIVE ENERGY
S -3 ! I I I I I I I I I ; J F M A M d J A $ O 1'4 D J
MON T H
Fictra• 4. Variations in the energy balance of English Sparrows throughout the year at Champaign, Illinois. Broken lines represent regression slopes derived by the least squares method.
lized energies were the same--it would seem that the winter-adapted birds had a higher metabolic rate and, accordingly, greater thyroid activity. Metabolic rate experiments and histological investigations by Miller (1939) on the English Sparrow and examination for cyclic changes in thyroid size by Riddle and Fisher (1925) on the pigeon

408 DAWS, Changes in Energy Balance of English Sparrow [ Auk [Vol. 72
are in agreement with this hypoœhesis. Unmeasured seasonal changes in cage activity might also help to account for summer-adapted birds' having metabolized energy values similar to those of the more heavily feathered winter-adapted birds.
It is difficult to explain why the maximum metabolized energy for caged winter birds is 1.31 Calories per gram bird per day while that of caged summer birds is 1.02 Calories, especially when their metabolized energy values are approximately the same down to 0 ø C. At --31 ø C. caged winter birds were able to consume 1.63 Calories per gram bird per day; at 0 ø C., the lowest temperature at which caged summer birds were able to maintain themselves, the latter consumed 1.26 Calories per gram bird per day. Obviously an increase in food consumption at the lower temperature is a physiological necessity. There must be some physiological adaptation in acclima- tion to winter conditions that permits these birds to consume and metabolize a greater amount of food. Perhaps the thyroid of winter birds may not only be more active than that of summer birds down to 0 ø C. but may also be responsible for the bird's ability to carry on an active metabolism below 0 ø C., differences in both relative and absolute amounts of thyroid secretion and storage being critical below tem- peratures approximating 0 ø C.
Although productive energy for such non-migratory birds as the English Sparrow is nearly constant throughout the year, migratory birds may possibly have peaks of productive energy during spring and fall migration. They are known to become fat just prior to migrating northward (Odum and Perkinson, 1951; Wolfson, 1954). This may be associated with the onset of favorable weather conditions and a physiological lag (see pages 401-402) in adjustment to it. Being adapted to colder conditions, the birds would continue for several days to eat amounts of food comparable to those consumed at a lower temperature. Such a condition of positive energy balance may be a requisite to migration. The fact that nesting activities frequently begin immediately after the onset of warm weather (see Kendeigh, 1934: 348; and Nice, 1937 for review of literature) may also initially be correlated with physiological lag, continuation of the activities being dependent upon the continued positive energy balance associated with warmer weather. The lack of such positive energy balances may be of some significance in determining the ultimate limits of the range of some species of birds.

Oct.1 19ssl D•vrs, Changes in Energy Balance of English Sparrow 409
SUMMARY A•X) CO•CI•USIO•S
1. Although caged summer-adapted English Sparrows under con- stant temperature conditions ate proportionately less per hour on a 15-hour than on a 10-hour photoperiod, there was no significant difference between total daily food consumption in the two groups. The gross energy for the combined photoperiods increased as a straight line with decreasing temperatures, the rate of increase being 0.0167 Calories per gram bird per day per degree C.
2. No constant relationship exists between temperature and the caloric value of one gram of feees in summer-adapted English Sparrows. However, when data for the two photoperiods are combined, the total amount of excrement and the total calories lost in the excrement
per day are greater at low than at high temperatures, the relationship between temperature and total excretory energy being linear and changing at the rate of 0.004 Calories per gram bird per day per degree C.
3. For birds at both 10- and 15-hour photoperiods the regression lines obtained by plotting metabolized energy against temperature are linear and equal, changing at the rate of --0.0138 :k 0.00188 Calories per gram bird per day per degree C. This value is not significantly different from that obtained for winter birds.
4. The metabolized energy values of birds before and during molt were not significantly different at comparable temperatures.
5. Summer-adapted English Sparrows attained a maximum metab- olized energy of 1.02 Calories per gram bird per day at 0 ø C., failing to survive more than a few days on a 10-hour photoperiod when the temperature dropped below zero. This is considerably less than the maximum of 1.31 Calories reached at --31 ø C. during the winter phase of the annual cycle. This discrepancy probably finds its basis in pituitary-thyroid interactions not yet thoroughly understood.
6. The average amount of weight lost by summer-adapted English Sparrows upon individual confinement in small cages was 11.4 per cent (3.3 grams), with females losing an average of 5.5 per cent (1.7 grams) more than males.
7. There was no significant difference in the metabolized energy values between the sexes at constant or fluctuating environmental temperatures.
8. Caged birds under fluctuating temperatures tended to become increasingly heavy with decreasing temperatures within the range investigated. This was not evident with birds held at constant temperatures but is comparable with the situation existing in nature.

DAVIS, Changes in Energy Balance of English Sparrow [ Auk [Vol. 72
9. Comparisons of the same temperature interval during different months between May and October showed no significant difference in metabolized energy values of birds maintained at fluctuating temperatures.
10. The metabolized energy values of the control birds do not vary significantly within the temperature range of 10 ø to 29 ø C., although within the same range birds maintained at constant tempera- tures evidenced an inverse relationship amounting to 7.0 Calories per bird per day. The constancy of food consumption in spite of changes in environmental temperature offers an explanation for the constancy of metabolized energy. When the environmental tempera- ture rises, the bird continues to consume approximately the same amount of food as it did at lower temperatures because of the lag in its physiological response to higher temperatures. Under fluctuat- ing, out-of-doors conditions there is little or no chance for the bird to experience the five to ten days necessary to adjust its feeding to a given temperature. Therefore, energy intake does not adjust fully to day by day variations in temperature but only to the general trend from week to week or month to month.
11. When applied to the energy balance of birds existing out-of- doors, a compilation of the data gained by studying birds maintained at constant temperatures shows the potential energy to be greatest in January (35.76 Calories per bird per day) and least in July (25.94: Calories). However, since existence energy is trigbest in the winter (27.82 Calories during January) and proportionately lower in the summer (19.05 Calories during July) productive energy remains essentially unchanged throughout the year in a nonmigratory bird such as the English Sparrow.
12. The constant productive energy balance throughout the year in the English Sparrow suggests that in permanent resident birds there is good adjustment throughout the year to the greater or lesser energy demands of cold, nesting activities, molting, etc. The actual initiation of nesting and molting, however, may be associated with positive energy balances acquired as a result of favorable physiological lags. Migratory and non-migratory birds may be limited in their distribution and migratory status according to their relative adapta- tions for moving into and out of or remaining in areas where they can build up their short peaks of energy or maintain favorable balances of productive energy.
LITI•RATURI• CITI•D
BALDWIN, S. P., and S.C. KENDErail. 1932. Physiology of the temperature of birds. Sci. Publ. Cleveland Mus. Nat. Hist., 3: 1-196.

Oct.1 195Sl DAVIS, Changes in Energy Balance of English Sparrow 411
BALDWIN, S. P., and S.C. KENDEIGH. 1938. Variations in the weight of birds. Auk, 55: 416-467.
BRANDT, A.E. 1950. Empirical formulas: Fitting non-periodic curves to experi- mental data. Unpublished.
BURGER, J.W. 1949. A review of experimental investigations of seasonal repro- duction in birds. Wilson Bull., 61: 211-230.
E¾STER, M.B. 1952. Quantitative measurement of the influence of photoperiod, temperature, and season on the activity of captive songbirds. Doctorate thesis, Univ. of Ill.
FORBES, E. B., and H. S. GRINDLE¾. 1923. On the formulation of methods of pcrimentation in animal nutrition. Bull. Nat. Res. Council, 6: 1-54.
HAMILTON, T.S. 1939. The heat increment of diets balanced and unbalanced with respect to protein. Journ. Nutr., 17: 583-599.
KALMBACHt, E.R. 1940. Economic status of the English Sparrow in the United States. U.S. Dept. Agr., Tech. Bull. 711: 1-66.
KENDEIGHt, S.C. 1934. The role of environment in the life of birds. Ecol. Monog., 4: 299-417.
KENDEIGI-I, S.C. 1939. The relation of metabolism to the development of temper- ature regulation in birds. Journ. Exp. Zool., 82: 419-438.
KENDEIGI-I, S.C. 1944. Effect of air temperature on the rate of energy metabolism in the English Sparrow. Journ. Exp. Zool., 96: 1-16.
KENDEIGI-I, S.C. 1949. Effect of temperature and season on energy resources of the English Sparrow. Auk, 66: 113-127.
KLEIBER, M., and J. E. DOUGI-IERTY. 1934. The influence of environmental tem- perature on the utilization of food energy in baby chicks. Journ. Gen. Phys., 17: 701-726.
I•ESI-IER, S. W., and S.C. I•ENDEIGI-I. 1941. Effect of photoperiod on molting of feathers. Wilson Bull., 53: 169-180.
MILLER, D.S. 1939. A study of the physiology of the sparrow thyroid. Journ, Exp. Zool., 80: 259-285.
NICE, M.M. 1937. Studies in the life history of the song sparrow. I. Trans. Linn. Soc. N.Y., 4: 1-247.
OPUS, E. P., and J. D. PERKINSON, JR. 1951. Relation of lipid metabolism to migration in birds: seasonal variation in body lipids of the migratory White- throated Sparrow. Physiol. Zool., 24: 216-230.
RIDDLE, O., and W. S. FISHER. 1925. Seasonal variations of thyroid size in pigeons. Amer. Journ. Phys., 72: 464-487.
SCI-IOLANDER, P. F., R. HOCK, V. WALTERS, F. JOHNSON, and L. IRVING. 1950. Heat regulation in some arctic and tropical mammals and birds. Biol. Bull., 99: 237-258.
SEIBERT, H.C. 1949. Differences between migrant and nonmigrant birds in food and water intake at various temperatures and photoperiods. Auk, 66: 128-153.
SNEDECOR, G. W. 1946. Statistical methods. Collegiate Press, Inc., Ames: vii-xiii q- 1-341.
WOL•*SON, A. 1954. Weight and fat deposition in relation to spring migration in transient White-throated Sparrows. Auk, 71: 413-434.
Department of Anatomy, College of Osteopathic Physicians and Sur- geons, 1721 Gri•n Avenue, Los Angeles 31, California, March 25, 1953.


![SEASONAL VARIATIONS IN THE TREE SPARROW · 2015. 3. 4. · Vol. 1938 55] J BAUMGARTNER, Seasonal Variations in Tree Sparrow 605 develop until near the end of the molt. One of the](https://img.pdfslide.net/doc/110x75/60a54bc2aba73334436c2df9/seasonal-variations-in-the-tree-sparrow-2015-3-4-vol-1938-55-j-baumgartner.jpg)