Embed Size (px)
Citation preview

1
SEDIMENT BUDGET ON THE INDIANA SHORE AT BURNS HARBOR, LAKE MICHIGAN
ANDREW MORANG1, ASHLEY E. FREY1, DAVID F. BUCARO2, AND
SARA BRODZINSKY2
1. U.S. Army Engineer Research and Development Center, Coastal and Hydraulics Laboratory, 3909 Halls Ferry Road, Vicksburg, MS 39180, USA. [email protected]
2. U.S. Army Engineer District, Chicago, 231 LaSalle Street, # 1500, Chicago, IL 60604, USA. [email protected]
Abstract: Net sediment transport in the littoral cell extending from Michigan City Harbor, IN, to Burns Waterway Harbor, IN, USA, is from east to west. For the four decades following construction of the Burns Waterway Harbor, net transport averaged about 190,000 yd3/year. Of this amount, accumulation in the fillet east of the Arcelor-Mittel bulkhead was 106,000 yd3/year, while dredging from the Bailly Generating Station cooling water intake was 83,000 yd3/year. The total transport calculated in this study is higher than most published previous estimates. The volume of sediment now bypassing the lakeward end of the bulkhead and entering the Federal harbor is estimated to be 84,000 yd3/year. This value will have to be confirmed from dredging statistics in the future. An average of 61,000 yd3/year of sand has been placed both on beaches at the National Park Service West Beach Unit west of Portage/Burns Waterway and offshore at Ogden Dunes. Full bypassing should to be about three times this amount to equal the longshore transport value of about 190,000 yd3/year.
Introduction
Shoreline changes along the Indiana coast of Lake Michigan have been a concern for the U.S. Army Corps of Engineers (USACE), the National Park Service (NPS), Indiana Department of Natural Resources, the Town of Ogden Dunes, and other municipal and private entities since at least the 1960s. The Burns Waterway Harbor project was controversial for decades before construction began in the 1960s, and the USACE was well aware of potential littoral disruptions. Burns Waterway Harbor is located within a longshore littoral drift system with net westward movement of sediment (Hill 1974; Shabica and Pranschke 1994). In 2006 and subsequent years, sand needed to be dredged from the federal Burns Waterway Harbor after a non-dredge interval of a decade (USACE Chicago 2010). This indicates that the impoundment east of the harbor bulkhead has filled enough that sand is now moving around the structure and entering the federal harbor further to the west. In April 2012 and July 2013, commercial freighters grounded in the approach channel, underscoring the fact that sediment is now bypassing the fillet. In addition, the NPS is concerned about erosion of their property west of the Burns Small Boat Harbor, and further west, the Town of Ogden Dunes has experienced erosion and property damage.
146 20/03/2015
16 pp

2
A 905(b) Reconnaissance Report, approved by the Great Lakes and Ohio River Division of the USACE in November 2010, recommended that a Feasibility Study be conducted to investigate alternative plans to mitigate impacts of federal navigation structures on the shoreline east and west of Burns Waterway Harbor (USACE Chicago 2010). By incorporating goals of Regional Sediment Management (RSM), sediment will be treated as a resource to benefit the entire system rather than as a nuisance to be eliminated regardless of the consequences on the coastal environment. One element in implementing RSM along the Lake Michigan shore was to develop a sediment budget for the following purposes:
• Gaining a better understanding of coastal processes in the area.
• Identifying effects of harbor structures on these processes.
• Identifying sources, sinks, and pathways of sediment.
This analysis covered the reach between Michigan City Harbor and Ogden Dunes. This paper summarizes the sediment budget developed by the USACE Engineer Research and Development Center, Coastal and Hydraulics Laboratory (CHL) and the USACE Chicago District (LRC). Another purpose of this study was to document in one place historical data as a resource for future researchers.
Note on units: Cross-shore profile and other dimensional data have been reported in English units as they were originally collected and plotted. Dredge volumes are reported in cubic yards (yd3), as per common usage for dredging and engineering projects in this area. (1 ft = 0.3048 m; 1 yd3 = 0.7646 m3)
Study Area and Conditions
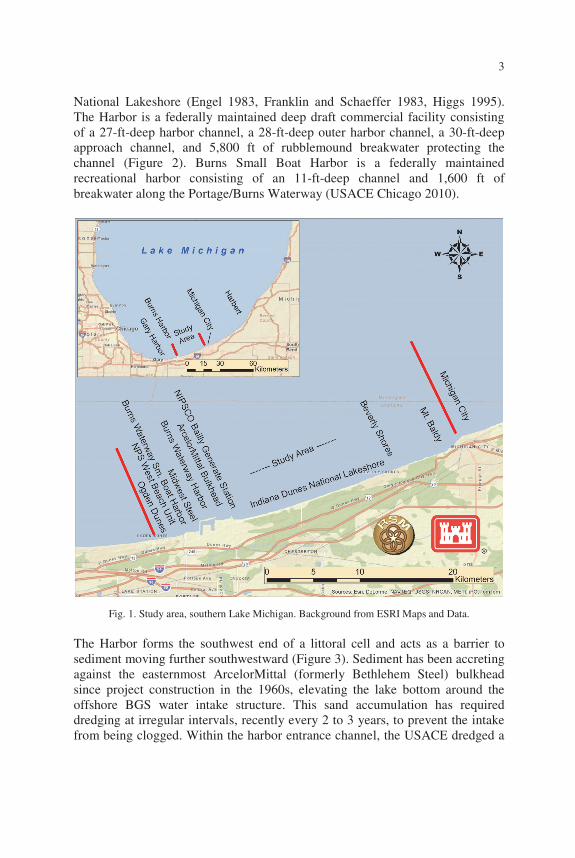
Burns Waterway Harbor (also known as International Port of Indiana or Port of Indiana) is located in Porter County, IN, USA (Figure 1). The project area includes, from east to west, the Indiana Dunes National Lakeshore (INDU); Indiana Dunes State Park; Bailly Generating Station (BGS), owned by the Northern Indiana Public Service Company (NIPSCO); the bulkhead at ArcelorMittal steel; Burns Waterway Harbor and associated structures which comprise the International Port of Indiana; the bulkhead at U.S. Steel, Burns Small Boat Harbor at the mouth of Portage/Burns Waterway; a second segment of the INDU (the West Beach Unit); and shoreline at the community of Ogden Dunes (USACE Chicago 2010).
The River and Harbor Act of 1965 authorized construction and improvement of Burns Waterway Harbor after decades of study, considerable controversy, and some heavy negotiating that finally led to the formation of the Indiana Dunes
146 20/03/2015
16 pp
3
National Lakeshore (Engel 1983, Franklin and Schaeffer 1983, Higgs 1995). The Harbor is a federally maintained deep draft commercial facility consisting of a 27-ft-deep harbor channel, a 28-ft-deep outer harbor channel, a 30-ft-deep approach channel, and 5,800 ft of rubblemound breakwater protecting the channel (Figure 2). Burns Small Boat Harbor is a federally maintained recreational harbor consisting of an 11-ft-deep channel and 1,600 ft of breakwater along the Portage/Burns Waterway (USACE Chicago 2010).
Fig. 1. Study area, southern Lake Michigan. Background from ESRI Maps and Data.
The Harbor forms the southwest end of a littoral cell and acts as a barrier to sediment moving further southwestward (Figure 3). Sediment has been accreting against the easternmost ArcelorMittal (formerly Bethlehem Steel) bulkhead since project construction in the 1960s, elevating the lake bottom around the offshore BGS water intake structure. This sand accumulation has required dredging at irregular intervals, recently every 2 to 3 years, to prevent the intake from being clogged. Within the harbor entrance channel, the USACE dredged a
146 20/03/2015
16 pp

4
total of 473,000 yd3 from 2006-2009 after having not needed such maintenance for over a decade. This indicates that the impoundment east of the ArcelorMittal bulkhead had filled and sand moving around the bulkhead (Figure 2). USACE Chicago (2010) provides more in-depth background on sediment issues, summarizes public concerns, lists previous studies, and tabulates dredging.
Fig. 2. Burns Waterway Harbor (at west) and ArcelorMittel bulkhead at east side of complex (from USACE Chicago web page). Area on east behind bulkhead was never completely filled.
Fig. 3. Fillet area east of NIPSCO Bailly Generating Station (BGS), 16 Oct. 2010. The water in the lower right is the warm water outfall.
146 20/03/2015
16 pp

5
Sediments and Littoral Transport
Geomorphically, much of the south shore of Lake Michigan consists of sandy beach with sand dunes and inland marshes, and mixed sand and clay lakebed offshore. The southwest end of the lake close to Gary and South Chicago has been extensively developed or urbanized, greatly altering the original surface morphology. Even in less-developed areas, many of the dunes were mined for sand in the early 20th century (USACE Buffalo 2008). For example, a parabolic dune named “Hoosier Slide” in Michigan City, reported to be 200 ft high, is gone. The Ball Company of Muncie, IN, mined the quartz sand and made canning jars from the material (KellerLynn 2010). In addition, dunes in the Long Lake area west of Ogden Dunes (now in the INDU West Beach Unit) were mined and the sand was transported to Chicago, where it became lakefront fill before and after the 1893 World’s Fair. The remaining dunes, marshes, and forests have been incorporated into the INDU and the Indiana Dunes State Park. Most creeks or rivers supply minimal sediment to the coast in this region. The exception is the Portage/Burns Waterway, which receives bank erosion sediment from the east and west arms of the Little Calumet River, that converge and flow to Lake Michigan via the Waterway. Sediment dredged from the Portage/ Burns Waterway was placed at Ogden Dunes in the 1980s and 2000s. Sand on southern Lake Michigan beaches historically was supplied from bluff and lakebed erosion and, to a lesser degree, intermittent stream input (Shabica and Pranschke 1994). In the pre-development era, bluffs up to 75 ft along the Illinois and Michigan shores were the primary source of sand for the southern beaches. But since the mid to late-1800s, bluffs along the Illinois lakeshore have been protected with steel, concrete, and stone armor. Compounding the problem, structures such as the jetties and breakwaters at Waukegan, Great Lakes Naval Station, Wilmette, Chicago, and Indiana Harbor and Ship Canal in East Chicago almost totally interrupted the movement of sediment to the south (Chrzastowski and Trask 1995). Much of the southwest Illinois shore, essentially all of Chicago, is now armored or artificial. On the Michigan shore, bluffs have been less armored than in Illinois, but jetties at St. Joseph, New Buffalo and Michigan City Harbor have also largely interrupted sand transport from this source. Shabica and Pranschke (1994) report that nearshore lakebed erosion, which historically provided 20 to 40 percent of the new sand to the system, will soon become the primary source of sand for the southern beaches. Net longshore transport near Michigan City is from north to south. W.F. Baird & Associates (2004), using a numerical model COSMOS, computed that about 99,400 yd3/year naturally bypasses the shoal offshore of the harbor breakwater.
146 20/03/2015
16 pp

6
The coast between the Michigan City Harbor and Burns Waterway Harbor has been generally recessional during the 20th century, with the highest dune-bluff recession and shoreline erosion occurring near Mount Baldy. Erosion rates gradually decrease westward. In 1974, a rock revetment was constructed along the Town of Beverly Shores to protect Lake Front Drive (Figure 1). West of Mount Baldy, W.F. Baird & Associates (2004) computed net longshore transport to be 247,000 yd3/year to the west. The source of the sediment was bypassing at Michigan City Harbor, beach nourishment at Mount Baldy, and shoreline and dune loss. At Burns Waterway Harbor, Sargent and Lundy (1978) reported longshore transport to be 80,000 yd3/year to the west. This was based on the transport value at Michigan City, from the Shore Protection Manual (1973). Wood et al. (1990) estimated 75,500 yd3/year to the west based on wave modeling. These volumes are significantly lower than the W.F. Baird value from Mount Baldy. Proceeding west, the next section of coast is bounded by Burns Waterway Harbor on the east and the U.S. Steel revetment at Gary on the west. Wood and Davis (1986) documented how Burns Waterway Harbor had blocked essentially all littoral drift, resulting in severe erosion along the Midwest Steel property immediately downdrift (west) of the federal harbor. Based on aerial photographs, they documented that the highest sediment loss was in the east portion of the reach near Burns Waterway Harbor, while moderate to high gain occurred in the western portion near Gary Harbor. Data Sources, Management, and Organization
Software
Spatial data was organized and displayed in ESRI® ArcMap™ Geographic Information System (GIS) software, version 9.3.1 or 10.0, with data projected to Universal Transverse Mercator (UTM) Zone 16N, North American Datum 1983, units in meters. Features specifically related to an elevation (for example, +2 ft low water datum (LWD) shoreline position) are referenced to International Great Lakes Datum (IGLD) of 1985 (Coordinating Committee on Great Lakes Basic Hydraulic and Hydrologic Data 1992). Cross-shore profiles were plotted in the Regional Morphology and Analysis Package (RMAP) software, version 3.2 (Morang et al. 2009). Survey Locations/Monuments
During the 1960s and early 1970s, the USACE collected cross-shore beach profiles along the Indiana shore. These were called the CERC lines (after the Coastal Engineering Research Center) and were numbered CERC1, east of
146 20/03/2015
16 pp

7
Gary, to CERC18, near Michigan City Harbor. The locations were never monumented with permanent benchmarks or latitude and longitude coordinates. To determine true geographic locations, the Indiana Department of Natural Resources (DNR) used the text descriptions on the 1960s survey notes to visually identify the origins using high-resolution photography in Google Earth Pro. One of the authors (Steven Davis) of the 1986 shoreline situation report; (Wood and Davis 1986), sent a .kmz file to CHL. This file was converted to a shapefile and plotted in ArcMap. The Great Lakes Coastal Research Lab (GLCRL) at Purdue University monitored performance of beach nourishment placed in 1974 and 1981 at Mt. Baldy with another set of profiles. These were labeled as “SR” lines and overlap with some of the CERC lines. Starting in 1996, the USACE began a regular beach fill nourishment program at Mt. Baldy. From 1996 to 2004, another series of profiles were collected to monitor the beaches before and after the fills at Mt. Baldy. American Surveying Consultants, P.C., and Plumb Tuckett & Associates conducted this work. These surveys did not coincide with the older CERC and SR lines but in many cases were close. Morang et al. (2012) contains tables with coordinates in geographic and State Plane units for the various profiles. Recovery of 1960s and 1970s Profile Data
The GLCRL processed and examined the CERC and SR profiles and other coastal process data in the mid-1980s, documented in Wood and Davis (1986). The profiles were plotted with an electronic pen plotter, but all digital files were lost over the years. To recover the data, Indiana Department of Natural Resources sent high quality scans of the plots in the report to CHL. A technician at CHL digitized the TIFF files onscreen using Didger® V. 4.0 software, saving the data as distance-elevation pairs in ASCII text files. On these plots, distances were referenced to the origin position for each profile, and elevations were referenced to low water datum based on the IGLD1955 (National Oceanic and Atmospheric Administration 1980; Coordinating Committee 1992). The profiles were imported into the Regional Morphology and Analysis Package (RMAP) software for analysis and volume calculations. Figure 4 is an example of CERC8 profiles at the beach in front of the BGS.
146 20/03/2015
16 pp

8
Fig. 4. CERC-8 profiles redrawn and imported into RMAP software. Original English units for distance and elevation with respect to LWD IGLD 1955 retained. (1 ft = 0.3048 m)
2008 LIDAR Data
No cross-shore profiles were collected in the study area after 2004. To determine recent bathymetry, profiles were cut from 2008 LIDAR data. The LIDAR was collected by the Compact Hydrographic Airborne Rapid Total Survey (CHARTS) system from September 17-26, 2008. Coverage typically extended from the waterline 1500 ft inland and 3,000 ft offshore, or to laser extinction. The LIDAR data were converted to a triangulated irregular network (TIN) using ArcGIS. Using 3D Analyst, profile lines were generated from the CERC benchmarks and extended perpendicular to the shore to the limit of the LIDAR data. The 2008 profiles matched the earlier traditional surveys closely at CERC7, CERC8, and CERC15-1. But at other locations, the LIDAR lines were unrealistically low. Experiments with changing the gridding and tinning procedures could not resolve these discrepancies, and the LIDAR cut lines could not be used at the other profiles. The datum or processing issue was never resolved.
146 20/03/2015
16 pp

9
Shoreline Changes
Archived Photographs The USACE photographed the southern Lake Michigan shore between approximately Gary Harbor, IN, and Harbert or Warren Dunes, MI, annually from 1966 to 1973. These flights correspond to the time of the CERC cross-shore profile surveys, and were probably related to that study and harbor construction. Morang et al. (2012) document coverage and the procedures used to georeference the photographs. The prints were stored in the archives of the USACE Beach Erosion Board, now at CHL in Vicksburg, MS (Morang 2003). Historical Changes Construction of Burns Waterway Harbor began in late-1966. Figure 5 (4 November 1966) shows the beach with a short section of the ArcelorMittal (then Bethlehem Steel) bulkhead projecting into the lake. The shoreline was approximately straight with sand accumulation to the east (right) of the BGS power plant outfall canal (near CERC8 monument). West of the BGS plant, beyond CERC7, the shoreline was slightly indented, indicating retreat.
Fig. 5. Shoreline at initial stage of Burns Waterway Harbor construction, 4 November 1966. Note bulkhead near CERC7. The circle in the lake is the BGS cooling water intake.
146 20/03/2015
16 pp

10
As the years passed, sediment accumulated in the fillet east of the ArcelorMittal bulkhead to the extent that the BGS intake had to be regularly dredged to prevent sand from clogging and damaging the cooling water piping inside the plant. The 2011 photograph (Figure 6) shows the above-water fillet extending out into the lake about half the length of the bulkhead. Previous shorelines represent the position at +2 ft LWD IGLD1955. Photographs from other dates are in Morang et al. (2012).
Fig. 6. October 2011. The exposed fillet extended to about half the length of the ArcelorMittal bulkhead, with previous shorelines marked by date. All shoreline represent +2 ft LWD IGLD1955.
Sediment Volumes and Budget The cross-shore profiles and shorelines show that most of the shore west of the Mount Baldy area has been approximately stable from the 1960s to the 1990s with the exception of the fillet near the ArcelorMittal bulkhead. Figure 7 is a plot of profile volumes for CERC7, 8/E, 9, 10, 12, 15-1, 17-B, and SR16. The units are in ft3/ft, representing volume of sand for a strip of beach 1 ft wide above a specified base elevation. For most profiles, the base elevation was -26.5 ft IGLD55, but the actual base elevation is not important as long as it is below the zone of active sand movement on the shoreface. The important factor to consider is the difference in profile volume over time. CERC7 and CERC8-
146 20/03/2015
16 pp

11
Line E show volume increase over four decades, documenting sediment trapping near the bulkhead. On the CERC8-Line E curve, the decrease in volume from 1992 to 1999 shows the dredging at the NIPSCO BGS cooling water intake. The dashed line is the linear trend for CERC8, indicating a net increase in volume over the years even with dredging at the BGS intake.
Fig. 7. Profile volumes in ft3/ft from 1966 to 2008. CERC7 and 8 rise upward with time, indicating sand trapping east of the ArcelorMittal bulkhead. (1 ft3 = 0.0283 m3)
To compute sediment accumulation in the fillet east of the ArcelorMittal bulkhead, we multiplied the increase in profile volumes at CERC7 and CERC8-Line E times the half-distances to the adjacent profile lines. The result provides an average annual accumulation of 106,000 yd3. Annual average removal from the BGS intake over the period 1980-2009 was 83,000 yd3. Therefore, longshore sediment transport along this part of the Indiana shore is about 190,000 yd3/year. This value excludes factors such as loss offshore to deep water (if any), or aeolian loss or gain. This rate is higher than some previous estimates, but is similar to the W.F. Baird & Associates (2004) calculation of 247,000 yd3/year at Mount Baldy based on wave modeling. Future dredging at the BGS intake will be placed offshore Ogden Dunes.
146 20/03/2015
16 pp

12
Figure 8 summarizes annual average fluxes, removals, and placements from the sediment cell extending from Michigan City Harbor to Burns Waterway Harbor. Sediment now is bypassing the fillet and entering the federal Burns Waterway Harbor entrance. This is a major change compared to the harbor’s early years. In 1986, a side-scan sonar survey conducted by the CERC showed the lakebed within the harbor to consist of clay with very little sand (Morang 1986). On the lake side of the breakwaters, the lakebed was clay with thin veneers of rippled sand.
Fig. 8. Average annual sediment accumulation, removal, and placement for the post-harbor construction period 1966-2009.
A simple calculation can estimate the amount of sand bypassing the ArcelorMittal bulkhead. The 2010 shoreline is about 1,000 ft from the origin of CERC7, and the length of the bulkhead is 2,150 ft. In this area, profile CERC7 shows the active zone to be about -30 ft LWD. The -30 ft level on the 2008 LIDAR profile is 3,065 ft offshore, which is 915 ft beyond the north end of the ArcelorMittal bulkhead. Therefore, the proportion of the active zone beyond the bulkhead is 0.44 (915÷2065). The simplest assumption is that 44 percent of the transport is in the zone beyond the bulkhead, yielding 84,000 yd3/year. By coincidence, this number is almost exactly the same as the average 1980-2009 dredging from the BGS intake. Longshore transport is not evenly distributed
146 20/03/2015
16 pp

13
across the shoreface, and is greatest in the surf zone and close to the beach. But at this site, material may jet offshore in front of the bulkhead when waves approach from the north and northeast. The shoreline position has not changed greatly since 2005 (Figure 6), suggesting that excess sediment is wrapping around the end of the bulkhead and bypassing to the west. Conclusions After Burns Waterway Harbor construction, sediment accumulation in the fillet east of the ArcelorMittal bulkhead has averaged 106,000 yd3/year. This is based on the change in volume measured at profiles CERC7 and CERC8-Line E from 1966-2008. Average annual dredging from the BGS cooling water intake was 83,000 yd3 for the period 1980-2009. Therefore, annual sediment moving as littoral transport to the west end of the Michigan City Harbor to Burns Waterway Harbor cell is about 190,000 yd3. This value exceeds previously published estimates for the Burns Waterway Harbor area but is slightly lower than the W.F. Baird & Associates (2004) value at Mount Baldy. The annual volume of sediment now bypassing the ArcelorMittal bulkhead and entering Burns Waterway Harbor is about 84,000 yd3. This is based on the proportion of the active profile that is now beyond the end of the bulkhead. An average of 61,000 yd3/year of material has been placed on beaches at the National Park Service area west of Portage/Burns Waterway and offshore Ogden Dunes. Sources were Portage/Burns Waterway and the NIPSCO BGS cooling water intake. Full bypassing should be about three times this amount to equal the longshore transport value of 190,000 yd3/year. In the future, the sediment budget will need to be recomputed for a post-2010 scenario, with limited fillet growth but with more sand bypassing the bulkhead and entering the federal harbor. If profile surveys show that the fillet profile is stable, then dredging at the BGS intake and the mouth of Burns Harbor will account for almost all of the sediment carried by littoral currents to that end of the cell (with the assumption of minimal loss offshore to deep water). We recommend that profile surveys be re-initiated at many of the original CERC locations to monitor shoreface conditions. Continuity of surveys will allow comparison with historical data, will reveal changes in sediment volumes, and will determine if the fillet east of Burns Waterway Harbor has stabilized or is still growing.
146 20/03/2015
16 pp

14
Acknowledgements
The USACE’s Regional Sediment Management (RSM) Lower Lake Michigan/Indiana initiative funded this study. Mr. Stephen Davis, Indiana Department of Natural Resources, Division of Water, provided scanned copies of survey notes and cross-shore profiles and reviewed the study report. We thank reviews by Lyn Hales and Katherine Brutsché (both CHL). The Chief of Engineers, USACE, approved this paper.
References
Chrzastowski, M. J., and Trask, C. B. (1995). “Nearshore geology and geologic processes along the Illinois shore of Lake Michigan from Waukegan Harbor to Wilmette Harbor,” report for the U.S. Army Corps of Engineers, Illinois Shoreline Erosion Interim IV Study, Illinois State Geological Survey, Lakes, Streams, and Wetlands Unit, Champaign, IL, 93 p.
Coordinating Committee on Great Lakes Basic Hydraulic and Hydrologic Data (1992). “IGLD 1985,” Brochure on the International Great Lakes Datum 1985, Government Printing Office, Washington, D.C., 4 p.
Engel, J. R. (1986). “Sacred Sands: The Struggle for Community in the Indiana Dunes,” Wesleyan University Press, Middletown, CT, 352 p.
Franklin, K., and Schaeffer, N. (1983). “Duel for the dunes: land use conflict on the shores of Lake Michigan,” University of Illinois Press, Urbana, IL, 278 p.
Higgs, S. (1995). “Eternal Vigilance: Nine Tales of Environmental Heroism in Indiana,” Indiana University Press, 224 p.
Hill, J. R. (1974). “The Indiana Dunes – legacy of sand.” Geological Survey Special Report 8, Department of Natural Resources, Bloomington, IN, 10 p.
KellerLynn, K. (2010). “Geologic resources inventory scoping summary, Indiana Dunes National Lakeshore, Indiana.” Geologic Resources Division, National Park Service, U.S. Department of the Interior (available online, http://www.nature.nps.gov/geology/inventory/publications/reports/INDU_GRI_scoping_summary_2010-1130.pdf , accessed 23 January 2014).
146 20/03/2015
16 pp

15
Morang, A. (1986). “Side-scan sonar investigation of breakwaters at Calumet and Burns Harbors on southern Lake Michigan,” Misc. Paper CERC-87-20, U.S. Army Engineer Waterways Experiment Station, Coastal Engineering Research Center, Vicksburg, MS, 33 p.
Morang, A. (2003). “Regional coastal photograph archive of the Beach Erosion Board,” Shore & Beach, 71(4) 17-21.
Morang, A., Batten, B. K., Connell, K. J., Tanner, W., Larson, M., and Kraus, N. C. (2009). “Regional Morphology Analysis Package (RMAP), Version 3: User’s Guide and Tutorial,” Coastal and Hydraulics Tech. Note ERDC/CHL CHETN-XIV-9, U.S. Army Engineer Research and Development Center, Vicksburg, MS, 27 p.
Morang, A., Frey, A. E., Bucaro, D. F., Brodzinsky, S., and Fuller, J. A. (2012). “Sediment budget for the Indiana shore from Michigan City Harbor to Burns Waterway Harbor,” Tech. Rep. ERDC/CHL TR-12-17, U.S. Army Engineer Research and Development Center, Vicksburg, MS, 66 p.
National Oceanic and Atmospheric Administration (1980). “Establishment of International Great Lakes Datum (1955),” Second Edition, US Government Printing Office, 79 p.
Sargent & Lundy (1978). “Water intake study, Bailly Generating Station – Units 7 and 8,” Rep. SL-3685, prepared for Northern Indiana Public Service Company, Sargent & Lundy Engineers, Chicago, IL.
Shabica, C., and Pranschke, F. (1994). “Survey of littoral drift sand deposits along the Illinois and Indiana shores of Lake Michigan,” Journal of Great Lakes Research, 20(1), 61-72.
Shore Protection Manual (1973). “Shore Protection Manual,” 1st ed., U.S. Army Coastal Engineering Research Center, U.S. Government Printing Office, Washington, DC, 1,066 p.
U.S. Army Corps of Engineers, Buffalo (2008). “Indiana shoreline monitoring: Burns International Harbor to Michigan City Harbor 2008,” rep. prepared for U.S. Army Corps of Engineers, Chicago, IL, 37 p.
U.S. Army Corps of Engineers, Chicago (2010). “Burns Waterway Harbor, IN, Shoreline Damage Mitigation Reconnaissance Study,” 905(b) recon. study prepared for U.S. Army Corps of Engineers, Great Lakes and Ohio River Division, U.S. Army Corps of Engineers, Chicago, IL, 55 p.
146 20/03/2015
16 pp

16
W.F. Baird & Associates, (2004). “Evaluation of dredged material management plans for Michigan City,” rep. prepared for USACE Detroit District, W.F. Baird & Associates, Coastal Engineers Ltd., Madison, WI, 72 p.
Wood, W. L., and Davis, S. E. (1986). “Indiana Dunes National Lakeshore shoreline situation report,” Great Lakes Coastal Research Laboratory, School of Civil Engineering, Purdue University, West Lafayette, IN, 206 p.
Wood, W. L., Madalon, L., and Wood, C. L. (1990). “NIPSCO beach nourishment sediment evaluation for southern Lake Michigan, final report,” rep. prepared for Oceanographic Studies, Inc., Groton, CT by SAECO, Inc., West Lafayette, IN, 37 p.
146 20/03/2015
16 pp