Embed Size (px)
Citation preview
FINAL DRAFT
KING COUNTY DEPARTMENT OF NATURAL RESOURCESYEAR 2000 CSO PLAN UPDATE PROJECT
SEDIMENT MANAGEMENT PROGRAM
Sediment Impact and Recovery Zone Models Reviewand Development
Task 900Technical Memorandum
Brown and Caldwelland Associated Firms
Adolfson Associates, Inc.Anchor Environmental, Inc.HDR, Inc.Herrera Environmental ConsultantsKCM, Inc.Norton-Arnold & Janeway
Prepared by:Anchor Environmental, Inc.
In collaboration with King County, ENSR, and Exponent
May 1999

Page i
CONTENTS
Executive Summary ........................................................................................................... iii
Introduction ......................................................................................................................... 1
Background ......................................................................................................................... 2
Preliminary Model Results.................................................................................................. 3
Review of Models ............................................................................................................. 13METSED Model ................................................................................................... 14EFDC..................................................................................................................... 15Officer and Lynch ................................................................................................. 16Van Genuchten and Parker.................................................................................... 16CORMIX and PLUMES ....................................................................................... 17WASP.................................................................................................................... 17
Discussion ......................................................................................................................... 19
Recommendation............................................................................................................... 20
References ......................................................................................................................... 22
Page ii
Tables
Table 1. Far-field Contaminant Concentrations of Suspended Sediments................ 4
Table 2. Sediment Impact and Natural Recovery Models ..................................... 13
Figures
Figure 1(a). Farfield WQA results: Copper .................................................................. 6
Figure 1(b) Farfield WQA results: Lead ...................................................................... 6
Figure 1(c) Farfield WQA results: 1,4-Dichlorobenzene............................................. 7
Figure 1(d). Farfield WQA results: Polychlorinated biphenyls .................................... 7
Figure 1(e). Farfield WQA results: Chrysene ............................................................... 8
Figure 1(f). Farfield WQA results: Mercury................................................................. 8
Figure 1(g). Farfield WQA results: Bis(2-ethylhexyl) phthalate ................................... 9
Figure 2(a). Nearfield PLUMES results: Copper........................................................... 9
Figure 2(b). Nearfield PLUMES results: Lead ............................................................ 10
Figure 2(c). Nearfield PLUMES results: 1,4-Dichlorobenzene.................................. 10
Figure 2(d). Nearfield PLUMES results: Polychlorinated biphenyls ......................... 11
Figure 2(e). Nearfield PLUMES results: Chrysene .................................................... 11
Figure 2(f). Nearfield PLUMES results: Mercury ...................................................... 12
Figure 2(g). Nearfield PLUMES results: Bis(2-ethylhexyl) phthalate ........................ 12
Figure 3. Screening Modeling Flowchart................................................................. 21
Page iii
EXECUTIVE SUMMARY
This technical memorandum presents a review of sediment impact models used by KingCounty, and a recommendation for a sediment impact and natural recovery model forKing County’s use. Models that have been used by King County include a version ofSEDCAM (called METSED), PLUMES, and the Environmental Fluid Dynamics Code(EFDC) model, also referred to as the WQA model. Additional models that have beenevaluated include CORMIX, Officer and Lynch, van Genuchten and Parker, and WASP.
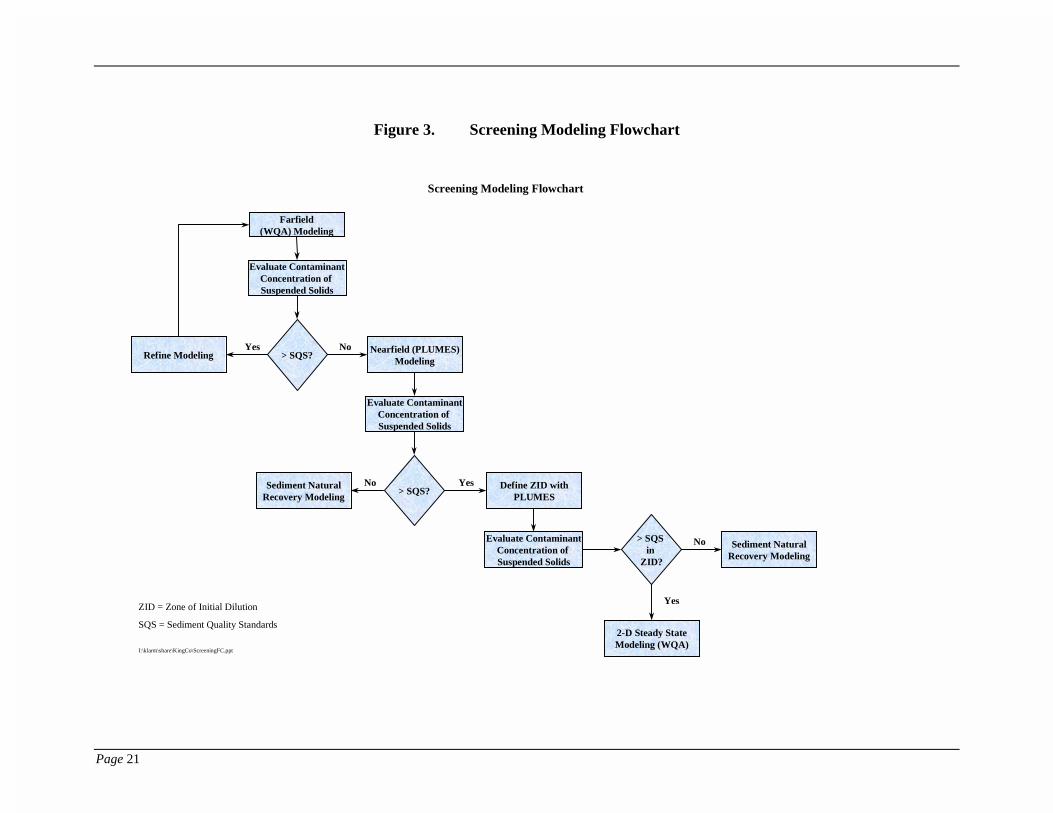
For the County’s Sediment Management Program, a combination of near-field and far-field models is recommended. Models that are currently used by the County arerecommended, such as PLUMES for the near field and EFDC for the far field. The levelof detail/degree of refinement to the existing PLUMES/EFDC models would bedependent on the resolution to which the contamination needs to be modeled. A flowchart describing the screening level modeling and subsequent refinements is included inFigure 3.
To provide some perspective on local source control characteristics and an overall viewof the sediment impact modeling capabilities, King County provided results for theEFCD (far-field) and PLUMES (near-field) modeling conducted for the seven CSO sites.The preliminary far-field results suggest that regional discharges to the vicinity of theseven CSO sites are largely controlled. The near-field results suggest a potential forlocalized recontamination; this may need to be investigated further with modelrefinements.
The County provided reports describing the METSED and EFDC models that have beenused to date. The METSED model is appropriate for an initial indication of whether CSOdischarges may result in sediment contamination. However, as a stand-alone model,METSED cannot provide spatial resolution of the contamination area or the sedimentimpact zone. The EFDC model can be used to delineate the areal extent of sedimentcontamination and can include the effect of multiple discharges. However, theconfiguration that is currently used by the County would be computer resource intensiveto model the spatial footprint of contamination of all the CSO sites.
Page 1
INTRODUCTION
King County recently contracted with Brown & Caldwell and its subconsultants (HerreraEnvironmental Consultants and Anchor Environmental) to develop a SedimentManagement Plan (SMP) for King County’s Combined Sewer Overflow (CSO) Program.One of the initial tasks (Task 900) of this effort is to review sediment impact and naturalrecovery models that have been developed for the study area and recommend a model forKing County’s use. The study area consists of the regions near 7 CSO outfalls, located inthe Duwamish River and Elliott Bay near Brandon Street, Chelan Street, Denny Way(nearshore and offshore), Duwamish/Diagonal, Hanford Street, King Street, and LanderStreet.
This technical memorandum presents a recommendation for a model to be used by theCounty to address sediment contamination in the study area. Several models that havebeen developed and used by the County for this purpose have been reviewed, andadditional models that have been used in the region are briefly discussed. Arecommendation for a sediment impact and natural recovery model for the study area isprovided at the end of this document.
Page 2
BACKGROUND
Regulation of sediment contamination in the marine environment of Washington statetypically falls under the authority of the Department of Ecology. The SedimentManagement Standards (SMS) establish Sediment Quality Standards (SQS) for the long-term goals of contaminated sediments. When sediments with contaminant concentrationsabove the SQS are left in place, a sediment recovery zone may be appropriate if thesediments can be shown to recover naturally.
The SMS indicates a sediment impact zone (SIZ) may be granted for an authorized orpermitted discharge that results in sediment contaminant concentrations that exceed thesediment quality standards after compliance with SIZ discharge requirements can bedemonstrated. A sediment recovery zone is an area where the contaminantconcentrations currently exceed sediment quality standards as a result of historicaldischarges, but is expected to be reduced to below these criteria as a result of naturalprocesses.
Sediment impact zone modeling assists in evaluating the effect of continuing dischargeson sediment quality. The predominant physical processes include momentum of thedischarge, buoyancy effects, hydrodynamics, particle dynamics, background loading ofsuspended particles, partitioning equilibria, and sediment deposition, erosion, andtransport.
To model the natural recovery of sediments, the predominant physical processes need tobe included. Additionally, the sources of contamination need to be properly identifiedand represented. Recovery of the sediments results from natural and anthropogenicfactors. Natural processes include the deposition of clean sediment over impactedsediment, chemical and biological degradation of contaminants within the sediment,dilution of contaminated sediment by mixing processes, and transport of impactedsediment out of the area. Anthropogenic processes include improved managementpractices (e.g., source controls) and the removal of “hotspot” sediments from the area toreduce the contaminant available for transport and/or mixing.
Additionally, the SMS requires that recontamination modeling be performed to verifythat contaminant sources have been controlled sufficiently to prevent recontamination ofthe remediation area. The modeling should determine whether the sedimentconcentrations would exceed the SQS or CSL within a 10-year time frame.
Page 3
PRELIMINARY MODEL RESULTS
The County provided model results for the seven CSO sites for review. Although thesedata were intended to assist in the sediment site prioritization process (Task 1100/1200),the results are included and briefly discussed below to provide some perspective on localsource control characteristics and an overall view of the sediment impact modelingcapabilities. Documentation for the County’s model and results is provided in theCombined Sewer Overflow Water Quality Assessment for the Duwamish River andElliott Bay (Duwamish River and Elliott Bay Water Quality Assessment Team 1998).
The County ran the EFDC (Environmental Fluid Dynamics Model) model and thePLUMES model for a 10-year period to simulate existing contaminant release loadings.These models are described in more detail in the sections that follow. The EFDC modeloutput was provided for a grid cell (measuring approximately 250 m by 50 m) locatednear the CSO outfall (far-field). The PLUMES model output was provided for locationsapproximately 1 to 15 m from each CSO outfall (near-field). Output from these modelsincluded total cohesive suspended solids, particulate fraction, and total contaminant waterconcentration (in the layer above the sediments). The EFDC output also includedcontaminant concentrations in the accumulated bed sediments. Collectively, the Countyrefers to these models as the Water Quality Assessment (WQA) model.
As part of the model run, contaminants were assumed to partition between the dissolvedphase and cohesive particulates (Duwamish River and Elliott Bay Water QualityAssessment Team 1998). Initial and input total suspended solids and contaminantconcentrations were based on field measurements. CSO, stormdrain, and river loadingswere based on databases for the area and output from a separate regional stormwaterrunoff model.
Model results for year ten of the far-field simulations included contaminantconcentrations of the cohesive suspended solids following extended inputs at currentsource levels. This screening-level modeling provided an estimation of baseline sedimentinputs to each study area. The far-field results were provided every two days for theduration of year ten.
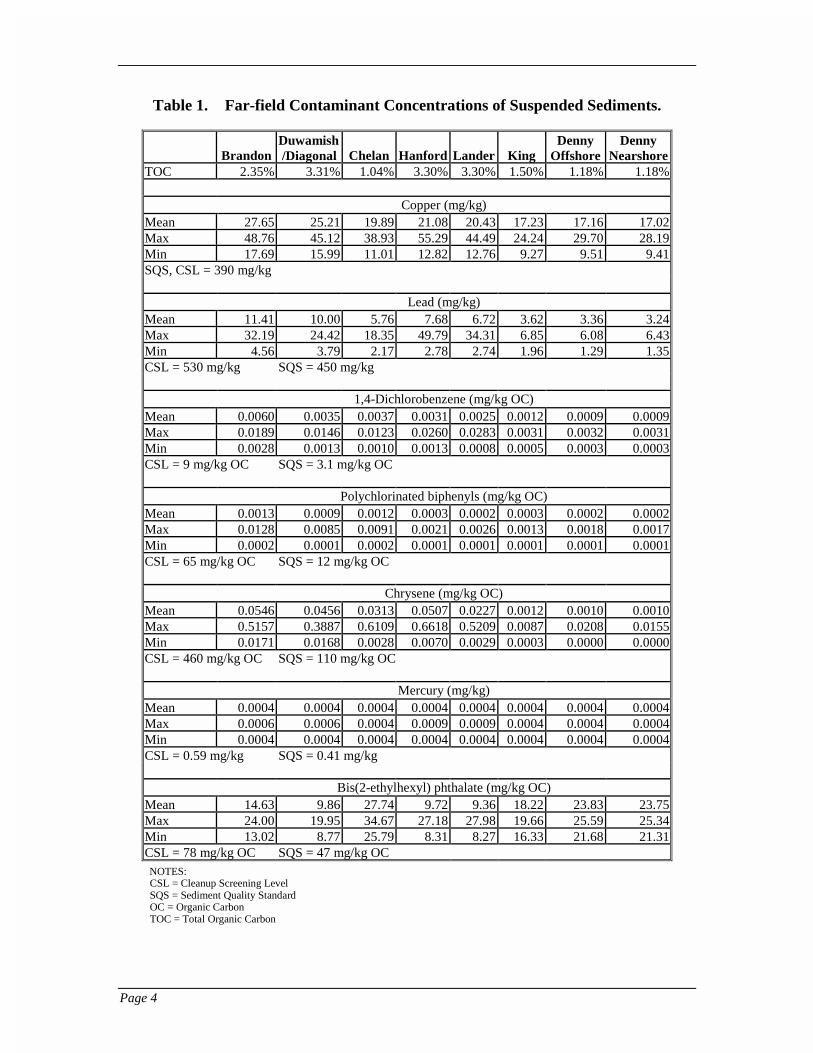
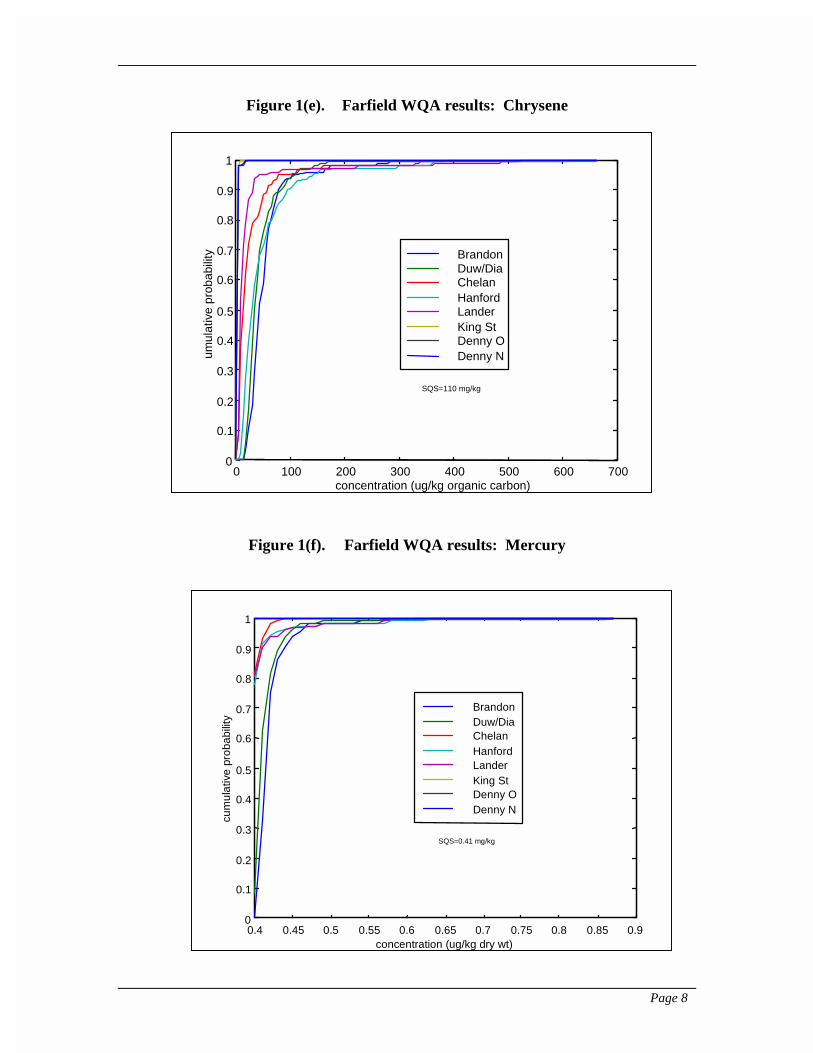
To summarize the far-field screening-level modeling results, the mean, maximum, andminimum values for the tenth year are provided. These particulate concentration valueswere compared to SQS values and are listed in Table 1. For all of the CSO sites, thepredicted far-field sediment particulate concentrations were below SQS chemical criteria.For contaminants with the SQS chemical criteria expressed on a total organic carbonbasis (i.e. mg/kg organic carbon), the average of the organic carbon content values forthat CSO area was used. Two exceptions were the Lander and King sites; the organiccarbon content for Hanford was used for Lander, and a value of 1.5% was used for King.
Page 4
Table 1. Far-field Contaminant Concentrations of Suspended Sediments.
BrandonDuwamish/Diagonal Chelan Hanford Lander King
DennyOffshore
DennyNearshore
TOC 2.35% 3.31% 1.04% 3.30% 3.30% 1.50% 1.18% 1.18%
Copper (mg/kg)Mean 27.65 25.21 19.89 21.08 20.43 17.23 17.16 17.02Max 48.76 45.12 38.93 55.29 44.49 24.24 29.70 28.19Min 17.69 15.99 11.01 12.82 12.76 9.27 9.51 9.41SQS, CSL = 390 mg/kg
Lead (mg/kg)Mean 11.41 10.00 5.76 7.68 6.72 3.62 3.36 3.24Max 32.19 24.42 18.35 49.79 34.31 6.85 6.08 6.43Min 4.56 3.79 2.17 2.78 2.74 1.96 1.29 1.35CSL = 530 mg/kg SQS = 450 mg/kg
1,4-Dichlorobenzene (mg/kg OC)Mean 0.0060 0.0035 0.0037 0.0031 0.0025 0.0012 0.0009 0.0009Max 0.0189 0.0146 0.0123 0.0260 0.0283 0.0031 0.0032 0.0031Min 0.0028 0.0013 0.0010 0.0013 0.0008 0.0005 0.0003 0.0003CSL = 9 mg/kg OC SQS = 3.1 mg/kg OC
Polychlorinated biphenyls (mg/kg OC)Mean 0.0013 0.0009 0.0012 0.0003 0.0002 0.0003 0.0002 0.0002Max 0.0128 0.0085 0.0091 0.0021 0.0026 0.0013 0.0018 0.0017Min 0.0002 0.0001 0.0002 0.0001 0.0001 0.0001 0.0001 0.0001CSL = 65 mg/kg OC SQS = 12 mg/kg OC
Chrysene (mg/kg OC)Mean 0.0546 0.0456 0.0313 0.0507 0.0227 0.0012 0.0010 0.0010Max 0.5157 0.3887 0.6109 0.6618 0.5209 0.0087 0.0208 0.0155Min 0.0171 0.0168 0.0028 0.0070 0.0029 0.0003 0.0000 0.0000CSL = 460 mg/kg OC SQS = 110 mg/kg OC
Mercury (mg/kg)Mean 0.0004 0.0004 0.0004 0.0004 0.0004 0.0004 0.0004 0.0004Max 0.0006 0.0006 0.0004 0.0009 0.0009 0.0004 0.0004 0.0004Min 0.0004 0.0004 0.0004 0.0004 0.0004 0.0004 0.0004 0.0004CSL = 0.59 mg/kg SQS = 0.41 mg/kg
Bis(2-ethylhexyl) phthalate (mg/kg OC)Mean 14.63 9.86 27.74 9.72 9.36 18.22 23.83 23.75Max 24.00 19.95 34.67 27.18 27.98 19.66 25.59 25.34Min 13.02 8.77 25.79 8.31 8.27 16.33 21.68 21.31CSL = 78 mg/kg OC SQS = 47 mg/kg OCNOTES:CSL = Cleanup Screening LevelSQS = Sediment Quality StandardOC = Organic CarbonTOC = Total Organic Carbon
Page 5
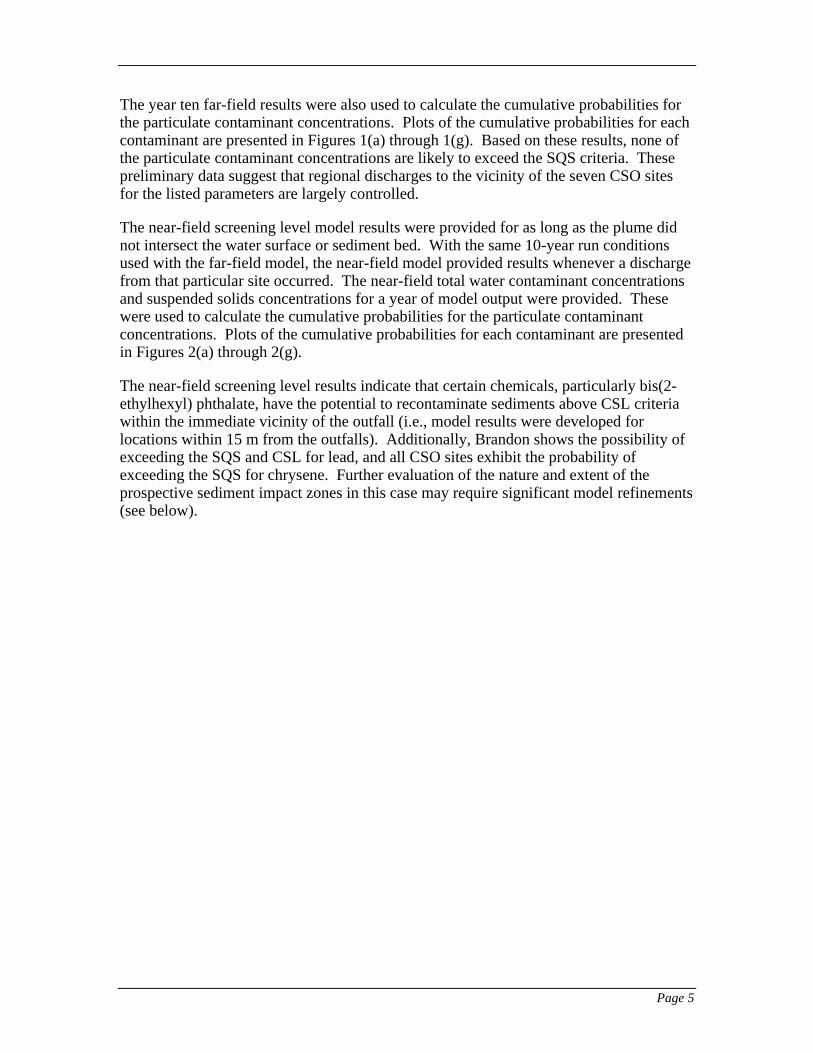
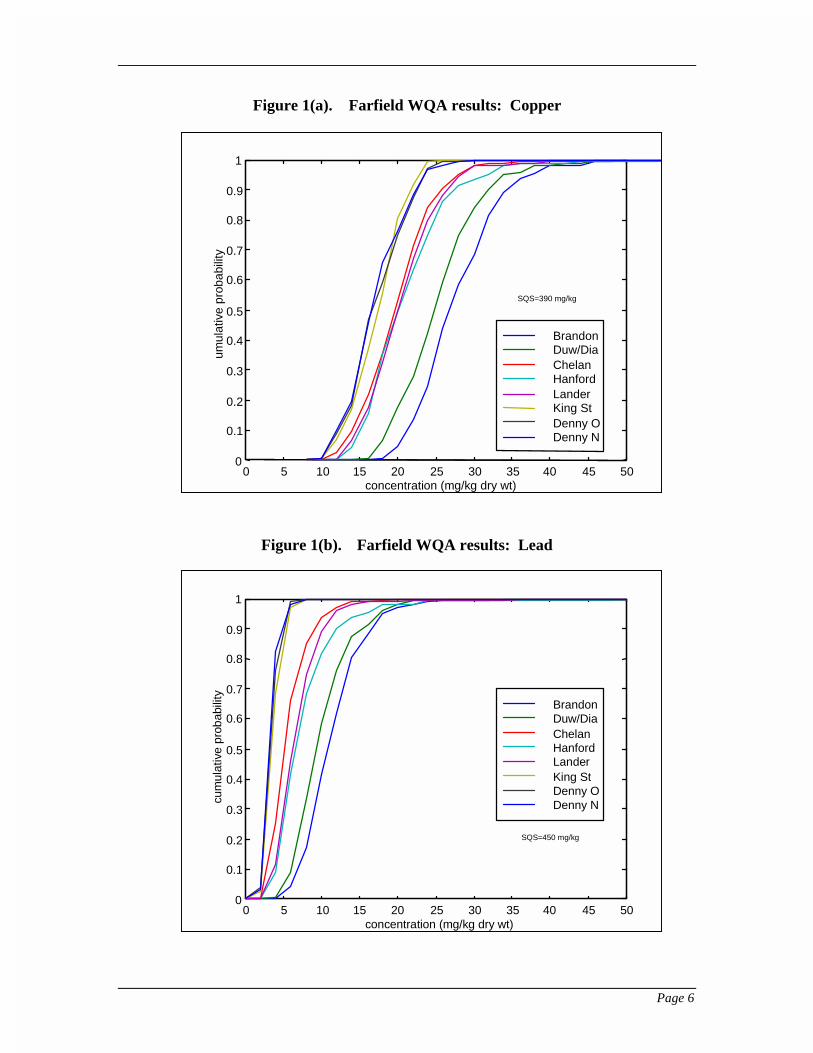
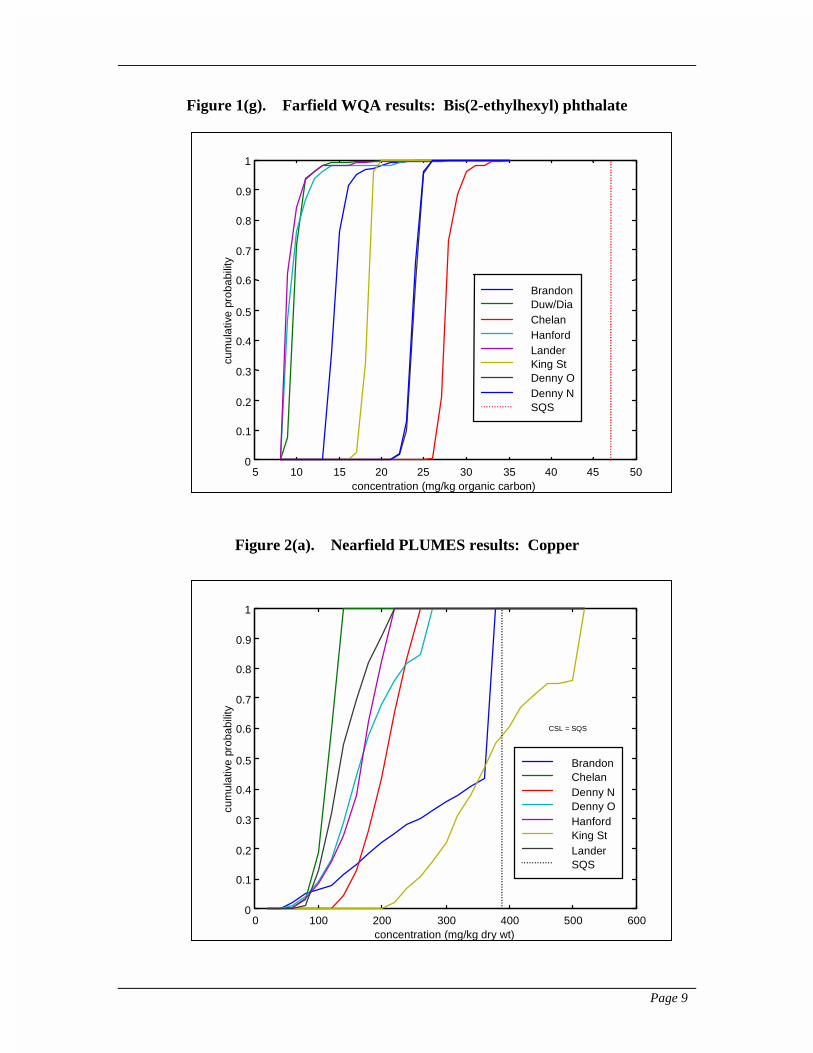
The year ten far-field results were also used to calculate the cumulative probabilities forthe particulate contaminant concentrations. Plots of the cumulative probabilities for eachcontaminant are presented in Figures 1(a) through 1(g). Based on these results, none ofthe particulate contaminant concentrations are likely to exceed the SQS criteria. Thesepreliminary data suggest that regional discharges to the vicinity of the seven CSO sitesfor the listed parameters are largely controlled.
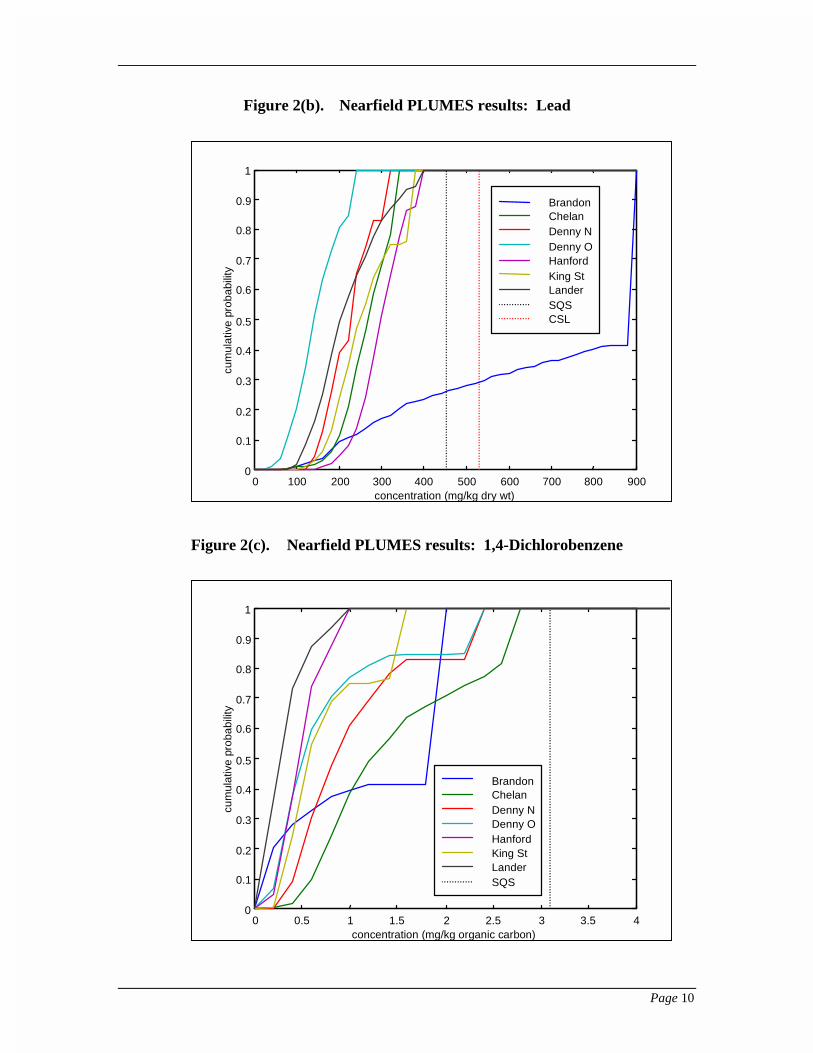
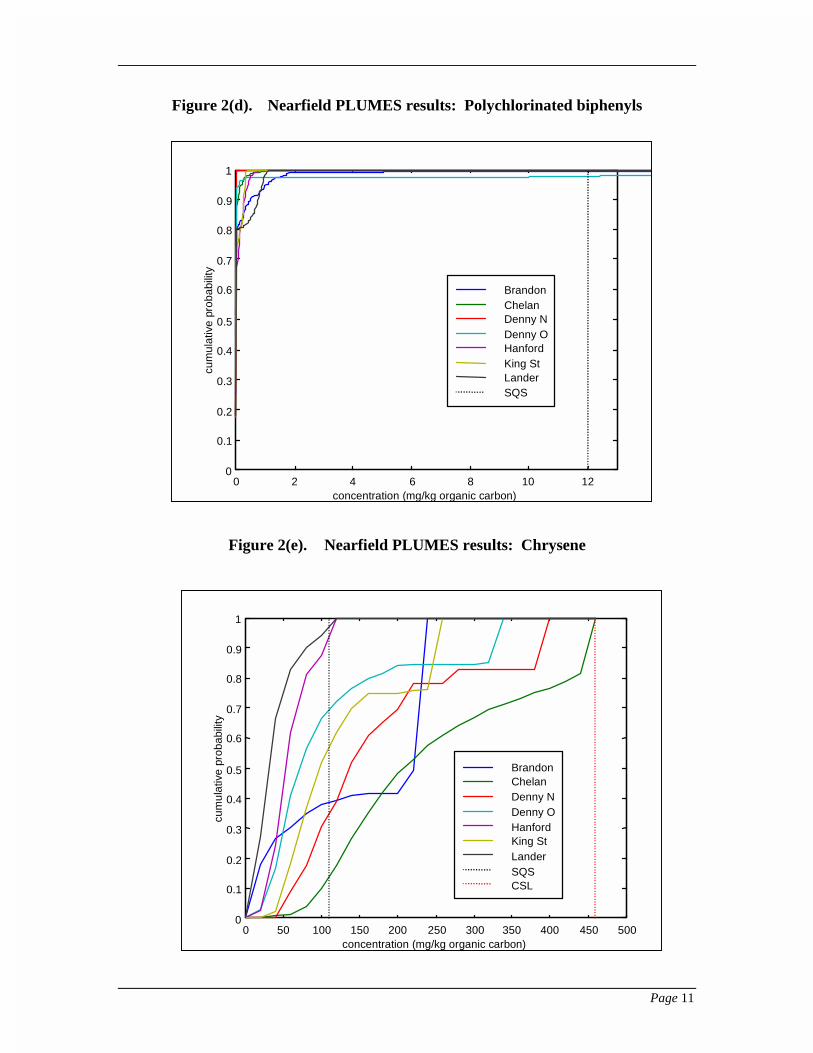
The near-field screening level model results were provided for as long as the plume didnot intersect the water surface or sediment bed. With the same 10-year run conditionsused with the far-field model, the near-field model provided results whenever a dischargefrom that particular site occurred. The near-field total water contaminant concentrationsand suspended solids concentrations for a year of model output were provided. Thesewere used to calculate the cumulative probabilities for the particulate contaminantconcentrations. Plots of the cumulative probabilities for each contaminant are presentedin Figures 2(a) through 2(g).
The near-field screening level results indicate that certain chemicals, particularly bis(2-ethylhexyl) phthalate, have the potential to recontaminate sediments above CSL criteriawithin the immediate vicinity of the outfall (i.e., model results were developed forlocations within 15 m from the outfalls). Additionally, Brandon shows the possibility ofexceeding the SQS and CSL for lead, and all CSO sites exhibit the probability ofexceeding the SQS for chrysene. Further evaluation of the nature and extent of theprospective sediment impact zones in this case may require significant model refinements(see below).
Page 6
Figure 1(a). Farfield WQA results: Copper
Figure 1(b). Farfield WQA results: Lead
0 5 10 15 20 25 30 35 40 45 500
0.1
0.2
0.3
0.4
0.5
0.6
0.7
0.8
0.9
1
concentration (mg/kg dry wt)
umul
ativ
e pr
obab
ility
SQS=390 mg/kg
BrandonDuw/DiaChelanHanfordLanderKing StDenny ODenny N
0 5 10 15 20 25 30 35 40 45 500
0.1
0.2
0.3
0.4
0.5
0.6
0.7
0.8
0.9
1
concentration (mg/kg dry wt)
cum
ulat
ive
prob
abili
ty
SQS=450 mg/kg
BrandonDuw/DiaChelanHanfordLanderKing StDenny ODenny N
Page 7
Figure 1(c). Farfield WQA results: 1,4-Dichlorobenzene
Figure 1(d). Farfield WQA results: Polychlorinated biphenyls
0 5 10 15 20 25 300
0.1
0.2
0.3
0.4
0.5
0.6
0.7
0.8
0.9
1
concentration (ug/kg organic carbon)
cum
ulat
ive
prob
abili
ty
SQS=3.1 mg/kg
BrandonDuw/DiaChelanHanfordLanderKing StDenny ODenny N
0 2 4 6 8 10 12 140
0.1
0.2
0.3
0.4
0.5
0.6
0.7
0.8
0.9
1
concentration (ug/kg organic carbon)
cum
ulat
ive
prob
abili
ty
SQS=12 mg/kg
BrandonDuw/DiaChelanHanfordLanderKing StDenny ODenny N
Page 8
Figure 1(e). Farfield WQA results: Chrysene
Figure 1(f). Farfield WQA results: Mercury
0 100 200 300 400 500 600 7000
0.1
0.2
0.3
0.4
0.5
0.6
0.7
0.8
0.9
1
concentration (ug/kg organic carbon)
umul
ativ
e pr
obab
ility
SQS=110 mg/kg
BrandonDuw/DiaChelanHanfordLanderKing StDenny ODenny N
0.4 0.45 0.5 0.55 0.6 0.65 0.7 0.75 0.8 0.85 0.90
0.1
0.2
0.3
0.4
0.5
0.6
0.7
0.8
0.9
1
concentration (ug/kg dry wt)
cum
ulat
ive
prob
abili
ty
SQS=0.41 mg/kg
BrandonDuw/DiaChelanHanfordLanderKing StDenny ODenny N
Page 9
Figure 1(g). Farfield WQA results: Bis(2-ethylhexyl) phthalate
Figure 2(a). Nearfield PLUMES results: Copper
5 10 15 20 25 30 35 40 45 500
0.1
0.2
0.3
0.4
0.5
0.6
0.7
0.8
0.9
1
concentration (mg/kg organic carbon)
cum
ulat
ive
prob
abili
ty
BrandonDuw/DiaChelanHanfordLanderKing StDenny ODenny NSQS
0 100 200 300 400 500 6000
0.1
0.2
0.3
0.4
0.5
0.6
0.7
0.8
0.9
1
concentration (mg/kg dry wt)
cum
ulat
ive
prob
abili
ty
CSL = SQS
BrandonChelanDenny NDenny OHanfordKing StLanderSQS
Page 10
Figure 2(b). Nearfield PLUMES results: Lead
Figure 2(c). Nearfield PLUMES results: 1,4-Dichlorobenzene
0 100 200 300 400 500 600 700 800 9000
0.1
0.2
0.3
0.4
0.5
0.6
0.7
0.8
0.9
1
concentration (mg/kg dry wt)
cum
ulat
ive
prob
abili
ty
BrandonChelanDenny NDenny OHanfordKing StLanderSQSCSL
0 0.5 1 1.5 2 2.5 3 3.5 40
0.1
0.2
0.3
0.4
0.5
0.6
0.7
0.8
0.9
1
concentration (mg/kg organic carbon)
cum
ulat
ive
prob
abili
ty
BrandonChelanDenny NDenny OHanfordKing StLanderSQS
Page 11
Figure 2(d). Nearfield PLUMES results: Polychlorinated biphenyls
Figure 2(e). Nearfield PLUMES results: Chrysene
0 2 4 6 8 10 120
0.1
0.2
0.3
0.4
0.5
0.6
0.7
0.8
0.9
1
concentration (mg/kg organic carbon)
cum
ulat
ive
prob
abili
ty
BrandonChelanDenny NDenny OHanfordKing StLanderSQS
0 50 100 150 200 250 300 350 400 450 5000
0.1
0.2
0.3
0.4
0.5
0.6
0.7
0.8
0.9
1
concentration (mg/kg organic carbon)
cum
ulat
ive
prob
abili
ty
BrandonChelanDenny NDenny OHanfordKing StLanderSQSCSL

Page 12
Figure 2(f). Nearfield PLUMES results: Mercury
Figure 2(g). Nearfield PLUMES results: Bis(2-ethylhexyl) phthalate
0 500 1000 1500 2000 25000
0.1
0.2
0.3
0.4
0.5
0.6
0.7
0.8
0.9
1
concentration (mg/kg organic carbon)
cum
ulat
ive
prob
abili
ty
BrandonChelanDenny NDenny OHanfordKing StLanderSQSCSL
0 0.01 0.02 0.03 0.04 0.05 0.06 0.070
0.1
0.2
0.3
0.4
0.5
0.6
0.7
0.8
0.9
1
concentration (mg/kg dry wt)
cum
ulat
ive
prob
abili
ty
SQS=0.41 mg/kg
BrandonChelanDenny NDenny OHanfordKing StLander
Page 13
REVIEW OF MODELS
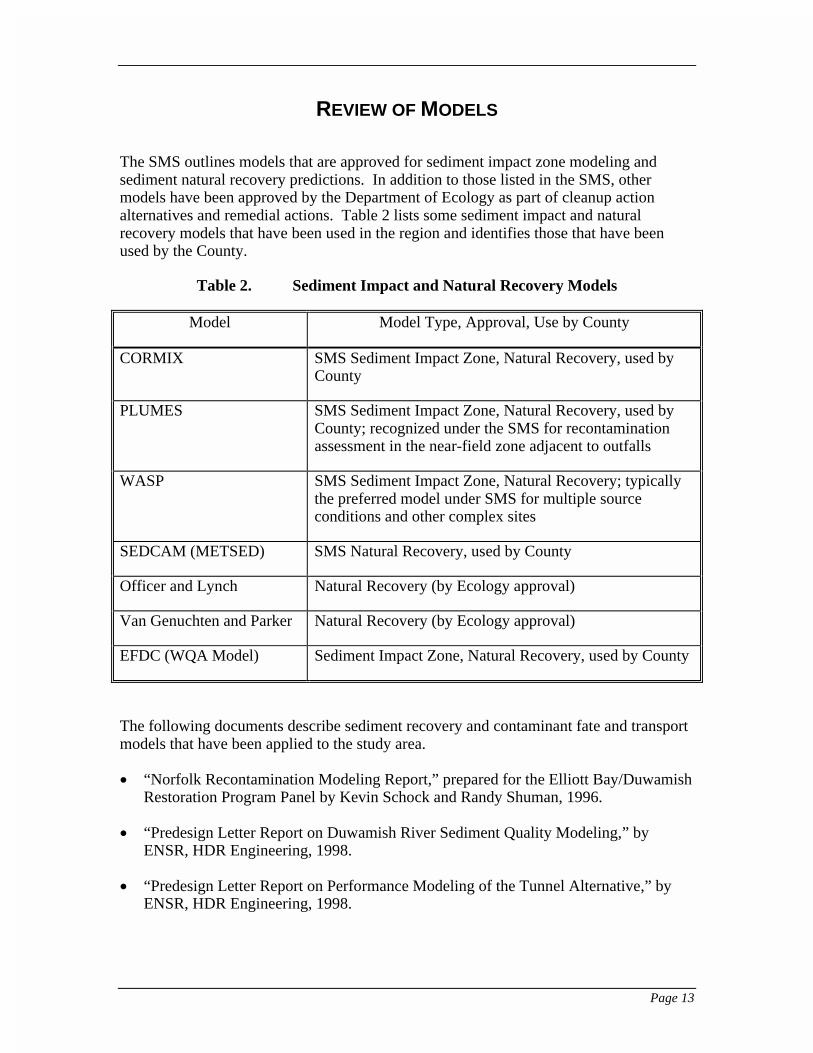
The SMS outlines models that are approved for sediment impact zone modeling andsediment natural recovery predictions. In addition to those listed in the SMS, othermodels have been approved by the Department of Ecology as part of cleanup actionalternatives and remedial actions. Table 2 lists some sediment impact and naturalrecovery models that have been used in the region and identifies those that have beenused by the County.
Table 2. Sediment Impact and Natural Recovery Models
Model Model Type, Approval, Use by County
CORMIX SMS Sediment Impact Zone, Natural Recovery, used byCounty
PLUMES SMS Sediment Impact Zone, Natural Recovery, used byCounty; recognized under the SMS for recontaminationassessment in the near-field zone adjacent to outfalls
WASP SMS Sediment Impact Zone, Natural Recovery; typicallythe preferred model under SMS for multiple sourceconditions and other complex sites
SEDCAM (METSED) SMS Natural Recovery, used by County
Officer and Lynch Natural Recovery (by Ecology approval)
Van Genuchten and Parker Natural Recovery (by Ecology approval)
EFDC (WQA Model) Sediment Impact Zone, Natural Recovery, used by County
The following documents describe sediment recovery and contaminant fate and transportmodels that have been applied to the study area.
� “Norfolk Recontamination Modeling Report,” prepared for the Elliott Bay/DuwamishRestoration Program Panel by Kevin Schock and Randy Shuman, 1996.
� “Predesign Letter Report on Duwamish River Sediment Quality Modeling,” byENSR, HDR Engineering, 1998.
� “Predesign Letter Report on Performance Modeling of the Tunnel Alternative,” byENSR, HDR Engineering, 1998.
Page 14
� “King County Combined Sewer Overflow Water Quality Assessment for theDuwamish River and Elliott Bay. Draft Volume IV: Hydrodynamic and Fate andTransport Numerical Model for the Duwamish River and Elliott Bay,” by theDuwamish River and Elliott Bay Water Quality Assessment Team, 1998.
� “Proposal for Evaluation of Potential Recontamination and Completion of DuwamishSite Assessment Report,” by EcoChem, 1998.
METSED Model
The METSED model is a modified form of the SEDCAM sediment recovery model.SEDCAM was developed for the Commencement Bay Nearshore/Tideflats FeasibilityStudy and Record of Decision, and is listed as an approved method to estimate sedimentrecovery under the SMS program. SEDCAM incorporates the effects of sedimentation,biodegradation, and diffusion processes (Tetra Tech, 1988). The model assumes a well-mixed system and allows for the continual input of contaminants with sedimentation.
Several versions of METSED were created, with each successive version augmentingvarious aspects of the SEDCAM model. The first version of METSED appliedSEDCAM over a series of discrete time periods to allow for a time-varying loading ofcontaminant into the sediments. Chemical discharge concentrations were based onanalytical results of field samples collected (for both the sediments and CSO discharges);total suspended solids concentrations (TSS) for the river were estimated by an empiricalrelationship; contaminant partition coefficients were based on literature values; and CSOinflow values were based on representative CSO loading hydrographs for the area. Thedilution of CSO inflow was a length-based factor, estimated by the extent of existingcontamination, the whole river width, and the momentum of the CSO effluent enteringthe flowing river. The METSED model was configured to solve the SEDCAM equationover a series of one-week intervals; the estimated concentration from the precedinginterval would become the input concentration for the successive interval. Contaminantinputs from the CSO and stormdrains were included to evaluate the effect that CSOsource elimination would have on sediment concentrations.
The second version of METSED incorporated better estimates for the dilution of the CSOand stormdrain discharges with the river flow. CORMIX3, the Cornell Mixing ZoneExpert System (see below), was applied to estimate the dilution from the CSO andstormdrain discharge. Additionally, improved partitioning coefficients were applied forthe chemical constituents. The sediment recovery predictive equation was solved in aseries of one-week interval inputs, as in the original version of METSED.
The third version of METSED modified the time intervals between input values. Stormevents were discretized with a 10-minute time interval, and non-storm events werediscretized with an hours- to days- time interval. As with the second version, CORMIX3was used to estimate the dilution of the CSO and stormdrain effluent with the river. Theresulting predicted concentrations were promising enough to prompt a further reductionof the time interval to a constant value of 0.01 day. Under this configuration, the
Page 15
METSED model was applied to predict the necessary dilution of the stormdrain input thatresulted in sediment concentrations below the SQS values.
In applying the METSED model, estimated values to describe the sediment matrix andmixing process were used. The mixed layer depth was assumed to be 5 cm, an averagesediment specific gravity of 2.5 was used, a sediment porosity of 0.6 was applied, and thesediment accumulation rate was based on the fall velocity of the average sedimentparticle (medium sized silts). The net sediment accumulation rate, a value that is basedon field measurements, incorporated sediment accumulation and resuspension for aparticular area.
The METSED model is appropriate for an initial indication of whether CSO dischargesmay result in sediment contamination. However, as a stand-alone model, METSEDcannot provide spatial resolution of the contamination area or the sediment impact zone.
EFDC
The Environmental Fluid Dynamics Code (EFDC) model is a three-dimensionalcirculation and transport model that is used for estuarine simulations. EFDC incorporatesthe effects of tides, river hydraulics, and density-driven flows to predict the circulationand hydrodynamics of an estuarine system. EFDC includes sediment transport processes,and allows for the tracking of contaminant fate between the dissolved and sorbed states(Hamrick and Wu). EFDC may be applied to model sediment impact zones and sedimentnatural recovery. The County has used the EFDC model with the objective of estimatingother source loads (sources other than CSOs) into the Duwamish estuary, and assessinghow the removal of CSO source loads affects the contaminant concentrations in the waterand sediments.
The computational domain for the Duwamish estuary included Elliott Bay, the DuwamishRiver, and the Green River up to the intersection with I-405. The areal extent of theestuary was discretized into 512 finite difference cells. In the areas of sedimentcontamination (near the CSO outfalls), the cell size was approximately 250 m by 50 m.Vertically, the water column was divided into 10 layers, with the layer width based on thedensity stratification. The bottom sediments were treated as one continuous layer. Thehydrodynamic and contaminant fate and transport components were calibrated to theDuwamish Estuary.
A field sampling program was implemented to augment water concentration andsediment concentration data for the EFDC modeling input. The Elliott Bay boundary, theDuwamish boundary, and the CSOs were monitored for contaminant concentrations.Sediment concentrations and characteristics within Elliott Bay and the Duwamish Riverwere obtained from a database. Suspended solids input at the Green River boundary wasestimated with an empirical relationship based on a database of suspended solidsconcentrations and flow rate. The County’s Runoff and Transport Model used historicalrainfall data to estimate stormwater runoff hydrographs. Partition coefficients for metalswere computed for each sample site; partition coefficients for organics were obtainedfrom literature references.
Page 16
The EFDC model could be used to delineate the areal extent of sediment contamination.However, the configuration that is currently used by the County would be computerresource intensive to model the spatial footprint of contamination of all the CSO sites.
Officer and Lynch
The Officer and Lynch (1989) model is a one-dimensional sediment natural recoverymodel. It incorporates the burying of contaminated sediments, the mixing of cleanersediments to the surface by benthic organisms, and the exchanges between the bottomsediments and water column. The model also allows for non-advective concentrateexchange due to periodic and episodic resuspension of bottom sediments and exchangesacross the bottom boundary layer. In the Officer and Lynch model, the bioturbationeffects are represented by a constant diffusion coefficient applied over the mixed layerinterval. Beneath the mixed layer, the sediments are treated as a non-diffusive medium.
The Officer and Lynch model is based on the concentrate continuity equations for asystem that includes advective and diffusive processes (Officer and Lynch, 1982).Sedimentation is represented by an advection process, and bioturbation is represented asa diffusive process. The model uses the one-dimensional equation for advection anddiffusion processes, applying a continuity of flux boundary condition at the sediment:water interface and a continuity of flux and concentrate at the limit of the mixing zoneboundary. The Officer and Lynch model also allows for compaction effects in thesediment media and the variation of porosity with depth.
Parameters that need to be properly represented include the mixed layer depth, the netsediment accumulation rate, the bioturbation rate, the sediment specific gravity andporosity, and the interface concentrate exchange rate. The values of these parameters aregenerally based on field samples, sediment trap data, bathymetry surveys, andradiochemical sediment analysis. The Officer and Lynch model has been applied topredict sediment natural recovery for Sitcum Waterway Operable Unit, otherCommencement Bay Nearshore/Tideflats Site areas, Bellingham Bay, and other areas ofPuget Sound.
Van Genuchten and Parker
The van Genuchten and Parker (1984) model is based on the same governing equations asthe Officer and Lynch model. The van Genuchten and Parker model includes sedimentburial, sediment mixing, and sediment-water exchanges.
In the van Genuchten and Parker model, the concentrate continuity equation for a systemwith advective and diffusive processes is represented in a partial differential equation. Aswith the Officer and Lynch model, a continuity of flux boundary condition is applied atthe sediment water interface. A continuity of flux and concentrate boundary condition atthe limit of the mixing zone boundary would result in the same solution as described inthe Officer and Lynch model; however, the van Genuchten and Parker model has been
Page 17
configured with a semi-infinite boundary condition of a zero concentration gradient atinfinite sediment depth. This implies that the accumulating sediments are allowed to mixthroughout the sediment column, that mixing is not limited to the upper portion of thecolumn.
As with the Officer and Lynch model, the net sediment accumulation rate, thebioturbation rate, the sediment specific gravity and porosity values need to be properlyrepresented. The van Genuchten and Parker model has been applied to predict sedimentnatural recovery in the Hylebos Waterway of the Commencement BayNearshore/Tideflats Site.
CORMIX and PLUMES
The Cornell Mixing Zone Expert System (CORMIX) was designed to model pollutantdischarges into waterways. The CORMIX system consists of three separate modules toanalyze submerged single port discharges, multiport diffuser discharges, and surfacedischarges from pipes or channels. CORMIX incorporates buoyant effects of thedischarge with the stratified flow of the waterway to predict dilution and plume migrationand mixing. CORMIX focuses on the near-field mixing zone (Jirka et al. 1996).
CORMIX represents the receiving waterway with average values. While appropriate ona small scale basis, this model is limited to the extent of the discharged plume. CORMIXcan be used as a near-field mixing model, when the buoyancy effects of the dischargedeffluent and momentum effects of the receiving waterway are important.
PLUMES models pollutant discharges and mixing in a manner similar to CORMIX.PLUMES is an EPA model that has obtained regulatory approval for modelingsubmerged port and multiport diffuser discharges, and is also commonly applied at SMSsites for outfall-related recontamination evaluations.
WASP
WASP (the Water Quality Analysis Simulation Program) consists of a set of two separatemodules to model the hydrodynamics and fate and transport of contaminants (both withinthe water system and sediment system). WASP is listed here because it is identified inthe Sediment Management Standards as a sediment impact zone model and as a model topredict the effects of natural recovery. A model such as WASP is particularlyappropriate in relatively complex receiving water/sediment environments.
With regard to the governing equations and physical processes, WASP is similar to theEFDC model. Additionally, both WASP and EFDC can be used to model the effect ofmultiple discharges. Differences between the two models arise in numerical algorithms,how sediment resuspension is handled, and the ability to incorporate sediment layering.The EFDC model treats the sediment as a single layer but can dynamically modelsediment resuspension; the WASP model can incorporate multiple sediment layers, butcan not dynamically model sediment resuspension.
Page 18
The WASP system is comprised of two separate models, DYNHYD, a hydrodynamicmodel, and WASP, a water quality program. With the hydrodynamic solution, theWASP program solves sediment transport and chemical kinetic relationships to predictthe contaminant transport. For WASP simulations, the DYNHYD program is the mostcompatible one that estimates the hydrodynamic conditions. Other linked programs arealso available for application to WASP.
WASP requires a computational domain discretized in a manner similar to the domain forthe EFDC simulation of the Duwamish estuary. Since EFDC can dynamically modelsediment resuspension, it would be more appropriate for situations that include irregular,varying flow conditions. However, the flow field from an EFDC model run can be usedwith the WASP model.
Page 19
DiSCUSSION
For screening-level analysis, the SEDCAM/METSED model has been applied to someKing County sites to evaluate the potential to recontaminate the sediments. TheMETSED model cannot provide a delineation of the contaminant area, but can be used asan initial tool to indicate whether more detailed modeling should be conducted.
Contaminant fate and transport models, such as EFDC and WASP, are more detailed andcan be used to identify the contaminant area. These finite difference models typicallyrequire that the extent of the estuary be discretized to model the hydrodynamics of thesystem. The resolution of spatial discretization affects the computational intensiveness ofthe model (and the time required for model execution). To keep the computations of thehydrodynamic solution manageable, the discretization may be greater than thecontaminated area to be modeled. However, the hydrodynamics and contaminanttransport are important processes that contribute to sediment impact and natural recoveryprocesses.
The contaminant fate and transport models can be decoupled from the hydrodynamics;this would enable different grid resolutions between the hydrodynamic solution and thecontaminant fate and transport solution. For example, the hydrodynamic solution for arepresentative time frame (large grid resolution) can be used to run the contaminant fateand transport model (fine grid resolution). A representative time frame could be a tidalcycle with average annual CSO and river inflow conditions.
A means to incorporate local mixing of the CSO inflow is to use a near-field model (suchas CORMIX or PLUMES) coupled with the far-field model (such as EFDC or WASP).For an initial screening, the near-field model can be used to assess whetherrecontamination in the area surrounding the CSO requires further investigation. Shouldthat be the case, the near-field model can be used to help establish the cell size forsubsequent contaminant transport model runs.
A sediment mixing model (such as Officer and Lynch) can be applied with the results ofthe near-field/far-field coupled model. Using a separate sediment recovery model has theadvantage that the near-field results can be applied for the local area around the CSOoutfall. The Officer and Lynch model is more refined than the SEDCAM model; it hasbeen used to predict the natural recovery for other contaminated sediment sites in thePuget Sound area and in the alternatives decision process for these sites. Use of theOfficer and Lynch model requires site specific parameters based on field measurements.This model includes sediment resuspension, but does not track the movement of theresuspended sediment. The Officer and Lynch model represents more of the physicalprocesses behind natural recovery.
Page 20
RECOMMENDATION
For the County’s Sediment Management Program, a combination of near-field and far-field models is recommended. The discharge model PLUMES is currently used andmaintained by the County and is an appropriate model for near-field effects. Thehydrodynamic and transport model EFDC is also used by the County and can be appliedto predict far-field effects. For sediment impact zone modeling, this coupled combinationof models can predict the influence that continuing discharges will produce in theestuarine system. Additionally, the EFDC model results can be used to predict thenatural recovery of an area once sources have been controlled. For more detailedrepresentation of the sediments, the sediment deposition and resuspension from EFDCcan be used with a sediment recovery model such as the Officer and Lynch model tomore accurately represent the sediment mixing process.
The level of detail and refinement to the existing EFDC/PLUMES model currently usedwould be dependent on the resolution to which the contamination needs to be modeled.For screening level modeling, a flowchart of this recommendation is provided in Figure3. Using the far-field model (EFDC) as it is currently configured, the contaminantconcentration of the suspended solids can be evaluated and compared to the SQS values.Should the model predict concentrations greater than the SQS, then the far-field modelcould be refined - either in spatial discretization, input concentrations, or flow conditions,to provide a more accurate assessment of the nature and extent of sedimentrecontamination potential. In addition, the near-field model (PLUMES) results could beevaluated and compared to the SQS values. (Many of these steps in the process havealready been completed, and are discussed in the Preliminary Model Results section.)
Should the near-field model results exceed the SQS, then the PLUMES model can beused to define the zone of initial dilution; that can be used as the minimum cell size forfurther refinements to the near-field modeling. The refined PLUMES runs can then beused to evaluate whether the contaminant concentrations of suspended solids exceed theSQS in the zone of initial dilution. Should that be the case, then the modeling can berefined, either with a steady state approximation using the EFDC model (as it isconfigured), or using the WASP contaminant transport model (with a hydrodynamicsolution of a representative long-term average condition). These refinements wouldenable a finer grid resolution to better define contaminant extent with subsequentmodeling runs.
Page 21
Figure 3. Screening Modeling Flowchart
I:\klarm\share\KingCo\ScreeningFC.ppt
Farfield(WQA) Modeling
> SQS?
> SQS?
> SQS in
ZID?
Yes
Yes
Yes
No
No
No
Evaluate ContaminantConcentration of Suspended Solids
Evaluate ContaminantConcentration of Suspended Solids
Nearfield (PLUMES)Modeling
Refine Modeling
Sediment NaturalRecovery Modeling
Define ZID withPLUMES
Sediment NaturalRecovery Modeling
2-D Steady StateModeling (WQA)
Evaluate ContaminantConcentration of Suspended Solids
Screening Modeling Flowchart
ZID = Zone of Initial Dilution
SQS = Sediment Quality Standards
Page 22
REFERENCES
Duwamish River and Elliott Bay Water Quality Assessment Team, 1998. King CountyCombined Sewer Overflow Water Quality Assessment for the Duwamish River andElliott Bay. Draft Volume IV: Hydrodynamic and Fate and Transport Numerical Modelfor the Duwamish River and Elliott Bay.
EcoChem, 1998. Proposal for Evaluation of Potential Recontamination and Completionof Duwamish Site Assessment Report.
ENSR and HDR Engineering, 1998a. Predesign Letter Report on Duwamish RiverSediment Quality Modeling.
ENSR and HDR Engineering, 1998b. Predesign Letter Report on Performance Modelingof the Tunnel Alternative.
Hamrick, J. M., and T. S. Wu. Computational Design, Optimization and PerformanceBenchmarking of the EFDC/HEM3D Surface Water Circulation and EutrophicationModeling System, National Environmental Supercomputing Center.
Jirka, G. H., R. L. Donecker, and S. W. Hinton, 1996. User’s Manual for CORMIX: AHydrodynamic Mixing Zone Model and Decision Support System for PollutantDischarges into Surface Waters. EPA Office of Science and Technology, WashingtonDC.
Lavelle, J.W., G.J. Massoth and E.A. Crecelius, 1985. Sedimentation rates in PugetSound from 210Pb measurements. NOAA Technical Memorandum ERL PMEL-61.Pacific Marine Environmental Laboratory, Seattle, WA. January, 1985.
Officer, C. B. and Lynch, D. R., 1982. Interpretation procedures for the determination ofsediment parameters from time-dependent flux inputs. Earth and Planetary ScienceLetters 61, 55-62.
Officer, C. B. and Lynch, D. R., 1989. Bioturbation, sedimentation and sediment-waterexchanges. Estuarine, Coastal and Shelf Science 28, 1-12.
Schock, K., and Shuman, R., 1996. Norfolk Recontamination Modeling Report, preparedfor the Elliott Bay/Duwamish Restoration Program Panel.
Tetra Tech, 1988. Commencement Bay Nearshore/Tideflats Feasibility Study. Reportprepared for Washington State Department of Ecology by Tetra Tech, Inc., Bellevue,WA.
van Genuchten, M. Th. And Parker, J. C., 1984. Boundary conditions for displacementexperiments through short laboratory soil columns. Soil Sci. Soc. Am.J. 48, 703-708.


![Characterization of Vadose Zone Sediment: Borehole 299 …Characterization of Vadose Zone Sediment: Borehole 299-W23-19 [SX-115] in the S-SX Waste ... investigated at tank SX-108 and](https://img.pdfslide.net/doc/110x75/5e72bfa102db65480d112574/characterization-of-vadose-zone-sediment-borehole-299-characterization-of-vadose.jpg)