Embed Size (px)
Citation preview

73
Model Simulation of Soil Loss, Nutrient Loss, and Change in Soil Organic Carbon Associated with Crop Production
(June 2006)
Sediment loss from water erosion
Modeling sediment loss
Water erosion is the detachment and transport of soil particles by rainfall or irrigation water. When precipi-tation events occur, raindrops break the bond between soil particles and displace them. Sheet erosion takes place when the dislodged soil particles are moved by thin sheets of water flowing over the surface. Rill ero-sion occurs when the surface flow of water establish-es paths and the flowing water detaches soil particles from the sides and bottoms of the rills that are formed. Ephemeral or concentrated-flow erosion follows when the topography of a landscape is such that rills enlarge and join with others to form channels. When concen-trated-flow erosion is allowed to continue over time, it results in gully erosion, which is the most severe form of water erosion found on cropland.
The interaction between weather, soil properties, and farming practices (including irrigation) determines the rate of soil erosion. The amount of rainfall and the rainfall intensity are primary determinants of water erosion under rain-fed conditions. Irrigation induced erosion is primarily determined by the velocity of the water flowing through the furrows or basin and the volume and intensity of the water applied during sprin-kler irrigation. The inherent potential for soil to erode is determined by the slope and topography of the land, the texture and structure of the soil, and the organ-ic matter content in the soil. Soil texture refers to the proportions of particles of sand, silt, and clay in the soil. Water moves detached clay particles more readi-ly than particles of silt or sand, but clay particle bonds are also stronger than those of silt and sand. Soil struc-ture refers to how the soil particles are clustered in aggregates, which are held together by physical and chemical bonds. The shape, size, and arrangement of aggregates determine the pathways of infiltrating wa-ter and the volume of air space between aggregates. The more air space within a soil, the more room it has for infiltrating water. Reduced infiltration leads to more runoff, and thus more water erosion. Strong bonds and large aggregates provide more resistance to erosive forces. Organic matter enhances soil structure and increases water infiltration, thereby reducing the potential for water erosion. Plant cover and crop resi-due also reduce the potential for water erosion.
The EPIC model simulates sheet and rill erosion pro-cesses. The current version of EPIC includes six alter-native water erosion prediction equations that repre-sent different methods of accounting for erosion and net sediment delivery from the field. For this study, the Modified Universal Soil Loss Equation (MUSLE) was selected for reporting sediment delivery. MUSLE accounts for the amount of eroded soil that leaves the field through the processes of sheet and rill ero-sion. MUSLE does not include soil loss that can occur through ephemeral gully or gully erosion processes or erosion of furrows or basins during gravity irrigation events.
MUSLE is a modification of the Universal Soil Loss Equation (USLE). USLE is an estimate of sheet and rill soil movement down a uniform slope using rain-fall energy as the erosive force acting on the soil (Wischmeier and Smith 1978). Depending on soil char-acteristics (texture, structure, organic matter, and per-meability), some soils erode easily while others are inherently more resistant to the erosive action of rain-fall.
MUSLE is similar to USLE except for the energy com-ponent. USLE depends strictly upon rainfall as the source of erosive energy. MUSLE uses storm-based runoff volumes and runoff peak flows to simulate ero-sion and sediment yield (Williams 1995). The use of runoff variables rather than rainfall erosivity as the driving force enables MUSLE to estimate sediment yields for individual storm events. The water erosion model uses an equation of the form:
Y X EK CVF PE SL ROKF= × × × × ×
where:Y = sediment yield in tons per hectareEK = soil erodibility factorCVF = crop management factor that captures the
relative effectiveness of soil and crop man-agement systems in preventing soil loss
PE = erosion control practice factor (including management practices such as terraces, contour farming, and stripcropping)
SL = slope length and steepness factorROKF = coarse fragment factor
For estimating MUSLE, the energy factor, X, is repre-sented by:
Model Simulation of Soil Loss, Nutrient Loss, and Change in Soil Organic Carbon Associated with Crop Production
74 (June 2006)
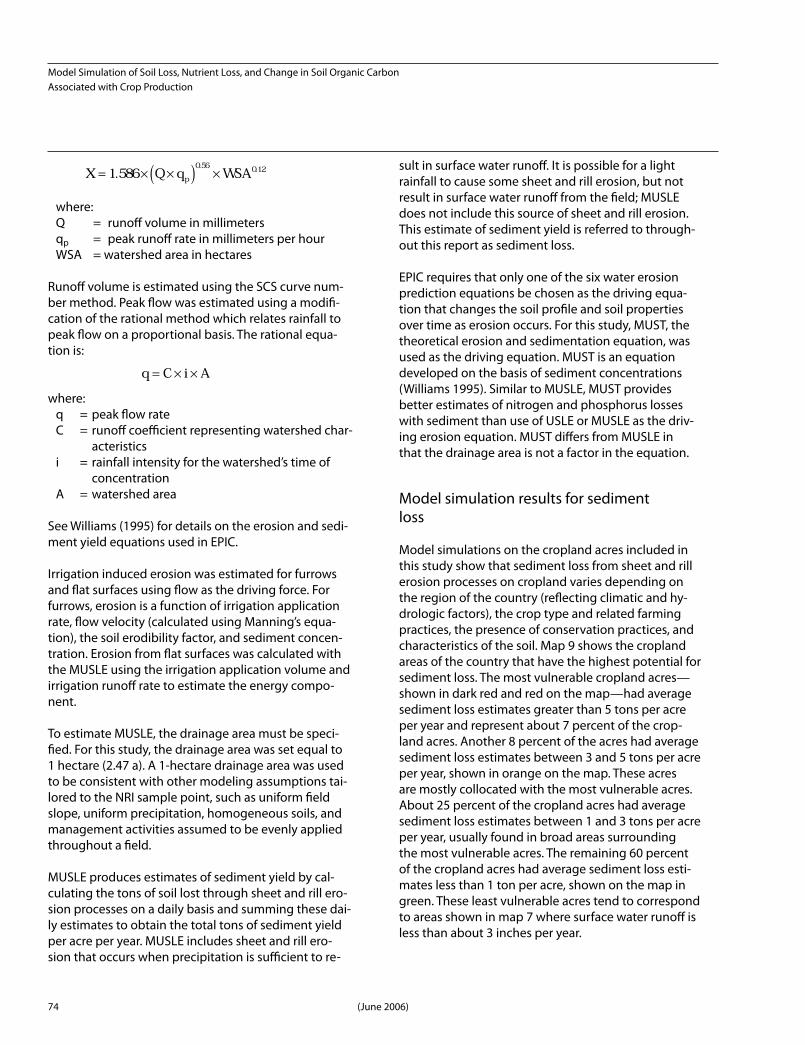
X Q q WSAp= × ×( ) ×1586
056 012.. .
where:Q = runoff volume in millimetersqp = peak runoff rate in millimeters per hourWSA = watershed area in hectares
Runoff volume is estimated using the SCS curve num-ber method. Peak flow was estimated using a modifi-cation of the rational method which relates rainfall to peak flow on a proportional basis. The rational equa-tion is:
q C i A= × ×
where:q = peak flow rateC = runoff coefficient representing watershed char-
acteristicsi = rainfall intensity for the watershed’s time of
concentrationA = watershed area
See Williams (1995) for details on the erosion and sedi-ment yield equations used in EPIC.
Irrigation induced erosion was estimated for furrows and flat surfaces using flow as the driving force. For furrows, erosion is a function of irrigation application rate, flow velocity (calculated using Manning’s equa-tion), the soil erodibility factor, and sediment concen-tration. Erosion from flat surfaces was calculated with the MUSLE using the irrigation application volume and irrigation runoff rate to estimate the energy compo-nent.
To estimate MUSLE, the drainage area must be speci-fied. For this study, the drainage area was set equal to 1 hectare (2.47 a). A 1-hectare drainage area was used to be consistent with other modeling assumptions tai-lored to the NRI sample point, such as uniform field slope, uniform precipitation, homogeneous soils, and management activities assumed to be evenly applied throughout a field.
MUSLE produces estimates of sediment yield by cal-culating the tons of soil lost through sheet and rill ero-sion processes on a daily basis and summing these dai-ly estimates to obtain the total tons of sediment yield per acre per year. MUSLE includes sheet and rill ero-sion that occurs when precipitation is sufficient to re-
sult in surface water runoff. It is possible for a light rainfall to cause some sheet and rill erosion, but not result in surface water runoff from the field; MUSLE does not include this source of sheet and rill erosion. This estimate of sediment yield is referred to through-out this report as sediment loss.
EPIC requires that only one of the six water erosion prediction equations be chosen as the driving equa-tion that changes the soil profile and soil properties over time as erosion occurs. For this study, MUST, the theoretical erosion and sedimentation equation, was used as the driving equation. MUST is an equation developed on the basis of sediment concentrations (Williams 1995). Similar to MUSLE, MUST provides better estimates of nitrogen and phosphorus losses with sediment than use of USLE or MUSLE as the driv-ing erosion equation. MUST differs from MUSLE in that the drainage area is not a factor in the equation.
Model simulation results for sediment loss
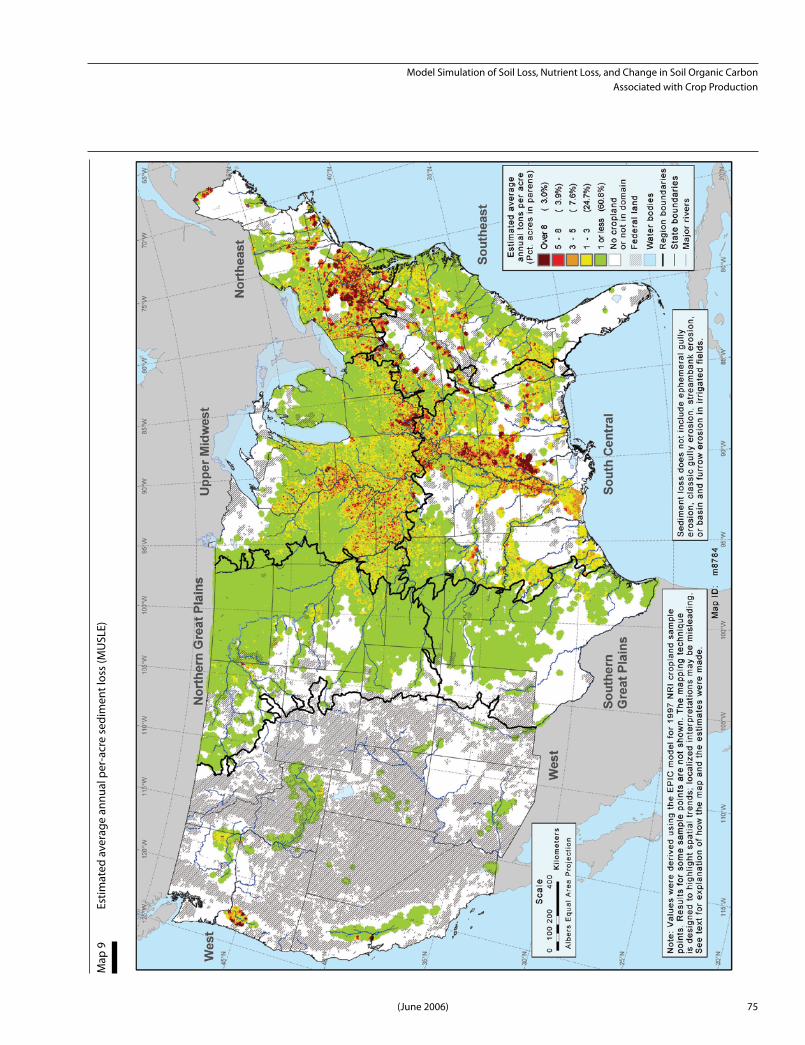
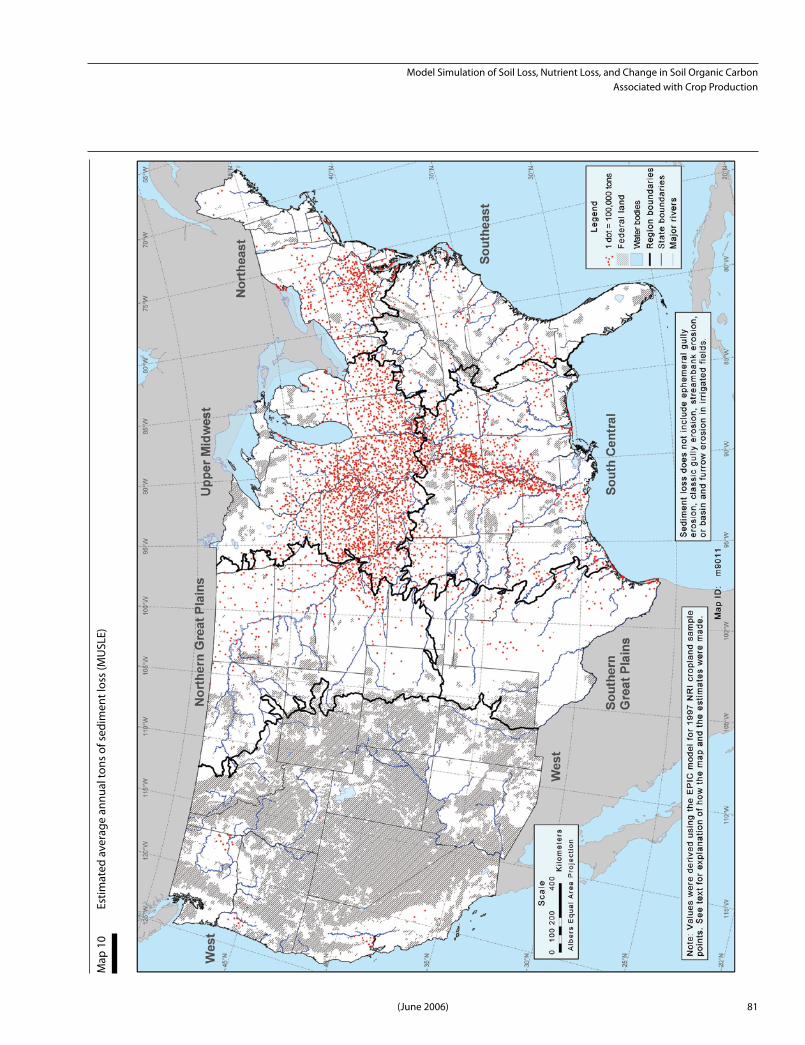
Model simulations on the cropland acres included in this study show that sediment loss from sheet and rill erosion processes on cropland varies depending on the region of the country (reflecting climatic and hy-drologic factors), the crop type and related farming practices, the presence of conservation practices, and characteristics of the soil. Map 9 shows the cropland areas of the country that have the highest potential for sediment loss. The most vulnerable cropland acres—shown in dark red and red on the map—had average sediment loss estimates greater than 5 tons per acre per year and represent about 7 percent of the crop-land acres. Another 8 percent of the acres had average sediment loss estimates between 3 and 5 tons per acre per year, shown in orange on the map. These acres are mostly collocated with the most vulnerable acres. About 25 percent of the cropland acres had average sediment loss estimates between 1 and 3 tons per acre per year, usually found in broad areas surrounding the most vulnerable acres. The remaining 60 percent of the cropland acres had average sediment loss esti-mates less than 1 ton per acre, shown on the map in green. These least vulnerable acres tend to correspond to areas shown in map 7 where surface water runoff is less than about 3 inches per year.
75
Model Simulation of Soil Loss, Nutrient Loss, and Change in Soil Organic Carbon Associated with Crop Production
(June 2006)
Map
9
Estim
ated
ave
rage
ann
ual p
er-a
cre
sedi
men
t los
s (M
USL
E)
Model Simulation of Soil Loss, Nutrient Loss, and Change in Soil Organic Carbon Associated with Crop Production
76 (June 2006)
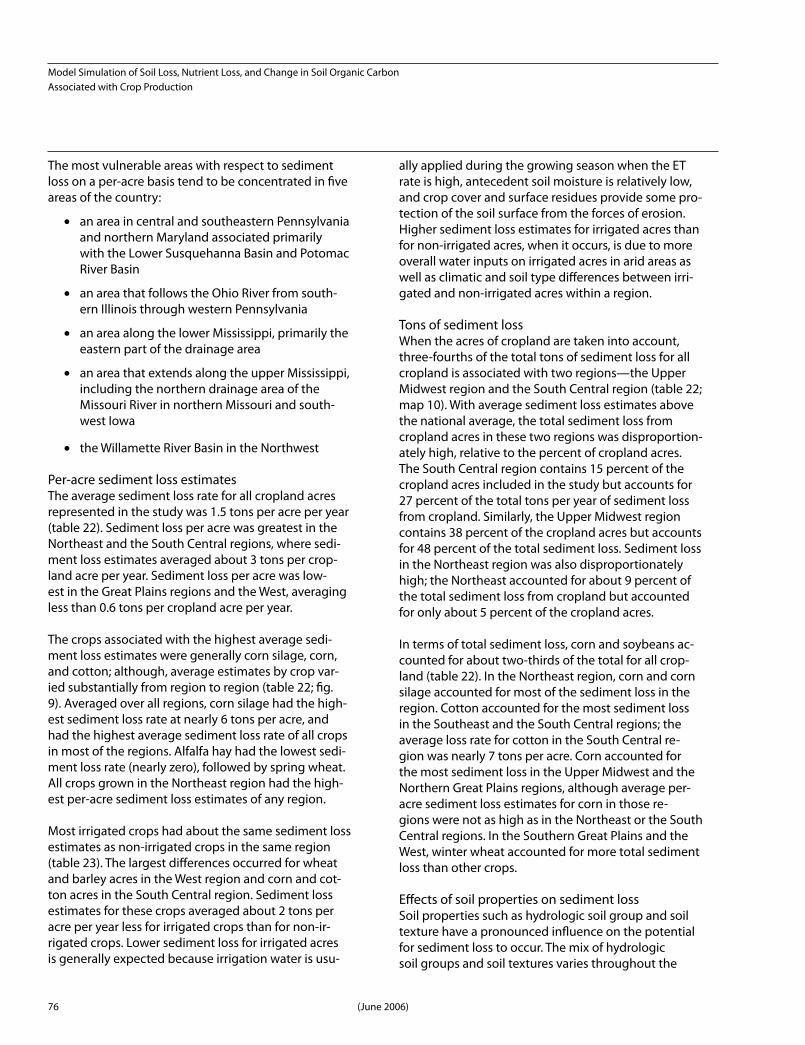
The most vulnerable areas with respect to sediment loss on a per-acre basis tend to be concentrated in five areas of the country:
• an area in central and southeastern Pennsylvania and northern Maryland associated primarily with the Lower Susquehanna Basin and Potomac River Basin
• an area that follows the Ohio River from south-ern Illinois through western Pennsylvania
• an area along the lower Mississippi, primarily the eastern part of the drainage area
• an area that extends along the upper Mississippi, including the northern drainage area of the Missouri River in northern Missouri and south-west Iowa
• the Willamette River Basin in the Northwest
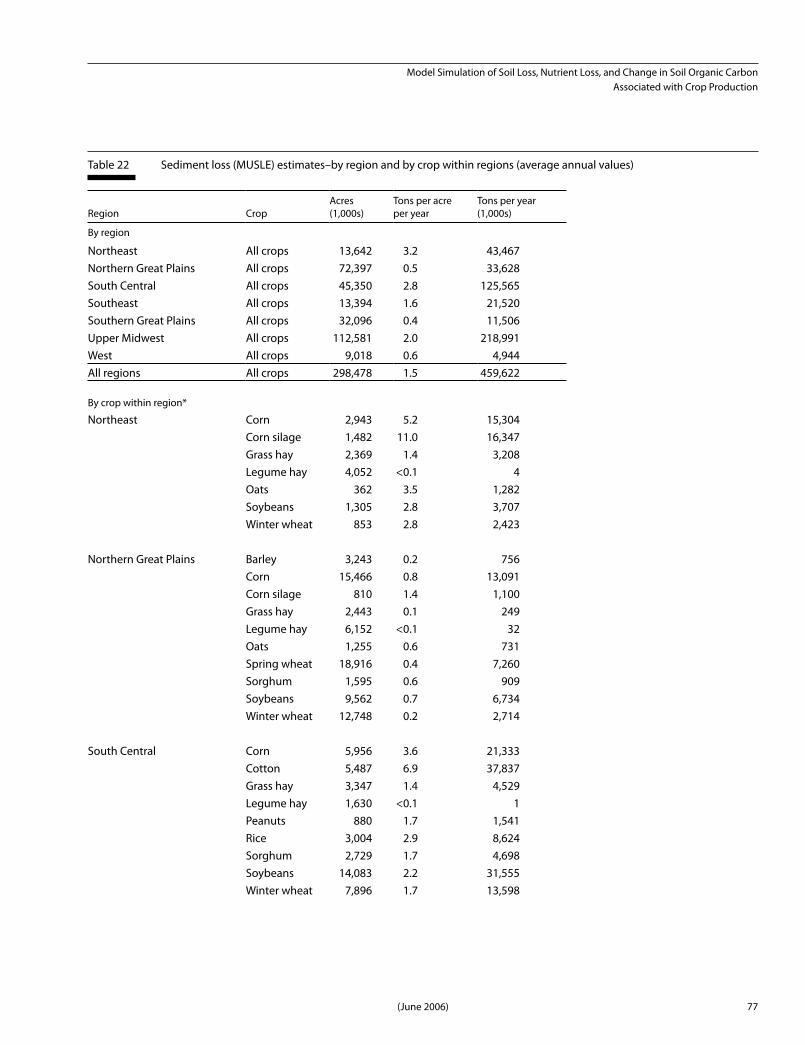
Per-acre sediment loss estimatesThe average sediment loss rate for all cropland acres represented in the study was 1.5 tons per acre per year (table 22). Sediment loss per acre was greatest in the Northeast and the South Central regions, where sedi-ment loss estimates averaged about 3 tons per crop-land acre per year. Sediment loss per acre was low-est in the Great Plains regions and the West, averaging less than 0.6 tons per cropland acre per year.
The crops associated with the highest average sedi-ment loss estimates were generally corn silage, corn, and cotton; although, average estimates by crop var-ied substantially from region to region (table 22; fig. 9). Averaged over all regions, corn silage had the high-est sediment loss rate at nearly 6 tons per acre, and had the highest average sediment loss rate of all crops in most of the regions. Alfalfa hay had the lowest sedi-ment loss rate (nearly zero), followed by spring wheat. All crops grown in the Northeast region had the high-est per-acre sediment loss estimates of any region.
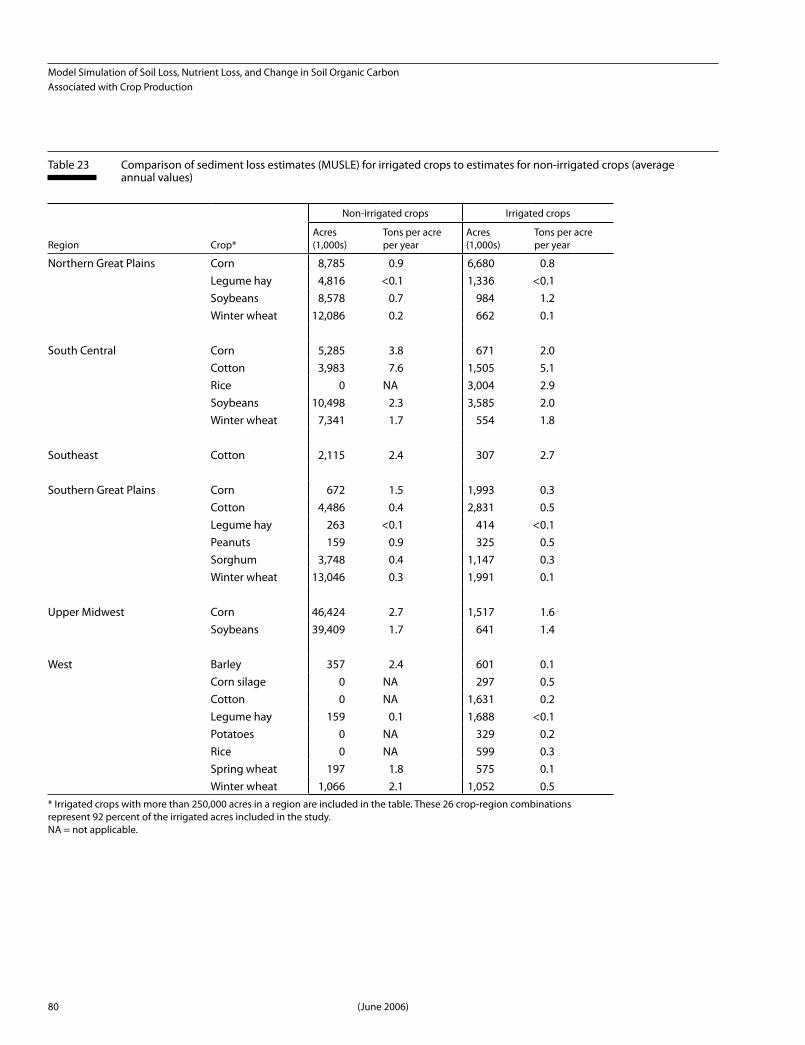
Most irrigated crops had about the same sediment loss estimates as non-irrigated crops in the same region (table 23). The largest differences occurred for wheat and barley acres in the West region and corn and cot-ton acres in the South Central region. Sediment loss estimates for these crops averaged about 2 tons per acre per year less for irrigated crops than for non-ir-rigated crops. Lower sediment loss for irrigated acres is generally expected because irrigation water is usu-
ally applied during the growing season when the ET rate is high, antecedent soil moisture is relatively low, and crop cover and surface residues provide some pro-tection of the soil surface from the forces of erosion. Higher sediment loss estimates for irrigated acres than for non-irrigated acres, when it occurs, is due to more overall water inputs on irrigated acres in arid areas as well as climatic and soil type differences between irri-gated and non-irrigated acres within a region.
Tons of sediment loss When the acres of cropland are taken into account, three-fourths of the total tons of sediment loss for all cropland is associated with two regions—the Upper Midwest region and the South Central region (table 22; map 10). With average sediment loss estimates above the national average, the total sediment loss from cropland acres in these two regions was disproportion-ately high, relative to the percent of cropland acres. The South Central region contains 15 percent of the cropland acres included in the study but accounts for 27 percent of the total tons per year of sediment loss from cropland. Similarly, the Upper Midwest region contains 38 percent of the cropland acres but accounts for 48 percent of the total sediment loss. Sediment loss in the Northeast region was also disproportionately high; the Northeast accounted for about 9 percent of the total sediment loss from cropland but accounted for only about 5 percent of the cropland acres.
In terms of total sediment loss, corn and soybeans ac-counted for about two-thirds of the total for all crop-land (table 22). In the Northeast region, corn and corn silage accounted for most of the sediment loss in the region. Cotton accounted for the most sediment loss in the Southeast and the South Central regions; the average loss rate for cotton in the South Central re-gion was nearly 7 tons per acre. Corn accounted for the most sediment loss in the Upper Midwest and the Northern Great Plains regions, although average per-acre sediment loss estimates for corn in those re-gions were not as high as in the Northeast or the South Central regions. In the Southern Great Plains and the West, winter wheat accounted for more total sediment loss than other crops.
Effects of soil properties on sediment lossSoil properties such as hydrologic soil group and soil texture have a pronounced influence on the potential for sediment loss to occur. The mix of hydrologic soil groups and soil textures varies throughout the
77
Model Simulation of Soil Loss, Nutrient Loss, and Change in Soil Organic Carbon Associated with Crop Production
(June 2006)
Table 22 Sediment loss (MUSLE) estimates–by region and by crop within regions (average annual values)
Region CropAcres(1,000s)
Tons per acreper year
Tons per year (1,000s)
By region
Northeast All crops 13,642 3.2 43,467Northern Great Plains All crops 72,397 0.5 33,628South Central All crops 45,350 2.8 125,565Southeast All crops 13,394 1.6 21,520Southern Great Plains All crops 32,096 0.4 11,506Upper Midwest All crops 112,581 2.0 218,991West All crops 9,018 0.6 4,944All regions All crops 298,478 1.5 459,622
By crop within region*
Northeast Corn 2,943 5.2 15,304Corn silage 1,482 11.0 16,347Grass hay 2,369 1.4 3,208Legume hay 4,052 <0.1 4Oats 362 3.5 1,282Soybeans 1,305 2.8 3,707Winter wheat 853 2.8 2,423
Northern Great Plains Barley 3,243 0.2 756Corn 15,466 0.8 13,091Corn silage 810 1.4 1,100Grass hay 2,443 0.1 249Legume hay 6,152 <0.1 32Oats 1,255 0.6 731Spring wheat 18,916 0.4 7,260Sorghum 1,595 0.6 909Soybeans 9,562 0.7 6,734Winter wheat 12,748 0.2 2,714
South Central Corn 5,956 3.6 21,333Cotton 5,487 6.9 37,837Grass hay 3,347 1.4 4,529Legume hay 1,630 <0.1 1Peanuts 880 1.7 1,541Rice 3,004 2.9 8,624Sorghum 2,729 1.7 4,698Soybeans 14,083 2.2 31,555Winter wheat 7,896 1.7 13,598

Model Simulation of Soil Loss, Nutrient Loss, and Change in Soil Organic Carbon Associated with Crop Production
78 (June 2006)
Region CropAcres(1,000s)
Tons per acreper year
Tons per year (1,000s)
Southeast Corn 3,028 1.4 4,197Corn silage 412 6.7 2,746Cotton 2,422 2.4 5,832Grass hay 2,000 1.2 2,380Legume hay 1,183 <0.1 2Peanuts 479 1.8 861Soybeans 2,419 1.0 2,372Winter wheat 1,216 2.3 2,787
Southern Great Plains Corn 2,665 0.6 1,588Cotton 7,316 0.4 3,083Legume hay 677 0.0 0Oats 503 0.6 310Peanuts 484 0.6 295Sorghum 4,895 0.4 1,826Winter wheat 15,037 0.3 4,289
Upper Midwest Corn 47,941 2.6 126,254Corn silage 1,947 4.4 8,495Grass hay 4,044 0.5 2,034Legume hay 9,233 <0.1 4Oats 1,388 2.2 3,019Spring wheat 815 0.2 184Sorghum 1,604 2.0 3,155Soybeans 40,049 1.7 69,565Winter wheat 5,147 1.2 6,096
West Barley 958 1.0 914Corn silage 297 0.5 140Cotton 1,631 0.2 282Legume hay 1,847 <0.1 21Potatoes 329 0.2 63Rice 599 0.3 164Spring wheat 772 0.5 401Winter wheat 2,118 1.3 2,812
* Estimates for crops with less than 250,000 acres within a region are not shown. However, acres for these minor crops are included in the calculation of the regional estimates.
Table 22 Sediment loss (MUSLE) estimates–by region and by crop within regions (average annual values)—Continued

79
Model Simulation of Soil Loss, Nutrient Loss, and Change in Soil Organic Carbon Associated with Crop Production
(June 2006)
Figure 9 Sediment loss estimates (MUSLE)–by crop within regions
0.0
2.0
6.0
4.0
8.0
10.0
12.0
Ave
rage
sed
imen
t lo
ss (
ton
/a/y
r)
Northeast
Northern Great Plains
South Central
Southeast
Southern Great Plains
Upper Midwest
West
Soybeans Winter wheat
SorghumSpring wheat
RicePotatoesPeanutsOatsLegumehay
Cornsilage
Cotton Grasshay
CornBarley
Model Simulation of Soil Loss, Nutrient Loss, and Change in Soil Organic Carbon Associated with Crop Production
80 (June 2006)
Table 23 Comparison of sediment loss estimates (MUSLE) for irrigated crops to estimates for non-irrigated crops (average annual values)
Non-irrigated crops Irrigated crops
Region Crop*Acres(1,000s)
Tons per acre per year
Acres(1,000s)
Tons per acre per year
Northern Great Plains Corn 8,785 0.9 6,680 0.8Legume hay 4,816 <0.1 1,336 <0.1Soybeans 8,578 0.7 984 1.2Winter wheat 12,086 0.2 662 0.1
South Central Corn 5,285 3.8 671 2.0Cotton 3,983 7.6 1,505 5.1Rice 0 NA 3,004 2.9Soybeans 10,498 2.3 3,585 2.0Winter wheat 7,341 1.7 554 1.8
Southeast Cotton 2,115 2.4 307 2.7
Southern Great Plains Corn 672 1.5 1,993 0.3Cotton 4,486 0.4 2,831 0.5Legume hay 263 <0.1 414 <0.1Peanuts 159 0.9 325 0.5Sorghum 3,748 0.4 1,147 0.3Winter wheat 13,046 0.3 1,991 0.1
Upper Midwest Corn 46,424 2.7 1,517 1.6Soybeans 39,409 1.7 641 1.4
West Barley 357 2.4 601 0.1Corn silage 0 NA 297 0.5Cotton 0 NA 1,631 0.2Legume hay 159 0.1 1,688 <0.1Potatoes 0 NA 329 0.2Rice 0 NA 599 0.3Spring wheat 197 1.8 575 0.1Winter wheat 1,066 2.1 1,052 0.5
* Irrigated crops with more than 250,000 acres in a region are included in the table. These 26 crop-region combinations represent 92 percent of the irrigated acres included in the study.NA = not applicable.
81
Model Simulation of Soil Loss, Nutrient Loss, and Change in Soil Organic Carbon Associated with Crop Production
(June 2006)
Map
10
Estim
ated
ave
rage
ann
ual t
ons
of s
edim
ent l
oss
(MU
SLE)
Model Simulation of Soil Loss, Nutrient Loss, and Change in Soil Organic Carbon Associated with Crop Production
82 (June 2006)
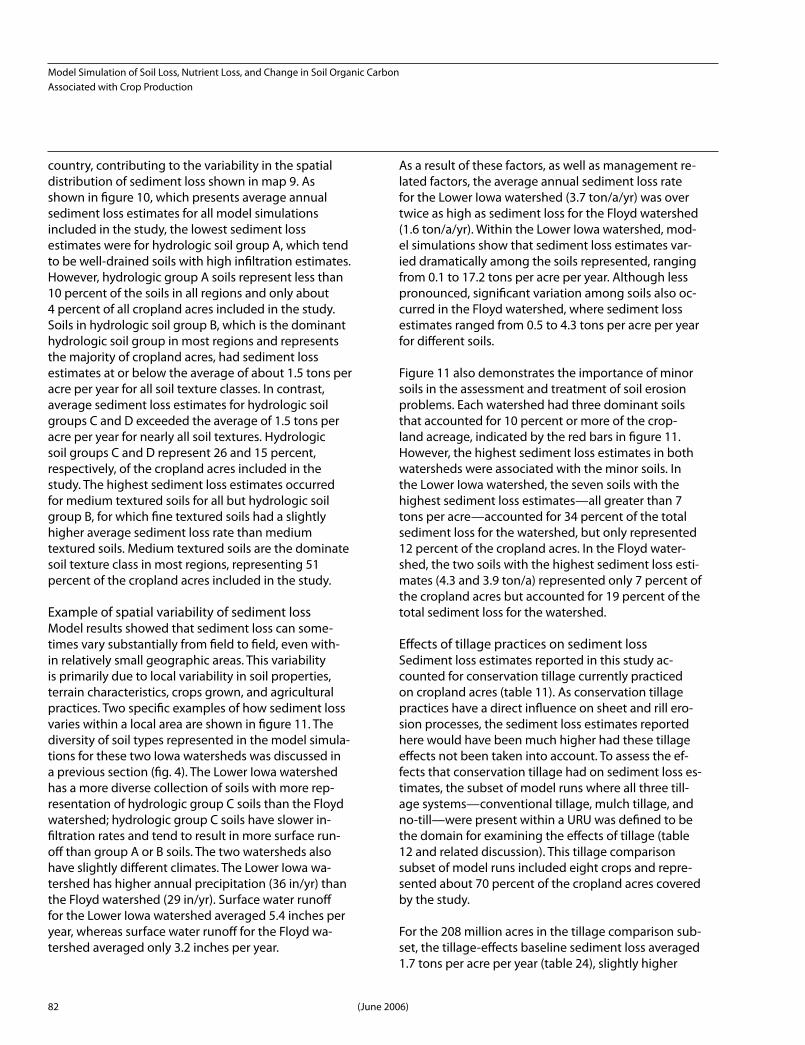
country, contributing to the variability in the spatial distribution of sediment loss shown in map 9. As shown in figure 10, which presents average annual sediment loss estimates for all model simulations included in the study, the lowest sediment loss estimates were for hydrologic soil group A, which tend to be well-drained soils with high infiltration estimates. However, hydrologic group A soils represent less than 10 percent of the soils in all regions and only about 4 percent of all cropland acres included in the study. Soils in hydrologic soil group B, which is the dominant hydrologic soil group in most regions and represents the majority of cropland acres, had sediment loss estimates at or below the average of about 1.5 tons per acre per year for all soil texture classes. In contrast, average sediment loss estimates for hydrologic soil groups C and D exceeded the average of 1.5 tons per acre per year for nearly all soil textures. Hydrologic soil groups C and D represent 26 and 15 percent, respectively, of the cropland acres included in the study. The highest sediment loss estimates occurred for medium textured soils for all but hydrologic soil group B, for which fine textured soils had a slightly higher average sediment loss rate than medium textured soils. Medium textured soils are the dominate soil texture class in most regions, representing 51 percent of the cropland acres included in the study.
Example of spatial variability of sediment loss Model results showed that sediment loss can some-times vary substantially from field to field, even with-in relatively small geographic areas. This variability is primarily due to local variability in soil properties, terrain characteristics, crops grown, and agricultural practices. Two specific examples of how sediment loss varies within a local area are shown in figure 11. The diversity of soil types represented in the model simula-tions for these two Iowa watersheds was discussed in a previous section (fig. 4). The Lower Iowa watershed has a more diverse collection of soils with more rep-resentation of hydrologic group C soils than the Floyd watershed; hydrologic group C soils have slower in-filtration rates and tend to result in more surface run-off than group A or B soils. The two watersheds also have slightly different climates. The Lower Iowa wa-tershed has higher annual precipitation (36 in/yr) than the Floyd watershed (29 in/yr). Surface water runoff for the Lower Iowa watershed averaged 5.4 inches per year, whereas surface water runoff for the Floyd wa-tershed averaged only 3.2 inches per year.
As a result of these factors, as well as management re-lated factors, the average annual sediment loss rate for the Lower Iowa watershed (3.7 ton/a/yr) was over twice as high as sediment loss for the Floyd watershed (1.6 ton/a/yr). Within the Lower Iowa watershed, mod-el simulations show that sediment loss estimates var-ied dramatically among the soils represented, ranging from 0.1 to 17.2 tons per acre per year. Although less pronounced, significant variation among soils also oc-curred in the Floyd watershed, where sediment loss estimates ranged from 0.5 to 4.3 tons per acre per year for different soils.
Figure 11 also demonstrates the importance of minor soils in the assessment and treatment of soil erosion problems. Each watershed had three dominant soils that accounted for 10 percent or more of the crop-land acreage, indicated by the red bars in figure 11. However, the highest sediment loss estimates in both watersheds were associated with the minor soils. In the Lower Iowa watershed, the seven soils with the highest sediment loss estimates—all greater than 7 tons per acre—accounted for 34 percent of the total sediment loss for the watershed, but only represented 12 percent of the cropland acres. In the Floyd water-shed, the two soils with the highest sediment loss esti-mates (4.3 and 3.9 ton/a) represented only 7 percent of the cropland acres but accounted for 19 percent of the total sediment loss for the watershed.
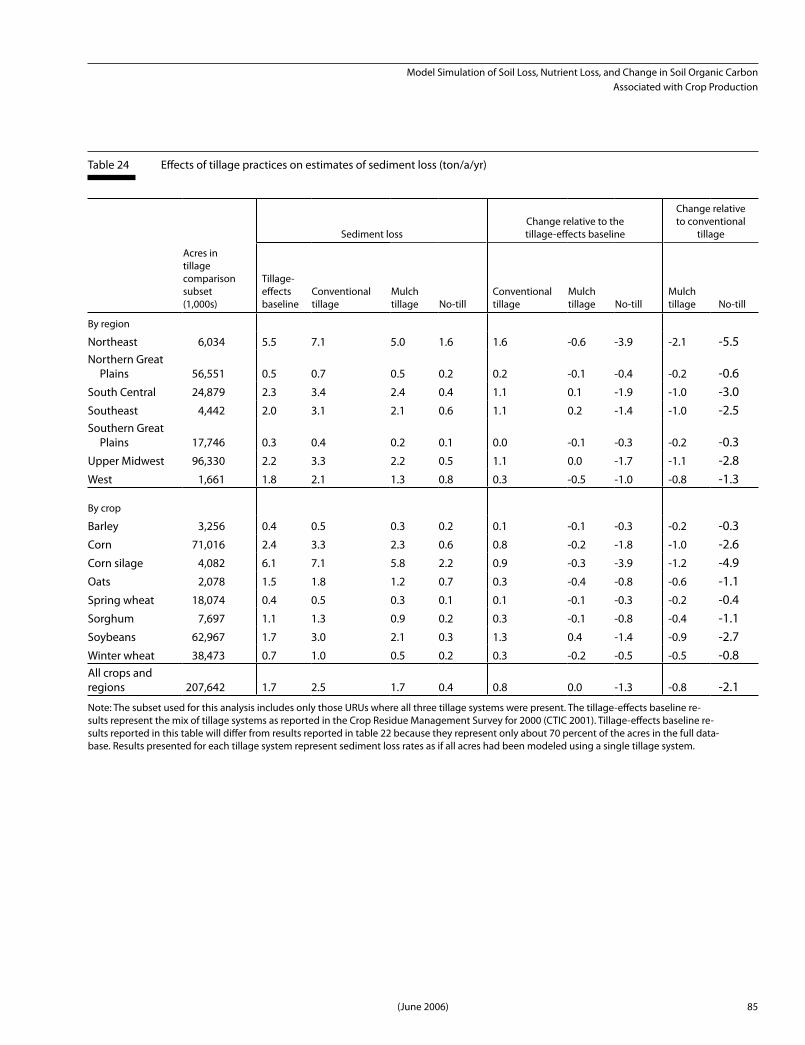
Effects of tillage practices on sediment loss Sediment loss estimates reported in this study ac-counted for conservation tillage currently practiced on cropland acres (table 11). As conservation tillage practices have a direct influence on sheet and rill ero-sion processes, the sediment loss estimates reported here would have been much higher had these tillage effects not been taken into account. To assess the ef-fects that conservation tillage had on sediment loss es-timates, the subset of model runs where all three till-age systems—conventional tillage, mulch tillage, and no-till—were present within a URU was defined to be the domain for examining the effects of tillage (table 12 and related discussion). This tillage comparison subset of model runs included eight crops and repre-sented about 70 percent of the cropland acres covered by the study.
For the 208 million acres in the tillage comparison sub-set, the tillage-effects baseline sediment loss averaged 1.7 tons per acre per year (table 24), slightly higher

83
Model Simulation of Soil Loss, Nutrient Loss, and Change in Soil Organic Carbon Associated with Crop Production
(June 2006)
Figure 10 Average per-acre sediment loss estimates (MUSLE)–by hydrologic soil group and soil texture group
A
0.0 0.5 1.0
ton/a/yr
Hyd
rolo
gic
soil
gro
up
1.5 2.0 3.0 2.5
B
C
D
Coarse
Moderately coarse
Medium
Moderately fine
Fine
Organic

Model Simulation of Soil Loss, Nutrient Loss, and Change in Soil Organic Carbon Associated with Crop Production
84 (June 2006)
1054
F
airh
aven
M
ediu
m
B10
55
Kos
suth
M
oder
atel
y fi
ne
B10
56
Alt
on
Mod
erat
ely
fine
C
1057
G
alva
M
oder
atel
y fi
ne
B10
58
Hoo
pest
on
Mod
erat
ely
coar
se
B10
59
Col
and
Mod
erat
ely
fine
B
1060
Ta
ma
Med
ium
B
1061
C
oppo
ck
Med
ium
B
1062
Sh
elby
M
oder
atel
y fi
ne
B10
63
Turl
in
Med
ium
B
1065
F
ayet
te
Med
ium
B
1067
N
odaw
ay
Med
ium
B
1068
G
ara
Med
ium
C
1069
Li
ndle
y
Med
ium
C
1070
C
olo
Mod
erat
ely
fine
B
1074
Id
a M
ediu
m
B10
78
Ada
ir
Mod
erat
ely
fine
C
1079
La
mon
t M
oder
atel
y co
arse
B
1084
D
icki
nson
M
oder
atel
y co
arse
B
1188
E
ly
Med
ium
B
S
oil
R
epre
sen
tati
ve
Tex
ture
H
ydro
logi
c cl
ust
er
soil
gr
ou
p
soil
gro
up
1189
La
goda
M
ediu
m
B11
90
Shar
psbu
rg
Mod
erat
ely
fine
B
1191
A
dair
M
ediu
m
C11
92
Ken
yon
Med
ium
B
1193
M
arsh
all
Mod
erat
ely
fine
B
1194
Sp
arta
C
oars
e A
1195
H
unts
ville
M
ediu
m
B11
96
Dow
ns
Med
ium
B
1197
V
illag
e
Med
ium
B
11
98
Line
ville
M
ediu
m
C12
00
Hum
esto
n M
ediu
m
C12
01
Lam
oni
Fin
e C
1202
W
abas
h M
oder
atel
y fi
ne
D12
03
Terr
il M
ediu
m
B12
04
Flo
yd
Med
ium
B
1207
M
onon
a M
ediu
m
B12
09
Rac
ine
Med
ium
B
1212
Sp
icer
M
oder
atel
y fi
ne
B12
14
Che
lsea
C
oars
e A
S
oil
R
epre
sen
tati
ve
Tex
ture
H
ydro
logi
c c
lust
er
soil
gr
ou
p
soil
gro
up
20.0
0
18.0
0
So
il c
lust
er I
D
Low
er I
owa
wat
ersh
ed16
.00
14.0
0
12.0
0
10.0
0
8.00
6.00
4.00
2.00
0.00
121412041202120112001198119711961195119411931191119011891188108410791078107010691068
10651067
10631062106110601059105810551054
ton/a/yr
Flo
yd w
ater
shed
1054
1055
1056
1057
1061
1062
1063
1067
1070
1074
1188
1192
1193
1195
1203
1207
1209
1212
ton/a/yr
So
il c
lust
er I
D
0.00
2.00
4.00
6.00
8.00
Figu
re 1
1 Va
riabi
lity
in s
edim
ent l
oss
estim
ates
(MU
SLE)
with
in tw
o IA
wat
ersh
eds
85
Model Simulation of Soil Loss, Nutrient Loss, and Change in Soil Organic Carbon Associated with Crop Production
(June 2006)
Table 24 Effects of tillage practices on estimates of sediment loss (ton/a/yr)
Sediment lossChange relative to thetillage-effects baseline
Change relative to conventional
tillage
Acres in tillage comparison subset(1,000s)
Tillage- effects baseline
Conventional tillage
Mulch tillage No-till
Conventional tillage
Mulch tillage No-till
Mulch tillage No-till
By region Northeast 6,034 5.5 7.1 5.0 1.6 1.6 -0.6 -3.9 -2.1 -5.5Northern Great Plains 56,551 0.5 0.7 0.5 0.2 0.2 -0.1 -0.4 -0.2 -0.6South Central 24,879 2.3 3.4 2.4 0.4 1.1 0.1 -1.9 -1.0 -3.0Southeast 4,442 2.0 3.1 2.1 0.6 1.1 0.2 -1.4 -1.0 -2.5Southern Great Plains 17,746 0.3 0.4 0.2 0.1 0.0 -0.1 -0.3 -0.2 -0.3Upper Midwest 96,330 2.2 3.3 2.2 0.5 1.1 0.0 -1.7 -1.1 -2.8West 1,661 1.8 2.1 1.3 0.8 0.3 -0.5 -1.0 -0.8 -1.3
By crop
Barley 3,256 0.4 0.5 0.3 0.2 0.1 -0.1 -0.3 -0.2 -0.3Corn 71,016 2.4 3.3 2.3 0.6 0.8 -0.2 -1.8 -1.0 -2.6Corn silage 4,082 6.1 7.1 5.8 2.2 0.9 -0.3 -3.9 -1.2 -4.9Oats 2,078 1.5 1.8 1.2 0.7 0.3 -0.4 -0.8 -0.6 -1.1Spring wheat 18,074 0.4 0.5 0.3 0.1 0.1 -0.1 -0.3 -0.2 -0.4Sorghum 7,697 1.1 1.3 0.9 0.2 0.3 -0.1 -0.8 -0.4 -1.1Soybeans 62,967 1.7 3.0 2.1 0.3 1.3 0.4 -1.4 -0.9 -2.7Winter wheat 38,473 0.7 1.0 0.5 0.2 0.3 -0.2 -0.5 -0.5 -0.8All crops and regions 207,642 1.7 2.5 1.7 0.4 0.8 0.0 -1.3 -0.8 -2.1Note: The subset used for this analysis includes only those URUs where all three tillage systems were present. The tillage-effects baseline re-sults represent the mix of tillage systems as reported in the Crop Residue Management Survey for 2000 (CTIC 2001). Tillage-effects baseline re-sults reported in this table will differ from results reported in table 22 because they represent only about 70 percent of the acres in the full data-base. Results presented for each tillage system represent sediment loss rates as if all acres had been modeled using a single tillage system.

Model Simulation of Soil Loss, Nutrient Loss, and Change in Soil Organic Carbon Associated with Crop Production
86 (June 2006)
than the 1.5 tons per acre per year estimate for the full set of NRI sample points included in the study. Table 12 shows the extent to which each of the three tillage systems are represented in the tillage-effects baseline. Model simulation results showed that sediment loss would have averaged nearly 2.5 tons per acre per year if conventional tillage had been used on all acres, in-dicating the tillage practices currently in use have re-duced sediment loss by about 32 percent. Sediment losses for mulch tillage were similar to the tillage-ef-fects baseline, suggesting that the mix of tillage sys-tems in current use is roughly equivalent to mulch till-age being used on all acres, on average. Simulation of full implementation of no-till resulted in average sedi-ment loss of less than 0.5 tons per acre annually, repre-senting a decrease of 76 percent compared to the till-age-effects baseline and a decrease of 83 percent when compared to conventional tillage use on all acres.
The effects of tillage on sediment loss varied by both region and crop (table 24), depending on the extent to which the various tillage systems are currently prac-ticed and differences among regions in soil charac-teristics, management activities, and climatic factors that affect sediment loss. In all comparisons, however, sediment loss estimates assuming mulch tillage on all acres were very close to sediment loss rate estimates for the tillage-effects baseline. These comparisons also indicate that full adoption of no-till on the eight crops would further reduce sediment loss by 1 to 4 tons per acre per year in all but the two Great Plains regions. The largest gains would occur in the Northeast region and for corn and corn silage acres in most regions. Model simulations further show that full adoption of no-till would result in less than 1 ton per acre per year of sediment loss in all regions except the Northeast and for all crops except corn silage.
Effects of three conservation practices on sediment lossIn addition to accounting for conservation tillage practices, sediment loss estimates accounted for the presence or absence of three conservation practices reported in the NRI database—contour farming, strip-cropping, and terraces (table 13 and related discus-sion). For comparison to the results for the model runs that included conservation practices, an additional set of model runs were conducted after adjusting model settings to represent no practices. The difference be-tween the no-practices scenario and the conservation-practices baseline scenario (consisting of the original
model runs for NRI sample points with conservation practices) is used here to assess the extent to which conservation practices reduced the sediment loss es-timates. These estimates of the effects of the three conservation practices are independent of the effects of tillage, as both scenarios retained the same tillage practices as used in development of the NNLSC data-base.
For the 31.7 million acres modeled with conservation practices, sediment loss estimates averaged 1.5 tons per acre per year (table 25), coincidently equal to the estimate for the full set of NRI sample points includ-ed in the study. Had conservation practices not been accounted for in the model simulations, sediment loss estimates on these acres would have averaged 3.3 tons per acre per year. These model simulations suggest, therefore, that the conservation practices reported by the NRI reduce sediment loss by about 54 percent, on average, for acres with one of more of the three prac-tices.
Overall, the largest reduction—4.1 tons per acre per year—occurred for contour farming in combination with stripcropping. These acres had the highest sedi-ment loss estimate for the no-practices scenario than any of the other categories—6.6 tons per acre per year. Contour farming alone reduced sediment loss esti-mates by 2.6 tons per acre per year for the acres in-cluded in the simulation, which had the second highest sediment loss rate for the no-practices scenario—5.5 tons per acre per year. The most prevalent practice set—contour farming and terraces—reduced sediment loss estimates from 2.8 tons per acre per year without practices to 1.0 ton per acre per year, on average. In terms of percent reductions relative to the no-practic-es scenario, contour farming in combination with one or more of the other two practices reduced sediment loss estimates by over 60 percent. Terraces only or stripcropping only was generally associated with acres that had lower sediment loss estimates without prac-tices (about 2 ton/a/yr on average), and thus, result-ed in sediment loss reductions of only about 1 ton per acre per year on average.
The effects of conservation practices varied consider-ably by region (table 25). The largest reductions oc-curred in regions with the highest sediment loss esti-mates—the Northeast and Upper Midwest regions. The percentage reductions were in the neighborhood of 50 percent for each of the regions on average, except

87
Model Simulation of Soil Loss, Nutrient Loss, and Change in Soil Organic Carbon Associated with Crop Production
(June 2006)
Tabl
e 25
Eff
ects
of t
hree
con
serv
atio
n pr
actic
es o
n es
timat
es o
f sed
imen
t los
s (t
on/a
/yr)
Sedi
men
t los
s
Regi
onCo
nser
vatio
n pr
actic
es
Num
ber o
fN
RI s
ampl
e po
ints
Acre
s (1
,000
s)
Cons
erva
tion-
prac
tices
bas
e-lin
e sc
enar
ioN
o-pr
actic
es
scen
ario
Diff
eren
ce
Perc
ent
diffe
renc
e re
lativ
e to
no-
prac
tices
sce
nario
All
regi
ons
Cont
our f
arm
ing
only
3,72
85,
965
3.0
5.5
-2.6
-46
Cont
our f
arm
ing
and
strip
crop
ping
1,18
31,
764
2.5
6.6
-4.1
-62
Cont
our f
arm
ing
and
terr
aces
7,88
314
,728
1.0
2.8
-1.8
-66
Cont
our f
arm
ing,
str
ipcr
oppi
ng, a
nd
terr
aces
3164
0.8
2.5
-1.7
-69
Strip
crop
ping
onl
y1,
308
2,93
01.
12.
0-0
.8-4
2Te
rrac
es o
nly
3,26
86,
285
1.2
1.9
-0.7
-37
All
prac
tices
17,4
0131
,737
1.5
3.3
-1.8
-54
Nor
thea
stCo
ntou
r far
min
g on
ly33
848
55.
08.
4-3
.4-4
0Co
ntou
r far
min
g an
d st
ripcr
oppi
ng45
459
53.
48.
2-4
.8-5
8St
ripcr
oppi
ng o
nly
423
526
4.0
7.2
-3.2
-45
All
prac
tices
1,21
51,
606
4.1
7.9
-3.9
-49
Sout
heas
tCo
ntou
r far
min
g on
ly27
545
62.
54.
5-2
.0-4
4Co
ntou
r far
min
g an
d te
rrac
es13
223
40.
93.
1-2
.2-7
1Te
rrac
es o
nly
5292
1.4
3.0
-1.5
-52
All
prac
tices
459
782
1.9
3.9
-2.0
-51
Sout
h Ce
ntra
lCo
ntou
r far
min
g on
ly11
017
23.
87.
7-3
.9-5
1Co
ntou
r far
min
g an
d te
rrac
es1,
173
1,96
31.
23.
5-2
.4-6
7Te
rrac
es o
nly
1,16
91,
974
1.8
2.9
-1.1
-37
All
prac
tices
2,45
24,
109
1.6
3.4
-1.8
-53
Upp
er M
idw
est
Cont
our f
arm
ing
only
2,62
54,
239
3.1
5.9
-2.8
-47
Cont
our f
arm
ing
and
strip
crop
ping
702
1,10
62.
15.
9-3
.8-6
5Co
ntou
r far
min
g an
d te
rrac
es3,
621
5,29
31.
95.
3-3
.5-6
5St
ripcr
oppi
ng o
nly
156
231
2.9
5.1
-2.2
-43
Terr
aces
onl
y63
798
52.
54.
0-1
.5-3
8A
ll pr
actic
es7,
741
11,8
532.
45.
5-3
.1-5
6

Model Simulation of Soil Loss, Nutrient Loss, and Change in Soil Organic Carbon Associated with Crop Production
88 (June 2006)
Sedi
men
t los
s
Regi
onCo
nser
vatio
n pr
actic
es
Num
ber o
fN
RI s
ampl
e po
ints
Acre
s (1
,000
s)
Cons
erva
tion-
prac
tices
bas
e-lin
e sc
enar
ioN
o-pr
actic
es
scen
ario
Diff
eren
ce
Perc
ent
diffe
renc
e re
lativ
e to
no-
prac
tices
sce
nario
Nor
ther
n G
reat
Pl
ains
Cont
our f
arm
ing
only
268
365
0.8
1.5
-0.7
-50
Cont
our f
arm
ing
and
terr
aces
1,37
03,
553
0.3
0.6
-0.4
-58
Strip
crop
ping
onl
y60
21,
945
0.2
0.2
0.0
-18
Terr
aces
onl
y21
349
50.
60.
8-0
.3-3
2A
ll pr
actic
es2,
453
6,35
70.
30.
6-0
.3-4
9
Sout
hern
Gre
at
Plai
nsCo
ntou
r far
min
g on
ly10
423
50.
30.
6-0
.3-5
3
Cont
our f
arm
ing
and
terr
aces
1,58
53,
681
0.2
0.8
-0.5
-70
Strip
crop
ping
onl
y80
149
0.1
0.1
0.0
-27
Terr
aces
onl
y1,
122
2,67
70.
40.
7-0
.2-3
5A
ll pr
actic
es2,
891
6,74
30.
30.
7-0
.4-5
6
Wes
tTe
rrac
es o
nly
7258
0.6
0.8
-0.2
-24
Not
e: R
esul
ts fo
r con
serv
atio
n pr
actic
es a
nd c
ombi
natio
ns o
f pra
ctic
es b
ased
on
less
than
20
NRI
sam
ple
poin
ts a
re n
ot s
how
n in
the
regi
onal
bre
akdo
wns
, but
thes
e da
ta a
re
incl
uded
in th
e ag
greg
ated
resu
lts fo
r all
regi
ons.
Tabl
e 25
Eff
ects
of t
hree
con
serv
atio
n pr
actic
es o
n es
timat
es o
f sed
imen
t los
s (t
on/a
/yr)
—Co
ntin
ued
89
Model Simulation of Soil Loss, Nutrient Loss, and Change in Soil Organic Carbon Associated with Crop Production
(June 2006)
for the West where the percentage reduction averaged 24 percent. Conservation practices in the West region, however, were represented by only 72 NRI sample points, all with terraces only, and may not be represen-tative of conservation effects in this region because of the partial coverage of cropland acres in the study.
Assessment of critical acres for sediment loss
Acres with the highest estimates of sediment loss are identified here as critical acres. Since not all conser-vation practices were taken into account in the mod-el simulations, these sediment loss estimates actually represent the potential for sediment loss. To the extent that buffers, field borders, and cover crops, for exam-ple, are present, the estimates of sediment loss report-ed here would be overstated and possibly some critical acres misidentified.
Some regions of the country have been shown in this study to have a much higher potential for sediment loss than other areas of the country. Moreover, as shown in map 9 and in the example for the two Iowa watersheds, sediment loss estimates often varied con-siderably within relatively small geographic areas. Estimates of the average sediment loss by region and by crops within regions mask much of this underlying variability. Table 26 demonstrates the extent of both regional and local variability by presenting the percen-tiles of sediment loss estimates for each region. The fifth and tenth percentiles (representing the per-acre sediment loss threshold below which 5 percent and 10 percent of the acres, respectively, would have low-er sediment loss estimates) are all below 0.2 tons per acre per year. Similarly, results for the 25th percen-tile show that in every region 25 percent of the acres had sediment loss estimates less than 1 ton per acre per year. The median, or 50th percentile, is close to or below 1 ton per acre per year for all but the South Central region. Thus, even in the Northeast and the South Central regions, which had the highest average sediment loss estimates, there are a substantial num-ber of acres with very low potential for sediment loss. As shown by the median sediment loss estimate for all regions, half of the cropland acres included in the study had sediment loss estimates less than 0.6 tons per acre per year.
The bulk of the distribution of sediment loss estimates is below the mean value in all regions, as indicated by mean values that exceed median values. The most extreme example of this is for the Northeast region, where the mean sediment loss estimate of 3.2 tons per acre per year is over three times greater than the me-dian estimate of 0.85 tons per acre per year (table 26). For some regions, the mean value equals or approach-es the 75th percentile. This condition of dispropor-tionality exists because of a minority of sample points with very high sediment loss estimates. These sample points are defined here as critical acres, which, if ade-quately treated with conservation practices, are likely to have the greatest effect on offsite impacts associat-ed with sediment loss from farm fields.
Five categories of critical acres, representing different degrees of severity, are defined on the basis of nation-al level results:
• acres where per-acre sediment loss is above the 95th percentile (5.963 ton/a/yr) for all acres in-cluded in the study
• acres where per-acre sediment loss is above the 90th percentile (3.915 ton/a/yr) for all acres in-cluded in the study
• acres where per-acre sediment loss is above the 85th percentile (2.900 ton/a/yr) for all acres in-cluded in the study
• acres where per-acre sediment loss is above the 80th percentile (2.315 ton/a/yr) for all acres in-cluded in the study
• acres where per-acre sediment loss is above the 75th percentile (1.847 ton/a/yr) for all acres in-cluded in the study
The regional representation of critical acres is shown in table 27 for each of the five categories. Over 90 percent of the acres with per-acre sediment loss es-timates in the top 5 percent were in three regions—the Upper Midwest region (46% of critical acres), the South Central region (30% of critical acres), and the Northeast region (18% of critical acres.). As the crite-rion for critical acres expanded from the top 5 percent to the top 25 percent, the representation of critical acres in other regions expanded somewhat, while the share of critical acres in the Northeast region fell to 7 percent. In the South Central region, half of the crop-land acres were designated as critical acres in the top

Model Simulation of Soil Loss, Nutrient Loss, and Change in Soil Organic Carbon Associated with Crop Production
90 (June 2006)
Tabl
e 26
Pe
rcen
tiles
of s
edim
ent l
oss
estim
ates
(ton
/a/y
r)
Regi
onAc
res
Num
ber o
f N
RI s
ampl
e po
ints
Mea
n 5t
hpe
rcen
tile
10th
pe
rcen
tile
25th
pe
rcen
tile
50th
pe
rcen
tile
75th
pe
rcen
tile
90th
pe
rcen
tile
95th
pe
rcen
tile
Nor
thea
st13
,641
,900
11,2
823.
186
0.00
00.
000
0.00
10.
850
4.34
59.
731
13.5
15N
orth
ern
Gre
at P
lain
s72
,396
,500
36,0
350.
465
<.00
10.
016
0.07
90.
230
0.47
20.
982
1.86
4So
uth
Cent
ral
45,3
49,9
0027
,465
2.76
90.
002
0.15
60.
900
1.84
93.
378
5.94
18.
725
Sout
heas
t13
,394
,400
8,95
51.
607
<.00
10.
002
0.08
80.
604
1.73
03.
794
6.93
0So
uthe
rn G
reat
Pla
ins
32,0
96,0
0014
,495
0.35
80.
007
0.01
70.
069
0.19
30.
422
0.83
51.
387
Upp
er M
idw
est
112,
580,
900
74,6
911.
945
0.00
00.
019
0.48
11.
117
2.46
44.
634
6.79
2W
est
9,01
8,40
05,
644
0.54
80.
000
0.00
00.
016
0.10
30.
359
1.51
12.
044
All
regi
ons
298,
478,
000
178,
567
1.54
0<.
001
0.00
70.
146
0.60
81.
847
3.91
55.
963
Not
e: P
erce
ntile
s ar
e in
term
s of
acr
es. T
he 5
th p
erce
ntile
, for
exa
mpl
e, is
the
thre
shol
d be
low
whi
ch 5
per
cent
of t
he a
cres
hav
e lo
wer
sed
imen
t los
s es
timat
es.
Tabl
e 27
Cr
itica
l acr
es fo
r sed
imen
t los
s
Per-
acre
loss
in to
p5
perc
ent n
atio
nally
Per-
acre
loss
in to
p10
per
cent
nat
iona
llyPe
r-ac
re lo
ss in
top
15 p
erce
nt n
atio
nally
Per-
acre
loss
in to
p20
per
cent
nat
iona
llyPe
r-ac
re lo
ss in
top
25 p
erce
nt n
atio
nally
Regi
onAc
res
Acre
sPe
rcen
tAc
res
Perc
ent
Acre
sPe
rcen
tAc
res
Perc
ent
Acre
sPe
rcen
t
Nor
thea
st13
,641
,900
2,60
4,90
017
.53,
749,
100
12.6
4,38
2,60
09.
84,
890,
400
8.2
5,46
5,70
07.
3N
orth
ern
Gre
at P
lain
s72
,396
,500
105,
600
0.7
693,
900
2.3
2,15
2,00
04.
82,
982,
600
5.0
3,68
6,80
04.
9So
uth
Cent
ral
45,3
49,9
004,
472,
100
30.0
9,26
2,40
031
.013
,849
,600
30.9
18,4
77,9
0031
.022
,677
,100
30.4
Sout
heas
t13
,394
,400
803,
800
5.4
1,28
1,90
04.
32,
147,
100
4.8
2,73
9,20
04.
63,
195,
400
4.3
Sout
hern
Gre
at P
lain
s32
,096
,000
11,1
000.
154
,700
0.2
267,
500
0.6
410,
600
0.7
621,
100
0.8
Upp
er M
idw
est
112,
580,
900
6,84
4,10
045
.914
,624
,100
49.0
21,6
81,6
0048
.429
,765
,200
50.0
38,1
74,7
0051
.2W
est
9,01
8,40
065
,900
0.4
181,
700
0.6
283,
000
0.6
322,
500
0.5
798,
500
1.1
All
regi
ons
298,
478,
000
14,9
07,5
0010
0.0
29,8
47,8
0010
0.0
44,7
63,4
0010
0.0
59,5
88,4
0010
0.0
74,6
19,3
0010
0.0
Not
e: T
he to
p 5
perc
ent c
orre
spon
ds to
the
95th
per
cent
ile in
tabl
e 26
. Oth
er c
olum
ns c
orre
spon
d to
tabl
e 26
in a
sim
ilar m
anne
r.

91
Model Simulation of Soil Loss, Nutrient Loss, and Change in Soil Organic Carbon Associated with Crop Production
(June 2006)
25 percent for sediment loss. In the Northeast region, 40 percent of the cropland acres were designated as critical acres in the top 25 percent for sediment loss.
These critical acres accounted for the bulk of the 459,622 thousand tons per year of sediment loss. The 95th percentile category, representing the 5 percent of acres with the highest per-acre losses, accounted for 34 percent of the total tons of sediment loss. The 25 percent of acres with the highest per-acre losses ac-counted for 76 percent of the total tons of sediment loss.
PercentilePercent of total tons of sediment loss
95th 34.090th 49.685th 60.580th 68.975th 75.7
Wind erosion
Modeling wind erosion
Wind erosion occurs when the soil is unprotected and wind velocity exceeds about 13 miles per hour near the ground surface. The particles are lifted into the air and are either suspended and carried away by the wind or fall back to the surface and dislodge other soil particles. This process destroys the surface crust, cre-ating a condition even more vulnerable to erosion. Soil grains too large to be lifted off the surface move along the surface and are deposited in areas protected from the wind. Wind strength, tillage, vegetative cover, and the texture and structure of the soil are primary de-terminants of wind erosion. Plant cover and crop resi-due greatly reduce the potential for wind erosion. The shape, size, and arrangement of aggregates are also important in wind erosion; strong bonds and large ag-gregates provide more resistance to erosive forces. Organic matter enhances soil structure, increases wa-ter infiltration, and thereby reduces the potential for wind erosion.
Wind erosion is estimated in EPIC using the Wind Erosion Continuous Simulation (WECS) model, which incorporates the daily distribution of wind speeds as the force driving erosion (Williams 1995). In essence, the equation estimates potential wind erosion for a smooth bare soil as a function of wind speed, soil par-ticle size, and the ratio of soil water to water holding capacity in the top 10 millimeters (0.4 in) of the soil. Potential erosion is then adjusted downward to ac-count for inherent soil properties, field characteristics, and management practices using four factors:
• soil erodibility
• surface roughness
• vegetative cover
• unprotected distance across the field in the wind direction
Model simulation results for wind erosion
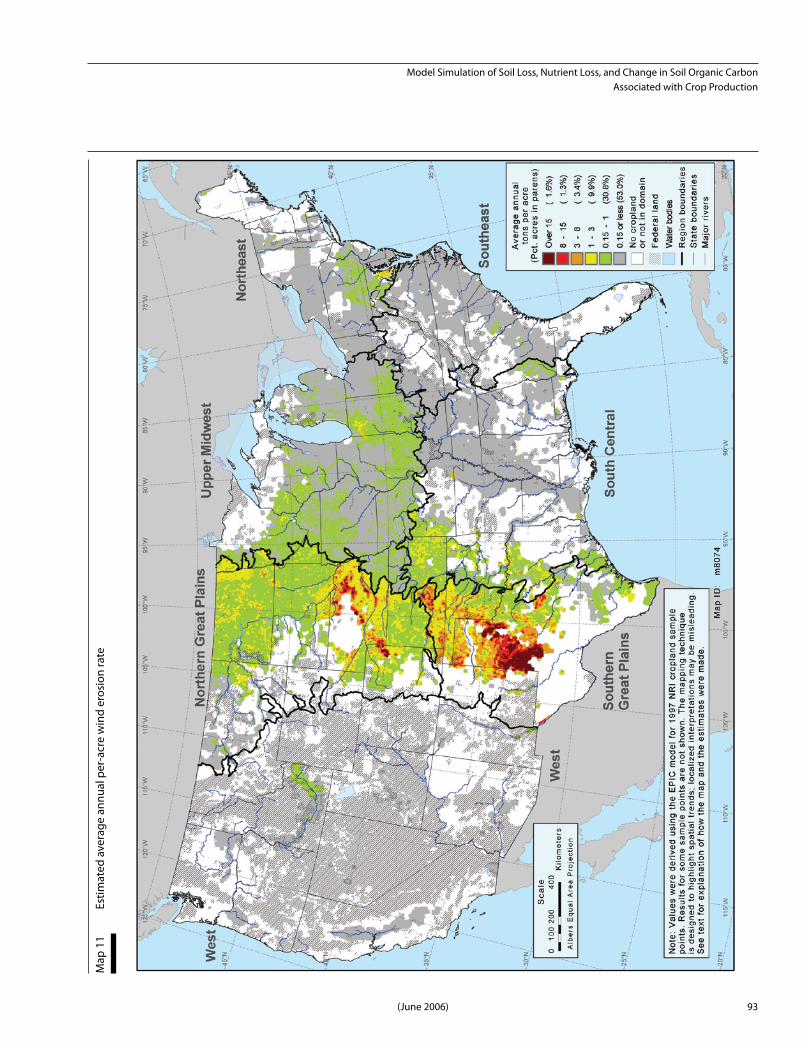
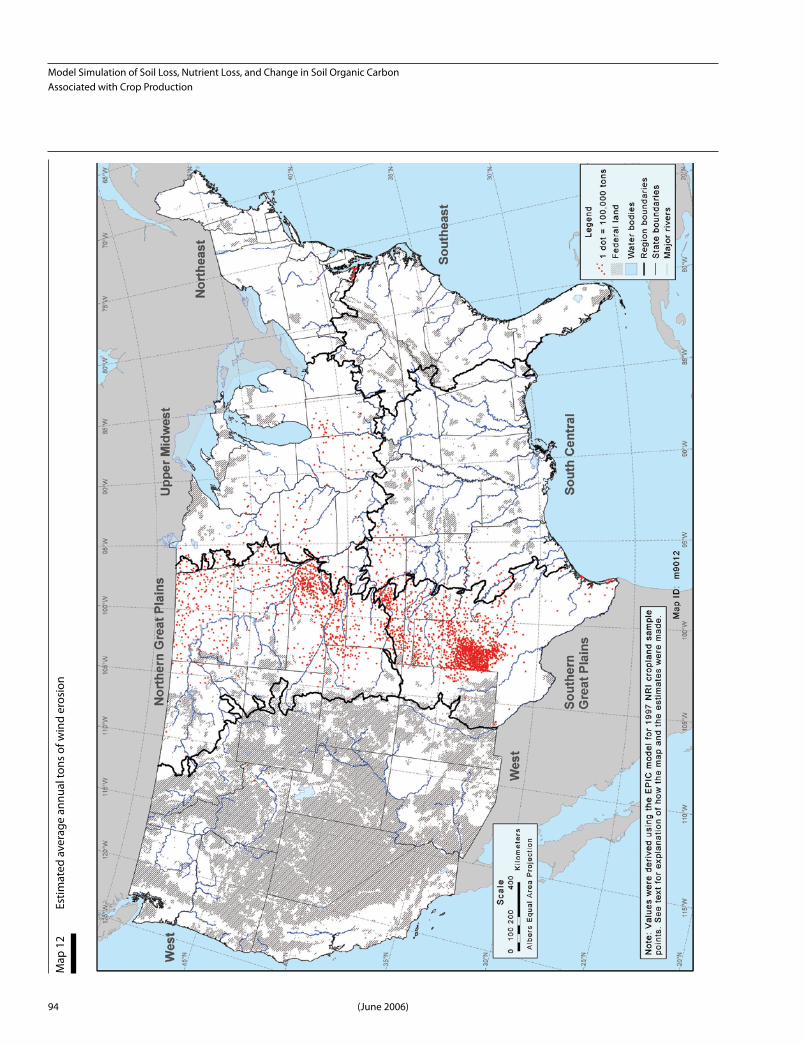
Wind erosion, both on a per-acre basis and as to-tal tons, was largely restricted to two regions—the Northern Great Plains and Southern Great Plains

Model Simulation of Soil Loss, Nutrient Loss, and Change in Soil Organic Carbon Associated with Crop Production
92 (June 2006)
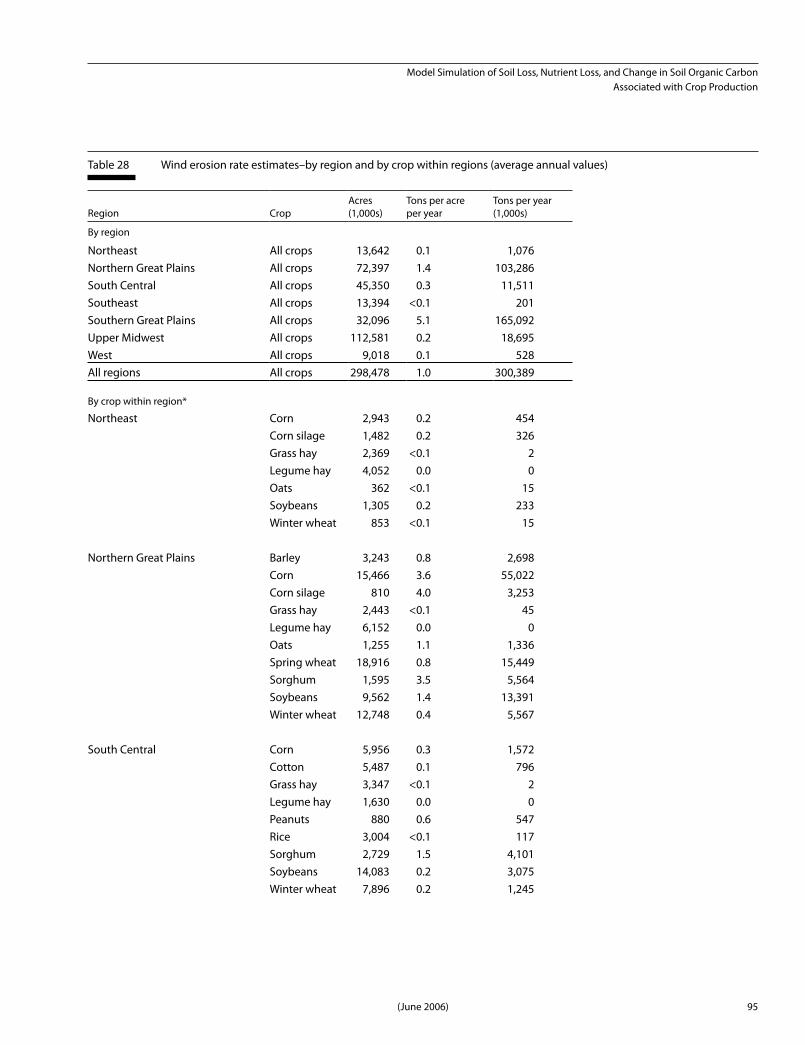
(maps 11 and 12). These two regions accounted for 89 percent of the total tons of wind erosion estimated for cropland acres included in this study (table 28). Low wind erosion rates—usually less than 1 ton per crop-land acre per year—occurred in the Upper Midwest and South Central regions, accounting for about 10 percent of the total. The Northeast, Southeast, and West regions accounted for less than 1 percent of the total wind erosion.
The most vulnerable cropland acres for wind ero-sion—shown in dark red and red in map 11—oc-cur mostly in northwestern Texas, central Kansas, Northeast Colorado, and parts of Nebraska, represent-ing about 3 percent of cropland acres included in the study. Model estimates of wind erosion rates for these acres averaged over 8 tons per acre per year. Another 3 percent of cropland acres had average wind erosion rates ranging between 3 and 8 tons per acre per year and are found in the same areas as the most vulnera-ble acres. About 10 percent of the cropland acres had average wind erosion rates between 1 and 3 tons per acre per year; the preponderance of these acres is also found in the Great Plains states.
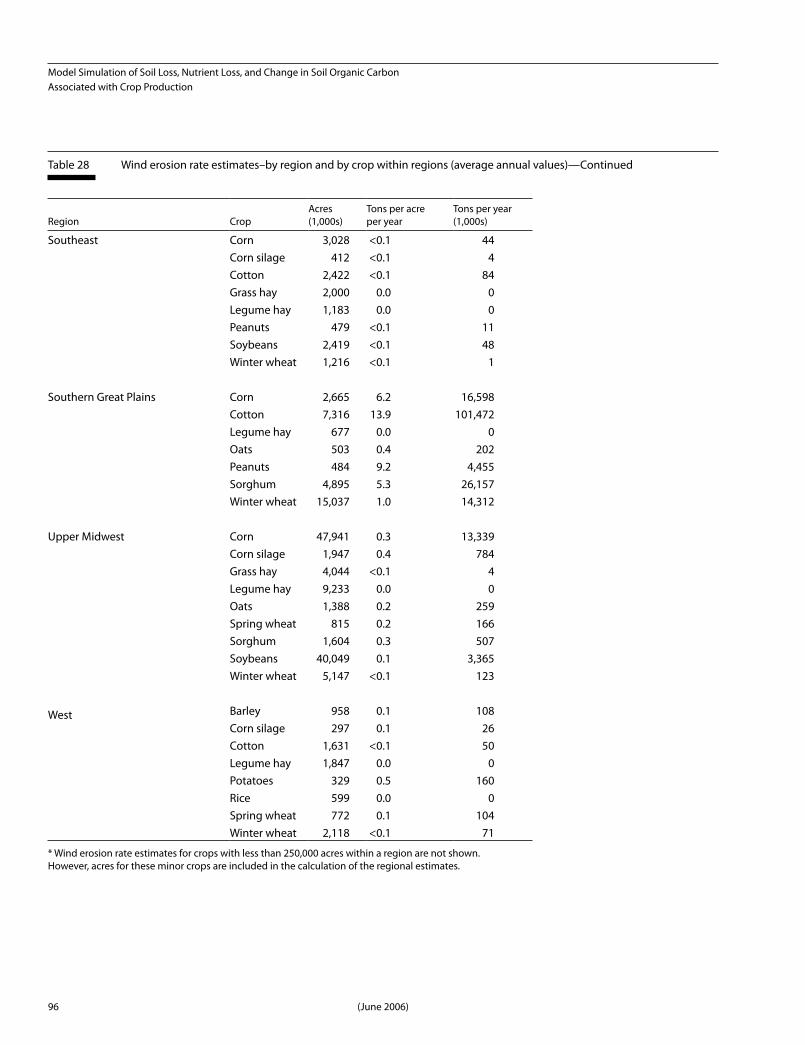
Summary of wind erosion results by region and cropWind erosion rates in the Southern Great Plains aver-aged over 5 tons per acre per year and accounted for 55 percent (165 million tons per year) of the total wind erosion (table 28). The majority of this wind erosion was on cotton acres (101 million ton/yr), where the av-erage annual wind erosion rate was 14 tons per acre per year. Wind erosion rates in this region were also high for peanuts (9.2 ton/a/yr), corn (6.2 ton/a/yr) and sorghum (5.3 ton/a/yr).
Wind erosion rates in the Northern Great Plains were much lower, averaging 1.4 tons per acre per year for cropland acres. Corn accounted for over half of the to-tal wind erosion in this region, averaging 3.6 tons per acre per year. Wind erosion rates in this region were also high for corn silage (4.0 ton/a/yr) and sorghum (3.5 ton/a/yr).
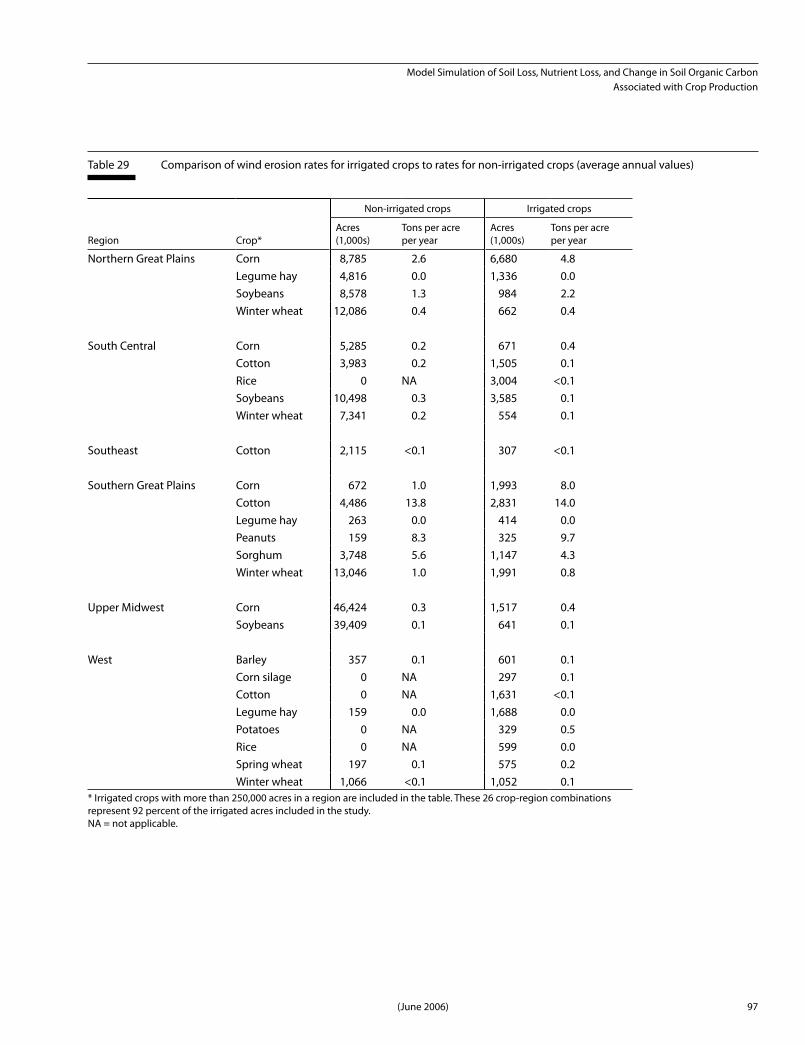
Wind erosion rates on irrigated crops were close to the rates for non-irrigated crops for most crops in most re-gions (table 29). Irrigated corn acres in the Southern Great Plains region, however, had much higher wind erosion rates than non-irrigated corn acres in that re-gion, averaging 8 tons per acre per year for irrigated
corn acres and 1 ton per acre per year for non-irrigat-ed corn acres. Corn in the Northern Great Plains re-gion similarly had higher wind erosion rates for irri-gated acres than for non-irrigated acres, differing by about 2.2 tons per acre per year. These higher rates for irrigated corn represent acreage in the more arid areas within each region where corn usually cannot be pro-duced without irrigation.
Effects of soil properties on wind erosion Model simulation results showed that soil texture and hydrologic soil group had a pronounced effect on wind erosion estimates (fig. 12). On average, coarse textured soils had much higher wind erosion rates than other soil texture groups, followed by moderate-ly coarse textured soils. The highest wind erosion rate was for coarse textured soils in the hydrologic soil group A—about 7 tons per acre per year. Coarse and moderately coarse textured soils represent about 30 percent of the cropland acres in the Southern Great Plains, partly explaining the high erosion rates ob-tained for that region. A higher proportion of coarse and moderately coarse soils occur in the Southeast re-gion, but climatic factors are not conducive to wind erosion in the Southeast.
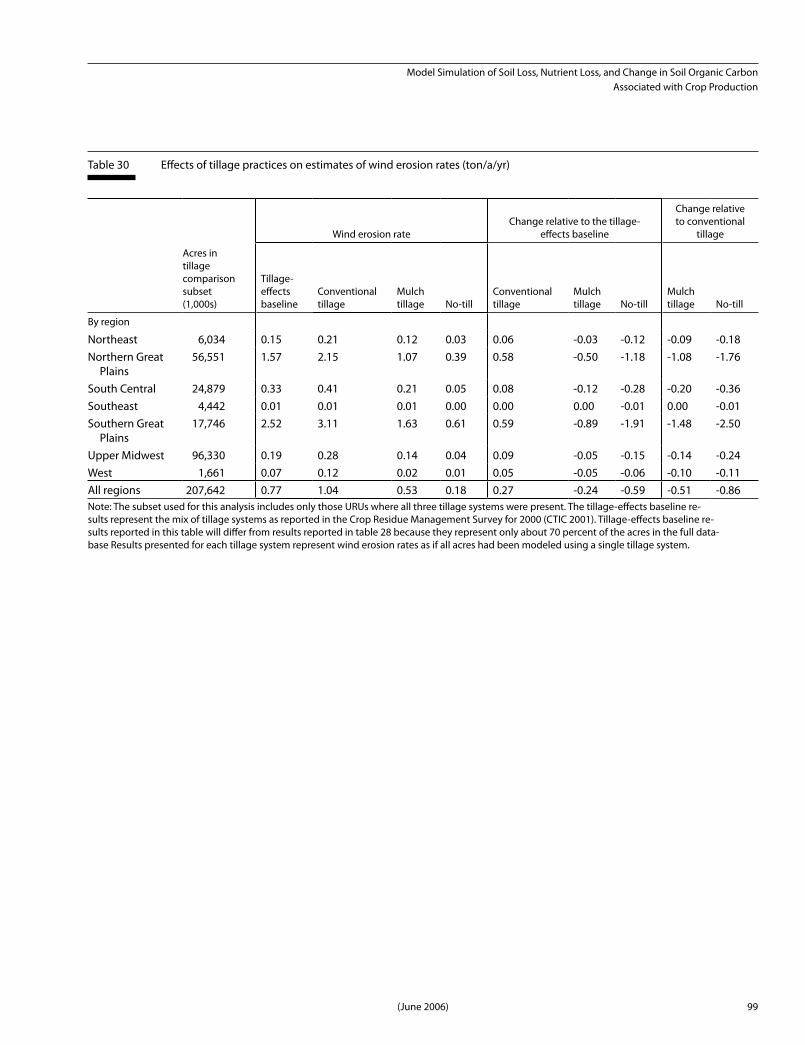
Effects of tillage practices on wind erosion These estimates of wind erosion rates include the mitigating effect of conservation tillage practices. Although the effects of tillage on wind erosion rates are significant, they are more modest than observed for sediment loss when aggregated at the regional lev-el. To assess the effects that conservation tillage had on wind erosion estimates, the subset of model runs where all three tillage systems—conventional tillage, mulch tillage, and no-till—were present within a URU was defined to be the domain for examining the effects of tillage (table 12 and related discussion). This till-age comparison subset of model runs included eight crops—barley, corn, corn silage, oats, spring wheat, sorghum, soybeans, and winter wheat—and represent-ed about 70 percent of the cropland acres covered by the study. Results on the effects of tillage on wind ero-sion estimates are shown in table 30.
For the 208 million acres in the tillage comparison sub-set, the tillage-effects baseline wind erosion rate av-eraged 0.8 tons per acre per year, slightly lower than the 1.0 tons per acre per year estimate for the full set of NRI sample points included in the study. On aver-age, accounting for tillage effects reduced wind ero-
93
Model Simulation of Soil Loss, Nutrient Loss, and Change in Soil Organic Carbon Associated with Crop Production
(June 2006)
Map
11
Estim
ated
ave
rage
ann
ual p
er-a
cre
win
d er
osio
n ra
te
Model Simulation of Soil Loss, Nutrient Loss, and Change in Soil Organic Carbon Associated with Crop Production
94 (June 2006)
Map
12
Estim
ated
ave
rage
ann
ual t
ons
of w
ind
eros
ion
95
Model Simulation of Soil Loss, Nutrient Loss, and Change in Soil Organic Carbon Associated with Crop Production
(June 2006)
Table 28 Wind erosion rate estimates–by region and by crop within regions (average annual values)
Region CropAcres(1,000s)
Tons per acreper year
Tons per year (1,000s)
By region
Northeast All crops 13,642 0.1 1,076Northern Great Plains All crops 72,397 1.4 103,286South Central All crops 45,350 0.3 11,511Southeast All crops 13,394 <0.1 201Southern Great Plains All crops 32,096 5.1 165,092Upper Midwest All crops 112,581 0.2 18,695West All crops 9,018 0.1 528All regions All crops 298,478 1.0 300,389
By crop within region*
Northeast Corn 2,943 0.2 454Corn silage 1,482 0.2 326Grass hay 2,369 <0.1 2Legume hay 4,052 0.0 0Oats 362 <0.1 15Soybeans 1,305 0.2 233Winter wheat 853 <0.1 15
Northern Great Plains Barley 3,243 0.8 2,698Corn 15,466 3.6 55,022Corn silage 810 4.0 3,253Grass hay 2,443 <0.1 45Legume hay 6,152 0.0 0Oats 1,255 1.1 1,336Spring wheat 18,916 0.8 15,449Sorghum 1,595 3.5 5,564Soybeans 9,562 1.4 13,391Winter wheat 12,748 0.4 5,567
South Central Corn 5,956 0.3 1,572Cotton 5,487 0.1 796Grass hay 3,347 <0.1 2Legume hay 1,630 0.0 0Peanuts 880 0.6 547Rice 3,004 <0.1 117Sorghum 2,729 1.5 4,101Soybeans 14,083 0.2 3,075Winter wheat 7,896 0.2 1,245
Model Simulation of Soil Loss, Nutrient Loss, and Change in Soil Organic Carbon Associated with Crop Production
96 (June 2006)
Region CropAcres(1,000s)
Tons per acreper year
Tons per year (1,000s)
Southeast Corn 3,028 <0.1 44Corn silage 412 <0.1 4Cotton 2,422 <0.1 84Grass hay 2,000 0.0 0Legume hay 1,183 0.0 0Peanuts 479 <0.1 11Soybeans 2,419 <0.1 48Winter wheat 1,216 <0.1 1
Southern Great Plains Corn 2,665 6.2 16,598Cotton 7,316 13.9 101,472Legume hay 677 0.0 0Oats 503 0.4 202Peanuts 484 9.2 4,455Sorghum 4,895 5.3 26,157Winter wheat 15,037 1.0 14,312
Upper Midwest Corn 47,941 0.3 13,339Corn silage 1,947 0.4 784Grass hay 4,044 <0.1 4Legume hay 9,233 0.0 0Oats 1,388 0.2 259Spring wheat 815 0.2 166Sorghum 1,604 0.3 507Soybeans 40,049 0.1 3,365Winter wheat 5,147 <0.1 123
West Barley 958 0.1 108Corn silage 297 0.1 26Cotton 1,631 <0.1 50Legume hay 1,847 0.0 0Potatoes 329 0.5 160Rice 599 0.0 0Spring wheat 772 0.1 104Winter wheat 2,118 <0.1 71
* Wind erosion rate estimates for crops with less than 250,000 acres within a region are not shown. However, acres for these minor crops are included in the calculation of the regional estimates.
Table 28 Wind erosion rate estimates–by region and by crop within regions (average annual values)—Continued
97
Model Simulation of Soil Loss, Nutrient Loss, and Change in Soil Organic Carbon Associated with Crop Production
(June 2006)
Table 29 Comparison of wind erosion rates for irrigated crops to rates for non-irrigated crops (average annual values)
Non-irrigated crops Irrigated crops
Region Crop*Acres(1,000s)
Tons per acre per year
Acres(1,000s)
Tons per acre per year
Northern Great Plains Corn 8,785 2.6 6,680 4.8Legume hay 4,816 0.0 1,336 0.0Soybeans 8,578 1.3 984 2.2Winter wheat 12,086 0.4 662 0.4
South Central Corn 5,285 0.2 671 0.4Cotton 3,983 0.2 1,505 0.1Rice 0 NA 3,004 <0.1Soybeans 10,498 0.3 3,585 0.1Winter wheat 7,341 0.2 554 0.1
Southeast Cotton 2,115 <0.1 307 <0.1
Southern Great Plains Corn 672 1.0 1,993 8.0Cotton 4,486 13.8 2,831 14.0Legume hay 263 0.0 414 0.0Peanuts 159 8.3 325 9.7Sorghum 3,748 5.6 1,147 4.3Winter wheat 13,046 1.0 1,991 0.8
Upper Midwest Corn 46,424 0.3 1,517 0.4Soybeans 39,409 0.1 641 0.1
West Barley 357 0.1 601 0.1Corn silage 0 NA 297 0.1Cotton 0 NA 1,631 <0.1Legume hay 159 0.0 1,688 0.0Potatoes 0 NA 329 0.5Rice 0 NA 599 0.0Spring wheat 197 0.1 575 0.2Winter wheat 1,066 <0.1 1,052 0.1
* Irrigated crops with more than 250,000 acres in a region are included in the table. These 26 crop-region combinations represent 92 percent of the irrigated acres included in the study.NA = not applicable.

Model Simulation of Soil Loss, Nutrient Loss, and Change in Soil Organic Carbon Associated with Crop Production
98 (June 2006)
Figure 12 Average per-acre wind erosion rates–by hydrologic soil group and soil texture group
A
0.0 1.0 2.0
ton/a/yr
Hyd
rolo
gic
soil
gro
up
3.0 4.0 8.0 7.0 6.0 5.0
B
C
D
Coarse
Moderately coarse
Medium
Moderately fine
Fine
Organic
99
Model Simulation of Soil Loss, Nutrient Loss, and Change in Soil Organic Carbon Associated with Crop Production
(June 2006)
Table 30 Effects of tillage practices on estimates of wind erosion rates (ton/a/yr)
Wind erosion rateChange relative to the tillage-
effects baseline
Change relative to conventional
tillage
Acres in tillage comparison subset(1,000s)
Tillage- effects baseline
Conventional tillage
Mulch tillage No-till
Conventional tillage
Mulch tillage No-till
Mulch tillage No-till
By region Northeast 6,034 0.15 0.21 0.12 0.03 0.06 -0.03 -0.12 -0.09 -0.18Northern Great Plains
56,551 1.57 2.15 1.07 0.39 0.58 -0.50 -1.18 -1.08 -1.76
South Central 24,879 0.33 0.41 0.21 0.05 0.08 -0.12 -0.28 -0.20 -0.36Southeast 4,442 0.01 0.01 0.01 0.00 0.00 0.00 -0.01 0.00 -0.01Southern Great Plains
17,746 2.52 3.11 1.63 0.61 0.59 -0.89 -1.91 -1.48 -2.50
Upper Midwest 96,330 0.19 0.28 0.14 0.04 0.09 -0.05 -0.15 -0.14 -0.24West 1,661 0.07 0.12 0.02 0.01 0.05 -0.05 -0.06 -0.10 -0.11All regions 207,642 0.77 1.04 0.53 0.18 0.27 -0.24 -0.59 -0.51 -0.86Note: The subset used for this analysis includes only those URUs where all three tillage systems were present. The tillage-effects baseline re-sults represent the mix of tillage systems as reported in the Crop Residue Management Survey for 2000 (CTIC 2001). Tillage-effects baseline re-sults reported in this table will differ from results reported in table 28 because they represent only about 70 percent of the acres in the full data-base Results presented for each tillage system represent wind erosion rates as if all acres had been modeled using a single tillage system.
Model Simulation of Soil Loss, Nutrient Loss, and Change in Soil Organic Carbon Associated with Crop Production
100 (June 2006)
sion rates overall by about 0.3 tons per acre per year compared to conventional tillage use on all acres, rep-resenting a reduction of 26 percent. The mitigating ef-fect of tillage on wind erosion estimates occurred in all regions, although differences were small in regions with low wind erosion rates (table 30). In the Northern Great Plains and Southern Great Plains regions, where wind erosion rates are highest, accounting for tillage reduced wind erosion rates by about 0.6 tons per acre per year, on average, compared to conventional tillage use on all acres. This indicates that, had these tillage practices not been adopted, wind erosion rates would have been about 37 percent higher in the Northern Great Plains and 23 percent higher in the Southern Great Plains. Full adoption of mulch tillage in these two regions would further reduce wind erosion by 0.5 to 0.9 tons per acre per year. These model simulations further show that full adoption of no-till would reduce wind erosion rates by 1 to 2 tons per acre per year in the two Great Plains regions, on average, and bring the wind erosion rate to well below 1 ton per acre per year in all regions. These estimates of the effects of tillage may be understated in the Southern Great Plains re-gion because the two crops with the highest wind ero-sion rates—cotton and peanuts—were not included in the analysis.
Assessment of critical acres for wind ero-sion
Acres with the highest wind erosion rates are identi-fied here as critical acres. Erosion rate estimates re-ported in this study actually represent the potential for wind erosion as a source of soil loss from farm fields. Tillage practices were included in the assessment, but other conservation practices that are often used to help control wind erosion were not taken into ac-count, such as windbreaks, buffers, field borders, cov-er crops, and stripcropping. Stripcropping was taken into account for sediment loss estimates by adjusting the P-factor, but this has no effect on wind erosion es-timates in EPIC. To the extent that these practices are present, the potential for high wind erosion rates re-ported here would be overstated and possibly some critical acres misidentified.
Two regions of the country have been shown to have high wind erosion rates—the Southern Great Plains and Northern Great Plains regions. Even in those re-gions, however, high wind erosion rates were limit-
ed to a minority of the acres present. Table 31 demon-strates the extent of both regional and local variability by presenting the percentiles of wind erosion esti-mates for each region. Three-fourths of the cropland acres included in the study had wind erosion rates less than 0.6 tons per acre per year. For each region, the 75th percentile was nearly the same as the regional av-erage wind erosion rate. Thus, there is a high degree of disproportionality in the wind erosion results, even in the Southern Great Plains and Northern Great Plains regions. A relatively small minority of sample points with very high wind erosion rates dominate the sam-ple. These sample points are defined here as critical acres for wind erosion.
Five categories of critical acres, representing different degrees of severity, are defined on the basis of nation-al level results:
• acres where per-acre wind erosion rates are above the 98th percentile (11.788 ton/a/yr) for all acres included in the study
• acres where per-acre wind erosion rates are above the 96th percentile (5.155 ton/a/yr) for all acres included in the study
• acres where per-acre wind erosion rates are above the 94th percentile (3.267 ton/a/yr) for all acres included in the study
• acres where per-acre wind erosion rates are above the 92nd percentile (2.489 ton/a/yr) for all acres included in the study
• acres where per-acre wind erosion rates are above the 90th percentile (1.983 ton/a/yr) for all acres included in the study
Higher thresholds are used to identify critical acres as-sociated with wind erosion than are used to identify thresholds for critical acres associated with sediment loss and nutrient loss because the high wind erosion rates are limited to a much smaller subset of the crop-land acres. Instead of the 95th percentile used for sedi-ment loss, the 98th percentile is used for wind erosion, for example.
The regional representation of critical acres for wind erosion is shown in table 32 for each of the five cate-gories. Most (86%) of the acres with per-acre wind ero-sion rates in the top 2 percent were in the Southern Great Plains, with the remainder in the Northern Great
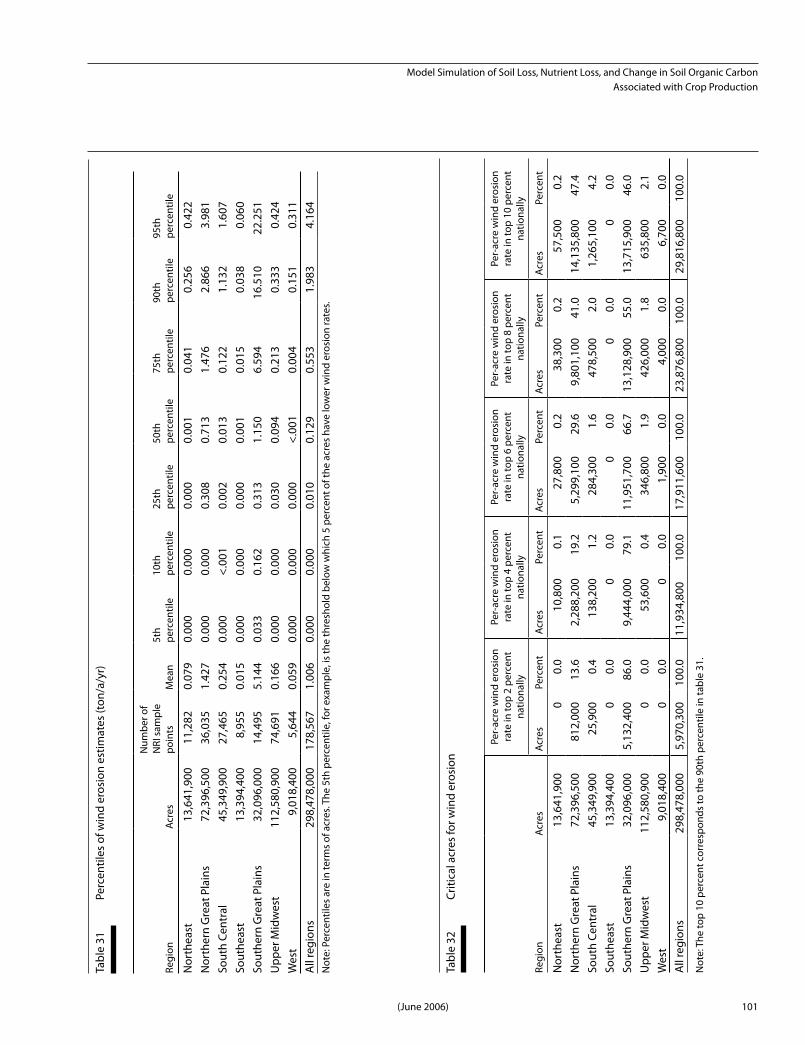
101
Model Simulation of Soil Loss, Nutrient Loss, and Change in Soil Organic Carbon Associated with Crop Production
(June 2006)
Tabl
e 31
Pe
rcen
tiles
of w
ind
eros
ion
estim
ates
(ton
/a/y
r)
Regi
onAc
res
Num
ber o
f N
RI s
ampl
e po
ints
Mea
n 5t
hpe
rcen
tile
10th
pe
rcen
tile
25th
pe
rcen
tile
50th
pe
rcen
tile
75th
pe
rcen
tile
90th
pe
rcen
tile
95th
pe
rcen
tile
Nor
thea
st13
,641
,900
11,2
820.
079
0.00
00.
000
0.00
00.
001
0.04
10.
256
0.42
2N
orth
ern
Gre
at P
lain
s72
,396
,500
36,0
351.
427
0.00
00.
000
0.30
80.
713
1.47
62.
866
3.98
1So
uth
Cent
ral
45,3
49,9
0027
,465
0.25
40.
000
<.00
10.
002
0.01
30.
122
1.13
21.
607
Sout
heas
t13
,394
,400
8,95
50.
015
0.00
00.
000
0.00
00.
001
0.01
50.
038
0.06
0So
uthe
rn G
reat
Pla
ins
32,0
96,0
0014
,495
5.14
40.
033
0.16
20.
313
1.15
06.
594
16.5
1022
.251
Upp
er M
idw
est
112,
580,
900
74,6
910.
166
0.00
00.
000
0.03
00.
094
0.21
30.
333
0.42
4W
est
9,01
8,40
05,
644
0.05
90.
000
0.00
00.
000
<.00
10.
004
0.15
10.
311
All
regi
ons
298,
478,
000
178,
567
1.00
60.
000
0.00
00.
010
0.12
90.
553
1.98
34.
164
Not
e: P
erce
ntile
s ar
e in
term
s of
acr
es. T
he 5
th p
erce
ntile
, for
exa
mpl
e, is
the
thre
shol
d be
low
whi
ch 5
per
cent
of t
he a
cres
hav
e lo
wer
win
d er
osio
n ra
tes.
Tabl
e 32
Cr
itica
l acr
es fo
r win
d er
osio
n
Per-
acre
win
d er
osio
n ra
te in
top
2 pe
rcen
t na
tiona
lly
Per-
acre
win
d er
osio
n ra
te in
top
4 pe
rcen
t na
tiona
lly
Per-
acre
win
d er
osio
n ra
te in
top
6 pe
rcen
t na
tiona
lly
Per-
acre
win
d er
osio
n ra
te in
top
8 pe
rcen
t na
tiona
lly
Per-
acre
win
d er
osio
n ra
te in
top
10 p
erce
nt
natio
nally
Regi
onAc
res
Acre
sPe
rcen
tAc
res
Perc
ent
Acre
sPe
rcen
tAc
res
Perc
ent
Acre
sPe
rcen
t
Nor
thea
st13
,641
,900
00.
010
,800
0.1
27,8
000.
238
,300
0.2
57,5
000.
2N
orth
ern
Gre
at P
lain
s72
,396
,500
812,
000
13.6
2,28
8,20
019
.25,
299,
100
29.6
9,80
1,10
041
.014
,135
,800
47.4
Sout
h Ce
ntra
l45
,349
,900
25,9
000.
413
8,20
01.
228
4,30
01.
647
8,50
02.
01,
265,
100
4.2
Sout
heas
t13
,394
,400
00.
00
0.0
00.
00
0.0
00.
0So
uthe
rn G
reat
Pla
ins
32,0
96,0
005,
132,
400
86.0
9,44
4,00
079
.111
,951
,700
66.7
13,1
28,9
0055
.013
,715
,900
46.0
Upp
er M
idw
est
112,
580,
900
00.
053
,600
0.4
346,
800
1.9
426,
000
1.8
635,
800
2.1
Wes
t9,
018,
400
00.
00
0.0
1,90
00.
04,
000
0.0
6,70
00.
0A
ll re
gion
s29
8,47
8,00
05,
970,
300
100.
011
,934
,800
100.
017
,911
,600
100.
023
,876
,800
100.
029
,816
,800
100.
0
Not
e: T
he to
p 10
per
cent
cor
resp
onds
to th
e 90
th p
erce
ntile
in ta
ble
31.
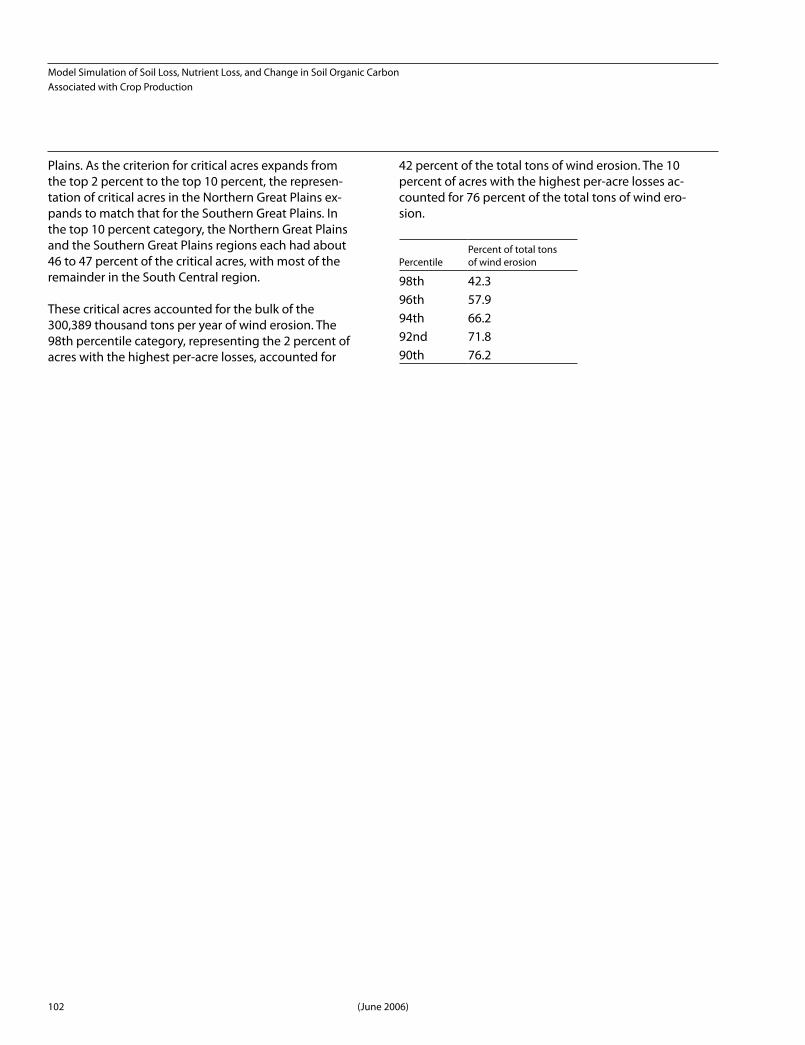
Model Simulation of Soil Loss, Nutrient Loss, and Change in Soil Organic Carbon Associated with Crop Production
102 (June 2006)
Plains. As the criterion for critical acres expands from the top 2 percent to the top 10 percent, the represen-tation of critical acres in the Northern Great Plains ex-pands to match that for the Southern Great Plains. In the top 10 percent category, the Northern Great Plains and the Southern Great Plains regions each had about 46 to 47 percent of the critical acres, with most of the remainder in the South Central region.
These critical acres accounted for the bulk of the 300,389 thousand tons per year of wind erosion. The 98th percentile category, representing the 2 percent of acres with the highest per-acre losses, accounted for
42 percent of the total tons of wind erosion. The 10 percent of acres with the highest per-acre losses ac-counted for 76 percent of the total tons of wind ero-sion.
PercentilePercent of total tons of wind erosion
98th 42.396th 57.994th 66.292nd 71.890th 76.2