Embed Size (px)
Citation preview
Sediment Sources and Transport inVI 1 tT': T* * * ' y"""1 *rrc rvC¥\7*3nri i/i/^iTil^T/ I ^^f^vrrri'ii fc* 5 £><t¥ dllll V ICllllt V| VJv>vM Hlct
Florida, July 8-16,1982:»<^ /
. *-^-, I;.".. - nil,,, in I UN MM, , , ^-^-, . JlfNlll^ I ? ;!!!»_ lull I Jl ,1 I I _ '_ l' 1 1l lini IIII.IIIIIMII Illllllll & ^ n I
U,S, GEOLOGICAL SURVBY FROFESSIONAI, FAPER 1S47
United $ fates Nn^@ in charge of cvnytrifciion^, Trident Naval SiSmcmne Bme,
Sediment Sources and Transport in Kings Bay and Vicinity,Georgia and Florida, July 8-16,1982By DEAN B.RADTKE
U.S. GEOLOGICAL SURVEY PROFESSIONAL PAPER 1347
Prepared in cooperation with the United States Navy Officer in charge of construction, Trident Naval Submarine Base, Kings Bay, Georgia
UNITED STATES GOVERNMENT PRINTING OFFICE, WASHINGTON: 1985
DEPARTMENT OF THE INTERIOR
DONALD PAUL HODEL, Secretary
U.S. GEOLOGICAL SURVEY
Dallas L. Peck, Director
Library of Congress Cataloging-in-Publication Data
Radtke, DeanB.Sediment sources and transport in Kings Bay and vicinity, Georgia and Florida, July 8-16,1982.
(U.S. Geological Survey professional paper; 1347) Bibliography: p. 30 Supt.ofDocs.no.: 119.16:13471. Estuarine sediments Georgia-Kings Bay Region. 2. Estuarine sediments-Florida-Nassau County. 3. Sediment transport-
Georgia Kings Bay Region. 4. Sediment transport-Florida-Nassau County. I. Title. II. Series. GC97.8.K56R331985 551.46148 84-600342
For sale by the Distribution Branch, U.S. Geological Survey 604 South Pickett Street, Alexandria, VA 22304
CONTENTS
Abstract _ __________________________ 1Introduction _________________________ 1
Previous studies _____________________ 2Acknowledgments ____________________ 2
Description of the study area _________________ 2Physiography and topography ______________ 2Ecology _________________________ 4Climate _________________________ 4Streamflow _______________________ 4Tides __________________________ 5
Data collection ________________________ 5Tide stage, windspeed, and wind direction _________ 5Current velocity _____________________ 5Bathymetry _______________________ 6Water quality ______________________ 6Bottom material _____________________ 7
Methods of computation ___________________ 7Mean current velocity in the vertical ____________ 7Water discharge _____________________ 8Mean current velocity in the cross sections _________ 8
Methods of computation Continued
Salt discharge _______________Suspended-sediment discharge _______
Study results _________________Tide and wind conditions __________Temperature and salinity __________Current velocity and flow __________Suspended-sediment characteristics Phytoplankton _______________Suspended total organic carbon _______Turbidity _________________Bottom-material characteristics _______
Particle size _____________Carbon ________________Diatom remains ____________
Transport and sources of suspended sediment Discussion ___________________Conclusions __________________References cited ________________
13131518182323232323282930
ILLUSTRATIONS
FIGURE 1. Map showing location of study area and data-collection sites __________________________________ 32. Graph showing duration curve of daily flow, St. Marys River near Mcclenny, Fla., 1927-80 water years ______________ 5
3, 4. Tidal hydrographs of 3. Upper Kings Bay and lower Kings Bay gaging stations and approximate data-collection times at the measurement cross
sections,July9-15, 1982 ____________________________________________ 54. Cumberland Sound and St. Marys Entrance gaging stations and approximate data-collection times at the measurement cross
sections,July 12-16, 1982 ___________________________________________ 65-27. Graphs showing:
5. Channel geometry and location of measurement verticals at upper Kings Bay and lower Kings Bay cross sections ______ 66. Channel geometry and location of measurement verticals at Cumberland Sound and St. Marys Entrance cross sections _ _ _ 77. Temperature and salinity profiles at measurement vertical 2, upper Kings Bay cross section, July 10, 1982 _________ 98. Temperature and salinity profiles at measurement vertial 2, lower Kings Bay cross section, July 14, 1982 _________ 109. Temperature and salinity profiles at measurement vertical 2, at Cumberland Sound cross section, July 15, 1982 ______ 11
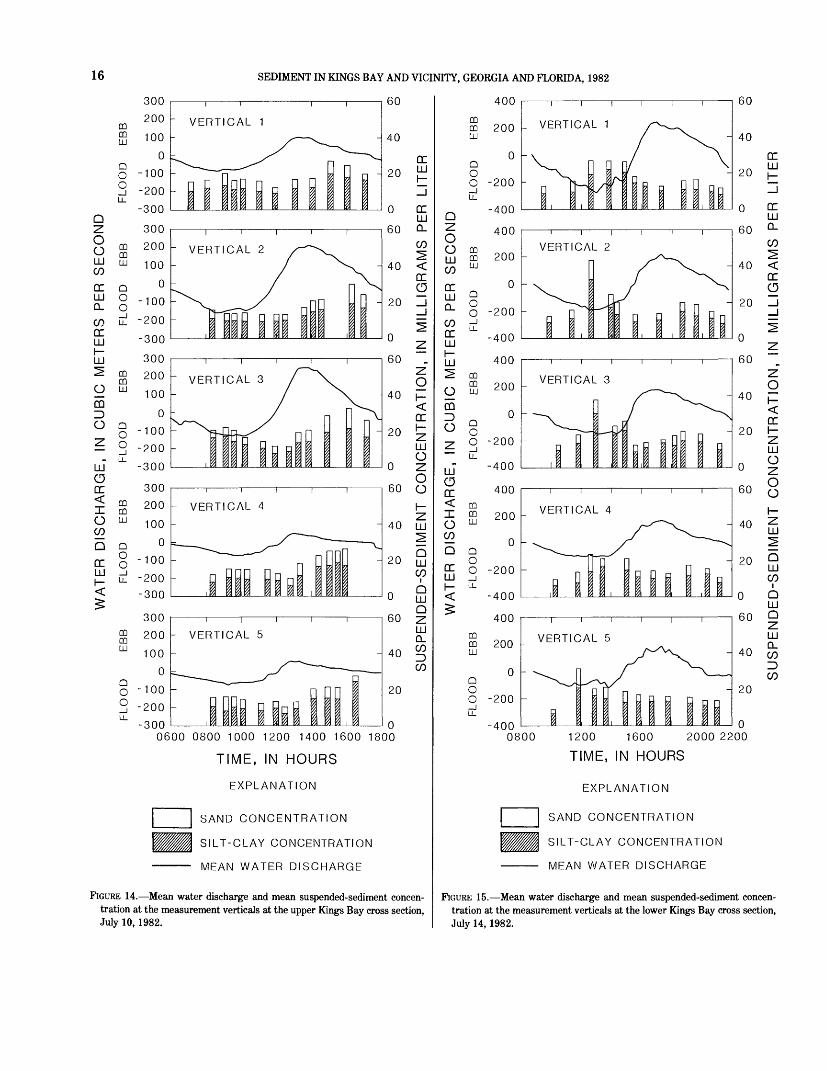
10. Temperature and salinity profiles at measurement vertical 4, at St. Marys Entrance cross section, July 13, 1982 ______ 1211. Spatial distribution of salinity at flood and ebb slack tides, Kings Bay and vicinity, July 8,1982 ______________ 1412. Tide height and mean velocity at upper Kings Bay and lower Kings Bay cross sections __________________ 1513. Tide height and mean velocity at Cumberland Sound and St. Marys Entrance cross sections ________________ 1514. Mean water discharge and mean suspended-sediment concentration at the measurement verticals at the upper Kings Bay
cross section, July 10, 1982 ___________________________________________ 1615. Mean water discharge and mean suspended-sediment concentration at the measurement verticals at the lower Kings Bay
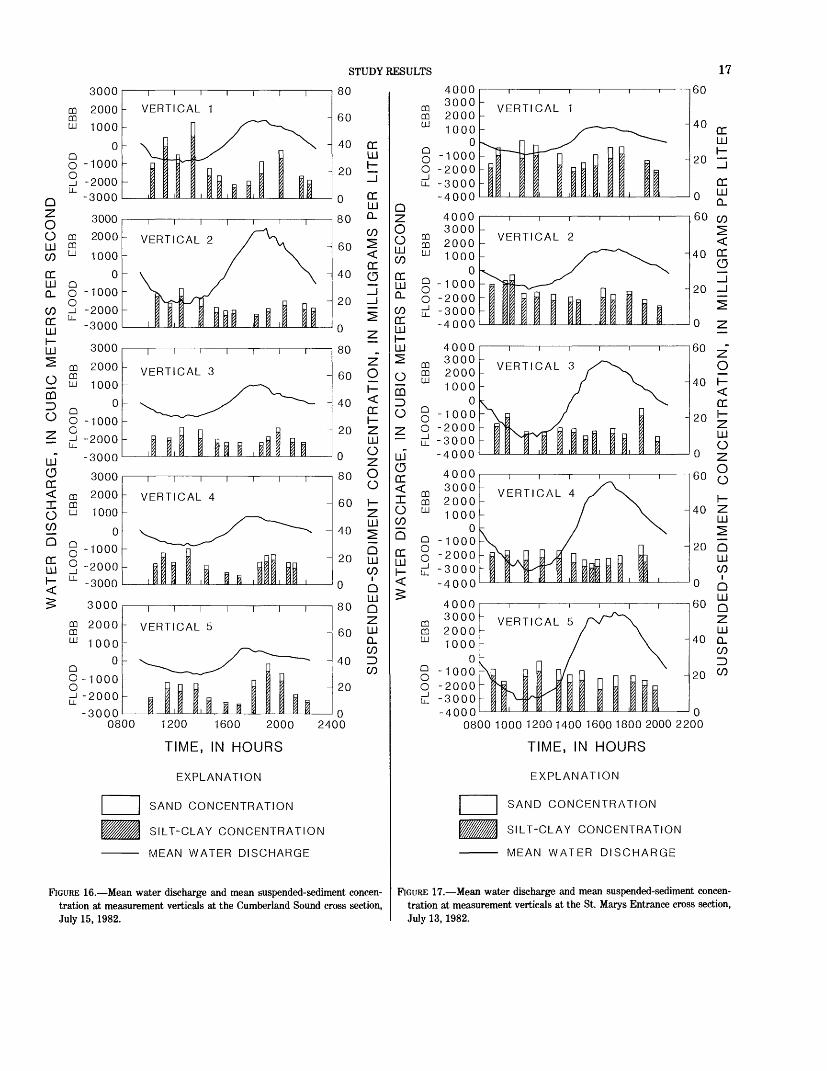
cross section, July 14, 1982 ___________________________________________ 1616. Mean water discharge and mean suspended-sediment concentration at measurement verticals at the Cumberland Sound cross
section, July 15, 1982 _____________________________________________ 1717. Mean water discharge and mean suspended-sediment concentration at measurement verticals at the St. Marys Entrance cross
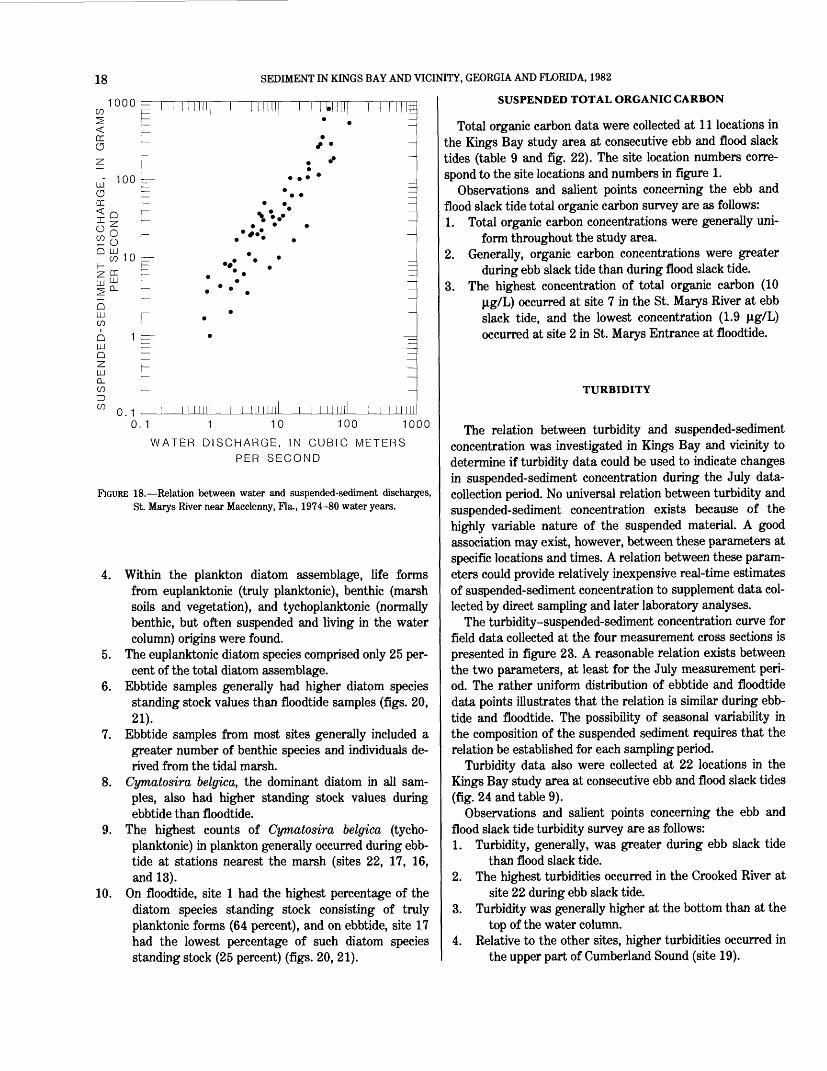
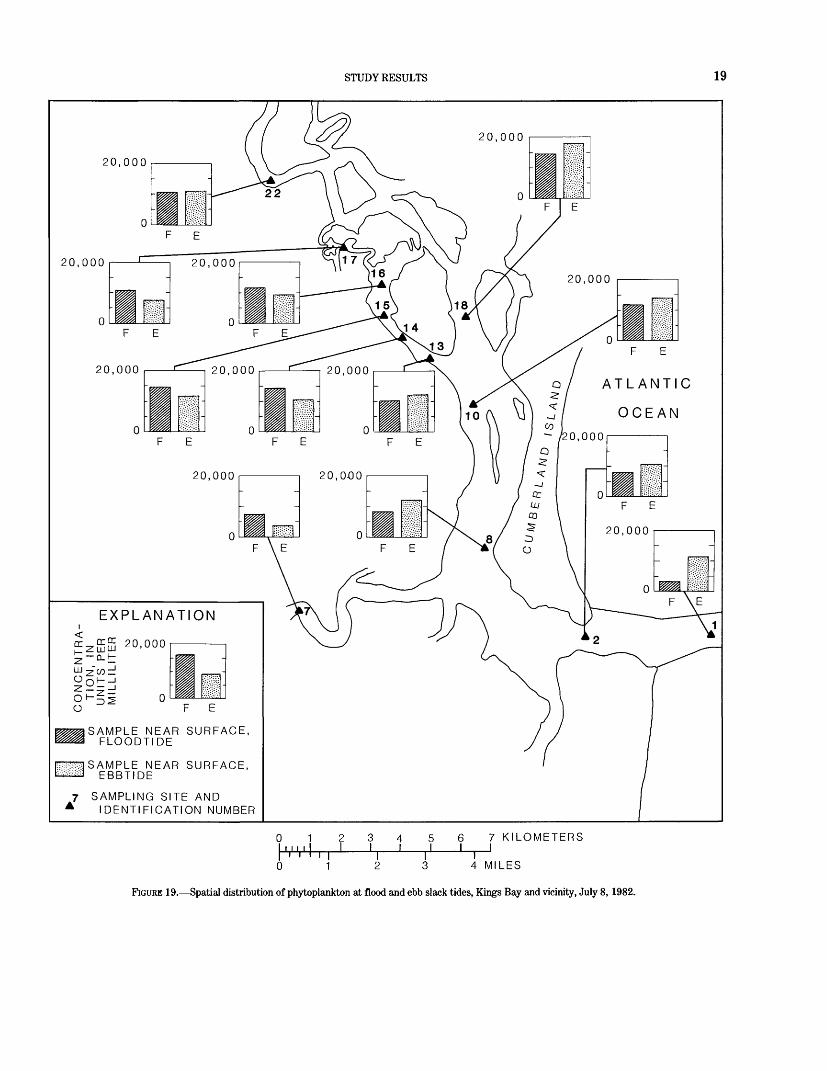
section, July 13, 1982 _____________________________________________ 1718. Relation between water and suspended-sediment discharges, St. Marys River near Macclenny, Fla., 1974-80 water years _ _ 1819. Spatial distribution of phytoplankton at flood and ebb slack tides, Kings Bay and vicinity, July 8, 1982 ___________ 1920. Spatial distribution of total diatom standing stock and percentages of the major diatom life forms in plankton during flood
slack tide, Kings Bay and vicinity, July 8, 1982 __________________________________ 20
in
IV CONTENTS
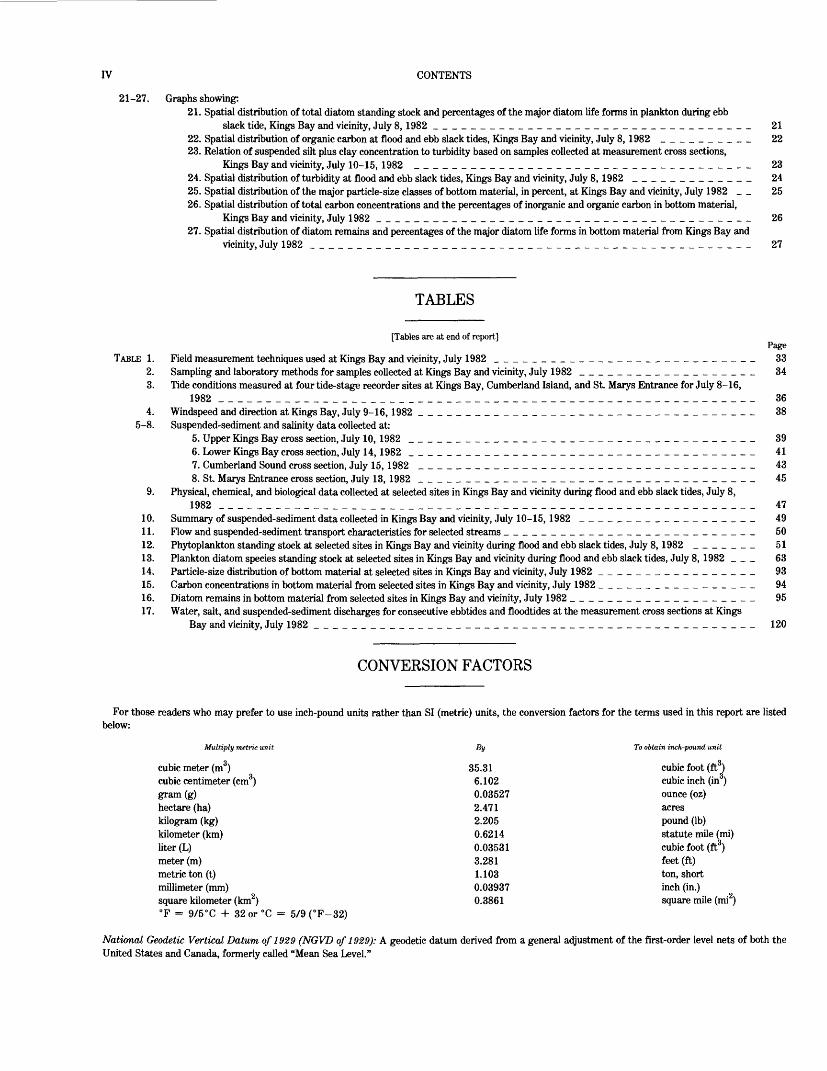
21-27. Graphs showing:21. Spatial distribution of total diatom standing stock and percentages of the major diatom life forms in plankton during ebb
slack tide, Kings Bay and vicinity, July 8,1982 __________________________________ 2122. Spatial distribution of organic carbon at flood and ebb slack tides, Kings Bay and vicinity, July 8,1982 __________ 2223. Relation of suspended silt plus clay concentration to turbidity based on samples collected at measurement cross sections,
Kings Bay and vicinity, July 10-15, 1982 ____________________________________ 2324. Spatial distribution of turbidity at flood and ebb slack tides, Kings Bay and vicinity, July 8, 1982 _____________ 2425. Spatial distribution of the major particle-size classes of bottom material, in percent, at Kings Bay and vicinity, July 1982 _ _ 2526. Spatial distribution of total carbon concentrations and the percentages of inorganic and organic carbon in bottom material,
Kings Bay and vicinity, July 1982 ________________________________________ 2627. Spatial distribution of diatom remains and percentages of the major diatom life forms in bottom material from Kings Bay and
vicinity,July 1982 _______________________________________________ 27
TABLES
[Tables are at end of report]Page
TABLE 1. Field measurement techniques used at Kings Bay and vicinity, July 1982 ____________________________ 332. Sampling and laboratory methods for samples collected at Kings Bay and vicinity, July 1982 ___________________ 343. Tide conditions measured at four tide-stage recorder sites at Kings Bay, Cumberland Island, and St. Marys Entrance for July 8-16,
1982 _________________________________________________________ 36Windspeed and direction at Kings Bay, July 9-16,1982 ____________________________________ 38Suspended-sediment and salinity data collected at:
5. Upper Kings Bay cross section, July 10, 1982 _____________________________________ 396. Lower Kings Bay cross section, July 14, 1982 _____________________________________ 417. Cumberland Sound cross section, July 15, 1982 ____________________________________ 438. St. Marys Entrance cross section, July 13, 1982 ____________________________________ 45
9. Physical, chemical, and biological data collected at selected sites in Kings Bay and vicinity during flood and ebb slack tides, July 8,1982 _________________________________________________________ 47
10. Summary of suspended-sediment data collected in Kings Bay and vicinity, July 10-15, 1982 ___________________ 4911. Flow and suspended-sediment transport characteristics for selected streams ___________________________ 5012. Phytoplankton standing stock at selected sites in Kings Bay and vicinity during flood and ebb slack tides, July 8,1982 _______ 5113. Plankton diatom species standing stock at selected sites in Kings Bay and vicinity during flood and ebb slack tides, July 8, 1982 _ _ _ 6314. Particle-size distribution of bottom material at selected sites in Kings Bay and vicinity, July 1982 _________________ 9315. Carbon concentrations in bottom material from selected sites in Kings Bay and vicinity, July 1982 _________________ 9416. Diatom remains in bottom material from selected sites in Kings Bay and vicinity, July 1982 ____________________ 9517. Water, salt, and suspended-sediment discharges for consecutive ebbtides and floodtides at the measurement cross sections at Kings
Bay and vicinity, July 1982 _______________________________________________ 120
CONVERSION FACTORS
For those readers who may prefer to use inch-pound units rather than SI (metric) units, the conversion factors for the terms used in this report are listed below:
Multiply metric unit By To obtain inch-pound unit
cubic meter (m3) 35.31 cubic foot (ft3)cubic centimeter (cm3) 6.102 cubic inch (in )gram (g) 0.03527 ounce (oz)hectare (ha) 2.471 acreskilogram (kg) 2.205 pound (Ib)kilometer (km) 0.6214 statute mile (mi)liter (L) 0.03531 cubic foot (ft3)meter (m) 3.281 feet (ft)metric ton (t) 1.103 ton, shortmillimeter (mm) 0.03937 inch (in.)
are kilometer (km ) = 9/5°C 4- 32or°C = 5/9(°F-32)
n O
square kilometer (km ) 0.3861 square mile (mi )
National Geodetic Vertical Datum of 1929 (NGVD of 1929): A geodetic datum derived from a general adjustment of the first-order level nets of both the United States and Canada, formerly called "Mean Sea Level."
SEDIMENT SOURCES AND TRANSPORTIN KINGS BAY AND VICINITY,
GEORGIA AND FLORIDA, JULY 8-16, 1982
By DEAN B. RADTKE
ABSTRACT .
Water-quality, bottom-material, suspended-sediment, and current-velocity data were collected in Kings Bay and vicinity to provide information on the sources and transport of estuarine sediments. Kings Bay and Cumberland Sound, the site of the Naval Submarine Base in southeast Georgia, are experiencing high rates of sediment deposition and accumulation, and this is causing serious navigational and operational problems. Data were collected between July 8 and 16, 1982, at cross sections in upper and lower Kings Bay, Cumberland Sound, and St. Marys Entrance. Additional water-quality data were collected at 22 sites during one consecutive ebb and flood slack tide on July 8, 1982, to assess possible suspended-sediment sources and to define salinity variation throughout the study area.
No appreciable vertical or lateral variation in salinity and temperature was detected at the measurement cross sections or at the 22 ebb and flood slack-tide measurement sites. Except for the upper St. Marys River sites, the waterways measured in Kings Bay and vicinity generally were vertically and laterally homogeneous.
Sediments in bottom-material samples collected at the cross sections ranged from coarse-gravel-sized shell fragments to fine silt and clay-sized inorganic particles. Silt- and clay-sized particles and organic detrital materi al, however, were dominant only in bottom materials at the lower Kings Bay cross section.
Approximately 25 percent of the silt- and clay-sized particles in the bottom material from lower Kings Bay consisted of planktonic and benthic diatom remains. Most diatom remains probably originated outside Kings Bay proper. At the other three cross sections, diatom remains accounted for 15 percent or less of the silt- and clay-sized particles in the bottom sediments.
Velocity, bathymetry, turbidity, and bottom-material data suggest that the area in the vicinity of lower Kings Bay is accumulating deposits of sediment transported in suspension from Cumberland Sound on the flood- tide, and from upper Kings Bay and the tidal marsh drained by Marianna Creek on the ebbtide. Suspended-sediment discharges computed for a 13- hour period showed that a net quantity of 87.7 X 10³ kilograms of suspend ed sediment was transported seaward from upper Kings Bay and Marianna Creek. Similar computations for different tidal cycles showed that a net landward transport of suspended materials occurred at the lower Kings Bay (92 X 103 kilograms), St. Marys Entrance (775 X 103 kilograms), and Cum berland Sound (563 X 103 kilograms) cross sections. This is, in part, a result of the larger floodtide water volume than ebbtide water volume at these three cross sections rather than higher floodtide suspended-sediment con centrations at these cross sections. However, results do indicate that areas seaward of St. Marys Entrance may be supplying sediment to the shoaling areas of the estuary, including lower Kings Bay. The St. Marys River, the single major source of freshwater inflow to the estuary, does not supply significant quantities of suspended sediment to the estuary.
INTRODUCTION
High rates of sediment deposition and accumulation are causing serious navigational and operational problems in Kings Bay and Cumberland Sound, southeast Georgia. Kings Bay, formerly the site of the Kings Bay Army Terminal, is now the site of the Naval Submarine Base. The existing base is being enlarged to accommodate the larger Trident submarine.
Of particular concern to the U.S. Navy is the impact of sediment shoaling on naval operations in the area. Continued dredging is required to maintain navigational depths in the Kings Bay wharf area and in the access channel to the open sea. Sediment deposition rates have been estimated at 3.8 X 10⁵ mVyr (5 X 10⁵ ydVyr) in Kings Bay (Environmen tal Science and Engineering, Inc., 1977, p. C-210) and 0.83 X 10⁵m3/yr (1.08 X 10⁵ ydVyr) in the Cumberland Sound access channel (Jenkins and Skelly, 1981, p. 2). To accommodate the Trident submarine, Kings Bay and the access channel will be made deeper and wider. The impact of shoaling on the Trident submarine support base is uncertain. One prediction is that channel alterations will cause current shoaling rates to increase slightly in the access channel and about sixfold in the quiet-water facilities around Kings Bay (Jenkins and Skelly, 1981, p. 2). Even at current shoaling rates, expenditures of millions of dollars will be required to maintain navigational depths.
Alternative systems for the control of sediment are being pursued by the Navy. However, important information needed to design and to evaluate the systems is lacking. Needed is information on shoaling rates for specific reaches, major sediment sources, and rates and characteristics of sediment transport.
In July 1982, the U.S. Geological survey investigated the nature and magnitude of sediment transport in Kings Bay and vicinity for the U.S. Navy, OICC (Officer in Charge of Construction), Trident. The purpose of the investigation was to collect and evaluate basic hydrologic data relevant to the
SEDIMENT IN KINGS BAY AND VICINITY, GEORGIA AND FLORIDA, 1982
determination of the sources and transport characteristics of sediments in the Kings Bay area.
The objectives of this report are as follows:1. Review descriptive background information on the Kings
Bay area.2. Report current, water-temperature, salinity, and sedi
ment-concentration data collected nonsynoptically over consecutive floodtides and ebbtides during July 1982 in Kings Bay and vicinity.
3. Use these data to calculate net transport of water, salt, and sediment at four cross sections during consecutive floodtides and ebbtides, and use this information to appraise sediment-transport patterns within the study area.
4. Report salinity, water-temperature, sediment, turbidity, and phytoplankton data collected throughout Kings Bay and vicinity on consecutive slack tides.
5. Use these data to identify possible suspended-sediment sources and to define salinity variation throughout the study area.
6. Report results of analyses of benthic samples for particle size, organic carbon, and algal remains, and use these data to identify possible depositional patterns.
The information presented in this report is based primarily on data collected over a short period of time during unique tidal conditions (neap tide period with an increasing tide range) that were influenced by local weather. The interpreta tions of the data relevant to the sedimentation problems are limited because the data represent only a short time period. Nevertheless, the data provide important information that is needed to appraise sediment sources, to understand sedi ment-transport characteristics, and to design meaningful data-collection programs.
PREVIOUS STUDIES
Review of the literature reveals that numerous studies of water and sediment movement have been conducted in estua ries and tidal embayments of the Atlantic Coastal Plain, including the Georgia coast. However, only a few studies have been conducted in the vicinity of Kings Bay and the St. Marys estuary. Oertel and Howard (1972) considered the associated water circulation and sediment-movement pat terns in all major estuary inlets of the Georgia coast, in cluding the St. Marys inlet. Howard and Frey (1975) report ed on the characteristics of bottom materials collected from Cumberland Sound and the St. Marys River. Olsen (1977) studied the effects of inlet stabilization at St. Marys En trance. The most comprehensive investigation in Kings Bay and vicinity was the environmental impact assessment for the Naval Submarine Base conducted for the U.S. Navy in 1976-77 by ES & E (Environmental Science and Engineer ing, 1977). As part of that investigation, water-quality and tidal-flow data were collected periodically for a year to assess the integrated characteristics of water circulation and pat
terns of sediment erosion, deposition, and accumulation. In November 1981, the U.S. Geological Survey (McConnell and others, 1983) conducted a preliminary investigation of the nature and magnitude of sediment transport in Kings Bay and vicinity during high spring tide conditions.
ACKNOWLEDGMENTS
The author wishes to acknowledge Mr. George Carpenter, U.S. Navy, OICC, for his assistance with the logistics of this project and U.S. Navy personnel at the Kings Bay docking facility for recording wind data.
Special thanks go to Wayne York of Tradewind Charter, who was extremely cooperative in providing boat support. Thanks to Kenneth Morgan, the superintendent of Cumber land Island National Seashore, for allowing a tide-stage re corder to be installed at a dock on Cumberland Island.
The author also acknowledges the following U.S. Geologi cal Survey personnel for their assistance: Timothy W. Hale and James B. McConnell for providing helpful suggestions regarding the investigation and the report; Don Block (At lanta Central Laboratory), who analyzed and interpreted the planktonic and benthic diatom data; Howard A. Perlman and Stephen E. Ryan for their outstanding effort in developing software for computer graphics and data reduction for this report; Howard H. Persinger, who provided assistance in the field operation; and, lastly, the field personnel who, during the process of data collection, had to endure long working hours, strenuous and tedious working conditions, and severe weather conditions.
DESCRIPTION OF THE STUDY AREA
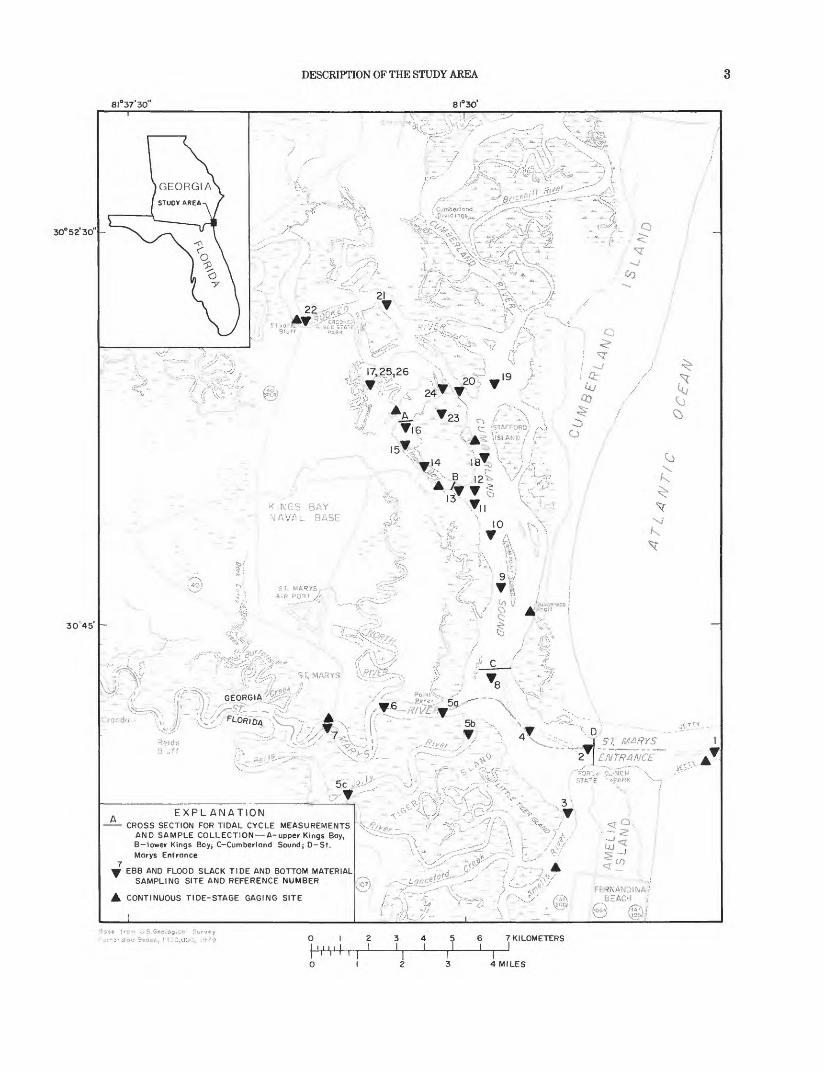
The project study area (fig. 1) included Kings Bay, Cum berland Sound, St. Marys River, Crooked River, Cumberland River, Amelia River, and several smaller tributaries. It did not include any area seaward of St. Marys Entrance or northward of Cumberland Dividings.
PHYSIOGRAPHY AND TOPOGRAPHY
The estuarine system of Kings Bay and vicinity is a bar- built system in the sea island section of the Coastal Plain physiographic province of Georgia. Bar-built estuaries are shallow basins, often partially exposed at low tide, enclosed by offshore bars or barrier islands, and broken at intervals by tidal inlets (Pritchard, 1967). Cumberland Island and Little Cumberland Island (not shown in fig. 1) are low, sandy islands separated from one another and from the mainland by tidal creeks and inlets that drain an extensive marsh-filled coastal lagoon. The mainland topography is characterized by broad depositional terraces alined in belts parallel to the
FIGURE 1. Location of study area and data-collection sites.
8I°37 30
DESCRIPTION OF THE STUDY AREA
8I°30'
30°52'3O" -
4 MILES
SEDIMENT IN KINGS BAY AND VICINITY, GEORGIA AND FLORIDA, 1982
present coastline. These terraces consist of Pleistocene coast al deposits that have a low gradient and subtle undulations of the surface.
Pleistocene sediments of these terraces are organized into topographically distinct geomorphic units. The two geomor- phic units are linear sand ridges (former barrier islands) and broad, clayey sand plains (former back-barrier tidal lagoons or marshes). These coastal terraces were formed during Pleistocene interglacial periods of erosion and deposition as sociated with transgressions and regressions of the Atlantic Ocean. Geologically, existing islands and marshes are unsta ble, subject to migration due to natural forces (waves, tides, currents, and winds) and man-induced alterations (dredging, upstream dams, jetties, and other shoreline structures).
ECOLOGY
The seaward margin of the mainland and the landward side of the barrier islands are bordered by extensive areas of salt marsh and limited areas of freshwater and brackish marsh. The salt marsh extends to the high-tide line and up tidal creeks and rivers, where its upper boundary is generally marked by the black rush (Juncus roemerianus) (Wharton, 1978). Basically, the salt marsh is a grassland thet includes zones of single species of salt tolerant grasses such as cordgrass (Spartina), salt grass (Distichlys), and rushes (Juncus). The marshes are watered and drained by an intri cate network of tidal creeks and rivers.
Zones of vegetation in the salt marshes are determined by elevation, which controls the depth and duration of inunda tion by saline water. The harsh saltwater environment and water-level fluctuations in tidal marshes allow the growth of only a few species tolerant of salt stress and tidal fluctua tions. Free from competition, extensive stands of smooth cordgrass (Spartina alterniflora) persist. Smooth cordgrass gives way to other species (Distichlys spicata, Borrichia frutescens, Salicornia virginica, and Linomium carolini- anum) at higher marsh elevations where the marsh is flood ed for only an hour a day (Warton, 1979).
Productivity in a salt marsh may amount to 200 (g car- bon/m2) per yr with carbon production due mostly to Spar tina alterniflora (Wharton, 1978). Grosselink and others (1973) estimated that 42 percent of net primary production of Spartina alterniflora is flushed into the adjacent subtidal environments by tidal action, and Odum and de la Cruz (1967) estimated the net export of organic and mineral mat ter from 25 ha (hectares) of marsh to be 40 kg on neap tide and 140 kg on a spring tidal cycle. Odum (1961) has shown that the richest Georgia coastal marshes can produce up to 3.7 metric tons of plant material per hectare per year, which is a level of productivity more than six times the average world production of wheat per hectare. Mud algae growing throughout the intertidal sediments also contribute a sub stantial amount (one-quarter to one-third) of the total prima
ry productivity of the salt marsh ecosystem (Schelske and Odum, 1961). Tidal flushing enhances salt-marsh productivi ty by replenishing nutrients and detritus and by circulating nutrients in estuarine waters. The highly productive tidal marshes are capable of supporting an extensive shellfish and fish resource important to the commercial seafood industry.
CLIMATE
Kings Bay and vicinity is characterized by warm, humid summers and short, mild winters. Because the marine envi ronment moderates the climate of the area, the winters are warmer and the summers are cooler than in the inland areas. Rainfall averages 1,270 mm per year, with spring being the driest season. Summer temperatures generally range from the 20's to the low 30's (°C) and winter temperatures range from 4° to 15 °C. The average relative humidity ranges from 45 percent in the spring to 60 percent in the fall.
The prevailing winds are generally from the southeast, but during the period September to December the dominant winds are from the northeast. These "northeasters" general ly are of high velocity and occasionally increase to moderate gale force. Tropical storms are common in the region; howev er, storms of hurricane strength have not occurred at Kings Bay as frequently as at most other locations along the Atlan tic Coast. The most active hurricane period is from late June through mid-October. Hurricanes that move into the area generally are reduced to moderate winds and heavy rains by passing over land.
STREAMFLOW
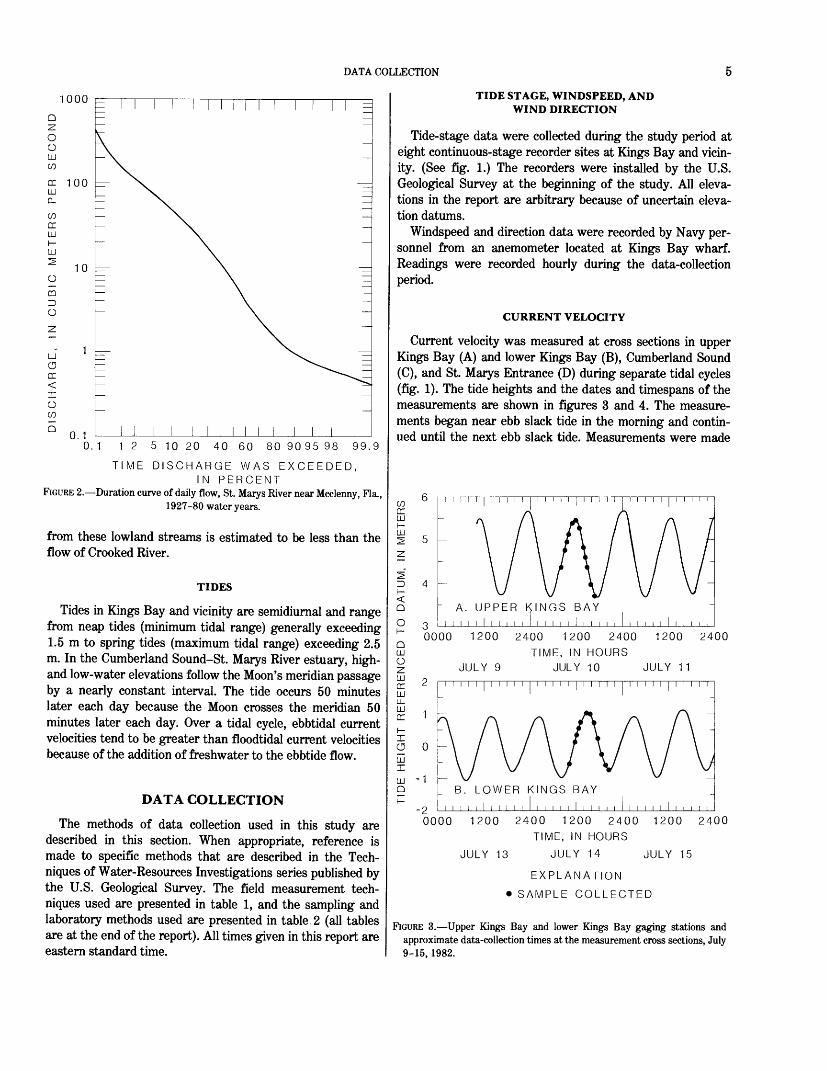
The St. Marys River is the major source of freshwater to the study area. The St. Marys River originates in the Okefe- nokee Swamp (53 km west of the study area) and empties into Cumberland Sound, about 7 km south of Kings Bay (fig. 1). The drainage area upstream from the mouth includes approximately 3,830 km2 of swampland and coastal plain. Streamflow data have been collected at a station on the St. Marys River near Macclenny, Fla. (67 km southwest of the study area), since October 1926. This station is about 161 river kilometers upstream from the mouth; about half of the drainage area is upstream of this station. A flow-duration curve for the period of record (fig. 2) indicates that a daily flow of 7.0 mVs was exceeded 50 percent of the time. The mean daily flow for the same period was 19.2 ms/s. Data gathered at this station and from nearby streams indicate that the mean daily flow of the St. Marys River at its mouth is about 41 m3/s.
Crooked River, a much smaller stream, drains into Cum berland Sound about 4 km north of Kings Bay. The drainage area above its mouth is approximately 231 km2, and its estimated mean daily flow is 2.2 mVs.
Other streams within the project area are the Amelia and North Rivers and Marianna Creek. The surface-water runoff
DATA COLLECTION
000
Q zo oLLJ CO
QC LU D_
COQC LU
LU O QC <X O CO
Q
100
10
0.10.1 1 2 5 10 20 40 60 80 9095 98 99.9
TIME DISCHARGE WAS EXCEEDED,IN PERCENT
FIGURE 2. Duration curve of daily flow, St. Marys River near Mcclenny, Fla., 1927-80 water years.
from these lowland streams is estimated to be less than the flow of Crooked River.
TIDES
Tides in Kings Bay and vicinity are semidiurnal and range from neap tides (minimum tidal range) generally exceeding 1.5 m to spring tides (maximum tidal range) exceeding 2.5 m. In the Cumberland Sound-St. Marys River estuary, high- and low-water elevations follow the Moon's meridian passage by a nearly constant interval. The tide occurs 50 minutes later each day because the Moon crosses the meridian 50 minutes later each day. Over a tidal cycle, ebbtidal current velocities tend to be greater than floodtidal current velocities because of the addition of freshwater to the ebbtide flow.
DATA COLLECTION
The methods of data collection used in this study are described in this section. When appropriate, reference is made to specific methods that are described in the Tech niques of Water-Resources Investigations series published by the U.S. Geological Survey. The field measurement tech niques used are presented in table 1, and the sampling and laboratory methods used are presented in table 2 (all tables are at the end of the report). All times given in this report are eastern standard time.
TIDE STAGE, WINDSPEED, AND WIND DIRECTION
Tide-stage data were collected during the study period at eight continuous-stage recorder sites at Kings Bay and vicin ity. (See fig. 1.) The recorders were installed by the U.S. Geological Survey at the beginning of the study. All eleva tions in the report are arbitrary because of uncertain eleva tion datums.
Windspeed and direction data were recorded by Navy per sonnel from an anemometer located at Kings Bay wharf. Readings were recorded hourly during the data-collection period.
CURRENT VELOCITY
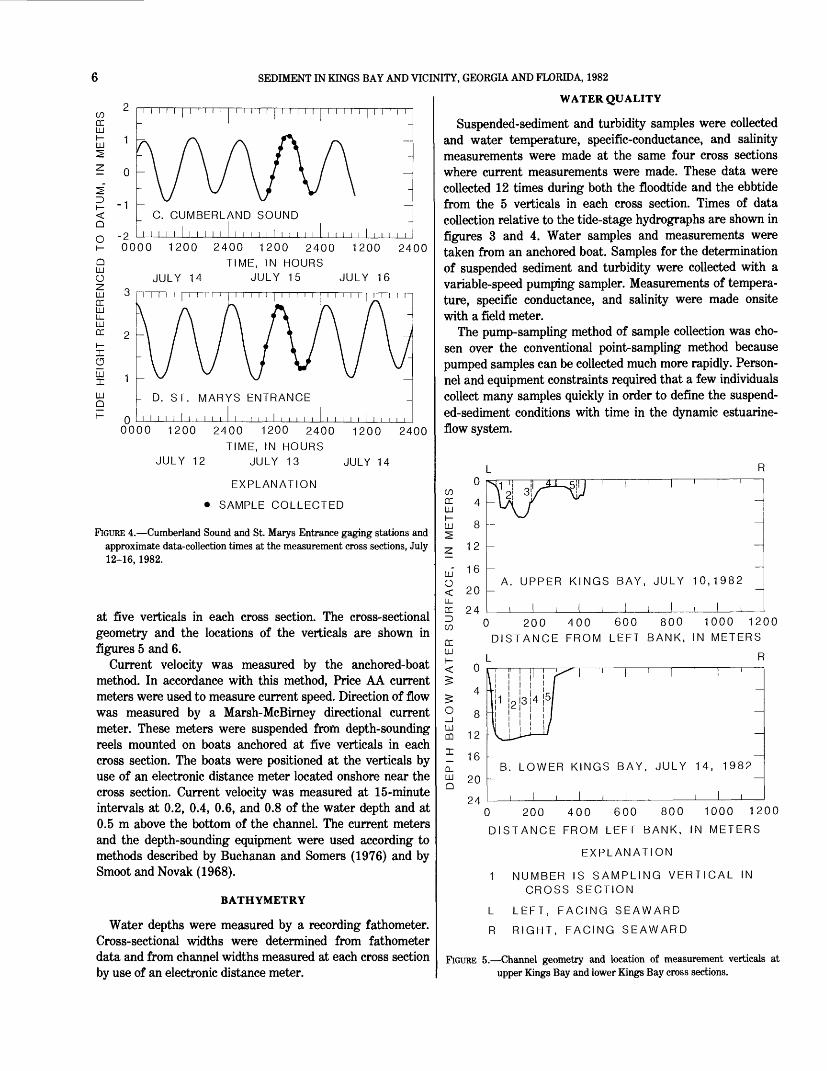
Current velocity was measured at cross sections in upper Kings Bay (A) and lower Kings Bay (B), Cumberland Sound (C), and St. Marys Entrance (D) during separate tidal cycles (fig. 1). The tide heights and the dates and timespans of the measurements are shown in figures 3 and 4. The measure ments began near ebb slack tide in the morning and contin ued until the next ebb slack tide. Measurements were made
A. UPPER KINGS BAYi i i i I i i i
0000 1200 2400 1200 2400 1200 2400TIME, IN HOURS
JULY 9 JULY 10 JULY 11
0
-1
-2
B. LOWER KINGS BAY
i i i i I i i i i i i i i i i I i i i i i i0000 1200 2400 1200 2400 1200 2400
TIME, IN HOURS
JULY 13 JULY 14 JULY 15
EXPLANATION
SAMPLE COLLECTED
FIGURE 3. Upper Kings Bay and lower Kings Bay gaging stations and approximate data-collection times at the measurement cross sections, July 9-15, 1982.
SEDIMENT IN KINGS BAY AND VICINITY, GEORGIA AND FLORIDA, 1982
± 0
-1
Q
OI
Q LU OZ LU DC LULL LU DC
I- I CJLUI
LU Q
C. CUMBERLAND SOUND
i i ii i I ii i ii ii i i i I i ii ii i-2 0000 1200 2400 1200 2400 1200 2400
TIME, IN HOURSJULY 14 JULY 15 JULY 16
3
- D. ST. MARYS ENTRANCE
i i i i I i ii i i i i i i i I i i i i ii ii i i i - o0000 1200 2400 1200 2400 1200 2400
TIME, IN HOURS JULY 12 JULY 13 JULY 14
EXPLANATION
SAMPLE COLLECTED
FIGURE 4. Cumberland Sound and St. Marys Entrance gaging stations and approximate data-collection times at the measurement cross sections, July 12-16, 1982.
at five verticals in each cross section. The cross-sectional geometry and the locations of the verticals are shown in figures 5 and 6.
Current velocity was measured by the anchored-boat method. In accordance with this method, Price AA current meters were used to measure current speed. Direction of flow was measured by a Marsh-McBirney directional current meter. These meters were suspended from depth-sounding reels mounted on boats anchored at five verticals in each cross section. The boats were positioned at the verticals by use of an electronic distance meter located onshore near the cross section. Current velocity was measured at 15-minute intervals at 0.2, 0.4, 0.6, and 0.8 of the water depth and at 0.5 m above the bottom of the channel. The current meters and the depth-sounding equipment were used according to methods described by Buchanan and Somers (1976) and by Smoot and Novak (1968).
BATHYMETRY
Water depths were measured by a recording fathometer. Cross-sectional widths were determined from fathometer data and from channel widths measured at each cross section by use of an electronic distance meter.
WATER QUALITY
Suspended-sediment and turbidity samples were collected and water temperature, specific-conductance, and salinity measurements were made at the same four cross sections where current measurements were made. These data were collected 12 times during both the floodtide and the ebbtide from the 5 verticals in each cross section. Times of data collection relative to the tide-stage hydrographs are shown in figures 3 and 4. Water samples and measurements were taken from an anchored boat. Samples for the determination of suspended sediment and turbidity were collected with a variable-speed pumping sampler. Measurements of tempera ture, specific conductance, and salinity were made onsite with a field meter.
The pump-sampling method of sample collection was cho sen over the conventional point-sampling method because pumped samples can be collected much more rapidly. Person nel and equipment constraints required that a few individuals collect many samples quickly in order to define the suspend ed-sediment conditions with time in the dynamic estuarine- flow system.
uCODC 4LU
LU 8
Z 12
ul 1 6o< 20LJ_oc 24
3 cDC
^ 0< o
3 4O 0
1
LUCD 12
jE 16
fc 20
Q/1
Xl '! II * ' ^5! 1 ' ' 1 ' 'v ?' ^\f \W
\ A r ^*"^
- -
A. UPPER KINGS BAY, JULY 10,1982
i i i ili i) 200 400 600 800 1000 12DISTANCE FROM LEFT BANK, IN METERS
L Rr-r r l[ I \^" I I I i
|1 2 34i5I ^- I I | J __
1 1 ' i
\ I''/
-V_L-t-J ~~
_
B. LOWER KINGS BAY, JULY 14, 1982
ill I ill !
00
0 200 400 600 800 1000 1200
DISTANCE FROM LEFT BANK, IN METERS
EXPLANATION
1 NUMBER IS SAMPLING VERTICAL IN CROSS SECTION
LEFT, FACING SEAWARD
RIGHT, FACING SEAWARD
FIGURE 5. Channel geometry and location of measurement verticals at upper Kings Bay and lower Kings Bay cross sections.
METHODS OF COMPUTATION
O_i UJ CO
0
4
8
12
16
20
24
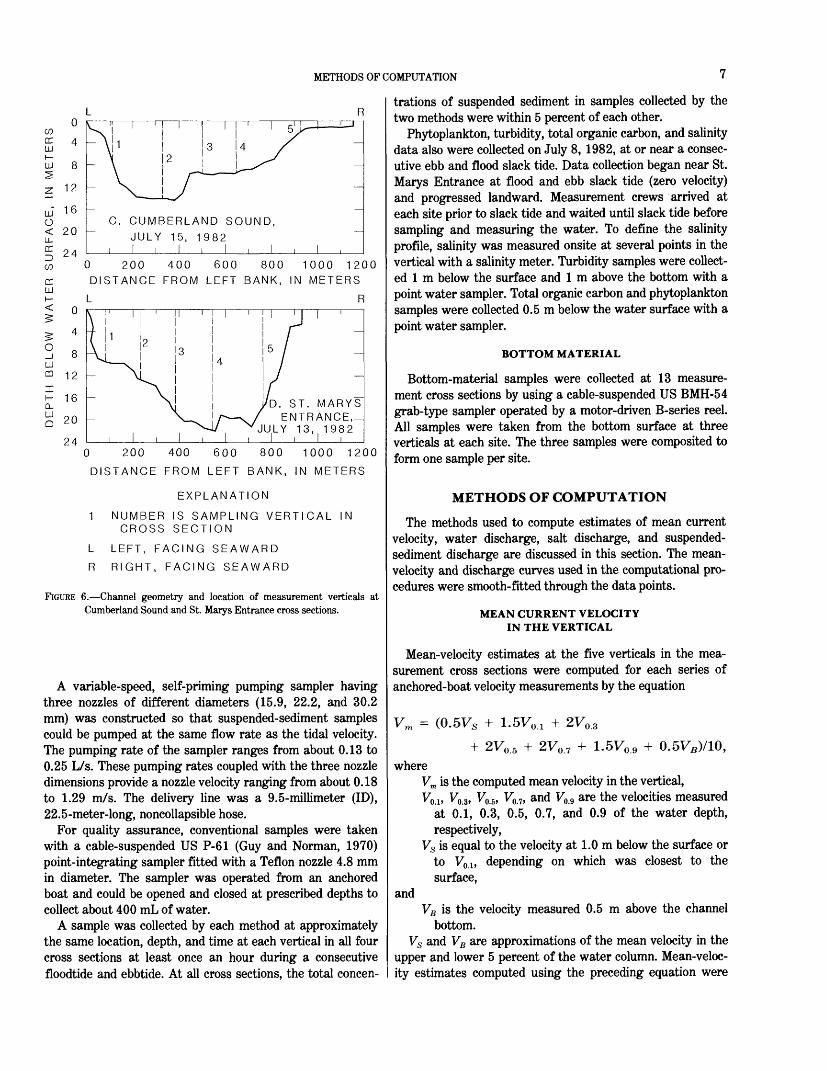
C. CUMBERLAND SOUND,
JULY 15, 1982
0 200 400 600 800 1000 1200
DISTANCE FROM LEFT BANK, IN METERS
L R
12
16
20
24
D. ST. MARYS ENTRANCE,
JULY 13, 1982
0 200 400 600 800 1000 1200
DISTANCE FROM LEFT BANK, IN METERS
EXPLANATION
1 NUMBER IS SAMPLING VERTICAL IN CROSS SECTION
L LEFT, FACING SEAWARD
R RIGHT, FACING SEAWARD
FIGURE 6. Channel geometry and location of measurement verticals at Cumberland Sound and St. Marys Entrance cross sections.
A variable-speed, self-priming pumping sampler having three nozzles of different diameters (15.9, 22.2, and 30.2 mm) was constructed so that suspended-sediment samples could be pumped at the same flow rate as the tidal velocity. The pumping rate of the sampler ranges from about 0.13 to 0.25 L/s. These pumping rates coupled with the three nozzle dimensions provide a nozzle velocity ranging from about 0.18 to 1.29 m/s. The delivery line was a 9.5-millimeter (ID), 22.5-meter-long, noncollapsible hose.
For quality assurance, conventional samples were taken with a cable-suspended US P-61 (Guy and Norman, 1970) point-integrating sampler fitted with a Teflon nozzle 4.8 mm in diameter. The sampler was operated from an anchored boat and could be opened and closed at prescribed depths to collect about 400 mL of water.
A sample was collected by each method at approximately the same location, depth, and time at each vertical in all four cross sections at least once an hour during a consecutive floodtide and ebbtide. At all cross sections, the total concen
trations of suspended sediment in samples collected by the two methods were within 5 percent of each other.
Phytoplankton, turbidity, total organic carbon, and salinity data also were collected on July 8, 1982, at or near a consec utive ebb and flood slack tide. Data collection began near St. Marys Entrance at flood and ebb slack tide (zero velocity) and progressed landward. Measurement crews arrived at each site prior to slack tide and waited until slack tide before sampling and measuring the water. To define the salinity profile, salinity was measured onsite at several points in the vertical with a salinity meter. Turbidity samples were collect ed 1 m below the surface and 1 m above the bottom with a point water sampler. Total organic carbon and phytoplankton samples were collected 0.5 m below the water surface with a point water sampler.
BOTTOM MATERIAL
Bottom-material samples were collected at 13 measure ment cross sections by using a cable-suspended US BMH-54 grab-type sampler operated by a motor-driven B-series reel. All samples were taken from the bottom surface at three verticals at each site. The three samples were composited to form one sample per site.
METHODS OF COMPUTATION
The methods used to compute estimates of mean current velocity, water discharge, salt discharge, and suspended- sediment discharge are discussed in this section. The mean- velocity and discharge curves used in the computational pro cedures were smooth-fitted through the data points.
MEAN CURRENT VELOCITY IN THE VERTICAL
Mean-velocity estimates at the five verticals in the mea surement cross sections were computed for each series of anchored-boat velocity measurements by the equation
Vm =
whereVm P
2V0. 3
+ 2V0 . 5 + 2V0 . 7 + 1.5V09 + 0.5VB)/10,
is the computed mean velocity in the vertical, ^ P VI and V are the velocities measuredO.S. O.TI
at 0.1, 0.3, 0.5, 0.7, and 0.9 of the water depth, respectively,
Vs is equal to the velocity at 1.0 m below the surface or to Vol , depending on which was closest to the surface,
VB is the velocity measured 0.5 m above the channelbottom.
Vs and VB are approximations of the mean velocity in the upper and lower 5 percent of the water column. Mean-veloc ity estimates computed using the preceding equation were
and
8 SEDIMENT IN KINGS BAY AND VICINITY, GEORGIA AND FLORIDA, 1982
compared with velocities computed graphically from velocity profiles fit through the point velocity data. The estimates from the two procedures were in agreement. Therefore, for computational simplicity, the equation shown above was con sidered very satisfactory for this study.
Smooth mean-velocity-time curves for the 13-hour tidal cycle were constructed for each vertical in the measurement cross sections from the computed mean-velocity data.
WATER DISCHARGE
The discharge-measurement method is described by Buchanan and Somers (1976). Smooth discharge-time curves for the 13-hour tidal cycle were constructed for each mea surement cross section and for subsections within the cross sections. Adjustments were made in the discharge-time curves for the subsections so that the sum of the areas under the subsection-discharge curves equaled the area under the discharge curve for the entire cross section.
Water discharges defined by the water-discharge-time curves should be considered only approximations of the true tidal discharges. Inaccuracies in the discharge measurement technique and the limited amount of velocity data could re sult in differences between the true and the measured discharges.
The volume of water exchanged during the ebbtide and floodtide periods at each cross section was determined by computing the area under the water-discharge curves for each subsection of a cross section. The sum of the five sub- volumes is the total volume exchanged. Integration of the area at 5-minute intervals was done by computer.
MEAN CURRENT VELOCITY IN THE CROSS SECTIONS
Mean current velocities for the measurement cross sec tions were computed by dividing the cross-sectional dis charges by the cross-sectional areas. Mean-velocity curves for each cross section were constructed from mean velocities computed at 5-minute intervals. The cross-section discharges and the cross-sectional areas used in the computations were obtained from the cross-sectional discharge-time curves and from tide-stage-area relations, respectively.
SALT DISCHARGE
Salt discharges were determined at each cross section from the water-discharge and salinity data. Salinity-time curves were constructed from salinity data collected at each of the five measurement verticals. Each point in time used to define the salinity curve was a velocity-weighted average of the vertical measurements. The product of salinity (density adjusted) and the corresponding water discharge was com puted at 5-minute increments, which resulted in a salt-dis charge-time curve for each subsection. The incremented ar eas under the salt-discharge curves were summed to give the total salt discharges for the ebbtide and the floodtide.
SUSPENDED-SEDIMENT DISCHARGE
Total suspended-sediment discharge, sand discharge, and silt-plus-clay discharge were determined at each cross sec tion from the water discharge and the suspended-sediment concentrations. The procedure was similar to the salt-dis charge computation. The average suspended-sediment con centrations used in the sediment-discharge computations were velocity-weighted averages of the five concentrations in the verticals.
STUDY RESULTS
TIDE AND WIND CONDITIONS
Sampling at Kings Bay and vicinity was conducted during a neap-tide period with an increasing tide range. Tide condi tions measured at four of the eight tide-stage recorders at upper and lower Kings Bay, Cumberland Island, and St. Marys Entrance are summarized in table 3. From July 9 to July 12, the tide range generally remained unchanged. From July 14 to July 16, the tide range increased, primarily be cause of an increasing high tide. On July 16, the tide range reached a maximum of 2.32 m at the upper Kings Bay gage, 2.20 m at the Cumberland Island gage, and 2.08 m at the St. Marys Entrance gage. Tide heights at the four gages and the differences between the tide heights at the gages may be subject to error because of uncertain elevation datums. The times of ebb and flood slack tides at the Kings Bay recorders generally lagged the times at the Cumberland Island gage by about 15 minutes and lagged those at the St. Marys En trance recorder by 5 to 25 minutes.
Wind-velocity data recorded at Kings Bay are presented in table 4.
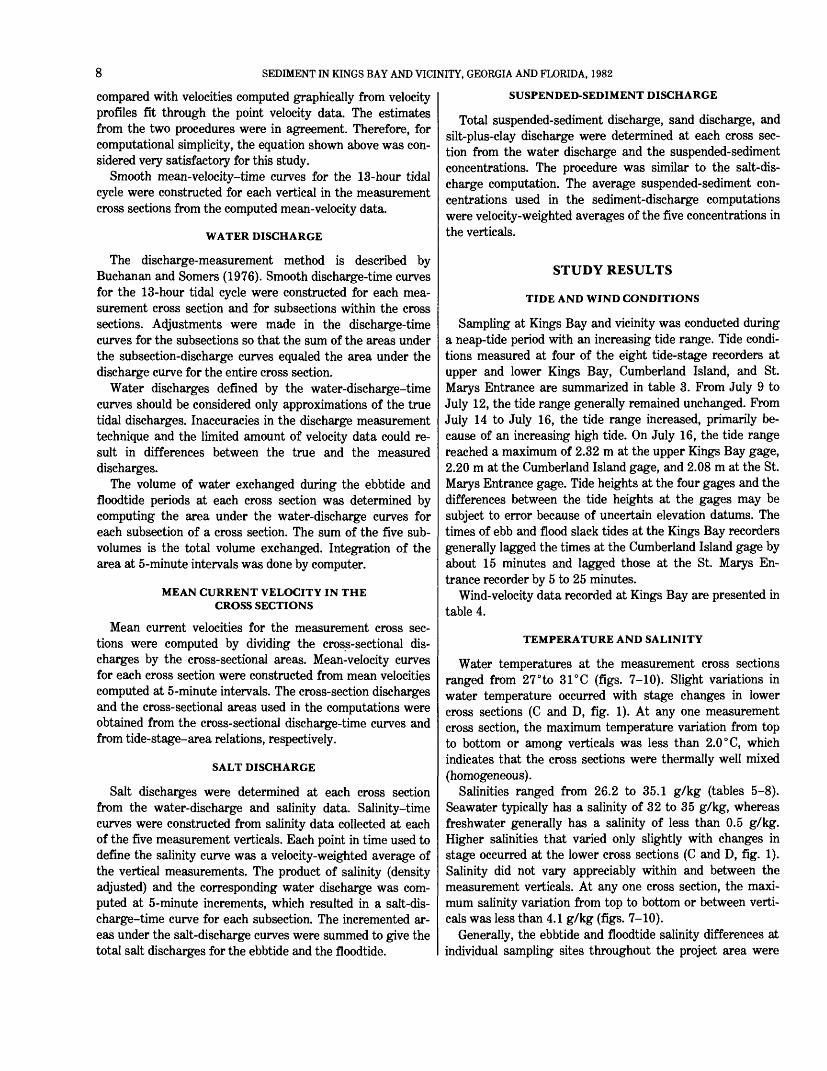
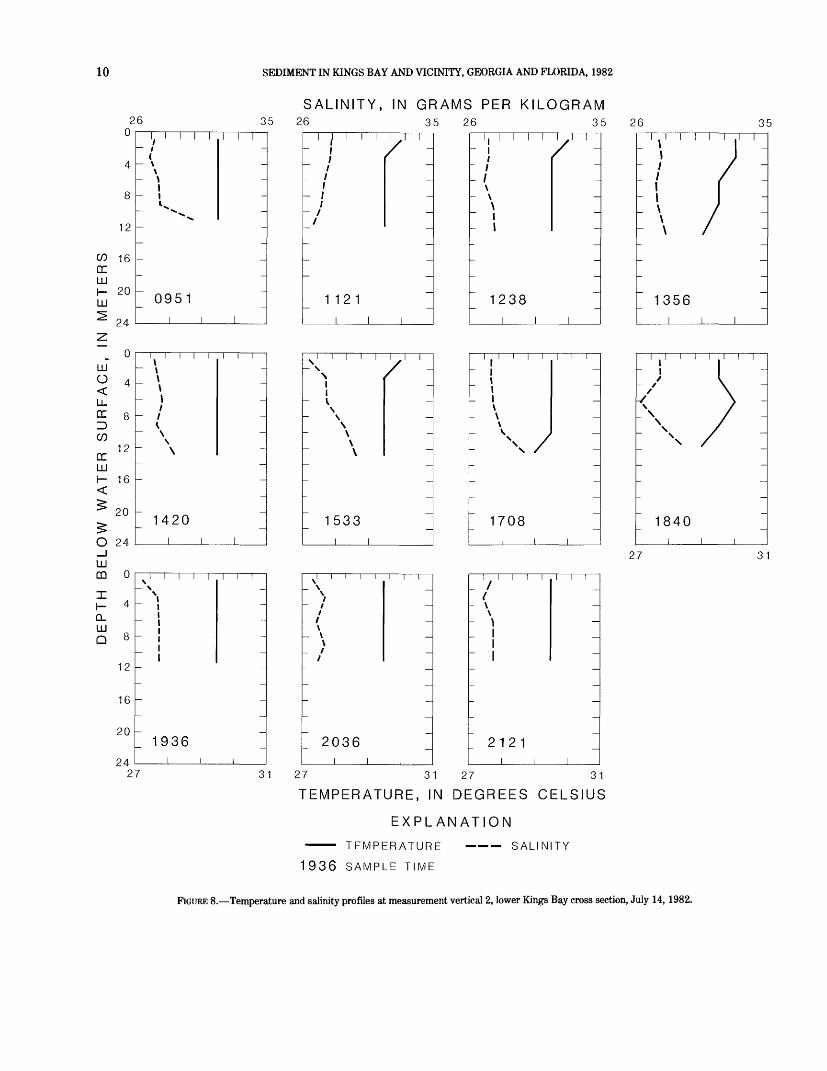
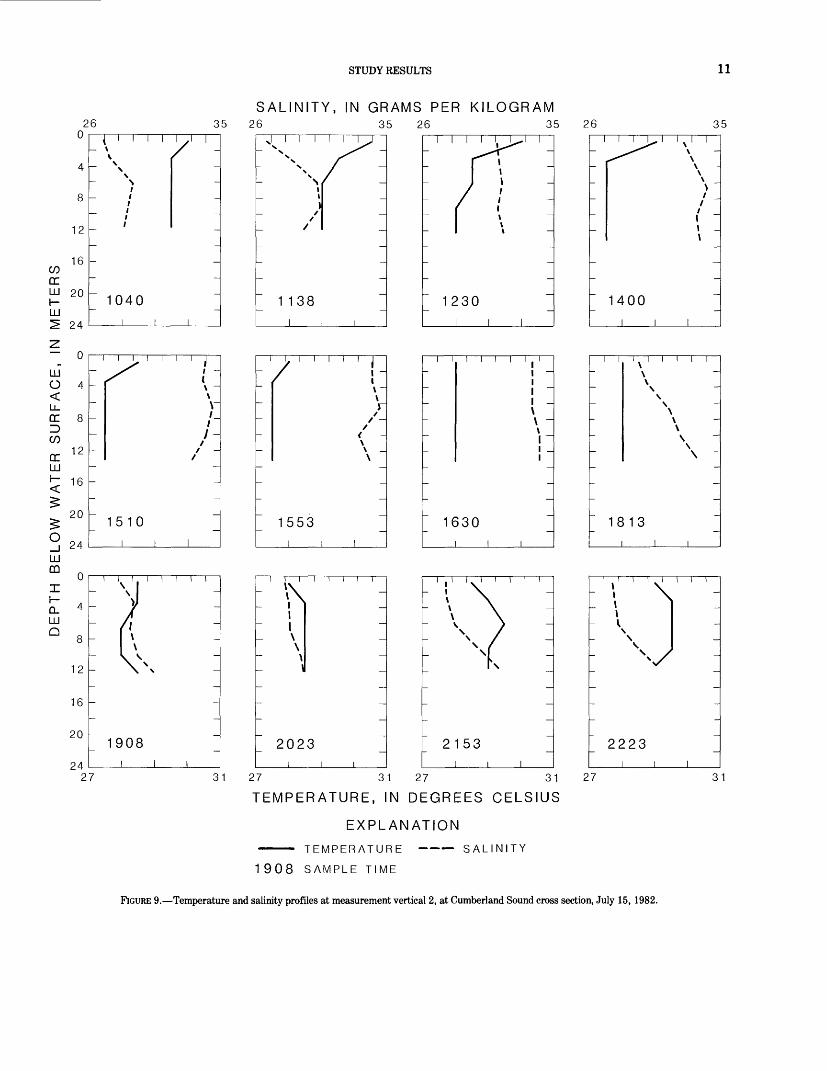
TEMPERATURE AND SALINITY
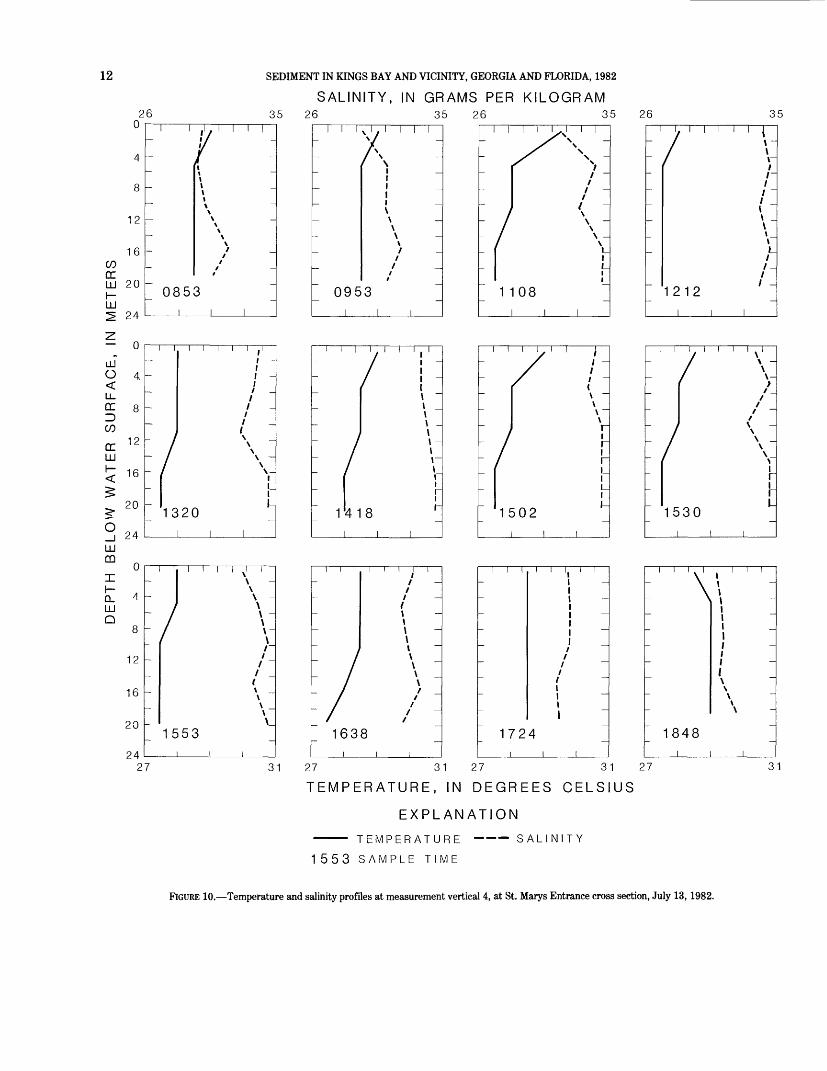
Water temperatures at the measurement cross sections ranged from 27°to 31°C (figs. 7-10). Slight variations in water temperature occurred with stage changes in lower cross sections (C and D, fig. 1). At any one measurement cross section, the maximum temperature variation from top to bottom or among verticals was less than 2.0 °C, which indicates that the cross sections were thermally well mixed (homogeneous).
Salinities ranged from 26.2 to 35.1 g/kg (tables 5-8). Seawater typically has a salinity of 32 to 35 g/kg, whereas freshwater generally has a salinity of less than 0.5 g/kg. Higher salinities that varied only slightly with changes in stage occurred at the lower cross sections (C and D, fig. 1). Salinity did not vary appreciably within and between the measurement verticals. At any one cross section, the maxi mum salinity variation from top to bottom or between verti cals was less than 4.1 g/kg (figs. 7-10).
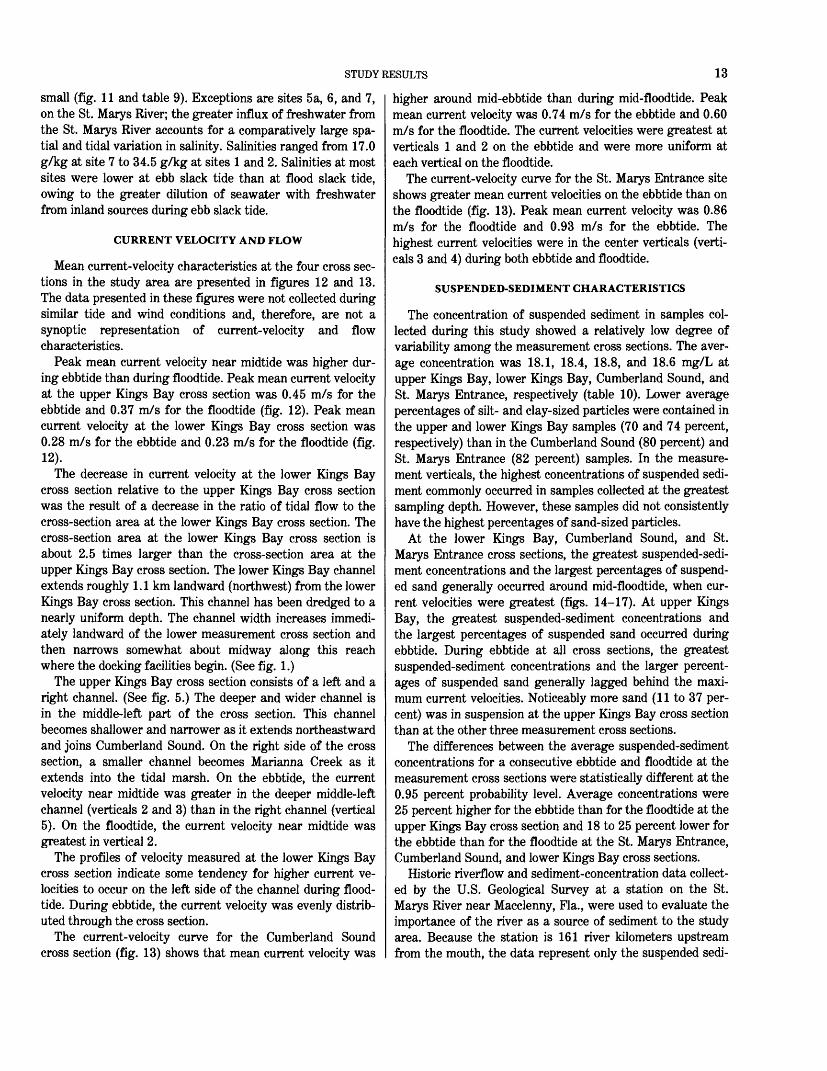
Generally, the ebbtide and floodtide salinity differences at individual sampling sites throughout the project area were
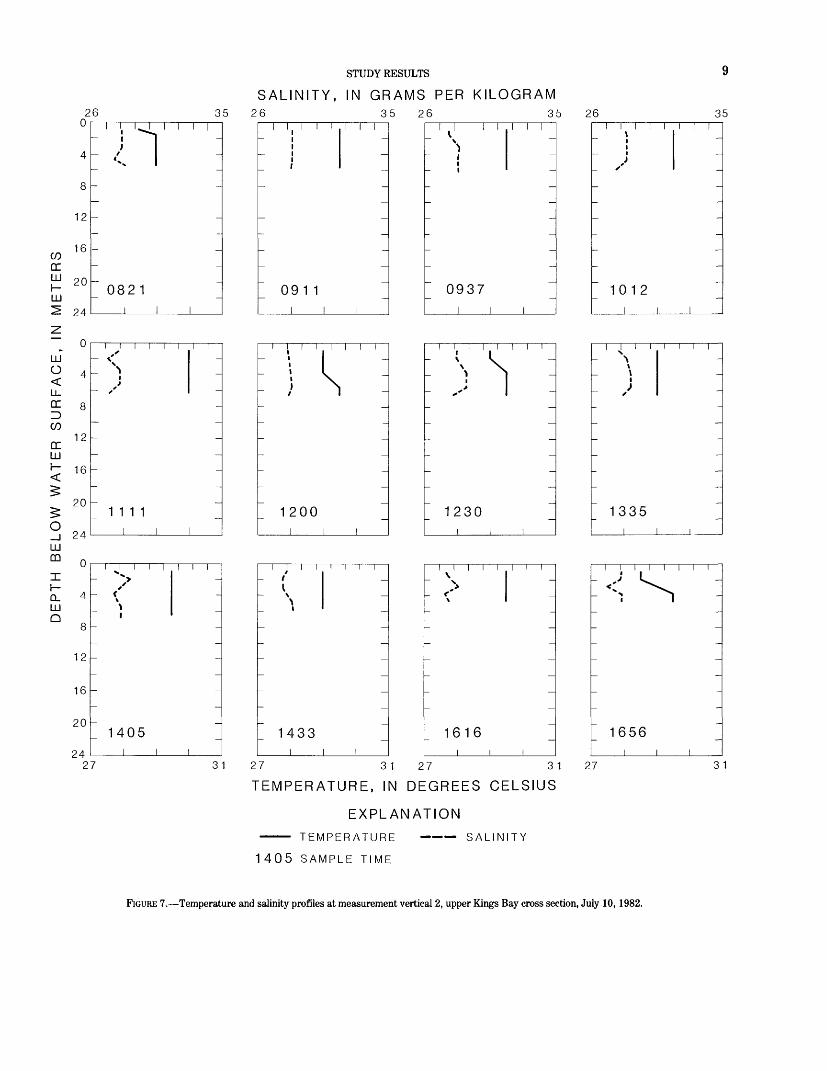
26
STUDY RESULTS
SALINITY, IN GRAMS PER KILOGRAM35 26 35 26 35 26 35
u
4
8
12
eo 16DC^ 20
LLJ ^ 24
~ 0
LLJ
< 4LL.<£ 8
COK 12
LLJ
< 16
20
O_J 24 LLJCD n 0I
CL 4 LLJ
8
12
16
20
242
I \ t l^l I
-
-
-
I 0821i i
i i i~ sX
x
-
-
-
1 1 1 1I I
I I I I I
~ 1
-
-
I 1405i i
7
I
I
I |
-
-
-
-
-
-
-
-
-
i i
-
-
-
-
3 1 2
I I I I
l
-
-
-
~_ 091 1
i i i i
/'-
-
-
1200,
I I I I /
\
-
-
I 1433i
7
I
I
i
I I I
-
-
-
I
i i i
-
-
-
-
-
I
i i i
_
-
-
-
I3 1 2
:'y "-
-
-
~ 0937
i i i i i: ^.»
-
-
-
1230i i
i i i i iV
~ \
-
-
-
" 1616i i
7
I I I
-
-
-
I
i i i
:-
-
-
-
i
_-
-
-
-
i3 1 2
l l I l i I I \ i i
: s :-_-"1012 ~
i i
i iii i \\ \
- ,*-
-
-
1335i
ii i i ~
r**1 --
-
-
I 1656 Ii
7 3
TEMPERATURE, IN DEGREES CELSIUS
EXPLANATION
TEMPERATURE SALINITY
1 405 SAMPLE TIME
FIGURE 7. Temperature and salinity profiles at measurement vertical 2, upper Kings Bay cross section, July 10, 1982.
10 SEDIMENT IN KINGS BAY AND VICINITY, GEORGIA AND FLORIDA, 1982
26
SALINITY, IN GRAMS PER KILOGRAM35 26 35 26 35 26 35
u
4
8
12
CO 16DCLLIh- 20 LLI
5 24
~ 0
LJJO 4
U.<£ 8
CO12
DCLLIh- 16
^ 20
O 24_JLLICD 0
Xh- 4Q_LJJ0 8
12
16
20
24
_ I, I I I
- \\
- \\lix
^^
_
~ 0951
i |
| | |\~ \ \\
- V/
- /\ \\
~
-
~ 1420
i i
N ' ' '- N
N-
_
~
-
I 1936i i
l i I
_
~
i
i i i
_-
-
-
i
1 i
-
~-
-
_i
jii i
_ ' _ /
f /i
i~
~ 1121i i
_\ ' ' ' 'N
- 1 1
\ \ \\ \\
-
~ 1533
i i
x l ! I I I
_ \
- /
/\
_ \ \
/
-
~ 2036i i
/ ̂ __
~
i
/ '--_- ---
-
i
i i
-
-
i
i, i i i i
- .- /
\- \
^~ '
1238i i
i i i i i
-_
\ \VN /
xs /-
-
" 1708i i
i i i i ii
f- \\ - \
-
-
" 2121i i
/ '-
_
_
~
1
1 1 1
-
_
-
-
-
1
1 1
_
-
-
_1
2
1 l 1 1 1 1 .1 1
'-' '-\ f
- 1 1 -_ \ /
\ /- \ /
~
~ 1356 ~_i i i
I I I I I I I I
>--
~_
- -
" 1840 ~i i i
7 31
27 31 27 31 27 31
TEMPERATURE, IN DEGREES CELSIUS
EXPLANATION
TEMPERATURE SALINITY
1 936 SAMPLE TIME
FIGURE 8. Temperature and salinity profiles at measurement vertical 2, lower Kings Bay cross section, July 14, 1982.
STUDY RESULTS
SALINITY, IN GRAMS PER KILOGRAM
11
26 0
4
8
12
16CODCLJJ 20 h-LLJ^ 24
Z o
»
LJJO 4^£U_ DC 8=> COa: 12LJJ
< 16
I 20
° 24^
^
-
_
_
_
_
_
~
~~
l I I I\V
X X
X
1If ff/
1040
i i
35 26
I J I/
r
-
_
_
~
-
~
I
-
I
-
-
-
LJJ
0 I
CL 4LJJf""N
8
12
16
20
?4
-
-
_
_
-
-
i i i i
/
1510
i i
iii i x Iy
n\\
X. X,X x
X x
1908i i
1 ' \i -
\ -\r / /f-
/ - -
-
i
N -
_
_
lX x
>
4
1
V
ii1
*t
35 261 1 J^s^ ^^
//
_
1138~1
l
i -
----
j | i' ' ' Jj
1 -
1 \ ~
\
r / -
\\ _ \ -
-
" 1553
i i
___ -
-
i
--__ -
-
l
i i
1
I\\\\
i
i
i -
_
-
35 26 3i^, ,_
[IJ »
/ / -i ~\ \ -
1230
i--
----
-I I
l l I I . i1
1 -j -
1 - \
\ _
I-
-
1630
i i i i
___ -
-
^ 2023i i
I I
\
l i
i i i i, i ii i~~ ^*^**^ ^ ~~^^^^ \
\ - \\
\/
1~ \
\ _\
-
1400-
i i
i i.i i i i i\\\- \ ~
X- x -
\\ -\
^ \X\ -
- --
1813
i i
i i i i i
\ _
: v \ -i_ -
~ 2
\ /x / _
\fr\
-
153 ~i i
: \"V":\Vx
- \ v
^N / -
-
~_ 2223 ~i i
27 31 27 31 27 31 27
TEMPERATURE,IN DEGREES CELSIUS
EXPLANATION
TEMPERATURE SALINITY
1 908 SAMPLE TIME
FIGURE 9. Temperature and salinity profiles at measurement vertical 2, at Cumberland Sound cross section, July 15,1982.
31
12
26
SEDIMENT IN KINGS BAY AND VICINITY, GEORGIA AND FLORIDA, 1982
SALINITY, IN GRAMS PER KILOGRAM35 26 35 26 35 26 35
u
4
12
16COOCLU 20 h-LJJ^ 24
_
-
_
l i'/ ' ' ' ''/a
\ _it _ii\ - \\ - \\
\ -'
/ / /
~ 0853
Z odJ 0 4
LLQC 8DCOcr 12LU
< 16
5»20
^6_J 24 -
-
_
i i
l 1
II N I . Ill~ * ~/ \
-
-
/ \
~\ \\\
/i
~ 0953
-
\
I I i l ,i/ -
i1 ~
11\ \ \ \ -
\ t~
L1L
'1320
UJm o I
Q_ 4UJQ
8
12
16
20
24
-
-
-
i
1 1
ii i i i j i
~_
: / M
\ ~\\\ - \
!r
1 !4 1 8 ^i i i
- _
-
-
/1
i
/
S
1 \ 1 1/ \s \
' ~ //
I ~\ -\ _\
[_1
108
1
/
150
i 1 1 l l\ \ \ -\\ - \\-
\_
l _
1(\ \\\\_
1553
27i i
i i i
i iii
\\\\ -
/ \ _i\ :\/ _// "
1638i i >
-
-
-~-~
i
~
1 1
/ ' ' ' 1~ / l ~/ \~ 1 \~
l~I
~~ fi\\ \\\L
//
"1212 ' ~
i
/ '/II\ -\\\rr ir}-iii
2i i
:'/' "Y
~ 1 ~
/ ~I
; / \riri_
1530
|
i i i i i
/// //ii1
~_ 1724
31 27 31 27i i
: y":-
~~ ~
I\\ \\\ -
~_ 1848 ~i
31 27 3
TEMPERATURE, IN DEGREES CELSIUS
EXPLANATION
TEMPERATURE 1553 SAMPLE TIME
SALINITY
FIGURE 10. Temperature and salinity profiles at measurement vertical 4, at St. Marys Entrance cross section, July 13, 1982.
STUDY RESULTS 13
small (fig. 11 and table 9). Exceptions are sites 5a, 6, and 7, on the St. Marys River; the greater influx of freshwater from the St. Marys River accounts for a comparatively large spa tial and tidal variation in salinity. Salinities ranged from 17.0 g/kg at site 7 to 34.5 g/kg at sites 1 and 2. Salinities at most sites were lower at ebb slack tide than at flood slack tide, owing to the greater dilution of seawater with freshwater from inland sources during ebb slack tide.
CURRENT VELOCITY AND FLOW
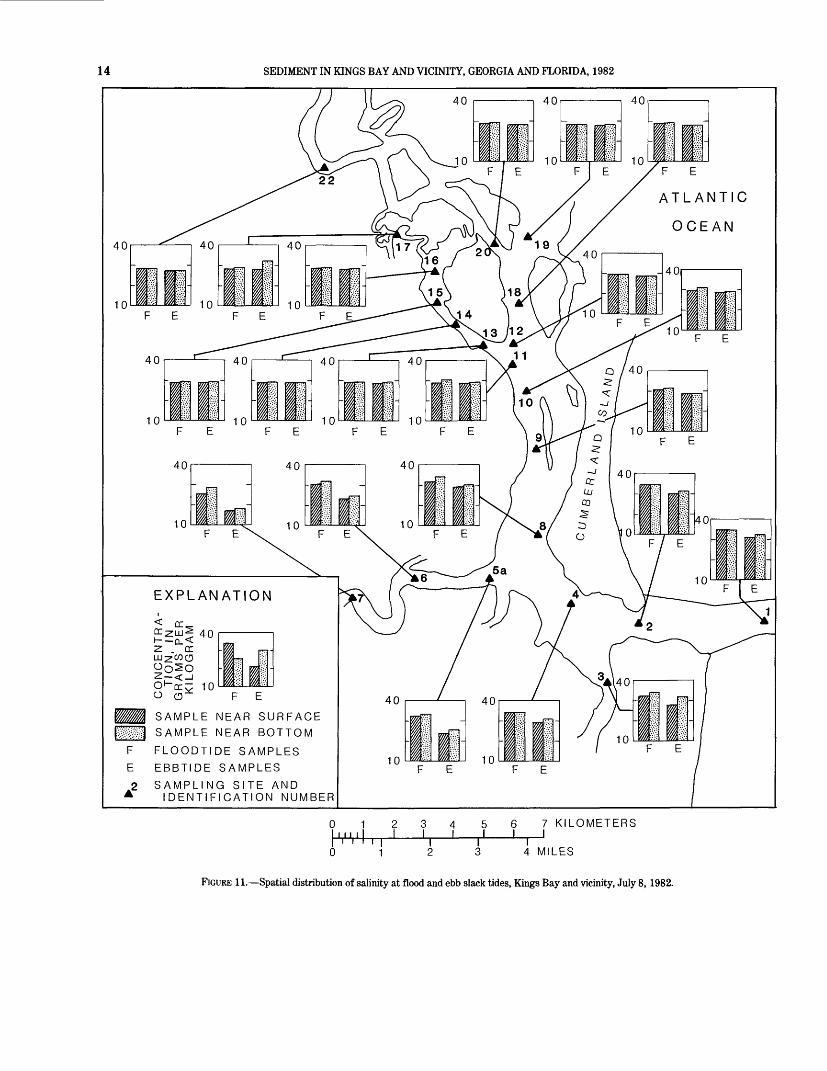
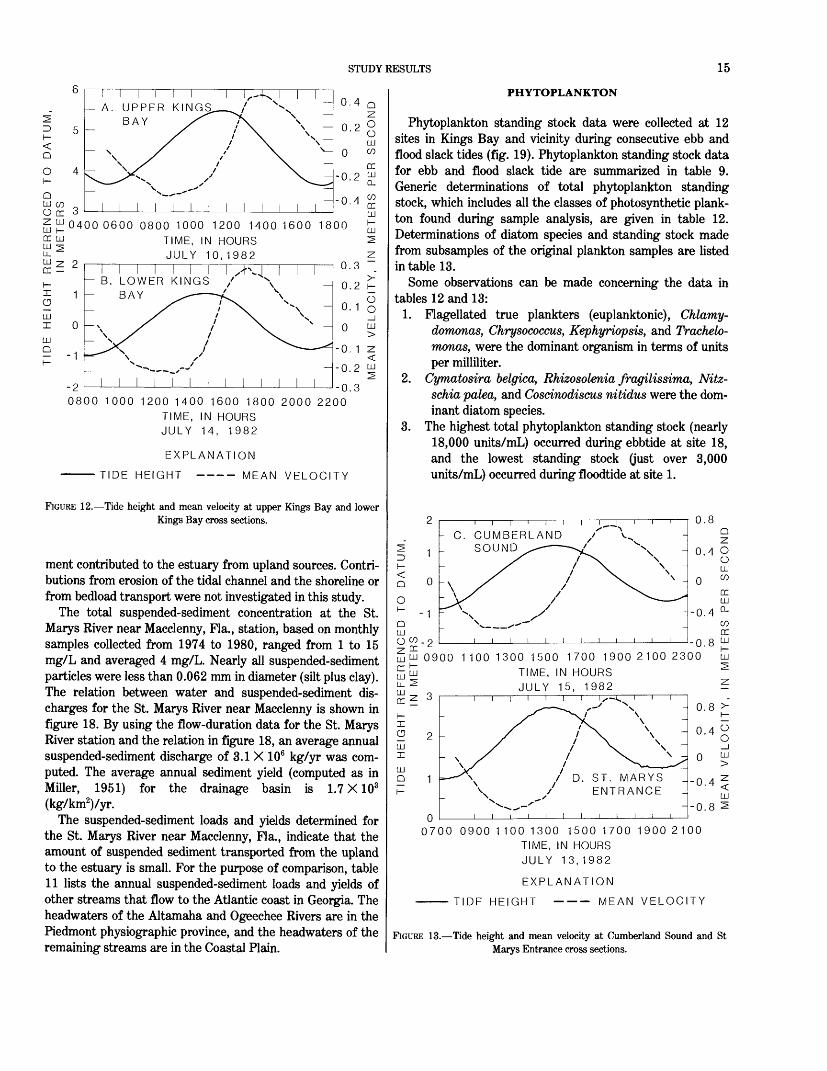
Mean current-velocity characteristics at the four cross sec tions in the study area are presented in figures 12 and 13. The data presented in these figures were not collected during similar tide and wind conditions and, therefore, are not a synoptic representation of current-velocity and flow characteristics.
Peak mean current velocity near midtide was higher dur ing ebbtide than during floodtide. Peak mean current velocity at the upper Kings Bay cross section was 0.45 m/s for the ebbtide and 0.37 m/s for the floodtide (fig. 12). Peak mean current velocity at the lower Kings Bay cross section was 0.28 m/s for the ebbtide and 0.23 m/s for the floodtide (fig. 12).
The decrease in current velocity at the lower Kings Bay cross section relative to the upper Kings Bay cross section was the result of a decrease in the ratio of tidal flow to the cross-section area at the lower Kings Bay cross section. The cross-section area at the lower Kings Bay cross section is about 2.5 times larger than the cross-section area at the upper Kings Bay cross section. The lower Kings Bay channel extends roughly 1.1 km landward (northwest) from the lower Kings Bay cross section. This channel has been dredged to a nearly uniform depth. The channel width increases immedi ately landward of the lower measurement cross section and then narrows somewhat about midway along this reach where the docking facilities begin. (See fig. 1.)
The upper Kings Bay cross section consists of a left and a right channel. (See fig. 5.) The deeper and wider channel is in the middle-left part of the cross section. This channel becomes shallower and narrower as it extends northeastward and joins Cumberland Sound. On the right side of the cross section, a smaller channel becomes Marianna Creek as it extends into the tidal marsh. On the ebbtide, the current velocity near midtide was greater in the deeper middle-left channel (verticals 2 and 3) than in the right channel (vertical 5). On the floodtide, the current velocity near midtide was greatest in vertical 2.
The profiles of velocity measured at the lower Kings Bay cross section indicate some tendency for higher current ve locities to occur on the left side of the channel during flood- tide. During ebbtide, the current velocity was evenly distrib uted through the cross section.
The current-velocity curve for the Cumberland Sound cross section (fig. 13) shows that mean current velocity was
higher around mid-ebbtide than during mid-floodtide. Peak mean current velocity was 0.74 m/s for the ebbtide and 0.60 m/s for the floodtide. The current velocities were greatest at verticals 1 and 2 on the ebbtide and were more uniform at each vertical on the floodtide.
The current-velocity curve for the St. Marys Entrance site shows greater mean current velocities on the ebbtide than on the floodtide (fig. 13). Peak mean current velocity was 0.86 m/s for the floodtide and 0.93 m/s for the ebbtide. The highest current velocities were in the center verticals (verti cals 3 and 4) during both ebbtide and floodtide.
SUSPENDED-SEDIMENT CHARACTERISTICS
The concentration of suspended sediment in samples col lected during this study showed a relatively low degree of variability among the measurement cross sections. The aver age concentration was 18.1, 18.4, 18.8, and 18.6 mg/L at upper Kings Bay, lower Kings Bay, Cumberland Sound, and St. Marys Entrance, respectively (table 10). Lower average percentages of silt- and clay-sized particles were contained in the upper and lower Kings Bay samples (70 and 74 percent, respectively) than in the Cumberland Sound (80 percent) and St. Marys Entrance (82 percent) samples. In the measure ment verticals, the highest concentrations of suspended sedi ment commonly occurred in samples collected at the greatest sampling depth. However, these samples did not consistently have the highest percentages of sand-sized particles.
At the lower Kings Bay, Cumberland Sound, and St. Marys Entrance cross sections, the greatest suspended-sedi ment concentrations and the largest percentages of suspend ed sand generally occurred around mid-floodtide, when cur rent velocities were greatest (figs. 14-17). At upper Kings Bay, the greatest suspended-sediment concentrations and the largest percentages of suspended sand occurred during ebbtide. During ebbtide at all cross sections, the greatest suspended-sediment concentrations and the larger percent ages of suspended sand generally lagged behind the maxi mum current velocities. Noticeably more sand (11 to 37 per cent) was in suspension at the upper Kings Bay cross section than at the other three measurement cross sections.
The differences between the average suspended-sediment concentrations for a consecutive ebbtide and floodtide at the measurement cross sections were statistically different at the 0.95 percent probability level. Average concentrations were 25 percent higher for the ebbtide than for the floodtide at the upper Kings Bay cross section and 18 to 25 percent lower for the ebbtide than for the floodtide at the St. Marys Entrance, Cumberland Sound, and lower Kings Bay cross sections.
Historic riverflow and sediment-concentration data collect ed by the U.S. Geological Survey at a station on the St. Marys River near Macclenny, Fla., were used to evaluate the importance of the river as a source of sediment to the study area. Because the station is 161 river kilometers upstream from the mouth, the data represent only the suspended sedi-
14 SEDIMENT IN KINGS BAY AND VICINITY, GEORGIA AND FLORIDA, 1982
F E
ATLANTIC
OCEAN
10
10
EXPLANATION1< QCDC 2LJJ^ 40 I Q_<2 . a:
10O F E
/////A SAMPLE NEAR SURFACE
U SAMPLE NEAR BOTTOM
F FLOODTIDE SAMPLES
E EBBTIDE SAMPLES
2 SAMPLING SITE ANDA IDENTIFICATION NUMBER
01 234567 KILOMETERS Iiii i I I I I I I I
4 MILES
FIGURE 11. Spatial distribution of salinity at flood and ebb slack tides, Kings Bay and vicinity, July 8, 1982.
STUDY RESULTS 15
5 -
Q
oH
Q LU OzLU CC LU LL LU CC
H X
gLUI
LU Q
A. UPPER KINGS BAY
4
COcc[±±0400 0600 0800 1000 1200 1400 1600 1800 m TIME, IN HOURS
JULY 10,1982
1
0
-1
-2
B. LOWER KINGS / BAY
0.3
0.2
0.1
0
-0. 1
-0.2
-0.3
LU
0800 1000 1200 1400 1600 1800 2000 2200 TIME, IN HOURS JULY 14, 1982
EXPLANATION
TIDE HEIGHT MEAN VELOCITY
FIGURE 12. Tide height and mean velocity at upper Kings Bay and lower Kings Bay cross sections.
ment contributed to the estuary from upland sources. Contri butions from erosion of the tidal channel and the shoreline or from bedload transport were not investigated in this study.
The total suspended-sediment concentration at the St. Marys River near Macclenny, Fla., station, based on monthly samples collected from 1974 to 1980, ranged from 1 to 15 mg/L and averaged 4 mg/L. Nearly all suspended-sediment particles were less than 0.062 mm in diameter (silt plus clay). The relation between water and suspended-sediment dis charges for the St. Marys River near Macclenny is shown in figure 18. By using the flow-duration data for the St. Marys River station and the relation in figure 18, an average annual suspended-sediment discharge of 3.1 X 10⁶ kg/yr was com puted. The average annual sediment yield (computed as in Miller, 1951) for the drainage basin is 1.7 X 10³ (kg/km2)/yr.
The suspended-sediment loads and yields determined for the St. Marys River near Macclenny, Fla., indicate that the amount of suspended sediment transported from the upland to the estuary is small. For the purpose of comparison, table 11 lists the annual suspended-sediment loads and yields of other streams that flow to the Atlantic coast in Georgia. The headwaters of the Altamaha and Ogeechee Rivers are in the Piedmont physiographic province, and the headwaters of the remaining streams are in the Coastal Plain.
PHYTOPLANKTON
Phytoplankton standing stock data were collected at 12 sites in Kings Bay and vicinity during consecutive ebb and flood slack tides (fig. 19). Phytoplankton standing stock data for ebb and flood slack tide are summarized in table 9. Generic determinations of total phytoplankton standing stock, which includes all the classes of photosynthetic plank ton found during sample analysis, are given in table 12. Determinations of diatom species and standing stock made from subsamples of the original plankton samples are listed in table 13.
Some observations can be made concerning the data in tables 12 and 13:
1. Flagellated true plankters (euplanktonic), Chlamy- domonas, Chrysococcus, Kephyriopsis, and Trachelo- monas, were the dominant organism in terms of units per milliliter.
2. Cymatosira belgica, Rhizosolenia fragilissima, Nitz- schia palea, and Coscinodiscus nitidus were the dom inant diatom species.
3. The highest total phytoplankton standing stock (nearly 18,000 units/mL) occurred during ebbtide at site 18, and the lowest standing stock (just over 3,000 units/mL) occurred during floodtide at site 1.
i i i i
- C. CUMBERLAND SOUND
GC0900 1100 1300 1500 1700 1900 2100 2300 LU
TIME, IN HOURS 5JULY 15, 1982 ?
~i i | i r
0700 0900 1100 1300 1500 1700 1900 2100 TIME, IN HOURS JULY 13,1982
EXPLANATION
TIDE HEIGHT MEAN VELOCITY
FIGURE 13. Tide height and mean velocity at Cumberland Sound and St Marys Entrance cross sections.
16 SEDIMENT IN KINGS BAY AND VICINITY,
Q O O
Q O O
Q ZO O LU C/3
DC LU Q_
C/5DC LU h- LJJ
mCD
O LLJ
m^O Q
z 8LUODC< m X CD O LLJc/3Q Q
a: 8LU _i
Q O O
-3000600 0800 1000 1200 1400 1600 1800
TIME, IN HOURS
EXPLANATION
SAND CONCENTRATION
SILT-CLAY CONCENTRATION
MEAN WATER DISCHARGE
FIGURE 14. Mean water discharge and mean suspended-sediment concen tration at the measurement verticals at the upper Kings Bay cross section, July 10, 1982.
GEORGIA AND FLORIDA, 1982
400
COco 200LLJ
O O
DC LU Q_
C/3crLU h- LU
O
m
ou
LU O DC
I O C/3Q
LU h- <
-4000800
DC LU
DC LU Q.
03
DC O
Or-
ocr- Z LU Ozo o
LU
^Q LU 03
Q LU Q Z LU Q_ 03 ^) 03
1200 1600 2000
TIME, IN HOURS
EXPLANATION
SAND CONCENTRATION
SILT-CLAY CONCENTRATION
MEAN WATER DISCHARGE
FIGURE 15. Mean water discharge and mean suspended-sediment concen tration at the measurement verticals at the lower Kings Bay cross section, July 14, 1982.
STUDY RESULTS 17
OoLU V)
ccLU Q.
CO CC LU h- LU
OCD D O
LU O CC<X O V)
CC LU
-30000800 1200 1600 2000 2400
TIME, IN HOURS
EXPLANATION
SAND CONCENTRATION
SILT-CLAY CONCENTRATION
MEAN WATER DISCHARGE
FIGURE 16. Mean water discharge and mean suspended-sediment concen tration at measurement verticals at the Cumberland Sound cross section, July 15, 1982.
O O LU CO
CC LU Q_
CO CC LUK LU
CD
Q O O
§o
Q -
O '
Q O O
VERTICAL 1
VERTICAL 2
4000300020001000
01000200030004000
VERTICAL 3
4000300020001000
0100020003000
4000
VERTICAL 4
VERTICAL 5
00800 1000 1200 1400 1600 1800 2000 2200
TIME, IN HOURS
EXPLANATION
SAND CONCENTRATION
SILT-CLAY CONCENTRATION
MEAN WATER DISCHARGE
FIGURE 17. Mean water discharge and mean suspended-sediment concen tration at measurement verticals at the St. Marys Entrance cross section, July 13, 1982.
18 SEDIMENT IN KINGS BAY AND VICINITY, GEORGIA AND FLORIDA, 1982
1000
oco
o cc <o 0
Q LUco 1 0h-
z cc
Q LU CO
QLU Q
LU CL COD
0.1
Itt
! I
0.1 1 10 100 1000
WATER DISCHARGE, IN CUBIC METERS
PER SECOND
FIGURE 18. Relation between water and suspended-sediment discharges, St. Marys River near Macclenny, Fla., 1974-80 water years.
4. Within the plankton diatom assemblage, life forms from euplanktonic (truly planktonic), benthic (marsh soils and vegetation), and tychoplanktonic (normally benthic, but often suspended and living in the water column) origins were found.
5. The euplanktonic diatom species comprised only 25 per cent of the total diatom assemblage.
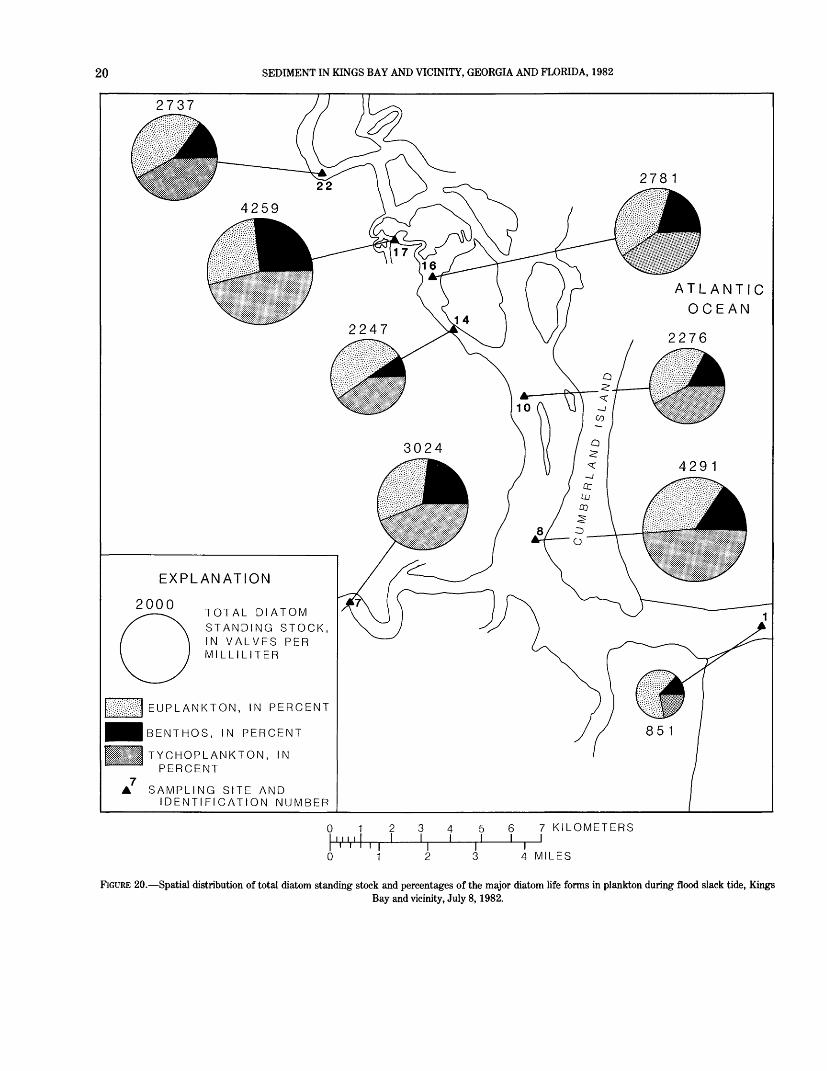
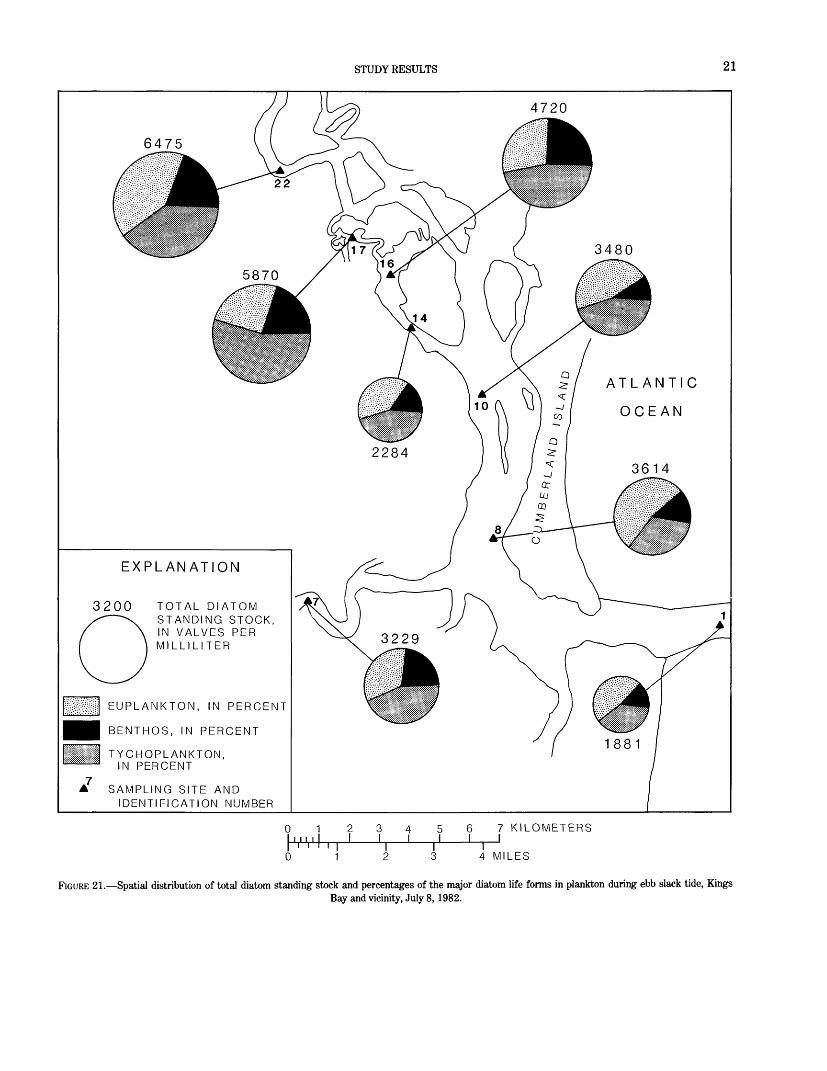
6. Ebbtide samples generally had higher diatom species standing stock values than floodtide samples (figs. 20, 21).
7. Ebbtide samples from most sites generally included a greater number of benthic species and individuals de rived from the tidal marsh.
8. Cymatosira belgica, the dominant diatom in all sam ples, also had higher standing stock values during ebbtide than floodtide.
9. The highest counts of Cymatosira belgica (tycho planktonic) in plankton generally occurred during ebb tide at stations nearest the marsh (sites 22, 17, 16, and 13).
10. On floodtide, site 1 had the highest percentage of the diatom species standing stock consisting of truly planktonic forms (64 percent), and on ebbtide, site 17 had the lowest percentage of such diatom species standing stock (25 percent) (figs. 20, 21).
SUSPENDED TOTAL ORGANIC CARBON
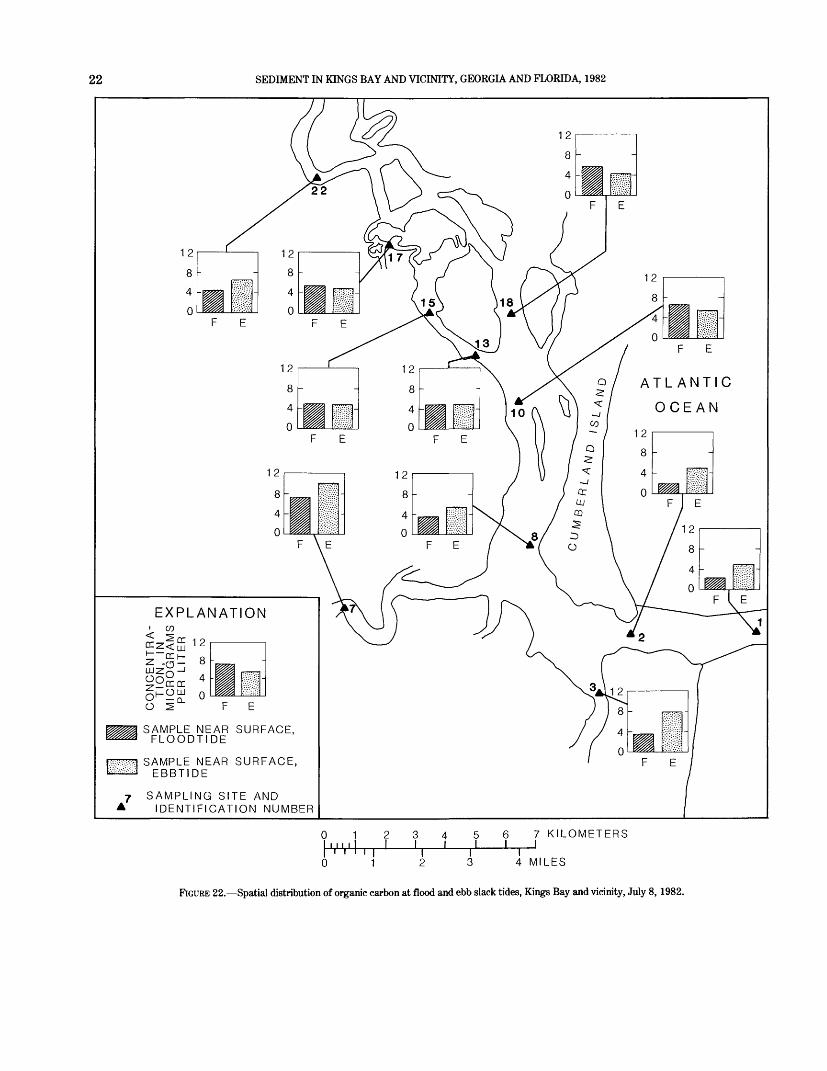
Total organic carbon data were collected at 11 locations in the Kings Bay study area at consecutive ebb and flood slack tides (table 9 and fig. 22). The site location numbers corre spond to the site locations and numbers in figure 1.
Observations and salient points concerning the ebb and flood slack tide total organic carbon survey are as follows:1. Total organic carbon concentrations were generally uni
form throughout the study area.2. Generally, organic carbon concentrations were greater
during ebb slack tide than during flood slack tide.3. The highest concentration of total organic carbon (10
jig/L) occurred at site 7 in the St. Marys River at ebb slack tide, and the lowest concentration (1.9 jig/L) occurred at site 2 in St. Marys Entrance at floodtide.
TURBIDITY
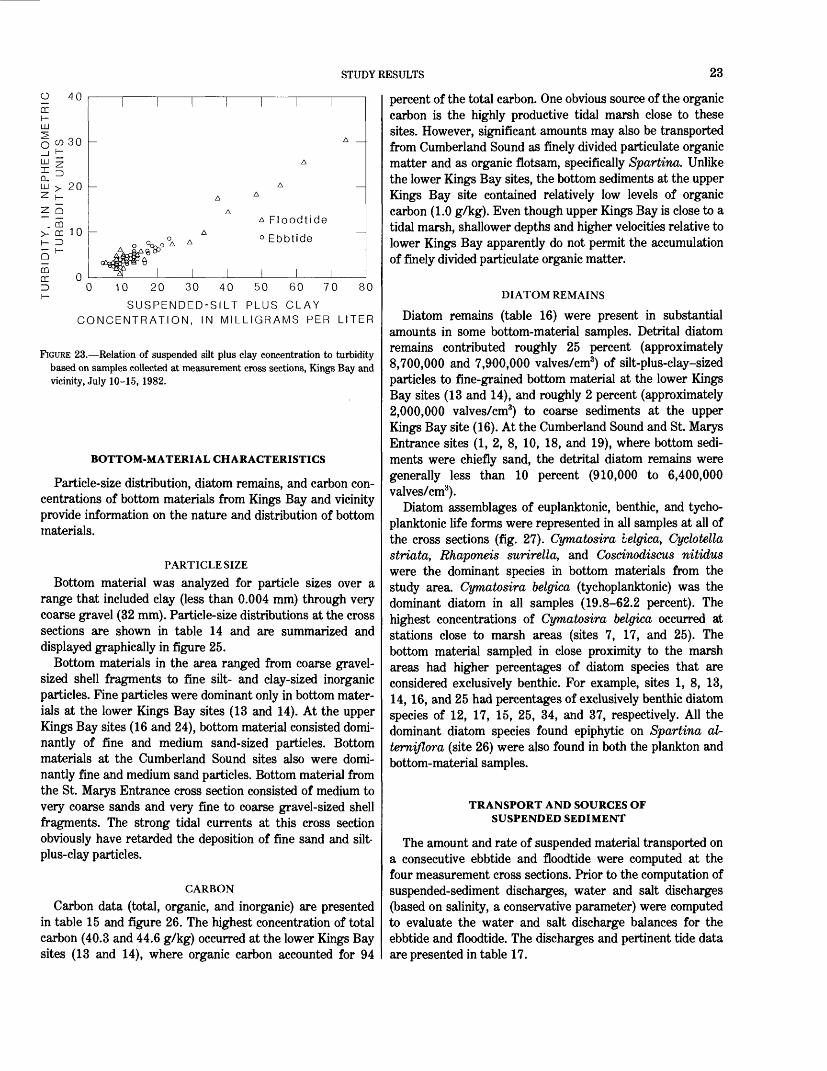
The relation between turbidity and suspended-sediment concentration was investigated in Kings Bay and vicinity to determine if turbidity data could be used to indicate changes in suspended-sediment concentration during the July data- collection period. No universal relation between turbidity and suspended-sediment concentration exists because of the highly variable nature of the suspended material. A good association may exist, however, between these parameters at specific locations and times. A relation between these param eters could provide relatively inexpensive real-time estimates of suspended-sediment concentration to supplement data col lected by direct sampling and later laboratory analyses.
The turbidity-suspended-sediment concentration curve for field data collected at the four measurement cross sections is presented in figure 23. A reasonable relation exists between the two parameters, at least for the July measurement peri od. The rather uniform distribution of ebbtide and floodtide data points illustrates that the relation is similar during ebb tide and floodtide. The possibility of seasonal variability in the composition of the suspended sediment requires that the relation be established for each sampling period.
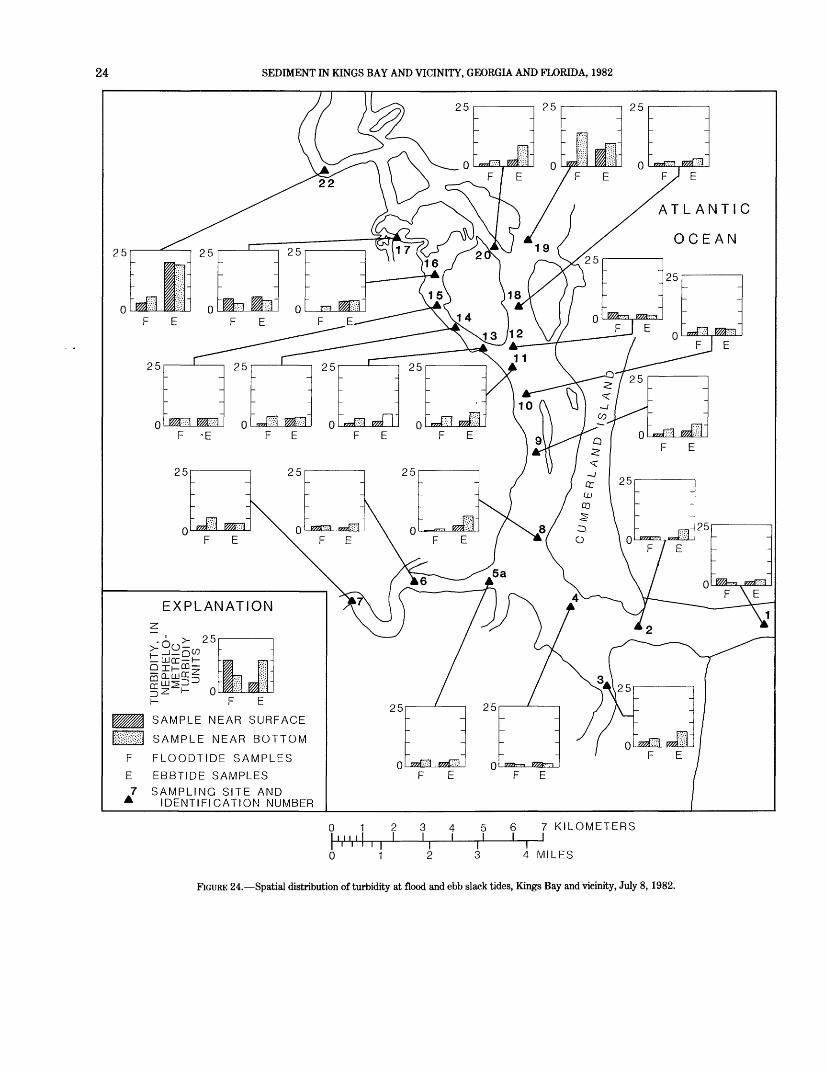
Turbidity data also were collected at 22 locations in the Kings Bay study area at consecutive ebb and flood slack tides (fig. 24 and table 9).
Observations and salient points concerning the ebb and flood slack tide turbidity survey are as follows:1. Turbidity, generally, was greater during ebb slack tide
than flood slack tide.2. The highest turbidities occurred in the Crooked River at
site 22 during ebb slack tide.3. Turbidity was generally higher at the bottom than at the
top of the water column.4. Relative to the other sites, higher turbidities occurred in
the upper part of Cumberland Sound (site 19).
STUDY RESULTS 19
20,000
20,000
Q/ ATLANTIC
o o
iSAMPLE NEAR SURFACE, I FLOODTIDE
SAMPLE NEAR SURFACE, EBBTIDE
SAMPLING SITE AND IDENTIFICATION NUMBER
01 234567 KILOMETERS I t n i I I I I I I I
M101234 MILES
FIGURE 19. Spatial distribution of phytoplankton at flood and ebb slack tides, Kings Bay and vicinity, July 8, 1982.
20 SEDIMENT IN KINGS BAY AND VICINITY, GEORGIA AND FLORIDA, 1982
2737
2781
ATLANTIC
OCEAN
EXPLANATION
2000TOTAL DIATOM
STANDING STOCK, IN VALVES PER MILLILITER
£$ EUPLANKTON, IN PERCENT
BENTHOS, IN PERCENT
TYCHOPLANKTON, IN PERCENT
A SAMPLING SITE ANDIDENTIFICATION NUMBER
0 1 I MI il
3 4 I I
7 KILOMETERS J
I ' ' ' ' I0 1 4 MILES
FIGURE 20. Spatial distribution of total diatom standing stock and percentages of the major diatom life forms in plankton during flood slack tide, KingsBay and vicinity, July 8, 1982.
STUDY RESULTS 21
4720
6475
3200
ATLANTIC
OCEAN
EXPLANATION
TOTAL DIATOM STANDING STOCK IN VALVES PER MILLILITER
EUPLANKTON, IN PERCENT
BENTHOS, IN PERCENT
TYCHOPLANKTON, IN PERCENT
SAMPLING SITE AND IDENTIFICATION NUMBER
0 1 I i 11 i I
3 4 I I
7 KILOMETERS J
4 MILES
FIGURE 21. Spatial distribution of total diatom standing stock and percentages of the major diatom life forms in plankton during ebb slack tide, KingsBay and vicinity, July 8, 1982.
22 SEDIMENT IN KINGS BAY AND VICINITY, GEORGIA AND FLORIDA, 1982
12
ATLANTIC
OCEAN
12
EXPLANATION
SAMPLE NEAR SURFACE, ^ FLOODTIDE
m SAMPLE NEAR SURFACE, £1 EBBTIDE
7 SAMPLING SITE ANDIDENTIFICATION NUMBER
7 KILOMETERS J
M1 4 MILES
FIGURE 22. Spatial distribution of organic carbon at flood and ebb slack tides, Kings Bay and vicinity, July 8,1982.
STUDY RESULTS 23
' -' H U
Ei LJJ
Q OT 30
iiUJ >. 202 h-
? Q00
>- or 10h- Z)
m«- H
i 1 1
_ A _
A
_ A _
A
AA Floodtide
n °A A ° EbbtideA ° Sfc0°m^ i ,
0 8010 20 30 40 50 60 70
SUSPENDED-SILT PLUS CLAY
CONCENTRATION, IN MILLIGRAMS PER LITER
FIGURE 23. Relation of suspended silt plus clay concentration to turbidity based on samples collected at measurement cross sections, Kings Bay and vicinity, July 10-15, 1982.
BOTTOM-MATERIAL CHARACTERISTICS
Particle-size distribution, diatom remains, and carbon con centrations of bottom materials from Kings Bay and vicinity provide information on the nature and distribution of bottom materials.
PARTICLE SIZE
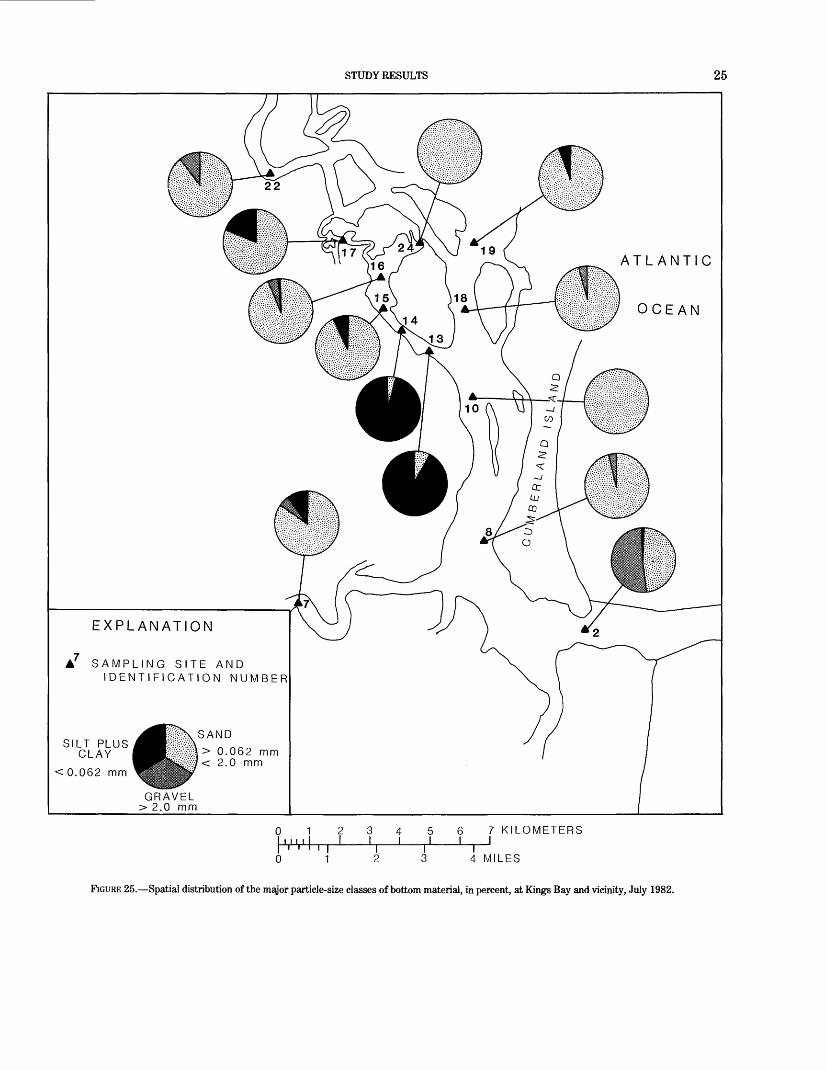
Bottom material was analyzed for particle sizes over a range that included clay (less than 0.004 mm) through very coarse gravel (32 mm). Particle-size distributions at the cross sections are shown in table 14 and are summarized and displayed graphically in figure 25.
Bottom materials in the area ranged from coarse gravel- sized shell fragments to fine silt- and clay-sized inorganic particles. Fine particles were dominant only in bottom mater ials at the lower Kings Bay sites (13 and 14). At the upper Kings Bay sites (16 and 24), bottom material consisted domi- nantly of fine and medium sand-sized particles. Bottom materials at the Cumberland Sound sites also were domi- nantly fine and medium sand particles. Bottom material from the St. Marys Entrance cross section consisted of medium to very coarse sands and very fine to coarse gravel-sized shell fragments. The strong tidal currents at this cross section obviously have retarded the deposition of fine sand and silt- plus-clay particles.
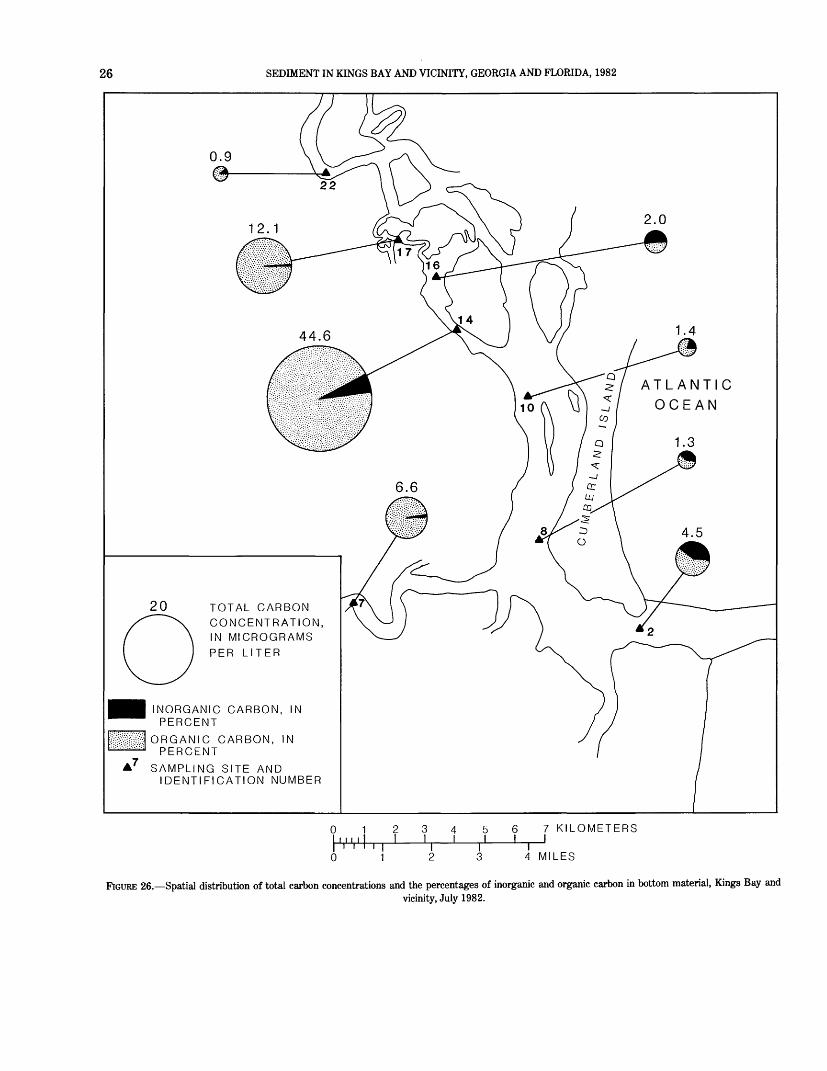
CARBON
Carbon data (total, organic, and inorganic) are presented in table 15 and figure 26. The highest concentration of total carbon (40.3 and 44.6 g/kg) occurred at the lower Kings Bay sites (13 and 14), where organic carbon accounted for 94
percent of the total carbon. One obvious source of the organic carbon is the highly productive tidal marsh close to these sites. However, significant amounts may also be transported from Cumberland Sound as finely divided particulate organic matter and as organic flotsam, specifically Spartina. Unlike the lower Kings Bay sites, the bottom sediments at the upper Kings Bay site contained relatively low levels of organic carbon (1.0 g/kg). Even though upper Kings Bay is close to a tidal marsh, shallower depths and higher velocities relative to lower Kings Bay apparently do not permit the accumulation of finely divided particulate organic matter.
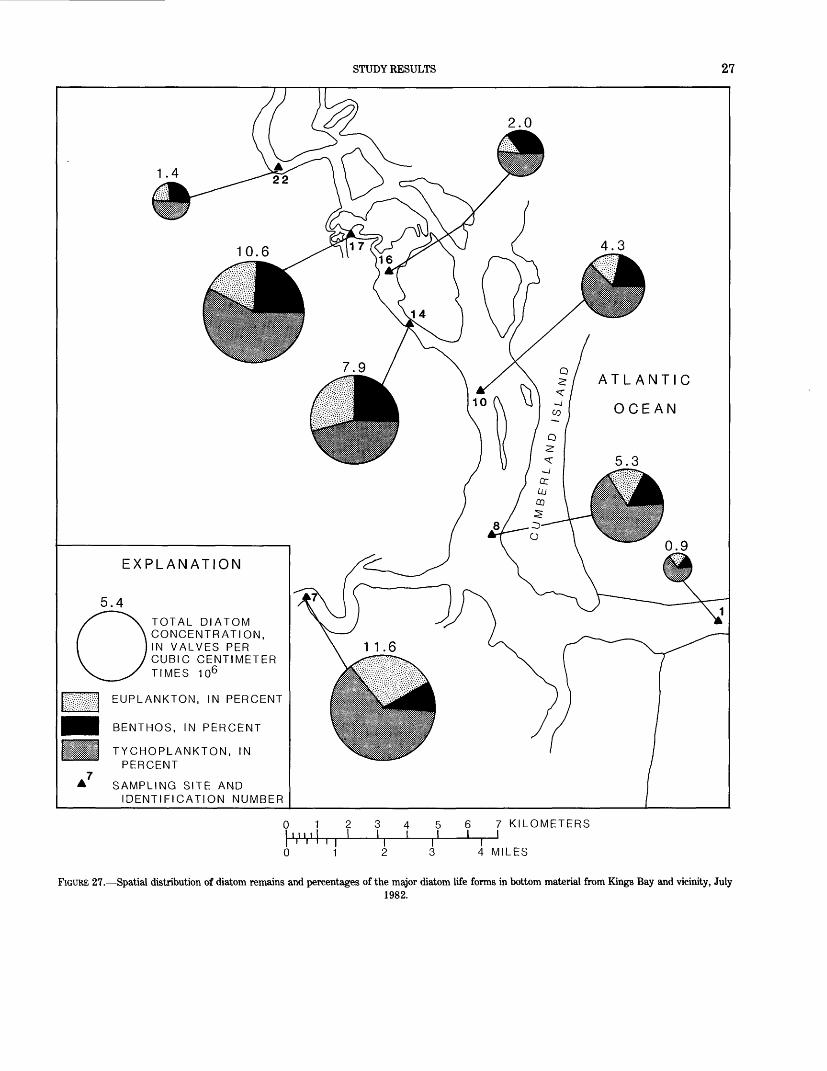
DIATOM REMAINS
Diatom remains (table 16) were present in substantial amounts in some bottom-material samples. Detrital diatom remains contributed roughly 25 percent (approximately 8,700,000 and 7,900,000 valves/cm3) of silt-plus-clay-sized particles to fine-grained bottom material at the lower Kings Bay sites (13 and 14), and roughly 2 percent (approximately 2,000,000 valves/cm3) to coarse sediments at the upper Kings Bay site (16). At the Cumberland Sound and St. Marys Entrance sites (1, 2, 8, 10, 18, and 19), where bottom sedi ments were chiefly sand, the detrital diatom remains were generally less than 10 percent (910,000 to 6,400,000 valves/cm3).
Diatom assemblages of euplanktonic, benthic, and tycho- planktonic life forms were represented in all samples at all of the cross sections (fig. 27). Cymatosira lelgica, Cyclotella striata, Rhaponeis surirella, and Cosdnodiscus nitidus were the dominant species in bottom materials from the study area. Cymatosira belgica (tychoplanktonic) was the dominant diatom in all samples (19.8-62.2 percent). The highest concentrations of Cymatosira belgica occurred at stations close to marsh areas (sites 7, 17, and 25). The bottom material sampled in close proximity to the marsh areas had higher percentages of diatom species that are considered exclusively benthic. For example, sites 1, 8, 13, 14, 16, and 25 had percentages of exclusively benthic diatom species of 12, 17, 15, 25, 34, and 37, respectively. All the dominant diatom species found epiphytic on Spartina al- temiflora (site 26) were also found in both the plankton and bottom-material samples.
TRANSPORT AND SOURCES OF SUSPENDED SEDIMENT
The amount and rate of suspended material transported on a consecutive ebbtide and floodtide were computed at the four measurement cross sections. Prior to the computation of suspended-sediment discharges, water and salt discharges (based on salinity, a conservative parameter) were computed to evaluate the water and salt discharge balances for the ebbtide and floodtide. The discharges and pertinent tide data are presented in table 17.
24 SEDIMENT IN KINGS BAY AND VICINITY, GEORGIA AND FLORIDA, 1982
o £%3^ mm o ""fc* 3 o
EXPLANATION
F E
SAMPLE NEAR SURFACE
SAMPLE NEAR BOTTOM
F FLOODTIDE SAMPLES
E EBBTIDE SAMPLES
7 SAMPLING SITE AND A IDENTIFICATION NUMBER
01 234567 KILOMETERSI I I II
4 MILES
FIGURE 24. Spatial distribution of turbidity at flood and ebb slack tides, Kings Bay and vicinity, July 8, 1982.
STUDY RESULTS 25
EXPLANATION
A SAMPLING SITE ANDIDENTIFICATION NUMBER
SILT PLUS CLAY
< 0.062 mm
M\ SAND
> 0.062 mm < 2.0 mm
GRAVEL > 2.0 mm
ATLANTIC
OCEAN
o 1 5 6 I I
7 KILOMETERS J"T
1 4 MILES
FIGURE 25. Spatial distribution of the major particle-size classes of bottom material, in percent, at Kings Bay and vicinity, July 1982.
26 SEDIMENT IN KINGS BAY AND VICINITY, GEORGIA AND FLORIDA, 1982
0.9
2.0
ATLANTIC
OCEAN
TOTAL CARBON
CONCENTRATION
IN MICROGRAMS
PER LITER
INORGANIC CARBON, IN ^^ PERCENT
HI ORGANIC CARBON, IN *^* PERCENT
A7 SAMPLING SITE ANDIDENTIFICATION NUMBER
7 KILOMETERS J
0 4 MILES
FIGURE 26. Spatial distribution of total carbon concentrations and the percentages of inorganic and organic carbon in bottom material, Kings Bay andvicinity, July 1982.
STUDY RESULTS 27
2.0
1.4
ATLANTIC
OCEAN
EXPLANATION
TOTAL DIATOM CONCENTRATION, IN VALVES PER CUBIC CENTIMETER TIMES 106
EUPLANKTON, IN PERCENT
BENTHOS, IN PERCENT
TYCHOPLANKTON, IN PERCENT
SAMPLING SITE AND IDENTIFICATION NUMBER
0 1 I in il
7 KILOMETERS J1 ' ' I
1 4 MILES
FIGURE 27. Spatial distribution of diatom remains and percentages of the major diatom life forms in bottom material from Kings Bay and vicinity, July1982.
28 SEDIMENT IN KINGS BAY AND VICINITY, GEORGIA AND FLORIDA, 1982
At the upper Kings Bay measurement cross section, the tide heights at the start and end of the tidal cycle were equal. The tide heights at the start and end of the tidal cycle at lower Kings Bay, Cumberland Sound, and St. Marys En trance were reasonably close (approximately 0.25 m). Tide heights and wind conditions should be similar within the estuary at the start and end of the tidal-cycle measurement period in order for the ebbtide and floodtide water discharge and salt discharge to balance.
The ebbtide and floodtide discharges for each cross section balanced reasonably well (1.4 to 1.1 percent). Adjustments due to freshwater inflow were not considered because the volumes of freshwater discharged to the estuary during the measurement periods were insignificant compared with tidal volumes.
The salt-discharge balance between the ebbtide and flood- tide at each measurement site was good. Floodtide salt dis charges at lower Kings Bay, Cumberland Sound, and St. Marys Entrance were 9.1, 6.8, and 8.9 percent larger, re spectively, than ebbtide salt discharges. This coincides with the differences in water discharges at these cross sections, 10.7, 5.7, and 9.8 percent larger, respectively. At upper Kings Bay, the water and salt discharges were 1.4 and 0.9 percent larger during ebbtide than floodtide. A balance of ebbtide and floodtide salt discharges, therefore, suggests that the water-volume computations are reasonably accurate and that the water volumes can be used to compute the loads of suspended sediment, a nonconservative parameter.
Suspended-sediment discharge data for the July measure ments suggest that there is a substantial net transport of suspended sediment seaward of the upper Kings Bay cross section and landward of the St. Marys Entrance, Cumberland Sound, and lower Kings Bay cross sections. This is a result, in part, of the larger (5.7 to 10.7 percent) floodtide water volume than ebbtide water volume at these three cross sec tions rather than higher floodtide suspended-sediment con centrations at these cross sections. However, even after a water volume adjustment is made, there is still a substantial net landward movement of suspended sediment.
At each cross section, silt plus clay made up the largest percentage of the total suspended-sediment discharges (table 17). The percentage of sand in the total discharge was lower at the St. Marys Entrance and Cumberland Sound cross sections than at the upper and lower Kings Bay cross sections.
DISCUSSION
Water circulation within the project area results from the interaction of numerous factors, including freshwater inflow, tidal conditions, wind regime, and bathymetry. Environmen tal Science and Engineering, Inc. (1977), found that the water of Cumberland Sound and Kings Bay was generally well mixed vertically because of strong ocean breezes and strong tidal currents. Salinity stratification was detected in
frequently by Environmental Science and Engineering, Inc., during measurements conducted seasonally at many sites in Kings Bay and Cumberland Sound. For the July 1982 U.S. Geological Survey study, minimal freshwater inflow, high tides, and strong winds resulted in vertically and laterally mixed water at the measurement cross sections. For these conditions, the water of Kings Bay and Cumberland Sound was classified as vertically and laterally homogeneous (Pritchard, 1955; Cameron and Pritchard, 1963). The water at all sampling sites measured in July 1982, with the excep tion of the St. Marys River (sites 6 and 7), would be catego rized at the high end of the polyhaline to the low end of the euhaline by the Venice System (Remane, 1971) for classify ing salinity zones. The euhaline zone is defined as the zone bounded by salinities of 30 to 40 g/kg. This zone is indicative of negligible freshwater discharge. The polyhaline zone is defined as the zone bounded by salinities of 18 to 30 g/kg. At sites in the St. Marys River (sites 6 and 7), where salinities ranged from 17 to 31 g/kg, the waters are categorized as polyhaline, which indicates a small freshwater discharge.
Sedimentary processes in the estuary have resulted in bot tom sediments characteristically different in lower Kings Bay (silt, clay, organic material) from those in upper Kings Bay (fine to medium sands), Cumberland Sound (fine to medium sands), Cumberland Sound (fine to medium sands, gravel), and St. Marys Entrance (medium to coarse sands, shell frag ments). Some of the fine-grained inorganic and organic bot tom sediment in lower Kings Bay may have been transported from upper Kings Bay and Marianna Creek on the ebbtides, as suggested by the net seaward discharge of suspended sediment at the upper Kings Bay cross section. Cumberland Sound also may be supplying fine-grained sediment to lower Kings Bay on the floodtides, as indicated by net landward discharge of suspended sediment at the lower Kings Bay cross section.
The relatively slow velocities in the deep channel of lower Kings Bay apparently permit much of the fine-grained sus pended sediment to settle and to remain on the channel bottom, as indicated by the estimated accumulation rate of sediment in Kings Bay. (See p. 1.) It seems likely that part of the material set in motion by the relatively high ebb-current velocities in upper Kings Bay and Marianna Creek may be too heavy to remain in suspension or to be moved as bedload once the material reaches the slower velocity in the dredged lower Kings Bay channel. The same mechanism for the transport of fine-grained sediment may be occurring as the floodtide water moves into Kings Bay from Cumberland Sound. Current-velocity data collected in 1976 (Environmen tal Science and Engineering, Inc., 1977, p. C-216) indicate that floodtide current velocity decreased appreciably between a measurement site at the north end of Drum Point Island and the entrance to Kings Bay. Apparently, the floodflow is deflected toward the northeast as it enters Kings Bay and a relatively slower velocity occurs on the inside of the arc
CONCLUSIONS 29
(toward the southwest shore near the entrance to Kings Bay). Also, an enlargement of the cross-sectional area imme diately landward (northwest) of the lower Kings Bay cross section would result in a reach of lower velocity. These areas of slow velocity and low turbulence are conducive to the deposition of fine-grained sediments. Areas seaward of St. Marys Entrance also may be contributing sediment to Kings Bay and to other shoaling areas within the estuary, as indi cated by the substantial net landward transport of suspended sediment at the St. Marys Entrance cross section. However, the fate and long-term transport trends of the sediment can not be defined by only a few data-collection efforts.
Bottom material samples from lower Kings Bay contained a large percentage of diatom remains; diatom remains were much less abundant in the bottom samples collected at the upper Kings Bay, Cumberland Sound, and St. Marys En trance cross sections. Phytoplankton biomass in the water column at Kings Bay seems to be too low to contribute appreciable quantities of detrital material to the bottom sedi ments. The low phytoplankton concentrations measured dur ing this study were probably normal for July, and the concen trations may not change greatly throughout the year. Chlorophyll a concentration in samples collected by Environ mental Science and Engineering, Inc. (1977), at nine cross sections in Cumberland Sound and five cross sections in Kings Bay in 1976 (June, October) and 1977 (Janua ry-February, March-April) indicated that phytoplankton concentrations were low and showed no seasonality. Howev er, annual primary production continuously supplies some fine detrital material, including diatom remains, to the estua ry. Movement and deposition of the detrital material to areas that are accumulating fine-grained sediments may account for the abundance of diatom remains in the bottom sediments of lower Kings Bay. The diatoms or their remains could have originated in the ocean or within the estuary, or both.
Sediment may be supplied to the shoaling areas in the estuary from places other than the marsh adjacent to upper Kings Bay or from sources seaward of St. Marys Entrance. General areas of shoreline erosion in Kings Bay and Cumber land Sound that are potential sediment sources were deline ated by Environmental Science and Engineering, Inc. (1977). Salt marshes in the area, in addition to the marsh area adjacent to Kings Bay, are sources of organic matter and possibly minerals, as pointed out in the "Ecology" section of this paper. Other obvious sediment sources are the tidal channels of Crooked River and St. Marys River, where large cutbanks have been created along meanders by the tidal currents. Several of these cutbanks occur along both tidal channels. One cutbank near Kings Bay is on a reach of Crooked River that borders Crooked River State Park. The Cumberland River (tidal channel) also may contribute sedi ment to Cumberland Sound and Kings Bay.
One source of sediment that is not a major contributor of suspended sediment to the estuary is the upland drainage of
the St. Marys River. The transport rate of suspended sedi ment at the gaging station near Macclenny, Fla., is small, even at times of high flow. For example, at a floodflow of 70 m3/s, which is exceeded only 5 percent of the time (fig. 2), the suspended-sediment discharge rate is about 0.4 kg/s. (See fig. 18.) The net landward transport of suspended sedi ment at the St. Marys Entrance cross section for the mea surement period was 16.7 kg/s (net total load divided by the duration of time; table 17). Using these data for comparison purposes, the transport rate of the St. Marys River was about 2.4 percent of that at the St. Marys Entrance cross section. Note that the St. Marys River flow and suspended- sediment concentration data were collected at a station 161 river kilometers upstream of the mouth and, therefore, the suspended-sediment discharge is not a measure of the total suspended-sediment discharged to the estuary from the river system.
CONCLUSIONS
The conclusions that follow are based on the results of this study and, where possible, on other available data. Some statements are more strongly supported by the data base than others. Much of the data presented in this report may represent conditions only at the time of data collection. Obvi ously, a broader (long-term) data base is needed to confirm many conclusions.
The data indicate the following:1. Lower Kings Bay and the area in the vicinity of Kings
Bay entrance seem to be effective traps for sediment transported by both ebbtide and floodtide currents. Changes in channel geometry and shape probably caused a decrease in current velocities in these areas relative to current velocities in upper Kings Bay and Cumberland Sound. The result was a deposition of fine-grained sediments, including organic detrital ma terial, in areas having slower current velocity.
2. Substantial net quantities of suspended sediment were transported into Cumberland Sound through St. Marys Entrance and possibly into Kings Bay. Sus pended-sediment discharges computed for consecutive ebbtides and floodtides showed a large net landward transport of suspended sediment past the St. Marys Entrance, Cumberland Sound, and lower Kings Bay cross sections.
3. Net quantities of suspended sediment are transported from upper Kings Bay and Marianna Creek and are deposited in lower Kings Bay. New sediment may be delivered to upper Kings Bay from Cumberland Sound through a narrow connecting channel or from Crooked River via the intervening marsh.
4. Phytoplankton primary production was low at the time of sampling and phytoplankton biomass in the water column could not have contributed substantial quanti ties of detrital material to the estuary. However, an-
30 SEDIMENT IN KINGS BAY AND VICINITY, GEORGIA AND FLORIDA, 1982
nual primary production of planktonic and benthic al gae over the entire estuary and surrounding environs could contribute significant quantities of detrital ma terial to depositional areas within Kings Bay and vi cinity. For example, approximately 25 percent of the silt- and clay-sized particles in the bottom material sampled at lower Kings Bay consisted of a mixture of remains of planktonic and benthic diatoms. Most dia toms originated outside Kings Bay proper.
5. Potential sources of suspended sediment other than up per Kings Bay, the tidal marshes of Marianna Creek, and the area seaward of the St. Marys Entrance cross section are (1) parts of the shoreline surrounding Cumberland Sound, (2) the tidal channels of Crooked River and St. Marys River, (3) the tidal marshes in general, and (4) the Satilla River-St. Andrews Sound by way of the Cumberland River. Data are not avail able to evaluate the significance of the potential sedi ment sources as contributors to the sedimentation problems in Kings Bay and vicinity.
6. The upland drainage of the St. Marys River does not supply significant quantities of suspended sediment to the estuary. Long-term flow and sediment-discharge data from the St. Marys River station near Macclenny, Fla., reveal that even during flood periods the sus pended-sediment delivery rate is small.
REFERENCES CITED
Buchanan, T. J., and Somers, W. P., 1969, Discharge measurements at gaging stations: U.S. Geological Survey Techniques of Water-Re sources Investigations, Bk. 3, Chap. A8, 65 p.
Cameron, W. M., and Pritchard, D. W., 1963, Estuaries, in Hill, M. N., ed., The sea, v.2: New York, John Wiley, p. 306-324.
Environmental Science and Engineering, Inc., 1977, Draft environmental impact statement for preferred alternative location for a fleet ballistic missile submarine support base at Kings Bay, Georgia: Washington, U.S. Department of the Navy, Office of the Chief of Naval Operations.
Goerlitz, D. F., and Brown, Eugene, 1972, Methods for analysis of organic substances in water: U.S. Geological Survey Techniques of Water- Resources Investigations, Bk. 5, Chap. A3, 40 p.
Greeson, P. E., 1979, A supplement to methods for collection and analysis of aquatic biological and microbiological samples: U.S. Geological Sur vey Techniques of Water-Resources Investigations, Bk. 5, Chap. A4, 92 P-
Greeson, P. E., Ehlke, T. A., Irwin, G.A., Lium, B. W., and Slack, K. V., eds., 1977, Methods for collection and analysis of aquatic biological and microbiological samples: U.S. Geological Survey Techniques of Water- Resources Investigations, Bk. 5, Chap. A4, 332 p.
Grosselink, J. G., Odum, E. P., and Pope, R. N., 1973, The value of the tidal marsh: Baton Rouge, Louisiana State University, Center for Wetland Resources, 25 p.
Guy, H. P., 1969, Laboratory theory and methods for sediment analysis: U.S. Gelogical Survey Techniques of Water-Resources Investigations, Bk. 5, Chap. Cl, 58 p.
Guy, H. P., and Norman, V. W., 1970, Field methods for measurement of fluvial sediment: U.S. Geological Survey Techniques of Water-Re sources Investigations, Bk. 3, Chap. C2, 59 p.
Howard, J. D., and Frey, R. W., 1975, Regional animal-sediment character istics of Georgia estuaries, in Estuaries of the Georgia coast, U.S.A.: Sedimentology and Biology, Senckenbergiana maritima, v. 7, p. 33-104.
Jenkins, S. A., and Skelly, D. W., 1981, Coastal problems impacting subma rine operations at Kings Bay, Georgia: La Jolla, Calif., Scripps Institu tion of Oceanography, 24 p.
McConnell, J. B., Radtke, D. B., Hale, T. W., and Buell, G. R., 1983, A preliminary appraisal of sediment sources and transport in Kings Bay and vicinity, Georgia and Florida: U.S. Geological Survey Water-Re sources Investigations Rept. 83-4060, 90 p.
Miller, C. R., 1951, Analysis of flow-duration, sediment rating curve method of computing sediment yield: Denver, U.S. Bureau of Reclamation, 15P-
Odum, E. P., 1961, The role of tidal marshes in estuarine production: The New York Conservationist, v. 14, no. 6, p. 12-15.
Odum, E. P. and de la Cruz, A. A., 1967, Particulate organic detritus in a Georgia salt marsh-estuarine ecosystem, in Lauff, G. H., ed., Estuaries: Washington, D.C., American Association for the Advancement of Sci ence Pub. 83, p. 383-388.
Oertel, G. F., and Howard, J. D., 1972, Water circulation and sedimentation at estuary entrances on the Georgia coast, in Swift, D. J. P., Duane, D. B., and Pilkey, 0. H., eds., Shelf sediment transport: Process and pattern: Stroudsburg, Pa., Dowden, Hutchinson and Ross, p. 411-427.
Olsen, E. J., 1977, A study of the effects of inlet stabilization at St. Marys Entrance, Florida: Coastal Sediments '77, Fifth Symposium of the Wa terway, Port, Coastal, and Ocean Division of the American Society of Civil Engineers, New York, p. 311-329.
Pritchard, D. W., 1955, Estuarine circulation patterns, Proceedings of the American Society of Civil Engineers, 81, no. 717.
____1967, What is an estuary? Physical viewpoint, in Lauff, G. H., ed., Estuaries: Washington, D.C., American Association for the Advance ment of Science Publication 83, p. 3-5.
Remane, A., 1971, Ecology of brackish water, in Remane, A., and Schlieper, C., Biology of brackish water: New York, Wiley Interscience, p. 1-210.
Schelske, C. L., and Odum, E. P., 1961, Mechanisms maintaining high productivity in Georgia estuaries: Proceedings, Gulf Caribbean Fisher ies Institute, no. 14, p. 75-80.
Skougstad, M. W., Fishman, M. J., Friedman, L. C., Erdmann, D. E., and Duncan, S. S., eds., 1979, Methods for determination of inorganic substances in water and fluvial sediments: U.S. Geological Survey Techniques of Water-Resources Investigations, Bk. 5, Chap. Al, 626 p.
Smoot, G. F., and Novak, C. E., 1968, Calibration and maintenance of vertical-axis type current meters: U.S. Geological Survey Techniques of Water-Resources Investigations, Bk. 8, Chap. B2, 15 p.
Wharton, C. H., 1978, The natural environments of Georgia: Atlanta, Geor gia Department of Natural Resources, 227 p.
TABLES 1-17

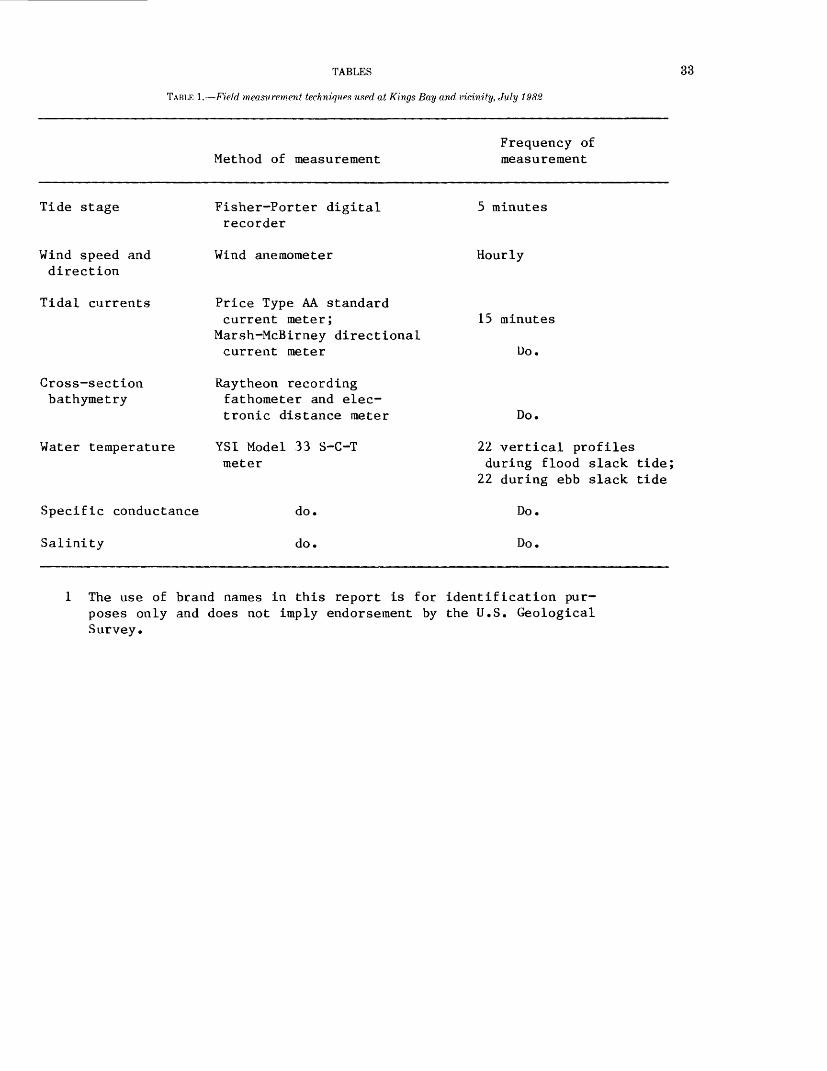
TABLES
TABLE 1. Field measurement techniques used at Kings Bay and vicinity, July 1982
33
Method of measurementFrequency of measurement
Tide stage
Wind speed and direction
Tidal currents
Cross-section bathymetry
Water temperature
Specific conductance
Salinity
Fisher-Porter digital recorder
Wind anemometer
Price Type AA standardcurrent meter;
Marsh-McBirney directionalcurrent meter
Raytheon recording fathometer and elec tronic distance meter
YS1 Model 33 S-C-T meter
do.
do.
5 minutes
Hourly
15 minutes
Do.
Do.
22 vertical profilesduring flood slack tide;
22 during ebb slack tide
Do.
Do.
1 The use of brand names in this report is for identification pur poses only and does not imply endorsement by the U.S. Geological Survey.
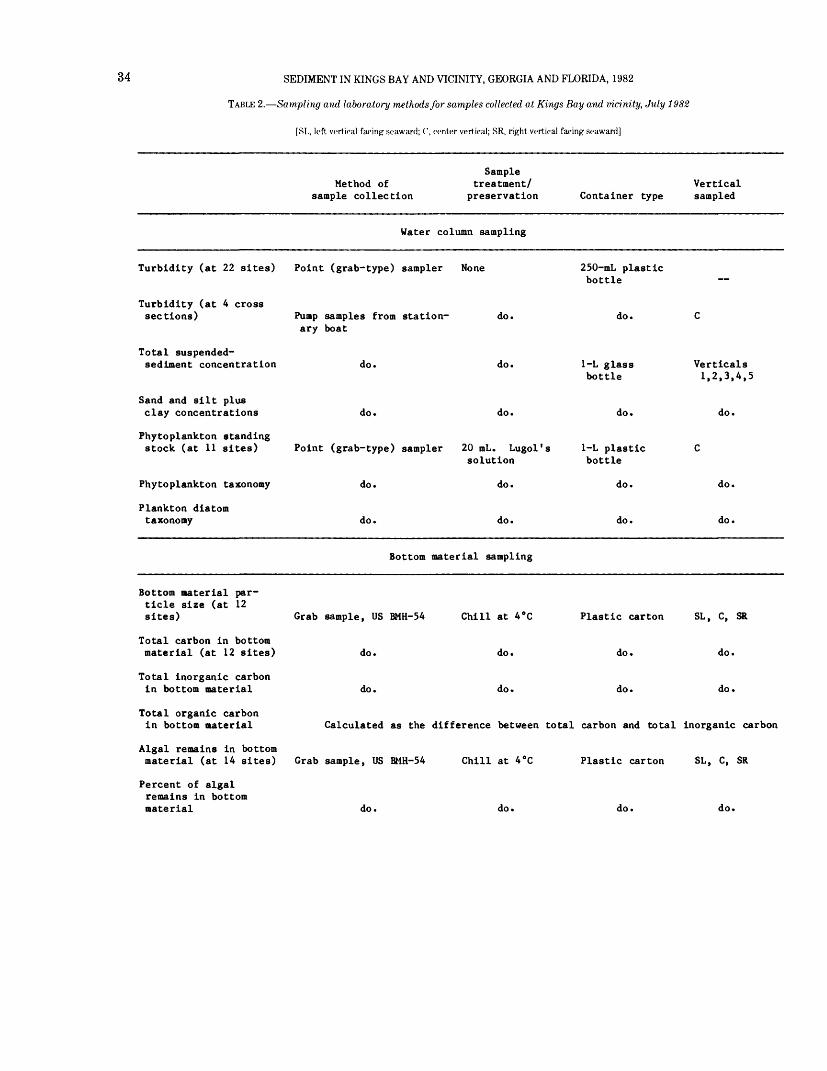
34 SEDIMENT IN KINGS BAY AND VICINITY, GEORGIA AND FLORIDA, 1982
TABLE 2. Sampling and laboratory methods for samples collected at Kings Bay and vicinity, July 1982
[SL, left vertical facing seaward; (', center vertical; SR, right vertical facing seaward]
SampleMethod of treatment/ Vertical
sample collection preservation Container type sampled
Water column sampling
Turbidity (at 22 sites)
Turbidity (at 4 crosssections)
Total suspended-sediment concentration
Sand and silt plusclay concentrations
Phytoplankton standingstock (at 11 sites)
Phytoplankton taxonomy
Plankton diatomtaxonomy
Point (grab-type) sampler None 250-mL plasticbottle
Pump samples from station- do. do. Cary boat
do. do. 1-L glass Verticalsbottle 1,2,3,4,5
do. do. do. do.
Point (grab-type) sampler 20 mL. Lugol's 1-L plastic Csolution bottle
do. do. do. do.
do. do. do. do.
Bottom material sampling
Grab sample, US BMH-54 Chill at 4°C
do. do.
Bottom material par ticle size (at 12 sites)
Total carbon in bottom material (at 12 sites)
Total inorganic carbon in bottom material
Total organic carbon in bottom material
Algal remains in bottom material (at 14 sites) Grab sample, US BMH-54 Chill at 4°C
Plastic carton SL, C, SR
do. do.
do.
do.
do.
do.
Calculated as the difference between total carbon and total inorganic carbon
Plastic carton SL, C, SR
Percent of algal remains in bottom material do. do. do. do.
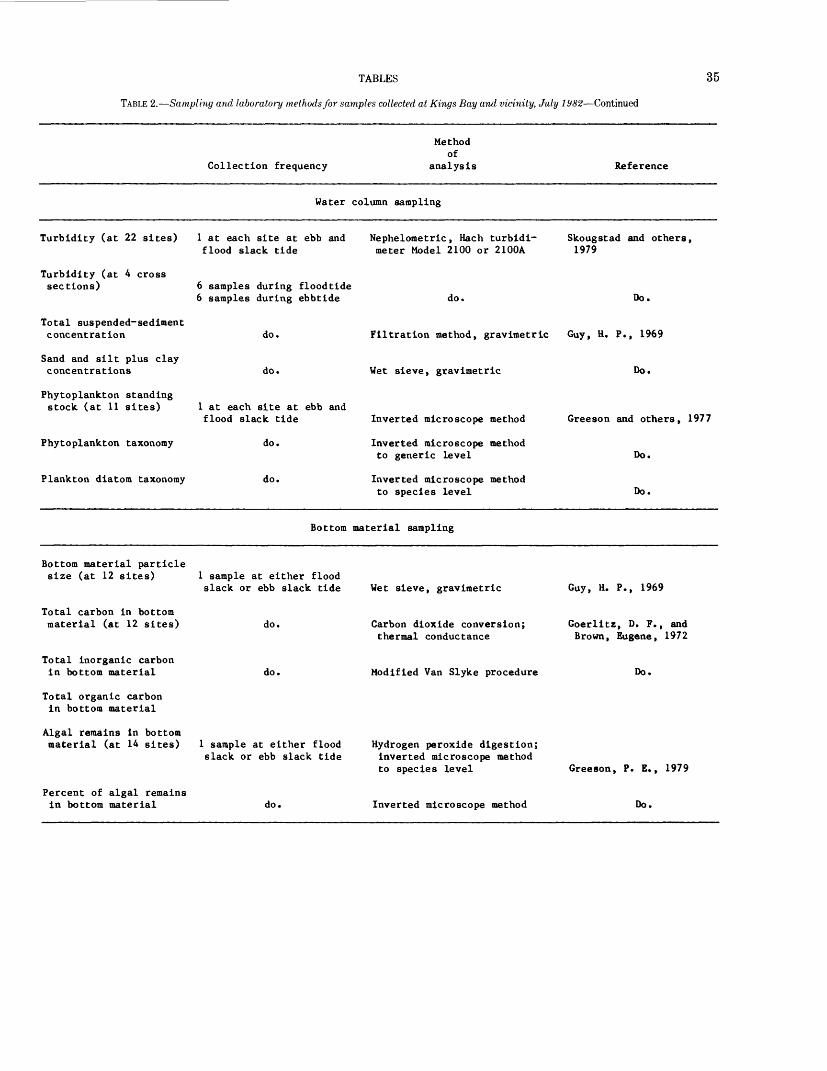
TABLES 35
TABLE 2. Sampling and laboratory methods for samples collected at Kings Bay and vicinity, July 1982 Continued
Collection frequency
Methodof
analysis Reference
Water column sampling
Turbidity (at 22 sites) 1 at each site at ebb and Nephelometric, Hach turbidi- Skougstad and others,flood slack tide meter Model 2100 or 2100A 1979
Turbidity (at 4 crosssections) 6 samples during floodtide
6 samples during ebbtide do. Do.
Total suspended-sediment concentration
Sand and silt plus clay concentrations
do.
do.
Filtration method, gravimetric Guy, H. P., 1969
Wet sieve, gravimetric Do.
Phytoplankton standing stock (at 11 sites) 1 at each site at ebb and
flood slack tide Inverted microscope method Greeson and others, 1977
Phytoplankton taxonomy
Plankton diatom taxonomy
do.
do.
Inverted microscope method to generic level
Inverted microscope method to species level
Do.
Do.
Bottom material sampling
Bottom material particlesize (at 12 sites) 1 sample at either flood
slack or ebb slack tide
Total carbon in bottom material (at 12 sites) do.
Total inorganic carbon in bottom material do.
Total organic carbon in bottom material
Algal remains in bottommaterial (at 14 sites) 1 sample at either flood
slack or ebb slack tide
Percent of algal remains in bottom material do,
Wet sieve, gravimetric
Carbon dioxide conversion; thermal conductance
Modified Van Slyke procedure
Hydrogen peroxide digestion; inverted microscope method to species level
Inverted microscope method
Guy, H. P., 1969
Goerlitz, D. F., and Brown, Eugene, 1972
Do.
Greeson, P. E., 1979
Do.
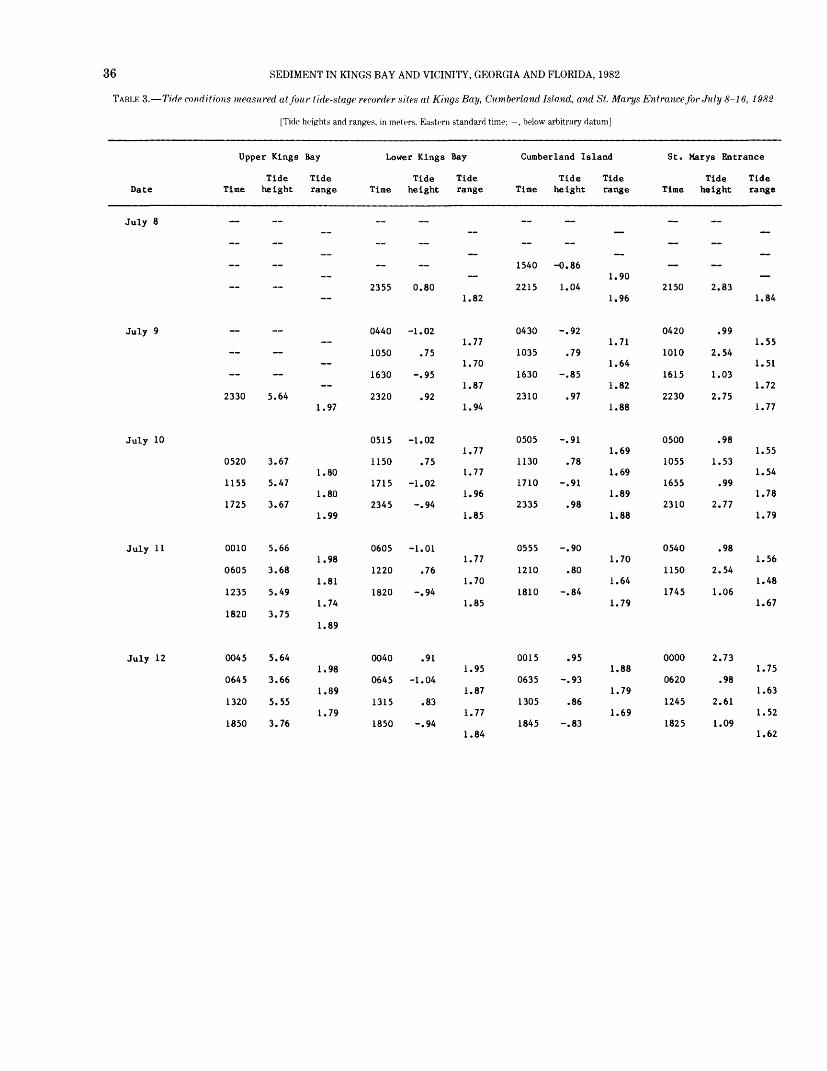
36 SEDIMENT IN KINGS BAY AND VICINITY, GEORGIA AND FLORIDA, 1982
TABLE 3. Tide conditions measured at four tide-stage recorder sites at Kings Bay, Cumberland Island, and St. Marys Entrance for July 8-16, 1982
[Tide heights and ranges, in meters. Eastern standard time; , below arbitrary datum]
Upper Kings
Tide Date Time height
July 8
July 9
2330 5.64
July 10
0520 3.67
1155 5.47
1725 3.67
July 11 0010 5.66
0605 3.68
1235 5.49
1820 3.75
July 12 0045 5.64
0645 3.66
1320 5.55
1850 3.76
Bay
Tide range
1.97
1.80
1.80
1.99
1.98
1.81
1.74
1.89
1.98
1.89
1.79
Lower Kings
Tide Time height
2355
0440
1050
1630
2320
0515
1150
1715
2345
0605
1220
1820
0040
0645
1315
1850
0.80
-1.02
.75
-.95
.92
-1.02
.75
-1.02
-.94
-1.01
.76
-.94
.91
-1.04
.83
-.94
Bay
Tide range
1.82
1.77
1.70
1.87
1.94
1.77
1.77
1.96
1.85
1.77
1.70
1.85
1.95
1.87
1.77
1.84
Cumberland Island
Tide Tide Time height range
1540
2215
0430
1035
1630
2310
0505
1130
1710
2335
0555
1210
1810
0015
0635
1305
1845
~
-0.86
1.04
-.92
.79
-.85
.97
-.91
.78
-.91
.98
-.90
.80
-.84
.95
-.93
.86
-.83
1.90
1.96
1.71
1.64
1.82
1.88
1.69
1.69
1.89
1.88
1.70
1.64
1.79
1.88
1.79
1.69
St.
Time
2150
0420
1010
1615
2230
0500
1055
1655
2310
0540
1150
1745
0000
0620
1245
1825
Marys Entrance
Tide Tide height range
~
2.83
.99
2.54
1.03
2.75
.98
1.53
.99
2.77
.98
2.54
1.06
2.73
.98
2.61
1.09
1.84
1.55
1.51
1.72
1.77
1.55
1.54
1.78
1.79
1.56
1.48
1.67
1.75
1.63
1.52
1.62
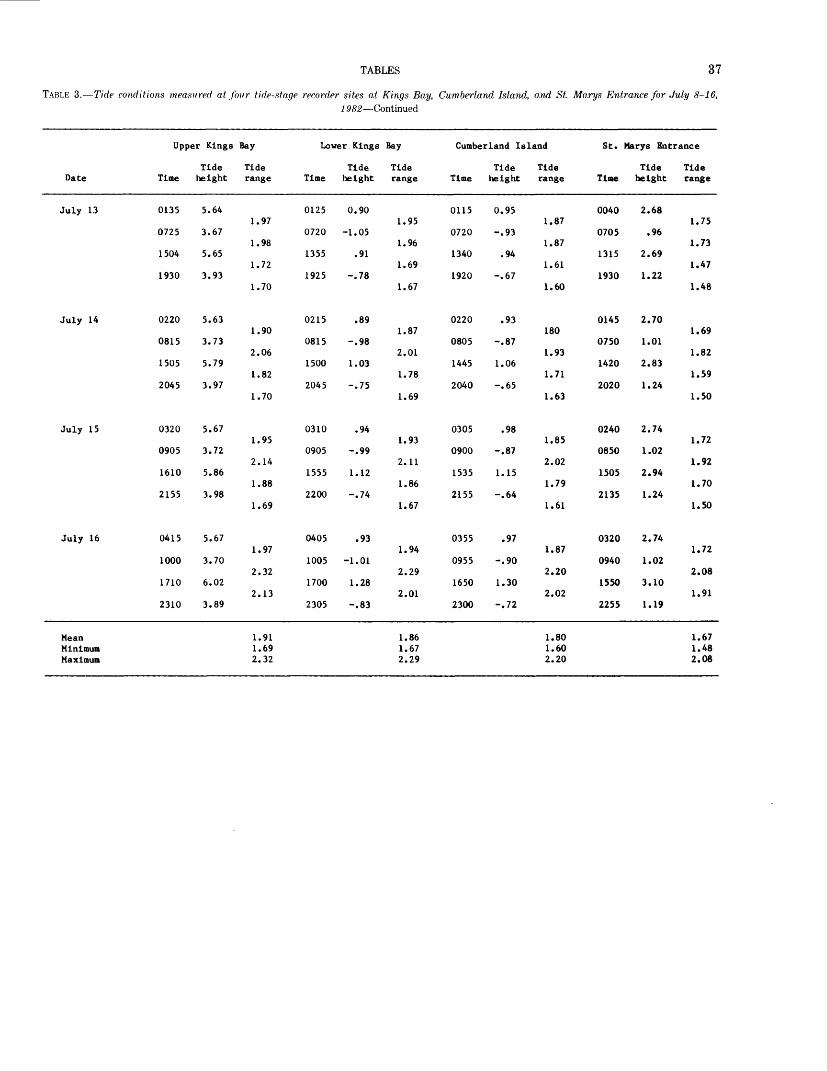
TABLES 37
TABLE 3. Tide conditions measured at four tide-stage recorder sites at Kings Bay, Cumberland Island, and St. Marys Entrance for July 8-16,1982 Continued
Upper Kings
Date
July 13
July 14
July 15
July 16
MeanMinimumMaximum
Time
0135
0725
1504
1930
0220
0815
1505
2045
0320
0905
1610
2155
0415
1000
1710
2310
Tideheight
5.64
3.67
5.65
3.93
5.63
3.73
5.79
3.97
5.67
3.72
5.86
3.98
5.67
3.70
6.02
3.89
Bay
Tiderange
1.97
1.98
1.72
1.70
1.90
2.06
1.82
1.70
1.95
2.14
1.88
1.69
1.97
2.32
2.13
1.911.692.32
Lower Kings
Time
0125
0720
1355
1925
0215
0815
1500
2045
0310
0905
1555
2200
0405
1005
1700
2305
Tideheight
0.90
-1.05
.91
-.78
.89
-.98
1.03
-.75
.94
-.99
1.12
-.74
.93
-1.01
1.28
-.83
Bay
Tiderange
1.95
1.96
1.69
1.67
1.87
2.01
1.78
1.69
1.93
2.11
1.86
1.67
1.94
2.29
2.01
1.861.672.29
Cumberland Island
Time
0115
0720
1340
1920
0220
0805
1445
2040
0305
0900
1535
2155
0355
0955
1650
2300
Tideheight
0.95
-.93
.94
-.67
.93
-.87
1.06
-.65
.98
-.87
1.15
-.64
.97
-.90
1.30
-.72
Tiderange
1.87
1.87
1.61
1.60
180
1.93
1.71
1.63
1.85
2.02
1.79
1.61
1.87
2.20
2.02
1.801.602.20
St. Marys Entrance
Time
0040
0705
1315
1930
0145
0750
1420
2020
0240
0850
1505
2135
0320
0940
1550
2255
Tideheight
2.68
.96
2.69
1.22
2.70
1.01
2.83
1.24
2.74
1.02
2.94
1.24
2.74
1.02
3.10
1.19
Tiderange
1.75
1.73
1.47
1.48
1.69
1.82
1.59
1.50
1.72
1.92
1.70
1.50
1.72
2.08
1.91
1.671.482.08
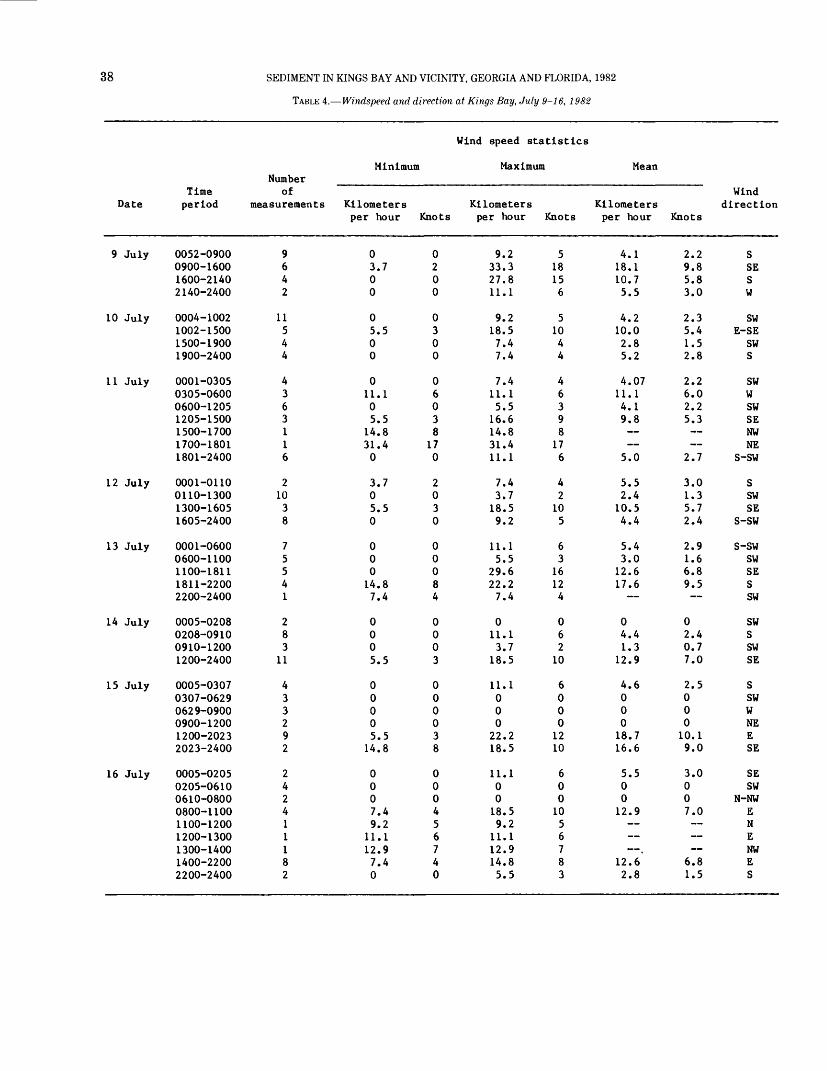
38 SEDIMENT IN KINGS BAY AND VICINITY, GEORGIA AND FLORIDA, 1982
TABLE 4. Windspeed and direction at Kings Bay, July 9-16, 1982
Date
9 July
10 July
11 July
12 July
13 July
14 July
15 July
16 July
NumberTime of period measurements
0052-09000900-16001600-21402140-2400
0004-10021002-15001500-19001900-2400
0001-03050305-06000600-12051205-15001500-17001700-18011801-2400
0001-01100110-13001300-16051605-2400
0001-06000600-11001100-18111811-22002200-2400
0005-02080208-09100910-12001200-2400
0005-03070307-06290629-09000900-12001200-20232023-2400
0005-02050205-06100610-08000800-11001100-12001200-13001300-14001400-22002200-2400
9642
11544
4363116
21038
75541
283
11
433292
242411182
Wind speed statistics
Minimum Maximum
Kilometersper hour
03.700
05.500
011.105.514.831.40
3.705.50
00014.87.4
0005.5
00005.514.8
0007.49.2
11.112.97.40
Knots
0200
0300
06038
170
2030
00084
0003
000038
000456740
Kilometersper hour
9.233.327.811.1
9.218.57.47.4
7.411.15.516.614.831.411.1
7.43.718.59.2
11.15.5
29.622.27.4
011.13.7
18.5
11.100022.218.5
11.10018.59.2
11.112.914.85.5
Knots
518156
51044
46398
176
42
105
63
16124
062
10
60001210
6001056783
Mean
Kilometersper hour
4.118.110.75.5
4.210.02.85.2
4.0711.14.19.8
5.0
5.52.410.54.4
5.43.012.617.6
04.41.3
12.9
4.600018.716.6
5.50012.9
12.62.8
Knots
2.29.85.83.0
2.35.41.52.8
2.26.02.25.3
2.7
3.01.35.72.4
2.91.66.89.5
02.40.77.0
2.500010.19.0
3.0007.0
6.81.5
Wind direction
SSESW
SWE-SE
SWS
SWWSWSENWNE
S-SW
SSWSE
S-SW
S-SW
SWSESSW
SWSSWSE
SSWWNEESE
SESW
N-NW
ENENWES
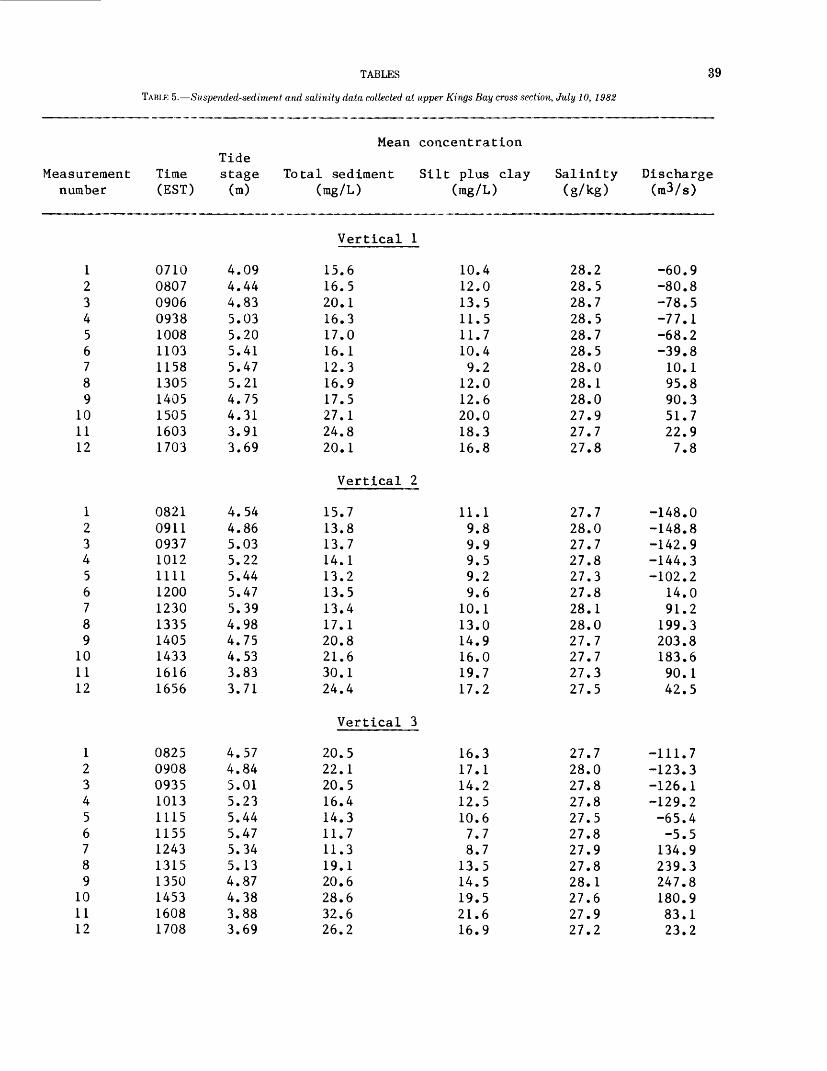
TABLES
TABLE 5. Suspended-sediment and salinity data collected at upper Kings Bay cross section, July 10, 1982
39
Mean concentration
Measurement number
123456789
101112
123456789
101112
123456789
101112
Time (EST)
071008070906093810081103115813051405150516031703
082109110937101211111200123013351405143316161656
082509080935101311151155124313151350145316081708
Tidestage (m)
4.094.444.835.035.205.415.475.214.754.313.913.69
4.544.865.035.225.445.475.394.984.754.533.833.71
4.574.845.015.235.445.475.345.134.874.383.883.69
Total sediment (mg/L)
Vertical
15.616.520.116.317.016.112.316.917.527.124.820.1
Vertical
15.713.813.714.113.213.513.417.120.821.630.124.4
Vertical
20.522.120.516.414.311.711.319.120.628.632.626.2
Silt plus clay (mg/L)
1
10.412.013.511.511.710.49.212.012.620.018.316.8
2
11.19.89.99.59.29.6
10.113.014.916.019.717.2
3
16.317.114.212.510.67.78.713.514.519.521.616.9
Salinity (g/kg)
28.228.528.728.528.728.528.028.128.027.927.727.8
27.728.027.727.827.327.828.128.027.727.727.327.5
27.728.027.827.827.527.827.927.828.127.627.927.2
Discharge (m3/ s )
-60.9-80.8-78.5-77.1-68.2-39.810.195.890.351.722.97.8
-148.0-148.8-142.9-144.3-102.2
14.091.2199.3203.8183.690.142.5
-111.7-123.3-126.1-129.2-65.4-5.5134.9239.3247.8180.983.123.2
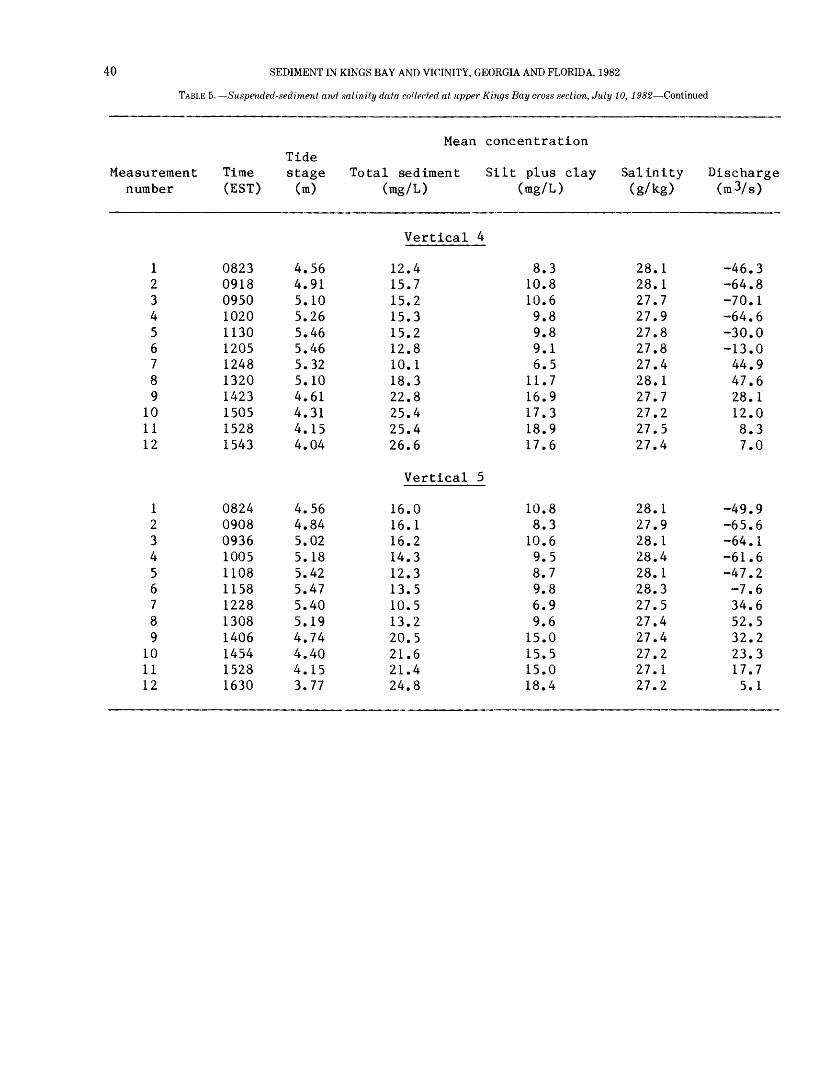
40 SEDIMENT IN KINGS BAY AND VICINITY, GEORGIA AND FLORIDA, 1982
TABLE 5. Suspended-sediment and salinity data collected at upper Kings Bay cross section, July 10, 1982 Continued
Measurement Time number (EST)
123456789
101112
123456789
101112
082309180950102011301205124813201423150515281543
082409080936100511081158122813081406145415281630
Mean concentration Tide stage Total sediment Silt plus clay (m) (mg/L) (mg/L)
4.564.915.105.265.465.465.325.104.614.314.154.04
4.564.845.025.185.425.475.405.194.744.404.153.77
Vertical 4
12.415.715.215.315.212.810.118.322.825.425.426.6
Vertical 5
16.016.116.214.312.313.510.513.220.521.621.424.8
8.310.810.69.89.89.16.5
11.716.917.318.917.6
10.88.310.69.58.79.86.99.615.015.515.018.4
Salinity (g/kg)
28.128.127.727.927.827.827.428.127.727.227.527.4
28.127.928.128.428.128.327.527.427.427.227.127.2
Discharge (m3/ s )
-46.3-64.8-70.1-64.6-30.0-13.044.947.628.112.08.37.0
-49.9-65.6-64.1-61.6-47.2-7.634.652.532.223.317.75.1
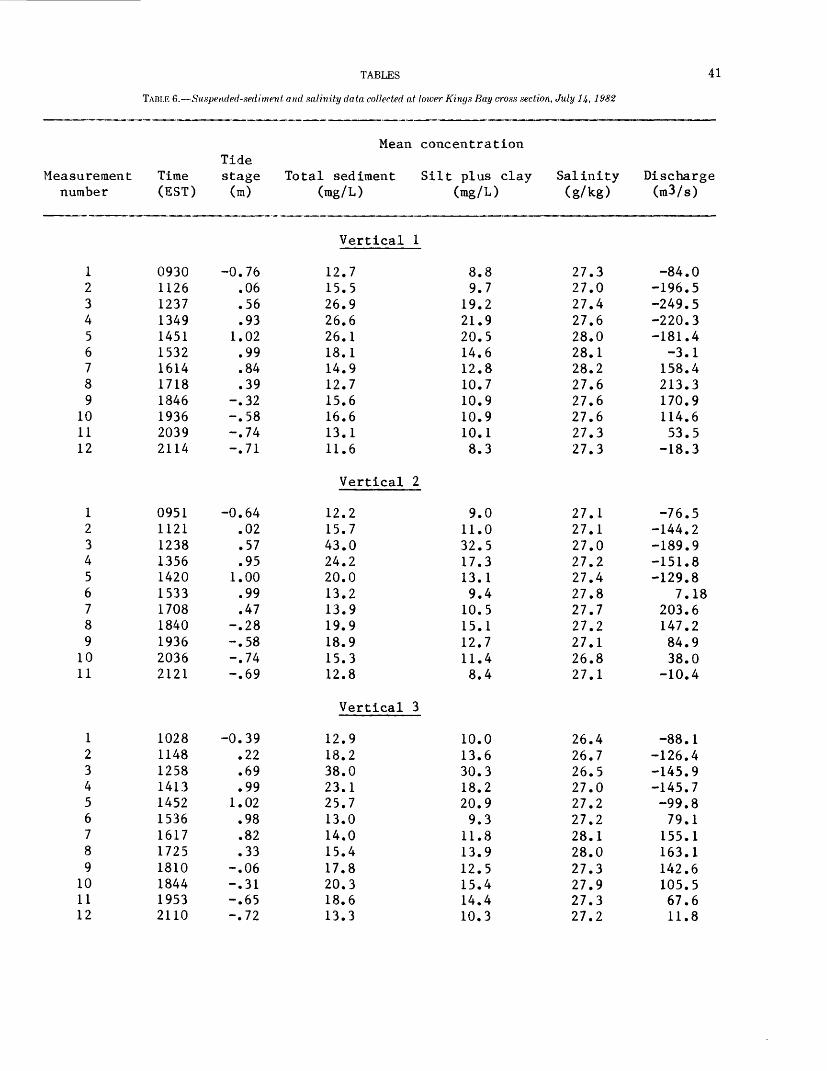
TABLES
TABLE 6. Sitspended-sediment and salinity data collected at lower Kings Bay cross section, July 14, 1982
41
Measurement Time number (EST)
123456789
101112
1234567891011
123456789
101112
093011261237134914511532161417181846193620392114
09511121123813561420153317081840193620362121
102811481258141314521536161717251810184419532110
Mean concentration Tide stage Total sediment Silt plus clay (m) (mg/L) (mg/L)
-0.76.06.56.93
1.02.99.84.39
-.32-.58-.74-.71
-0.64.02.57.95
1.00.99.47
-.28-.58-.74-.69
-0.39.22.69.99
1.02.98.82.33
-.06-.31-.65-.72
Vertical 1
12.715.526.926.626.118.114.912.715.616.613.111.6
Vertical 2
12.215.743.024.220.013.213.919.918.915.312.8
Vertical 3
12.918.238.023.125.713.014.015.417.820.318.613.3
8.89.7
19.221.920.514.612.810.710.910.910.18.3
9.011.032.517.313.19.410.515.112.711.48.4
10.013.630.318.220.99.311.813.912.515.414.410.3
Salinity (g/kg)
27.327.027.427.628.028.128.227.627.627.627.327.3
27.127.127.027.227.427.827.727.227.126.827.1
26.426.726.527.027.227.228.128.027.327.927.327.2
Discharge (m3/s )
-84.0-196.5-249.5-220.3-181.4
-3.1158.4213.3170.9114.653.5
-18.3
-76.5-144.2-189.9-151.8-129.8
7.18203.6147.284.938.0
-10.4
-88.1-126.4-145.9-145.7-99.879.1
155.1163.1142.6105.567.611.8
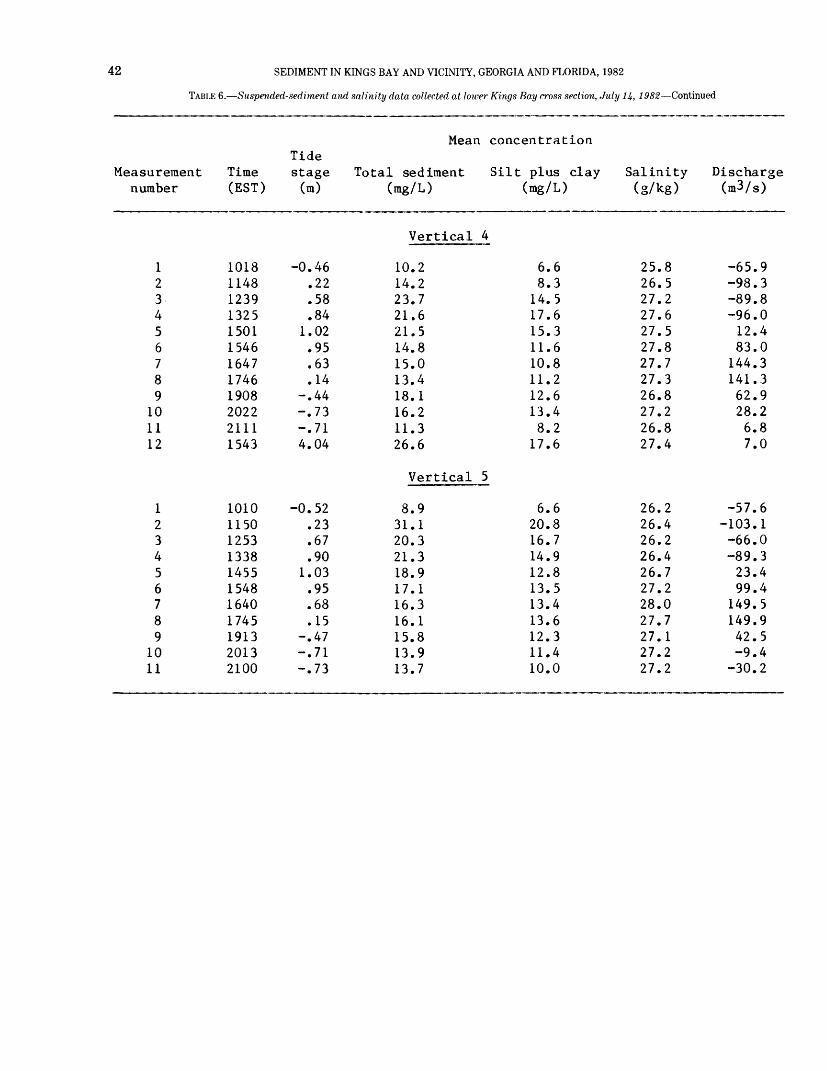
42 SEDIMENT IN KINGS BAY AND VICINITY, GEORGIA AND FLORIDA, 1982
TABLE 6. Suspended-sediment and salinity data collected at lower Kings Bay cross section, July 14, 1982 Continued
Measurement Time number (EST)
123456789
101112
123456789
1011
101811481239132515011546164717461908202221111543
10101150125313381455154816401745191320132100
Mean concentration Tide stage Total sediment Silt plus clay (m) (mg/L) (mg/L)
-0.46.22.58.84
1.02.95.63.14
-.44-.73-.714.04
-0.52.23.67.90
1.03.95.68.15
-.47-.71-.73
Vertical 4
10.214.223.721.621.514.815.013.418.116.211.326.6
Vertical 5
8.931.120.321.318.917.116.316.115.813.913.7
6.68.314.517.615.311.610.811.212.613.48.217.6
6.620.816.714.912.813.513.413.612.311.410.0
Salinity (g/kg)
25.826.527.227.627.527.827.727.326.827.226.827.4
26.226.426.226.426.727.228.027.727.127.227.2
Discharge (m3/ s )
-65.9-98.3-89.8-96.012.483.0144.3141.362.928.26.87.0
-57.6-103.1-66.0-89.323.499.4
149.5149.942.5-9.4-30.2
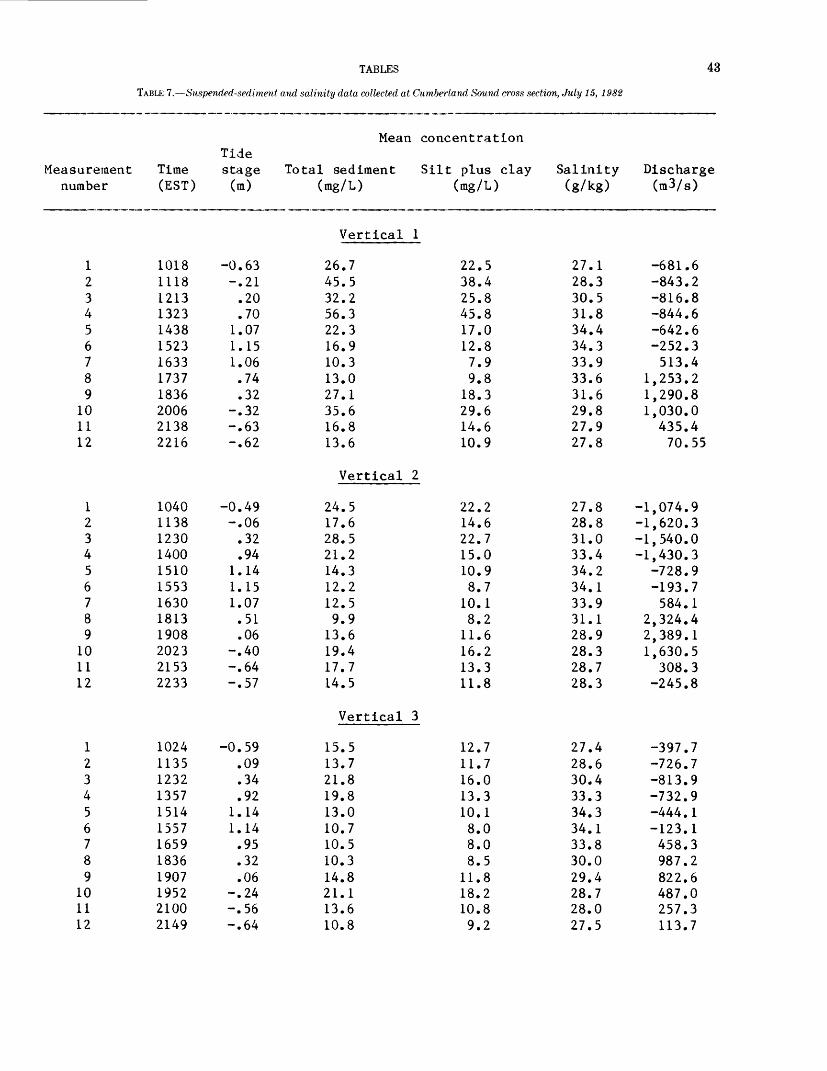
TABLES
TABLE 7. Suspended-sediment and salinity data collected at Cumberland Sound cross section, July 15, 1982
43
Measurement Time number (EST)
12345678 9
10 1112
1 2 3 4 5678 9
10 1112
123456789
101112
10181118121313231438152316331737 1836 2006 21382216
1040 1138 1230 1400 1510155316301813 1908 2023 21532233
102411351232135715141557165918361907195221002149
Mean concentration Tide stage Total sediment Silt plus clay Salinity (m) (mg/L) (mg/L) (g/kg)
-0.63-.21
.20
.701.071.151.06.74 .32
-.32 -.63-.62
-0.49 -.06 .32 .94
1.141.151.07.51 .06
-.40 -.64-.57
-0.59.09.34.92
1.141.14.95.32.06
-.24-.56-.64
Vertical 1
26.745.532.256.322.316.910.313.0 27.1 35.6 16.813.6
Vertical 2
24.5 17.6 28.5 21.2 14.312.212.59.9 13.6 19.4 17.714.5
Vertical 3
15.513.721.819.813.010.710.510.314.821.113.610.8
22.538.425.845.817.012.87.99.8 18.3 29.6 14.610.9
22.2 14.6 22.7 15.0 10.98.710.18.2 11.6 16.2 13.311.8
12.711.716.013.310.18.08.08.511.818.210.89.2
27.128.330.531.834.434.333.933.6 31.6 29.8 27.927.8
27.8 28.8 31.0 33.4 34.234.133.931.1 28.9 28.3 28.728.3
27.428.630.433.334.334.133.830.029.428.728.027.5
Discharge (m3/ s )
-681.6-843.2-816.8-844.6-642.6-252.3513.4
1,253.2 1,290.8 1,030.0 435.470.55
-1,074.9 -1,620.3 -1,540.0 -1,430.3
-728.9-193.7584.1
2,324.4 2,389.1 1,630.5 308.3
-245.8
-397.7-726.7-813.9-732.9-444.1-123.1458.3987.2822.6487.0257.3113.7
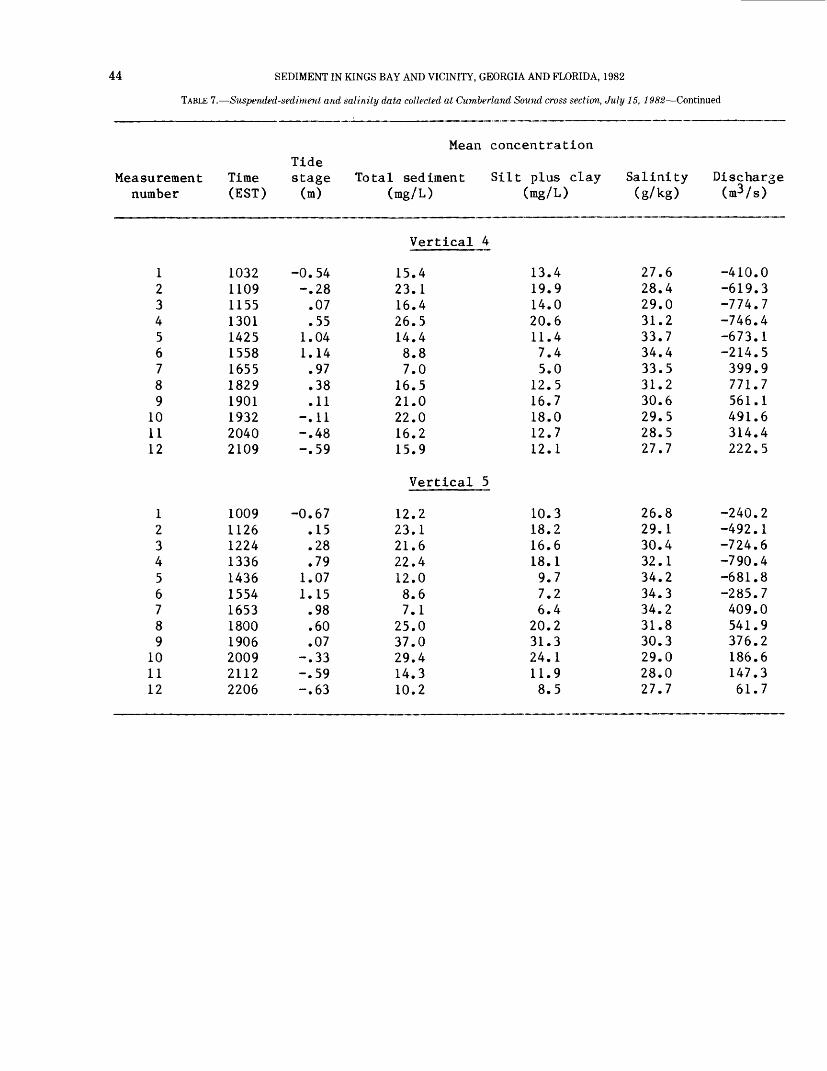
44 SEDIMENT IN KINGS BAY AND VICINITY, GEORGIA AND FLORIDA, 1982
TABLE 7. Suspended-sediment and salinity data collected at Cumberland Sound cross section, July 15, 1982 Continued
Measurement Time number (EST)
123456789
101112
123456789
101112
103211091155130114251558165518291901193220402109
100911261224133614361554165318001906200921122206
Mean concentration Tide stage Total sediment Silt plus clay (m) (mg/L) (mg/L)
-0.54-.28.07.55
1.041.14.97.38.11
-.11-.48-.59
-0.67.15.28.79
1.071.15.98.60.07
-.33-.59-.63
Vertical 4
15.423.116.426.514.48.87.0
16.521.022.016.215.9
Vertical 5
12.223.121.622.412.08.67.1
25.037.029.414.310.2
13.419.914.020.611.47.45.0
12.516.718.012.712.1
10.318.216.618.19.77.26.4
20.231.324.111.98.5
Salinity (g/kg)
27.628.429.031.233.734.433.531.230.629.528.527.7
26.829.130.432.134.234.334.231.830.329.028.027.7
Discharge U3 /s)
-410.0-619.3-774.7-746.4-673.1-214.5399.9771.7561.1491.6314.4222.5
-240.2-492.1-724.6-790.4-681.8-285.7409.0541.9376.2186.6147.361.7
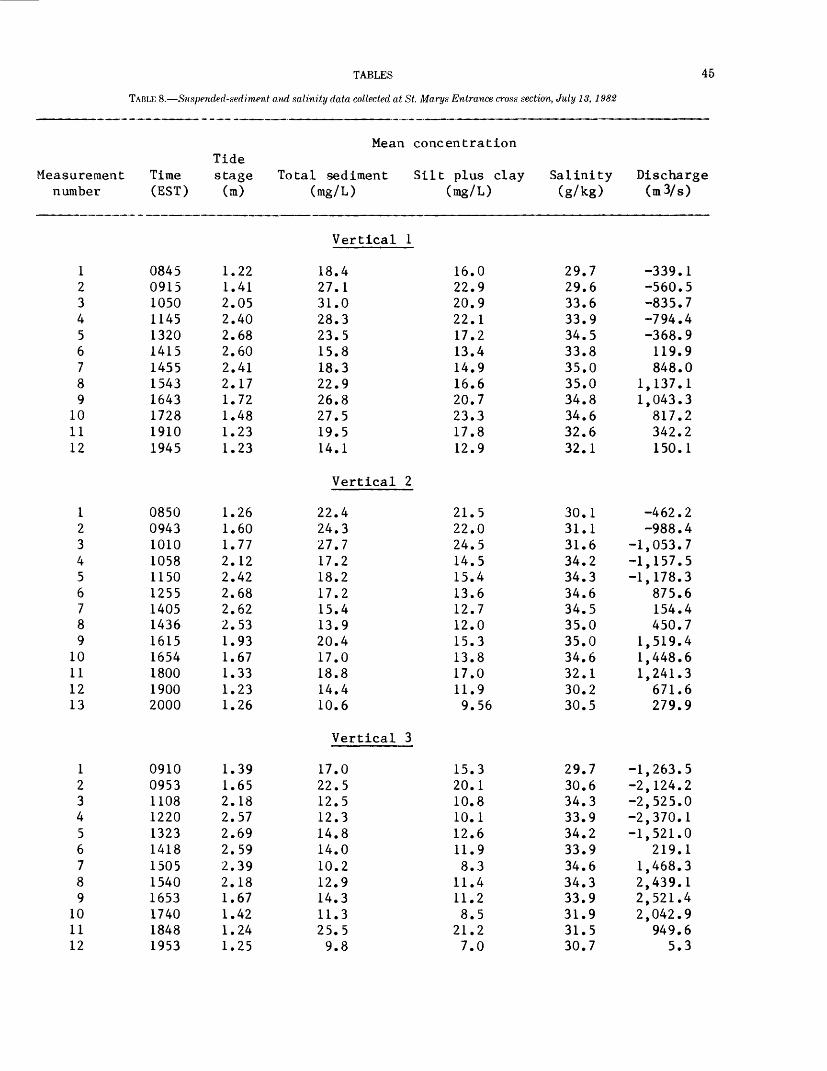
TABLES
TABLE 8. Suspended-sediment and salinity data collected at St. Marys Entrance cross section, July 13, 1982
45
Measurement Time number (EST)
12345678 9
101112
1234 5 6789
10 11 1213
1 2 3 4 5 67 8 9
10 1112
08450915105011451320141514551543 1643 172819101945
085009431010 1058 1150 1255140514361615 1654 1800 19002000
0910 0953 1108 1220 1323 14181505 1540 1653 1740 18481953
Mean concentration Tide stage Total sediment Silt plus clay (m) (mg/L) (mg/L)
1.221.412.052.402.682.602.412.17 1.72 1.481.231.23
1.261.601.77 2.12 2.42 2.682.622.531.93 1.67 1.33 1.231.26
1.39 1.65 2.18 2.57 2.69 2.592.39 2.18 1.67 1.42 1.241.25
Vertical 1
18.427.131.028.323.515.818.322.9 26.8 27.519.514.1
Vertical 2
22.424.327.7 17.2 18.2 17.215.413.920.4 17.0 18.8 14.410.6
Vertical 3
17.0 22.5 12.5 12.3 14.8 14.010.2 12.9 14.3 11.3 25.59.8
16.022.920.922.117.213.414.916.6 20.7 23.317.812.9
21.522.024.5 14.5 15.4 13.612.712.015.3 13.8 17.0 11.99.56
15.3 20.1 10.8 10.1 12.6 11.98.3 11.4 11.2 8.5 21.27.0
Salinity (g/kg)
29.729.633.633.934.533.835.035.0 34.8 34.632.632.1
30.131.131.6 34.2 34.3 34.634.535.035.0 34.6 32.1 30.230.5
29.7 30.6 34.3 33.9 34.2 33.934.6 34.3 33.9 31.9 31.530.7
Discharge (m3/ s )
-339.1-560.5-835.7-794.4-368.9119.9848.0
1,137.1 1,043.3 817.2342.2150.1
-462.2-988.4
-1,053.7 -1,157.5 -1,178.3
875.6154.4450.7
1,519.4 1,448.6 1,241.3 671.6279.9
-1,263.5 -2,124.2 -2,525.0 -2,370.1 -1,521.0
219.11,468.3 2,439.1 2,521.4 2,042.9
949.65.3
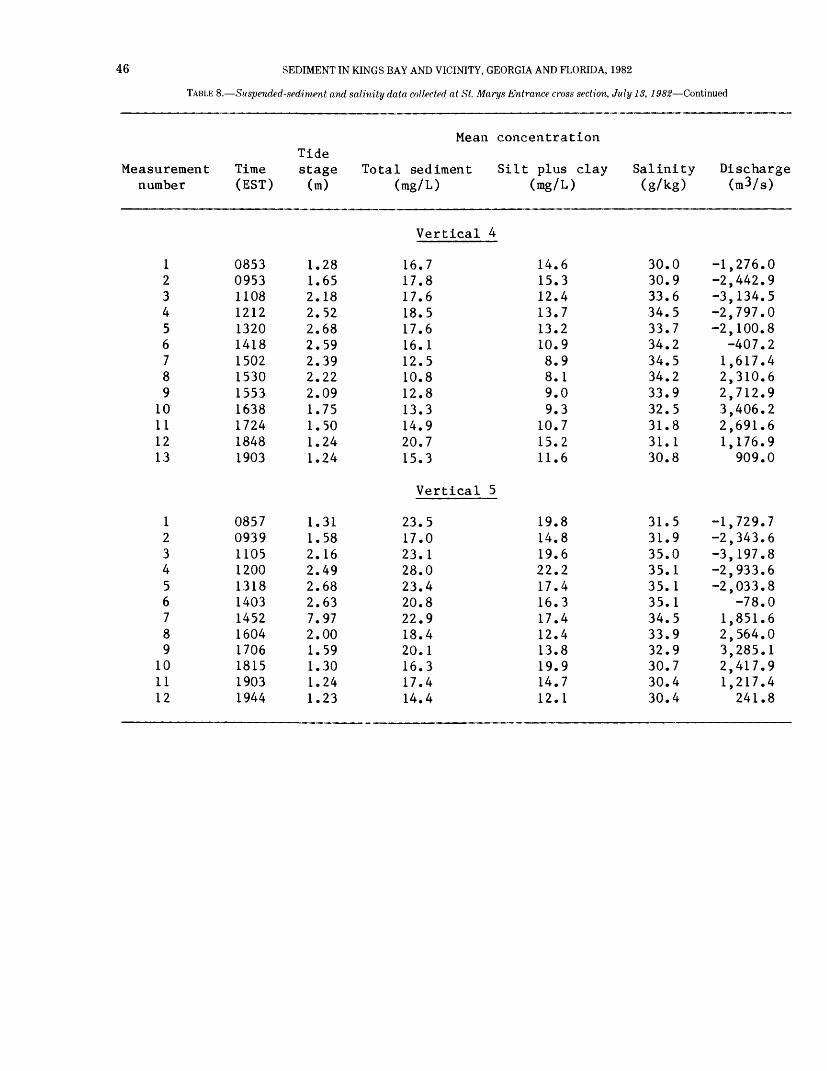
46 SEDIMENT IN KINGS BAY AND VICINITY, GEORGIA AND FLORIDA, 1982
TABLE 8. Suspended-sediment and salinity data collected at St. Marys Entrance cross section, July 13, 1982 Continued
Measurement Time number (EST)
123456789
10111213
123456789
101112
0853095311081212132014181502153015531638172418481903
085709391105120013181403145216041706181519031944
Mean concentration Tide stage Total sediment Silt plus clay (m) (mg/L) (mg/L)
1.281.652.182.522.682.592.392.222.091.751.501.241.24
1.311.582.162.492.682.637.972.001.591.301.241.23
Vertical 4
16.717.817.618.517.616.112.510.812.813.314.920.715.3
Vertical 5
23.517.023.128.023.420.822.918.420.116.317.414.4
14.615.312.413.713.210.98.98.19.09.3
10.715.211.6
19.814.819.622.217.416.317.412.413.819.914.712.1
Salinity (g/kg)
30.030.933.634.533.734.234.534.233.932.531.831.130.8
31.531.935.035.135.135.134.533.932.930.730.430.4
Discharge (m3/ s )
-1,276.0-2,442.9-3,134.5-2,797.0-2,100.8
-407.21,617.42,310.62,712.93,406.22,691.61,176.9909.0
-1,729.7-2,343.6-3,197.8-2,933.6-2,033.8
-78.01,851.62,564.03,285.12,417.91,217.4241.8
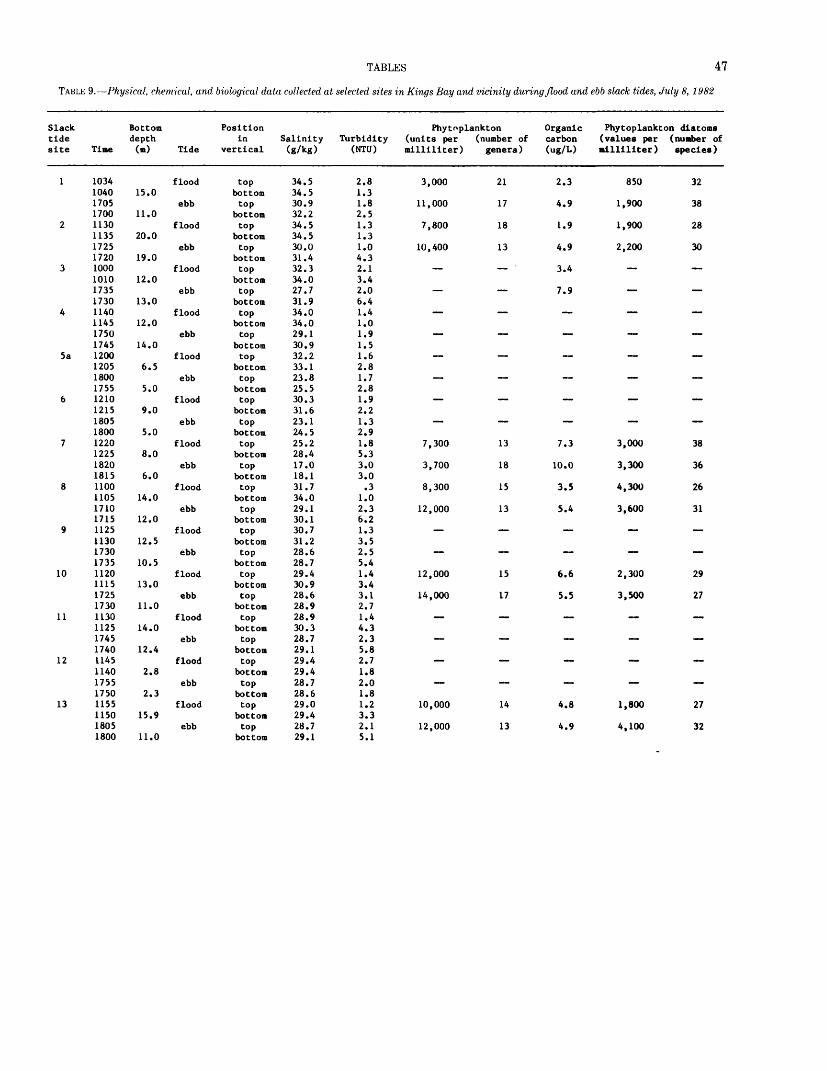
TABLES 47
TABLE 9. Physical, chemical, and biological data collected at selected sites in Kings Bay and vicinity during flood and ebb slack tides, July 8, 1982
Slack tide site
1
2
3
4
5a
6
7
8
9
10
11
12
13
Time
1034 10401705 17001130 11351725 17201000 10101735 17301140 11451750 17451200 12051800 17551210 12151805 18001220 12251820 18151100 11051710 17151125 11301730 17351120 11151725 17301130 11251745 17401145 11401755 17501155 11501805 1800
Bottom depth (m)
15.0
11.0
20.0
19.0
12.0
13.0
12.0
14.0
6.5
5.0
9.0
5.0
8.0
6.0
14.0
12.0
12.5
10.5
13.0
11.0
14.0
12.4
2.8
2.3
15.9
11.0
Tide
flood
ebb
flood
ebb
flood
ebb
flood
ebb
flood
ebb
flood
ebb
flood
ebb
flood
ebb
flood
ebb
flood
ebb
flood
ebb
flood
ebb
flood
ebb
Position in
vertical
top bottomtop
bottomtop
bottomtop
bottomtop
bottomtop
bottomtop
bottomtop
bottomtop
bottomtop
bottomtop
bottomtop
bottomtop
bottomtop bottomtop
bottomtop
bottomtop
bottomtop
bottomtop
bottomtop
bottomtop
bottomtop
bottomtop
bottomtop
bottomtop
bottomtop
bottom
Salinity (g/kg)
34.5 34.530.9 32.234.5 34.530.0 31.432.3 34.027.7 31.934.0 34.029.1 30.932.2 33.123.8 25.530.3 31.623.1 24.525.2 28.417.0 18.131.7 34.029.1 30.130.7 31.228.6 28.729.4 30.928.6 28.928.9 30.328.7 29.129.4 29.428.7 28.629.0 29.428.7 29.1
Turbidity (NTU)
2.8 1.31.8 2.51.3 1.31.0 4.32.1 3.42.0 6.41.4 1.01.9 1.51.6 2.81.7 2.81.9 2.21.3 2.91.8 5.33.0 3.0.3
1.02.3 6.21.3 3.52.5 5.41.4 3.43.1 2.71.4 4.32.3 5.82.7 1.82.0 1.81.2 3.32.1 5.1
Phytoplankton (units per (number of milliliter) genera)
3,000
11,000
7,800
10,400
~*
7,300
3,700
8,300
12,000
12,000
14,000
~
10,000
12,000
21
17
18
13
~~
~
~
13
18
15
13
15
17
~~
14
13
Organic carbon (ug/L)
2.3
4.9
1.9
4.9
3.4
7.9
~
~~
7.3
10.0
3.5
5.4
6.6
5.5
4.8
4.9
Phytoplankton diatoms (values per (number of ailliliter) species)
850
1,900
1,900
2,200
~*
~~
3,000
3,300
4,300
3,600
"
2,300
3,500
~
~~
1,800
4,100
32
38
28
30
~ ~
"~~
38
36
26
31
~
29
27
~~
~
27
32
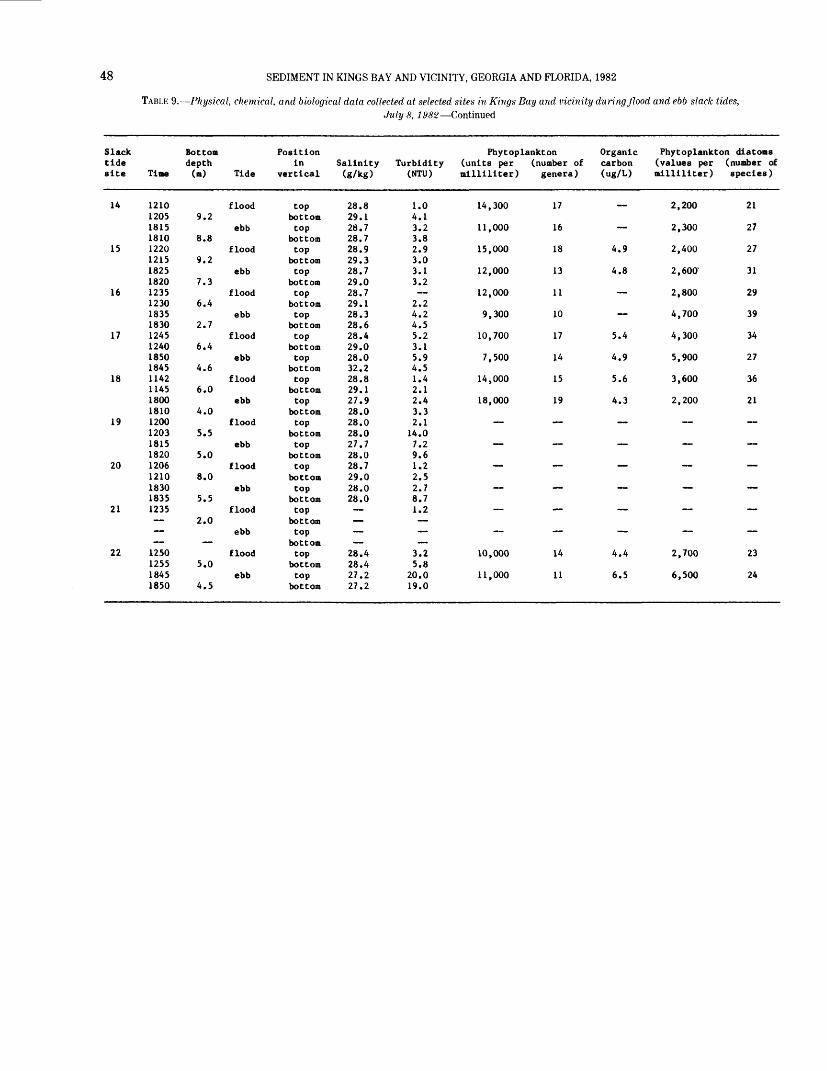
48 SEDIMENT IN KINGS BAY AND VICINITY, GEORGIA AND FLORIDA, 1982
TABLE 9. Physical, chemical, and biological data collected at selected sites in Kings Bay and vicinity during flood and ebb slack tides,JulyS, 1982 Continued
Slack tide site
14
15
16
17
18
19
20
21
22
Time
12101205181518101220121518251820123512301835183012451240185018451142114518001810120012031815182012061210183018351235 1250125518451850
Bottom depth (m)
9.2
8.8
9.2
7.3
6.4
2.7
6.4
4.6
6.0
4.0
5.5
5.0
8.0
5.5
2.0
5.0
4.5
Tide
flood
ebb
flood
ebb
flood
ebb
flood
ebb
flood
ebb
flood
ebb
flood
ebb
flood
ebb
flood
ebb
Position In
vertical
topbottomtop
bottomtop
bottomtop
bottomtop
bottomtop
bottomtop
bottomtop
bottomtop
bottomtop
bottomtop
bottomtop
bottomtop
bottomtopbottomtop
bottomtop
bottomtopbottomtop
bottom
Salinity (g/kg)
28.829.128.728.728.929.328.729.028.729.128.328.628.429.028.032.228.829.127.928.028.028.027.728.028.729.028.028.0 28.428.427.227.2
Turbidity (NTU)
1.04.13.23.82.93.03.13.2 2.24.24.55.23.15.94.51.42.12.43.32.114.07.29.61.22.52.78.71.2 3.25.8
20.019.0
Phytoplankton (units per (number of mlllillter) genera)
14,300
11,000
15,000
12,000
12,000
9,300
10,700
7,500
14,000
18,000
10,000
11,000
17
16
18
13
11
10
17
14
15
19
14
11
Organic Phytoplankton diatoms carbon (values per (number of (ug/L) mlllillter) species)
2,200
2,300
4.9 2,400
4.8 2,600'
~ 2,800
4,700
5.4 4,300
4.9 5,900
5.6 3,600
4.3 2,200
4.4 2,700
6.5 6,500
21
27
27
31
29
39
34
27
36
21
23
24
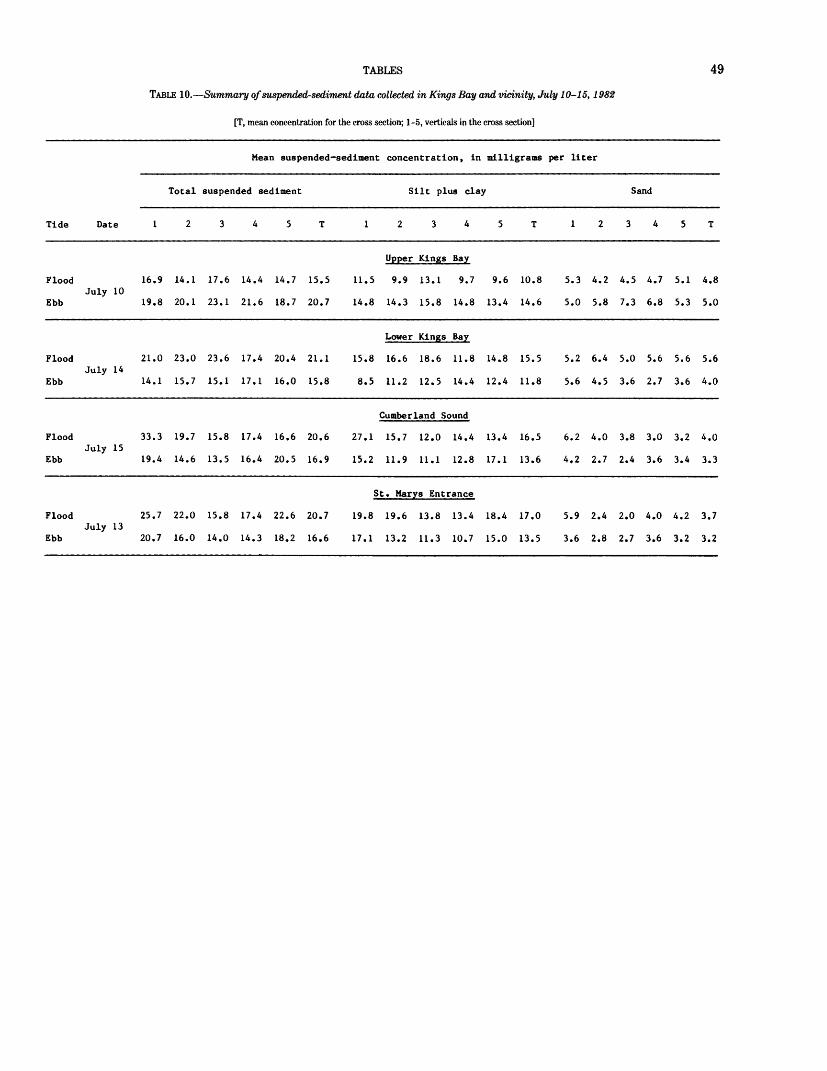
TABLES
TABLE 10. Summary of suspended-sediment data collected in Kings Bay and vicinity, July 10-15,1982
[T, mean concentration for the cross section; 1-5, verticals in the cross section]
49
Mean suspended-sediment concentration, in milligrams per liter
Total suspended sediment Silt plus clay Sand
Tide Date 1 1 1 2 3 4 5 T
Flood
EbbJuly 10
16.9 14.1 17.6 14.4 14.7 15.5
19.8 20.1 23.1 21.6 18.7 20.7
Upper Kings Bay
11.5 9.9 13.1 9.7 9.6 10.8
14.8 14.3 15.8 14.8 13.4 14.6
5.3 4.2 4.5 4.7 5.1 4.8
5.0 5.8 7.3 6.8 5.3 5.0
Flood 21.0 23.0 23.6 17.4 20.4 21.1July 14
Ebb 14.1 15.7 15.1 17.1 16.0 15.8
Lower Kings Bay
15.8 16.6 18.6 11.8 14.8 15.5
8.5 11.2 12.5 14.4 12.4 11.8
5.2 6.4 5.0 5.6 5.6 5.6
5.6 4.5 3.6 2.7 3.6 4.0
Flood 33.3 19.7 15.8 17.4 16.6 20.6July 15
Ebb 19.4 14.6 13.5 16.4 20.5 16.9
Cumberland Sound
27.1 15.7 12.0 14.4 13.4 16.5
15.2 11.9 11.1 12.8 17.1 13.6
6.2 4.0 3.8 3.0 3.2 4.0
4.2 2.7 2.4 3.6 3.4 3.3
St. Marys Entrance
Flood 25.7 22.0 15.8 17.4 22.6 20.7 19.8 19.6 13.8 13.4 18.4 17.0 5.9 2.4 2.0 4.0 4.2 3.7July 13
Ebb 20.7 16.0 14.0 14.3 18.2 16.6 17.1 13.2 11.3 10.7 15.0 13.5 3.6 2.8 2.7 3.6 3.2 3.2
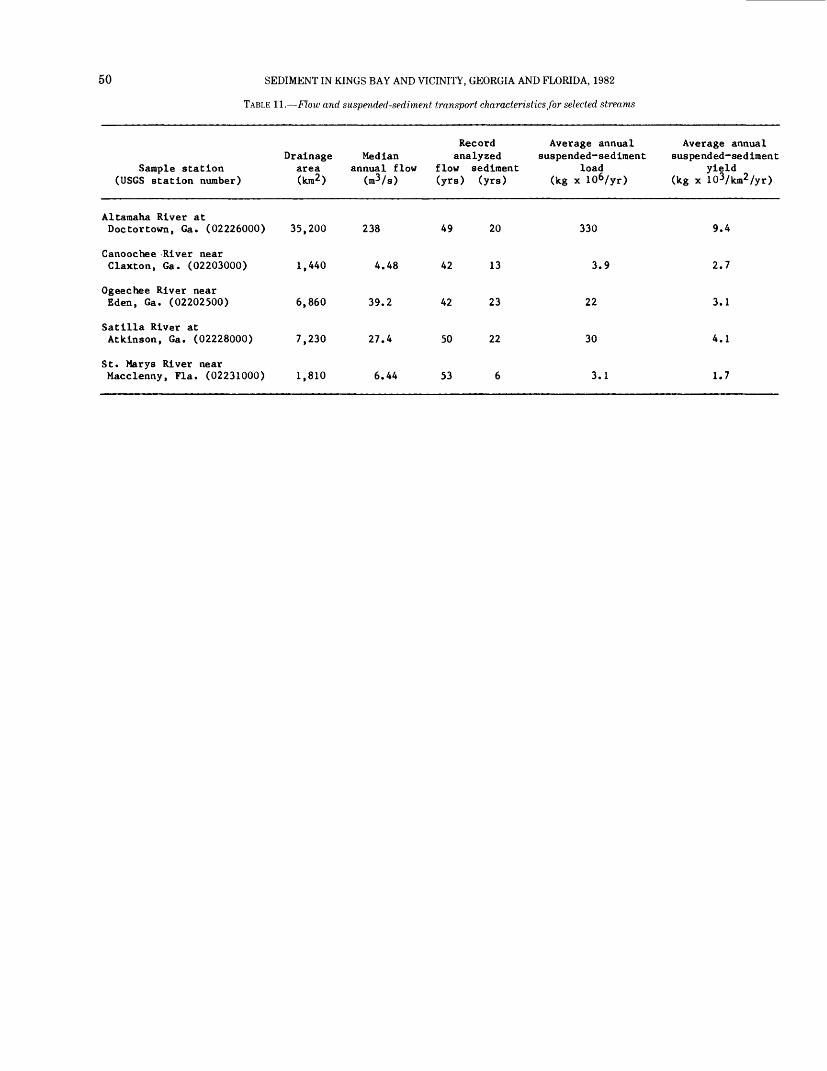
50 SEDIMENT IN KINGS BAY AND VICINITY, GEORGIA AND FLORIDA, 1982
TABLE 11. Flow and suspended-sediment transport characteristics for selected streams
Sample station (USGS station number)
Altamaha River at Doctortown, Ga. (02226000)
Canoochee River near Claxton, Ga. (02203000)
Ogeechee River near Eden, Ga. (02202500)
Satilla River at Atkinson, Ga. (02228000)
St. Marys River near Macclenny, Fla. (02231000)
Drainage area (km2)
35,200
1,440
6,860
7,230
1,810
Med ian annual flow
(m3/s)
238
4.48
39.2
27.4
6.44
Record analyzed
flow sediment (yrs) (yrs)
49 20
42 13
42 23
50 22
53 6
Average annual suspended-sediment
load (kg x 106/yr)
330
3.9
22
30
3.1
Average annual suspended-sediment
yield (kg x 103/km2 /yr)
9.4
2.7
3.1
4.1
1.7
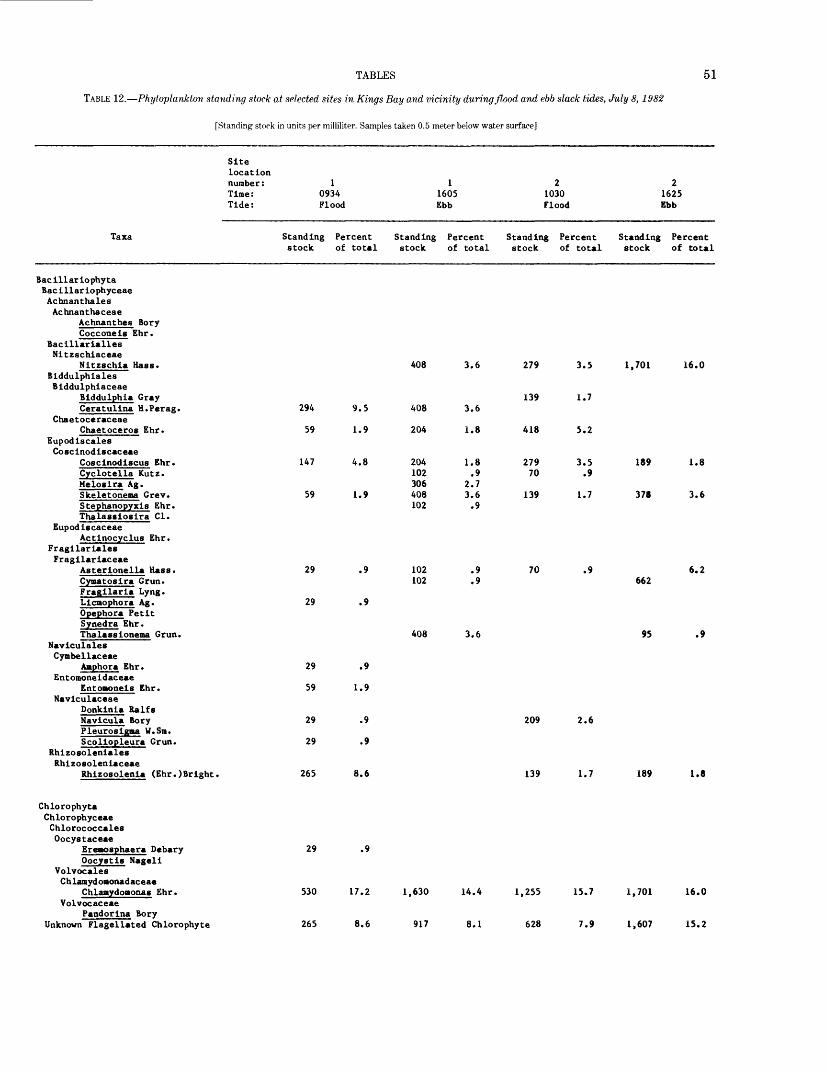
TABLES 51
TABLE 12. Phytoplankton standing stock at selected sites in Kings Bay and vicinity during flood and ebb slack tides, July 8, 1982
[Standing stock in units per milliliter. Samples taken 0.5 meter below water surface]
Site location nuraber : 1 I Time: 0934 1605 Tide : Flood Ebb
Taxa Standing Percent Standing Percent stock of total stock of total
Bacillariophyta Bacillariophyceae Achnanthales Achnanthaceae
Achnanthes BoryCocconeis Ehr.
Bacillarialles Nitzschiaceae
Nitzschia Has s. 408 3.6Biddulphiales Biddulphiaceae
Biddulphia Gray Ceratulina H.Perag. 294 9.5 408 3.6
Chaetoceraceae Chaetoceros Ehr. 59 1.9 204 1.8
Eupodiscales Coscinodiscaceae
Coscinodiscus Ehr. 147 4.8 204 1.8Cyclotella Kutz. 102 .9 Melosira Ag. 306 2.7Skeletonema Grev. 59 1.9 408 3.6Stephanopyxis Ehr. 102 .9 Thalassiosira Cl.
Eupodiscaceae Actinocyclus Ehr.
Fragilariales Fragilariaceae
Asterionella Hass. 29 .9 102 .9Cymatosira Grun. 102 .9 Fragilaria Lyng. Licmophora Ag. 29 .9 Opephora Petit Synedra Ehr. Thalassionema Grun. 408 3.6
Naviculales Cymbellaceae
Amphora Ehr. 29 .9 Entomoneidaceae
Entomoneis Ehr. 59 1.9Naviculaceae
Donkinia RalfsNavicula Bory 29 .9Pleurosigma W.Sm. Scoliopleura Grun. 29 .9
Rhizosoleniales Rhizosoleniaceae
Rhizosolenia (Ehr.)Bright. 265 8.6
Chlorophyta Chlorophyceae Chlorococcales Oocystaceae
Ereaosghaera Debary 29 .9Oocystis Nageli
Volvocales ChlamydoBonadaceae
Chlamydononas Ehr. 530 17.2 1,630 14.4 Volvocaceae
Pandorina Bory
2 2 1030 1625 Flood Ebb
Standing Percent Standing Percent stock of total stock of total
279 3.5 1,701 16.0
139 1.7
418 5.2
279 3.5 189 1.8 70 .9
139 1.7 378 3.6
70 .9 6.2 662
95 .9
209 2.6
139 1.7 189 1.8
1,255 15.7 1,701 16.0
Unknown Flagellated Chlorophyte
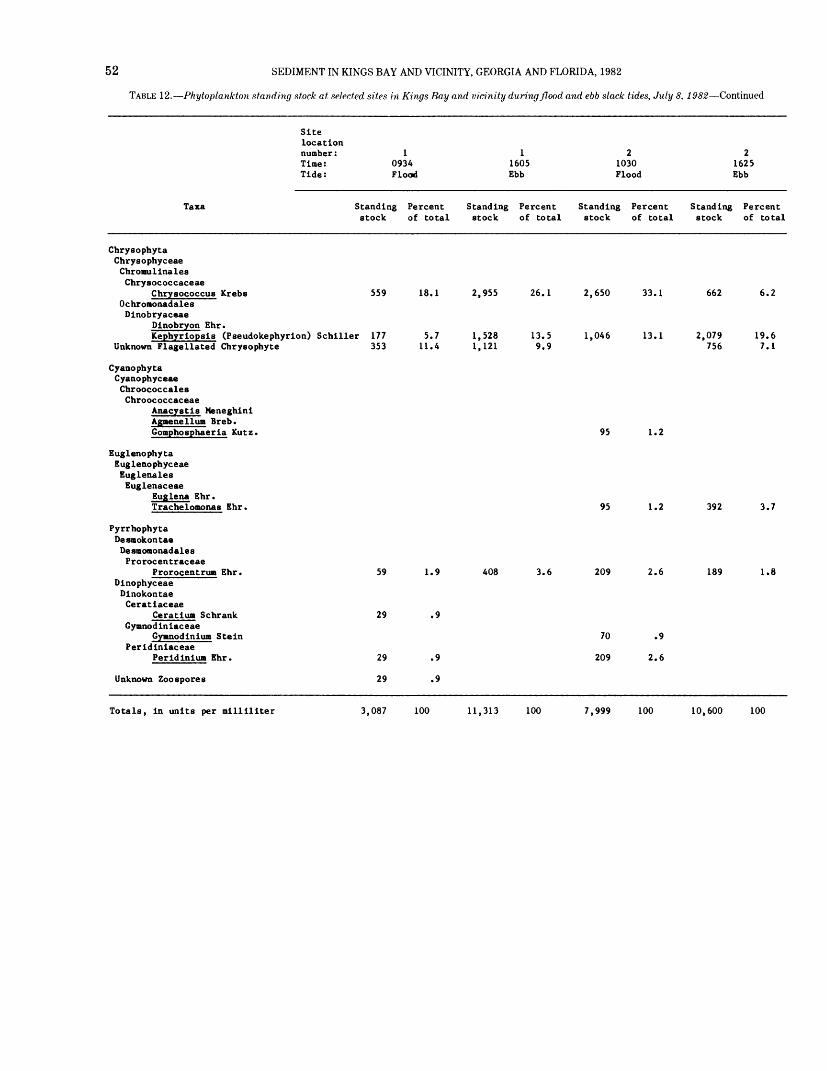
52 SEDIMENT IN KINGS BAY AND VICINITY, GEORGIA AND FLORIDA, 1982
TABLE 12. Phytoplankton standing stock at selected sites in Kings Bay and vicinity during flood and ebb slack tides, July 8, 1982 Continued
Sitelocationnumber : 1Time: 0934Tide: Flood
Taxa Standing Percentstock of total
ChrysophytaChrysophyceaeChrontulinalesChrysococcaceae
Chrysococcus Krebs 559 18.1OchromonadalesDinobryaceae
Dinobryon Ehr.Kephyriopsis (Pseudokephyrion) Schiller 177 5.7
Unknown Flagellated Chrysophyte 353 11.4
CyanophytaCyanophyceaeChroococcalesChroococcaceae
Anacystis MeneghiniAgmenellum Breb.Gomphosphaeria Kutz.
EuglenophytaEuglenophyceaeEuglenalesEuglenaceae
Euglena Ehr.Trachelomonas Ehr.
PyrrhophytaDesmokontaeDesmomonadalesProrocentraceae
Prorocentrun Ehr. 59 1.9DinophyceaeDinokontaeCeratiaceae
Ceratium Schrank 29 .9Gymnod in lac eae
Gymnodinium SteinPeridiniaceae
Peridinium Ehr. 29 .9
1 2 21605 1030 1625Ebb Flood Ebb
Standing Percent Standing Percent Standing Percentstock of total stock of total stock of total
2,955 26.1 2,650 33.1 662 6.2
1,528 13.5 1,046 13.1 2,079 19.61,121 9.9 756 7.1
95 1.2
95 1.2 392 3.7
408 3.6 209 2.6 189 1.8
70 .9
209 2.6
Unknown Zoo spores 29 .9
Totals, in units per milliliter 3,087 100 11,313 100 7,999 100 10,600 100
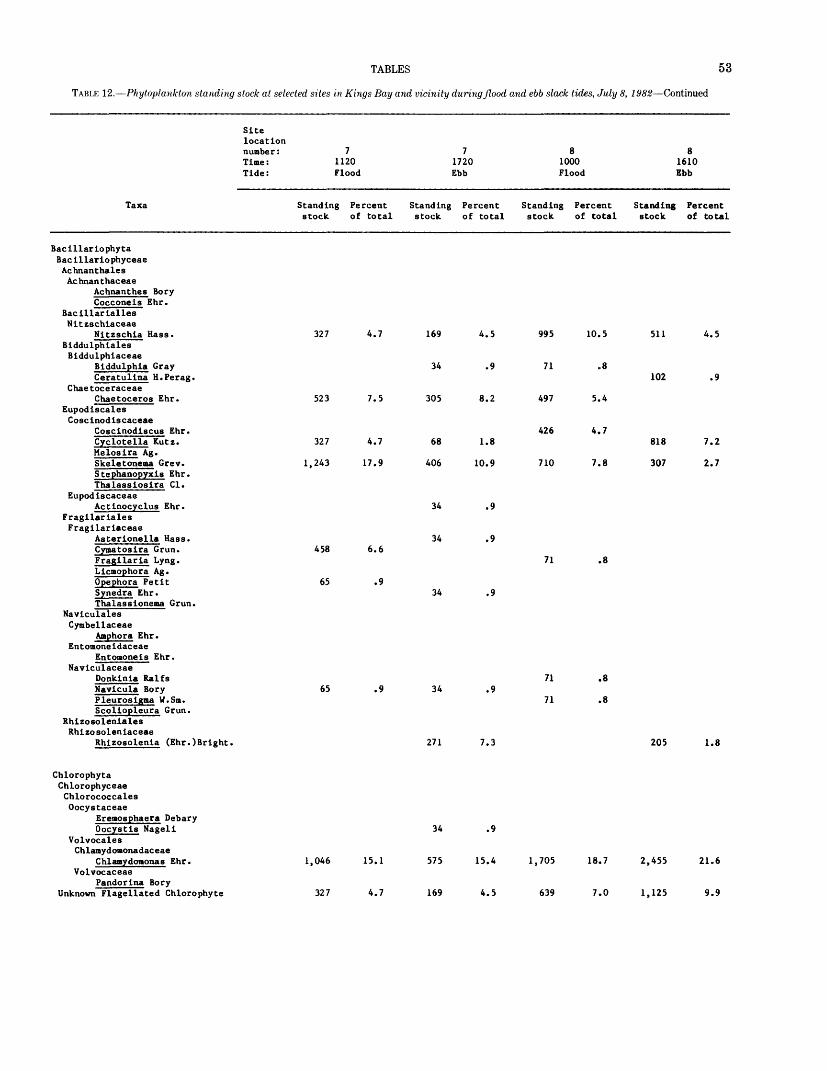
TABLES 53
TABLE 12. Phytoplankton standing stock at selected sites in Kings Bay and vicinity during flood and ebb slack tides, July 8, 1982 Continued
Site location number : 7 7 Time: 1120 1720 Tide: Flood Ebb
Taxa Standing Percent Standing Percent stock of total stock of total
Bacillariophyta Bacillariophyceae Achnanthales Achnanthaceae
Achnanthes BoryCocconeis Ehr.
Bacillarialles Nitzschiaceae
Nitzschia Hass. 327 4.7 169 4.5Biddulphiales Biddulphiaceae
Biddulphia Gray 34 .9Ceratulina H.Perag.
Chaetoceraceae Chaetoceros Ehr. 523 7.5 305 8.2
Eupodiscales Coscinodiscaceae
Coscinodiscus Ehr.Cyclotella Kutz. 327 4.7 68 1.8 Helosira Ag.Skeletonema Grev. 1,243 17.9 406 10.9Stephanopyxis Ehr. Thalassiosira Cl.
Eupodiscaceae Actinocyclus Ehr. 34 .9
Fragilariales Fragilariaceae
Asterionella Hass. 34 .9Cymatosira Grun. 458 6.6 Fragilaria Lyng. Licmophora Ag. Opephora Petit 65 .9 Synedra Ehr. 34 .9 Thalassionema Grun.
Naviculales Cymbal laceae
Amphora Ehr. Ent omone i dac eae
Entomoneis Ehr.Naviculaceae
Donkinia Ralfs Navicula Bory 65 .9 34 .9Pleurosigma W.Sm. Scoliopleura Grun.
Rhizosoleniales Rhizosoleniaceae
Rhizosolenia (Ehr.)Bright. 271 7.3
Chlorophyta Chlorophyceae Chlorococcales Oocystaceae
Eremosphaera Debary Oocystts Nageli 34 .9
Volvocales Chlamydomonadaceae
Chlamydomonas Ehr. 1,046 15.1 575 15.4Volvocaceae
Pandorina Bory
8 8 1000 1610 Flood Ebb
Standing Percent Standing Percent stock of total stock of total
995 10.5 511 4.5
71 .8 102 .9
497 5.4
426 4.7 818 7.2
710 7.8 307 2.7
71 .8
71 .8
71 .8
205 1.8
1,705 18.7 2,455 21.6
Unknown Flagellated Chlorophyte
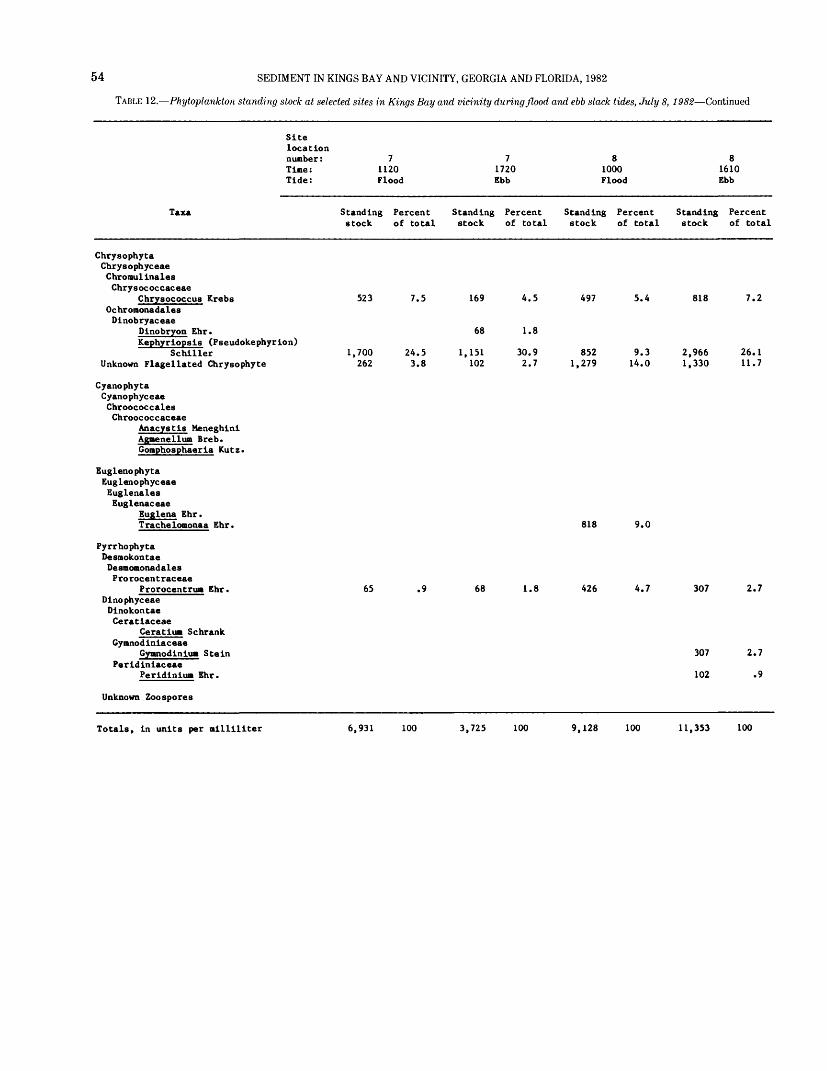
54 SEDIMENT IN KINGS BAY AND VICINITY, GEORGIA AND FLORIDA, 1982
TABLE 12. Phytoplankton standing stock at selected sites in Kings Bay and vicinity during flood and ebb slack tides, July 8, 1982 Continued
Sitelocationnumber :Time:Tide:
71120Flood
71720Ebb
81000Flood
81610Ebb
Taxa Standing Percent Standing Percent Standing Percent Standing Percent stock of total stock of total stock of total stock of total
Chrysophyta Chrysophyceae Chromulinales Chrysococcaceae
Chrysococcus Krebs Ochromonadales Dinobryaceae
Dinobryon Ehr.Kephyriopsis (Pseudokephyrion)
Schiller Unknown Flagellated Chrysophyte
Cyanophyta Cyanophyceae Chroococcales Chroococcaceae
Anacystis Meneghini Agaenellum Breb. Gomphosphaeria Kutz.
Euglenophyta Buglenophyceae Euglenales Euglenaceae
Euglena Ehr. Trachelomonaa Ehr.
Pyrrhophyta Desmokontae Desmomonadales Prorocentraceae
Prorocentrun Ehr. Dinophyceae Dinokontae Ceratiaceae
Ceratiua Schrank Gymnodinia ceae
Gynnodinl.ua Stein Peridiniaceae
Peridiniun Ehr.
Unknown Zoospores
523
1,700262
7.5
24.5 3.8
65 .9
169
68
1,151102
4.5
1.8
30.9 2.7
497
8521,279
5.4
9.314.0
818
2,9661,330
307
102
7.2
26.111.7
818 9.0
68 1.8 426 4.7 307 2.7
2.7
.9
Totals, in units per nilliliter >,931 100 3,725 100 9,128 100 11,353 100
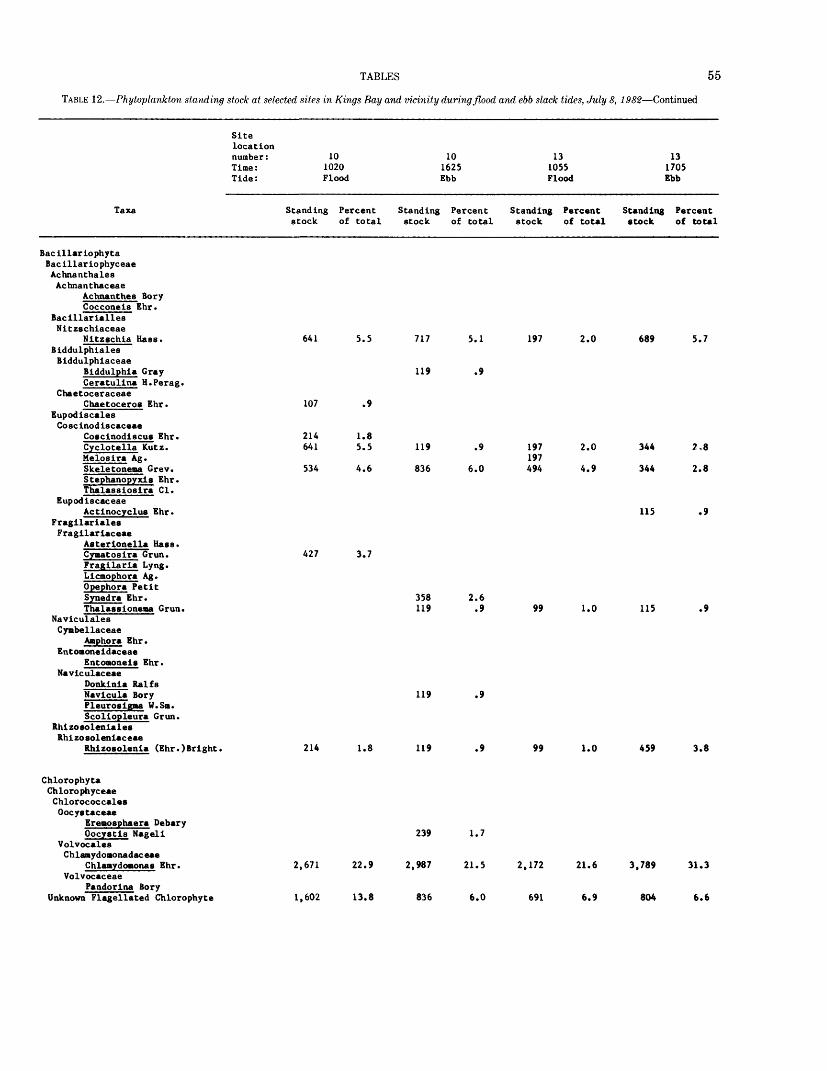
TABLES 55
TABLE 12. Phytoplankton standing stock at selected sites in Kings Bay and vicinity during flood and ebb slack tides, July 8, 1982 Continued
Sitelocationnumber :Time:Tide:
101020Flood
101625Ebb
131055Flood
131705Ebb
Taxa Standing Percent Standing Percent Standing Percent Standing Percent stock of total stock of total stock of total stock of total
Bacillariophyta Bacillariophyceae Achnanthales Achnanthaceae
Achnanthes BoryCocconeis Ehr.
Bacillarialles Nitzschiaceae
Nitzschia Hass. Biddulphiales Biddulphiaceae
Biddulphia GrayCeratulina H.Perag.
ChaetoceraceaeChaetoceros Ehr.
Eupodiscales Coscinodiscaceae
Cogcinodiscus Ehr.Cyclotella Kutz.Melosira Ag.Skeletonema Grev.Stephanopyxig Ehr.Thalassiosira Cl.
EupodiscaceaeActinocyclua Ehr.
Fragilariales Fragilariaceae
Astertonella Hass.Cymatosira Grun.Fragilaria Lyng.Licmophora Ag.Opephora PetitSynedra Ehr.Thalaggjonena Grun.
Naviculales Cymbellaceae
Amphora Ehr. Entononeidaceae
Entomoneis Ehr. Naviculaceae
Donkinia RalfsNavicula BoryPleurosigma W.Sn.Scollopleura Grun.
Rhizosoleniales Rhizosoleniaceae
Rhizogolenla (Ehr.)Bright.
641
107
214641
534
5.5
.9
1.8 5.5
4.6
717
119
5.1
.9
197 2.0 689 5.7
119
836
.9
6.0
197197494
2.0
4.9
344
344
115
2,8
2.8
.9
427 3.7
358119
2.6 .9 99 1.0 115 .9
214 1.8
119
119
.9
.9 99 1.0 459 3.8
Chlorophyta Chlorophyceae Chlorococcales Oocystaceae
Ereaoaphaera Debary Oocystis Nagell
Volvocales Chlamydononadaceae
Chlamydomonag Ehr. Volvocaceae
Pandorina Bory Unknown Flagellated Chlorophyte
239 1.7
2,671 22.9 2,987 21.5 2,172 21.6 3,789 31.3
1,602 13.8 836 6.0 691 6.9 804 6.6
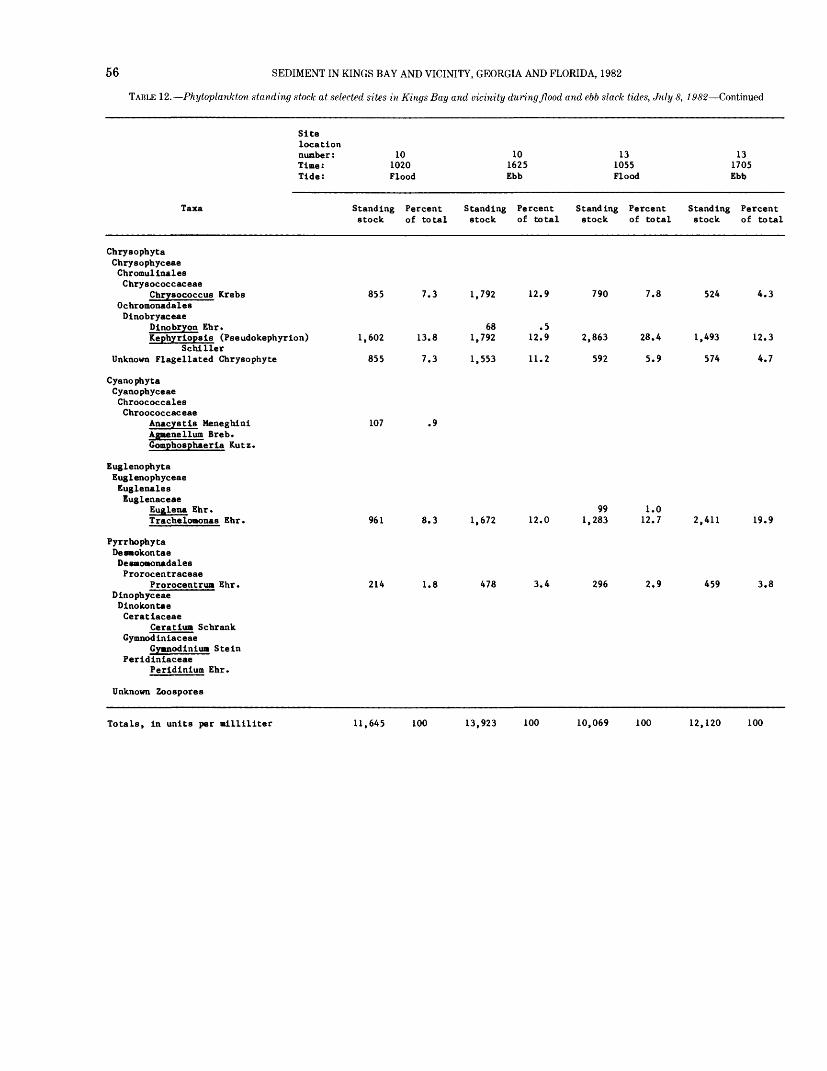
56 SEDIMENT IN KINGS BAY AND VICINITY, GEORGIA AND FLORIDA, 1982
TABLE 12. Phytoplankton standing stock at selected sites in Kings Bay and vicinity during flood and ebb slack tides, July 8, 1982 Continued
Sitelocationnumber: 10 10Time: 1020 1625Tide: Flood Ebb
Taxa Standing Percent Standing Percentstock of total stock of total
ChrysophytaChrysophyceaeChromulinalesChrysococcaceae
Chrysococcus Krebs 855 7.3 1,792 12.9OchromonadalesDinobryaceae
Dinobryon Ehr . 68 . 5Kephyriopsis (Pseudokephyrion) 1,602 13.8 1,792 12.9
SchillerUnknown Flagellated Chrysophyte 855 7.3 1,553 11.2
CyanophytaCyanophyceaeChroococcalesChroococcaceae
Anacystis Meneghini 107 .9Agmenellum Breb.Gomphosphaeria Kutz.
EuglenophytaEuglenophyceaeEuglenalesEuglenaceae
Euglena Ehr.Trachelomonas Ehr. 961 8.3 1.672 12.0
PyrrhophytaDesmokontaeDesmomonadalesProrocentraceae
Prorocentrua Ehr. 214 1.8 478 3.4DinophyceaeDinokontaeCeratiaceae
Ceratiun SchrankGymnodiniaceae
Gymnodiniua SteinPeridiniaceae
Peridinium Ehr.
13 131055 1705Flood Ebb
Standing Percent Standing Percentstock of total stock of total
790 7.8 524 4.3
2,863 28.4 1,493 12.3
592 5.9 574 4.7
99 1.01,283 12.7 2,411 19.9
296 2.9 459 3.8
Unknown Zoospores
Totals, in units per milliliter 11,645 100 13,923 100 10,069 100 12,120 100
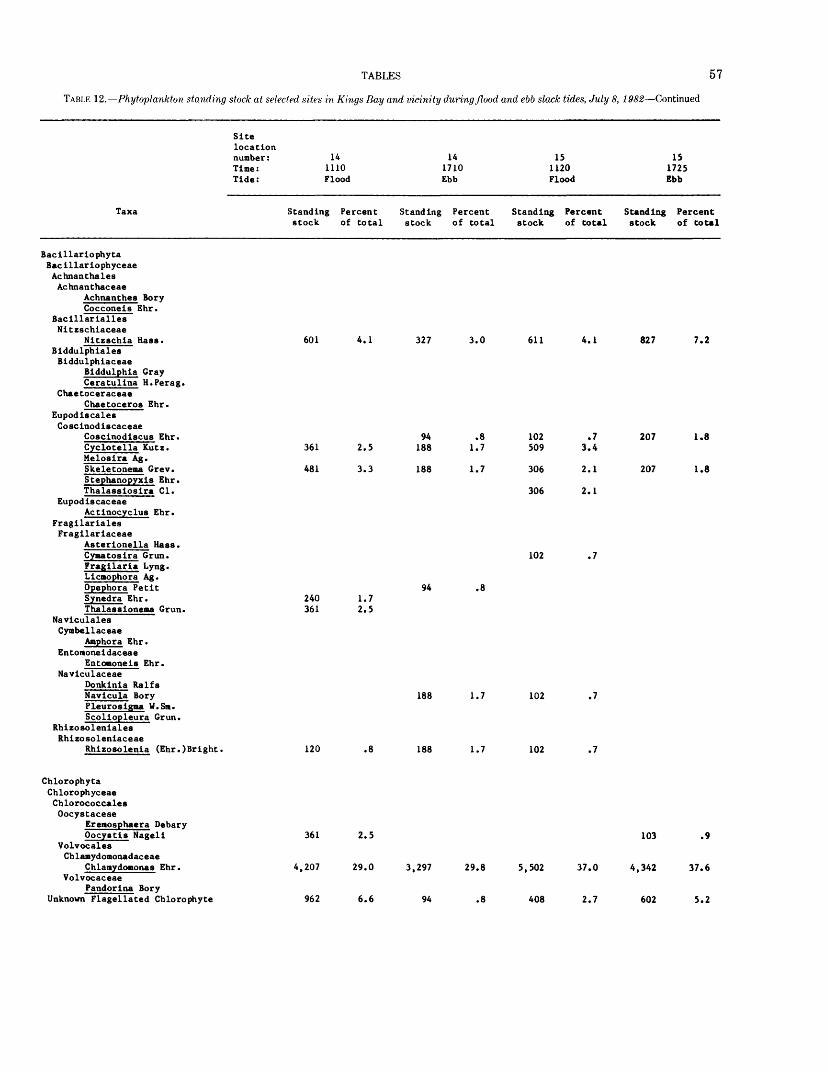
TABLES 57
TABLE 12. Phytoplankton standing stock at selected sites in Kings Bay and vicinity during flood and ebb slack tides, July 8, 1982 Continued
Sitelocationnumber :Time:Tide:
141110Flood
141710Ebb
151120Flood
151725Ebb
Taxa Standing Percent Standing Percent Standing Percent Standing Percent stock of total stock of total stock of total stock of total
Bac illariophyta Bac illariophyceae Achnanthales Achnanthaceae
Achnanthes BoryCocconeis Ehr.
Bacillarlalles Nitzschiaceae
Nitzschia Hass. Biddulphiales Biddulphiaceae
Biddulphia GrayCeratulina H.Perag.
ChaetoceraceaeChaetoceros Ehr.
Eupodiscales Coscinodlscaceae
Coscinodiscus Ehr.Cyclotella Kutz.Melosira Ag.Skeletonena Grev.Stephanopyxis Ehr.Thalassiosira Cl.
Eupod is cac eaeActinocyclus Ehr.
Fragilariales Fragilariaceae
Asterionella Hass.Cymatosira Grun.Fragilaria Lyng.Licmophora Ag.Opephora PetitSynedra Ehr.Thalaaaionema Grun.
Navlculales Cymbellaceae
Amphora Ehr. Entomoneidaceae
Entomonets Ehr. Naviculaceae
Donkinia RalfsNavicula BoryPleuroaigma W.Sm.Scoliopleura Grun.
Rhlzosoleniales Rhizosoleniaceae
Rhizosolenta (Ehr.)Bright.
601 4.1 327 3.0 611 4.1 827 7.2
361
481
2.5
3.3
94188
188
.8 1.7
1.7
102509
306
306
102
.7 3.4
2.1
2.1
.7
207
207
1.8
1.8
94 .8240361
1.7 2.5
120 .8
188
188
1.7
1.7
102
102
.7
.7
Chlorophyta Chlorophyceae Chlorococcales Oocystaceae
Eremosphaera Debary Oocystts Nageli
Volvocales Chlamydomonadaceae
Chlamydomonas Ehr. Volvocaceae
Pandorina Bory Unknown Flagellated Chlorophyte
361 2.5 103 .9
4,207 29.0 3,297 29.8 5,502 37.0 4,342 37.6
962 6.6 94 .8 408 2.7 602 5.2
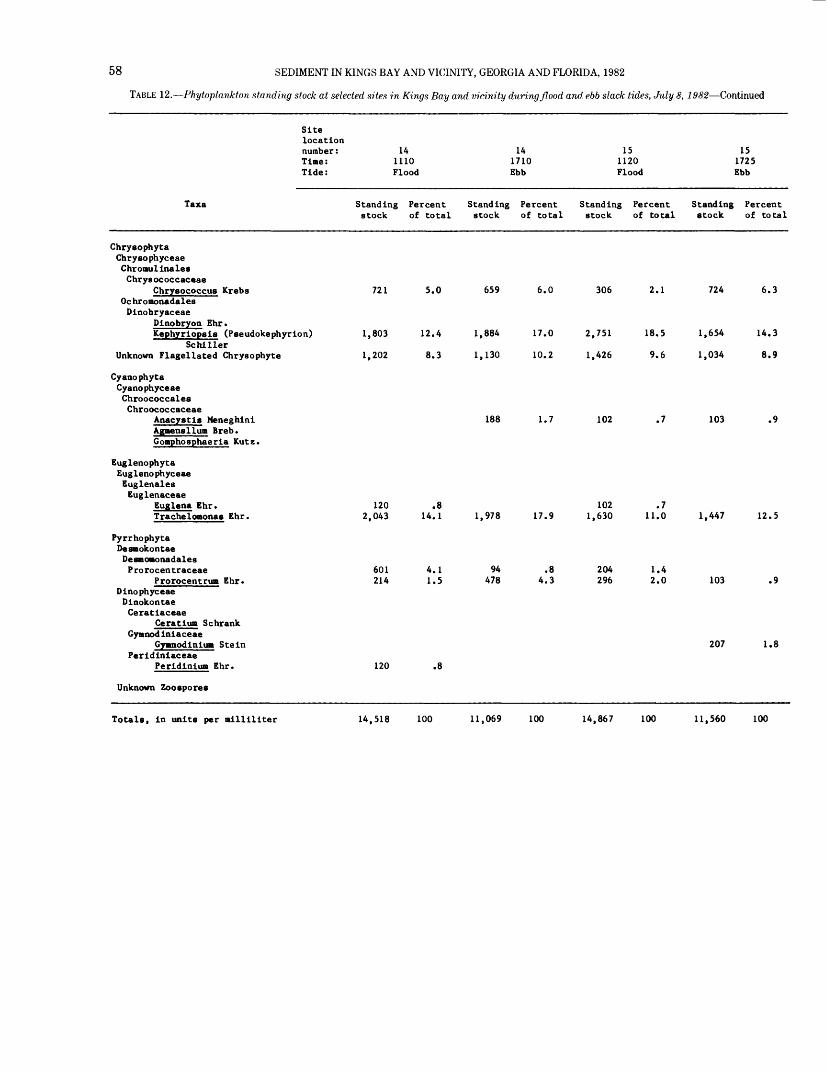
58 SEDIMENT IN KINGS BAY AND VICINITY, GEORGIA AND FLORIDA, 1982
TABLE 12. Phytoplankton standing stock at selected sites in Kings Bay and vicinity during flood and ebb slack tides, July 8, 1982 Continued
Sitelocationnumber: 14Time: 1110Tide: Flood
Taxa Standing Percentstock of total
ChrysophytaChrysophyceaeChromulinalesChr y s oc occaceae
Chrysococcus Krebs 721 5.0Oc hr omonadalesDinobryaceae
Dinobryon Ehr.Kephyriopsis (Pseudokephyrion) 1,803 12.4
SchillerUnknown Flagellated Chrysophyte 1,202 8.3
CyanophytaCyanophyceaeChroococcalesChroococcaceae
Anacystis MeneghiniAgaensllum Breb.Gomphosphaeria Kutz.
EuglenophytaEuglenophyceaeEuglenalesEuglenaceae
Euglena Ehr. 120 .8Trachelomonas Ehr. 2,043 14.1
PyrrhophytaDesaokontaeDesaononadalesProrocentraceae 601 4.1
Prorocentrum Ehr. 214 1.5DinophyceaeDinokontaeCeratiaceae
Ceratiuffl SchrankGyanod iniaceae
GymnodiniuM SteinPeridiniaceae
Perldlnium Ehr. 120 .8
14 15 151710 1120 1725Ebb Flood Ebb
Standing Percent Standing Percent Standing Percentstock of total stock of total stock of total
659 6.0 306 2.1 724 6.3
1,884 17.0 2,751 18.5 1,654 14.3
1,130 10.2 1,426 9.6 1,034 8.9
188 1.7 102 .7 103 .9
102 .71,978 17.9 1,630 11.0 1,447 12.5
94 .8 204 1.4478 4.3 296 2.0 103 .9
207 1.8
Unknown Zoospores
Totals, in units per milliliter 14,518 100 11,069 100 14,867 100 11,560 100
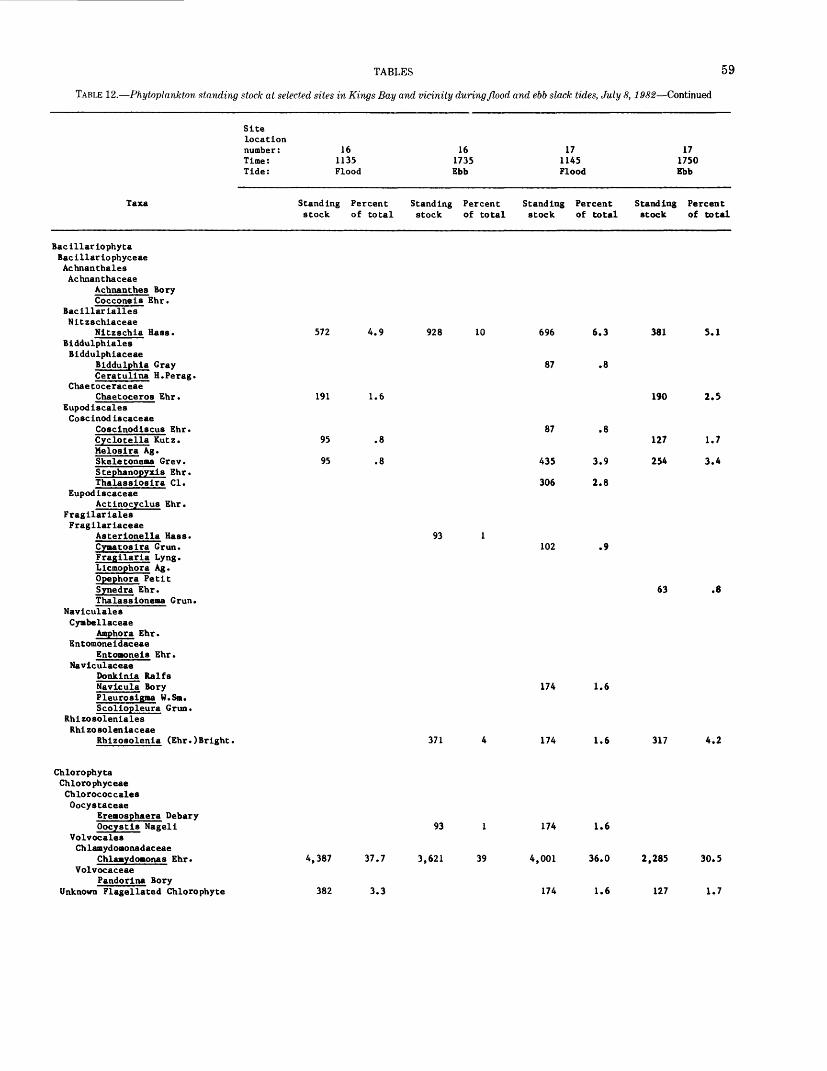
TABLES 59
TABLE 12. Phytoplankton standing stock at selected sites in Kings Bay and vicinity during flood and ebb slack tides, July 8, 1982 Continued
Taxa
Sitelocation number: Time: Tide:
161135 Flood
161735 Ebb
171145 Flood
171750 Ebb
Standing Percent stock of total
Standing Percent stock of total
Standing Percent stock of total
Standing Percent stock of total
Bacillariophyta Bad liar iophyceae Achnanthales Achnanthaceae
Achnanthes BoryCocconeis Ehr.
Bacillarialles Nitzschiaceae
Nitzschia Mass. Biddulphiales Biddulphiaceae
Biddulphia GrayCeratulina H.Perag.
ChaetoceraceaeChaetoceros Ehr.
Eupodiscales Coscinod iscaceae
Coscinodiscus Ehr.Cyclotella Kutz.Melosira Ag.Skeletoneaa Grev.Stephanopyxis Ehr.Thalassiosira Cl.
EupodiscaceaeActinocyclus Ehr.
Fragilariales Fragilariaceae
Asterionella Hass.Cyaatosira Grun.Fragilaria Lyng.Ljcmophora Ag.Opephora PetitSynedra Ehr.Thalassioneaa Grun.
Naviculales Cynbellaceae
Amphora Ehr. Entomoneidaceae
Entoaoneis Ehr. Naviculaceae
Donkinia RalfsNavicula BoryPleurosigma W.Sm.Scoliopleura Grun.
Rhi zosoleniales Rhi zosoleniaceae
Rhizosolenia (Ehr.)Bright.
Chlorophyta Chlorophyceae Chlorococcales Oocystaceae
Erenosphaera Debary Oocystis Nageli
Volvocales Chlamydomonadaceae
Chlaaydoaonas Ehr. Volvocaceae
Pandorina Bory Unknown Flagellated Chlorophyte
572 4.9 928 10
191 1.6
95 .8
95 .8
93 1
696
87
87
435
306
102
6.3
.8
.8
3.9
2.8
381
190
127
254
5.1
2.5
1.7
3.4
63 .8
371
174
174
1.6
1.6 317 4.2
93 1
4,387 37.7 3,621 39
382 3.3
174 1.6
4,001 36.0 2,285 30.5
174 1.6 127 1.7
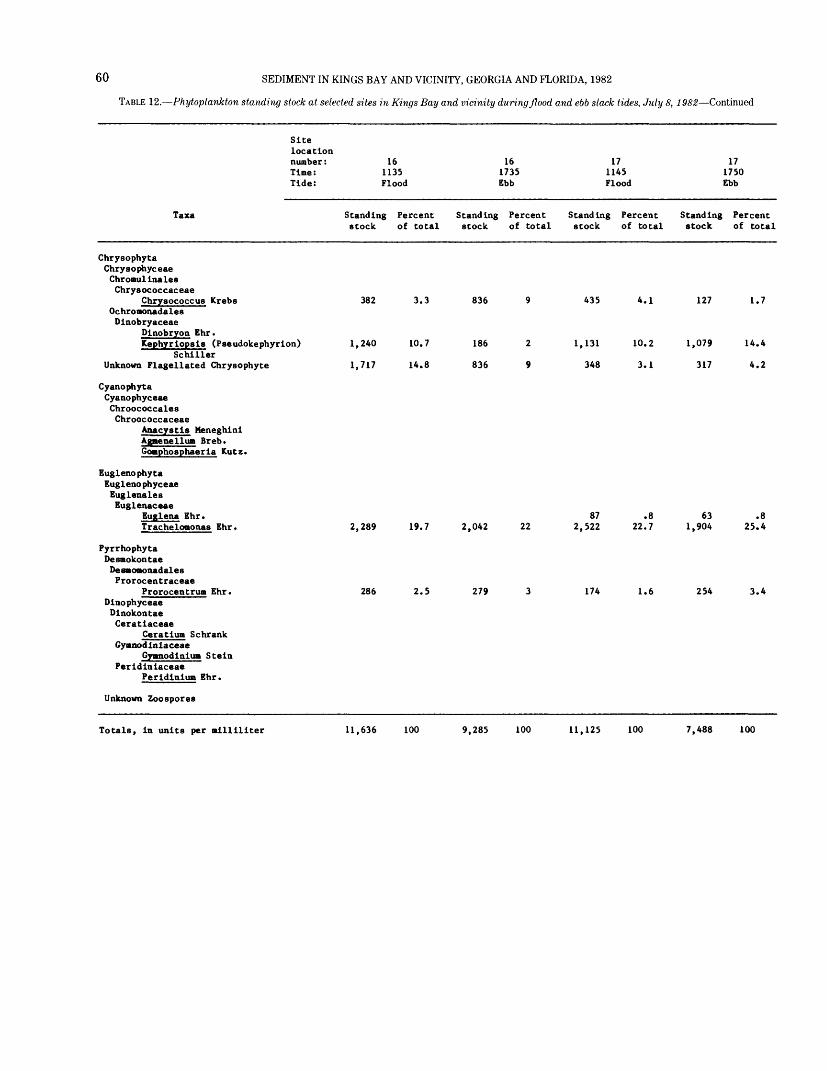
60 SEDIMENT IN KINGS BAY AND VICINITY, GEORGIA AND FLORIDA, 1982
TABLE 12. Phytoplankton standing stock at selected sites in Kings Bay and vicinity during flood and ebb slack tides, July 8, 1982 Continued
Sitelocationnumber :Time:Tide:
161135Flood
161735Ebb
171145Flood
171750Ebb
Taxa Standing Percent Standing Percent Standing Percent Standing Percent stock of total stock of total stock of total stock of total
Chrysophyta Chrysophyceae Chromulinales Chrysococcaceae
Chrysococcus Krebs Ochromonadales Dinobryaceae
Dinobryon Ehr.Kephyriopsis (Pseudokephyrion)
Schiller Unknown Flagellated Chrysophyte
Cyanophyta Cyanophyceae Chroococcales Chroococcaceae
Anacystis Heneghini Agmenellum Breb. Gonphosphaeria Kutz.
Euglenophyta Eug1eno phyceae Euglenales Euglenaceae
Euglena Ehr. Trachelottonas Ehr.
Pyrrhophyta Desmokontae Desnomonadales Prorocentraceae
Prorocentrum Ehr. Dinophyceae Dinokontae Ceratiaceae
Ceratium Schrank Gymnod iniaceae
Gymnodinium Stein Peridiniaceae
Peridinium Ehr.
Unknown Zoospores
382
1,240
1,717
2,289
286
3.3
10.7
14.8
836
186
836
19.7
2.5
2,042
279
22
435
872,522
174
4.1
.8 22.7
1.6
127
631,904
254
1.7
1,131 10.2 1,079 14.4
348 3.1 317 4.2
.8 25.4
3.4
Totals, in units per milliliter 11,636 100 9,285 100 11,125 100 7,488 100
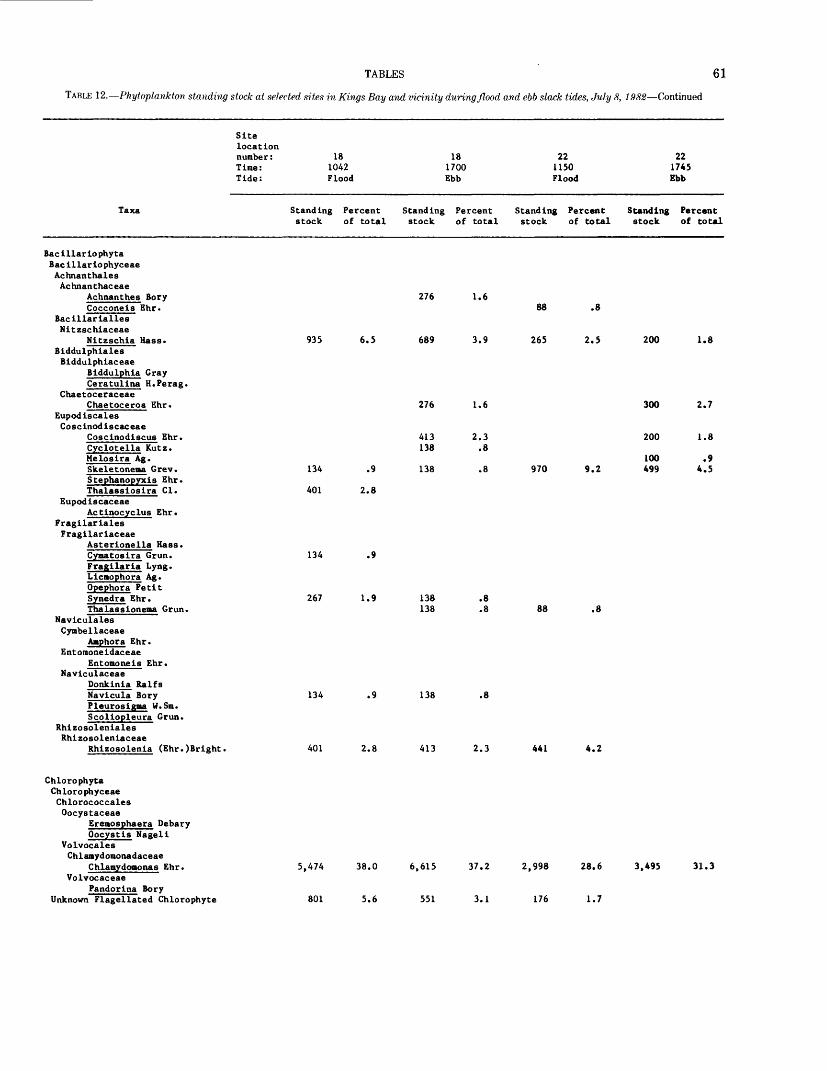
TABLES 61
TABLE 12. Phytoplankton standing stock at selected sites in Kings Bay and vicinity during flood and ebb slack tides, July 8, 1982 Continued
Site location number: 18 18 Time: 1042 1700 Tide: Flood Ebb
Taxa Standing Percent Standing Percent stock of total stock of total
Bacillariophyta Bacillariophyceae Achnanthales Achnanthaceae
Achnanthes Bory 276 1.6Cocconeis Ehr.
Bacillarialles Nitzschiaceae
Nitzschia Hass. 935 6.5 689 3.9Biddulphiales Biddulphiaceae
Biddulphia GrayCeratulina H.Perag.
Chaetoceraceae Chaetoceros Ehr. 276 1.6
Eupodiscales Coscinodiscaceae
Coscinodiscus Ehr. 413 2.3Cyclotella Kutz. 138 .8 Helosira Ag.Skeletonema Grev. 134 .9 138 .8Stephanopyxis Ehr. Thalasslosira Cl. 401 2.8
Eupodiscaceae Actinocyclus Ehr.
Fragilariales Fragilariaceae
Asterionella Hass.Cynatosira Grun. 134 .9 Fragilaria Lyng. Licmophora Ag. Opephora Petit Synedra Ehr. 267 1.9 138 .8 Thalassionema Grun. 138 .8
Naviculales Cymbellaceae
Amphora Ehr. Entomoneidaceae
Entomoneis Ehr.Naviculaceae
Donkinia RalfsNavicula Bory 134 .9 138 .8Pleurosigma W.Sm. Scoliopleura Grun.
Rhizosoleniales Rhizosoleniaceae
Rhizosolenia (Ehr.)Bright. 401 2.8 413 2.3
Chlorophyta Chlorophyceae Chlorococcales Oocystaceae
Eremosphaera Debary Oocystis Nageli
Volvocales Chlamydomonadaceae
Chlamydomonas Ehr. 5,474 38.0 6,615 37.2 Volvocaceae
Pandorina BoryUnknown Flagellated Chlorophyte 801 5.6 551 3.1
22 22 1150 1745 Flood Ebb
Standing Percent Standing Percent stock of total stock of total
88 .8
265 2.5 200 1.8
300 2.7
200 1.8
100 .9 970 9.2 499 4.5
88 .8
441 4.2
2,998 28.6 3,495 31.3
176 1.7
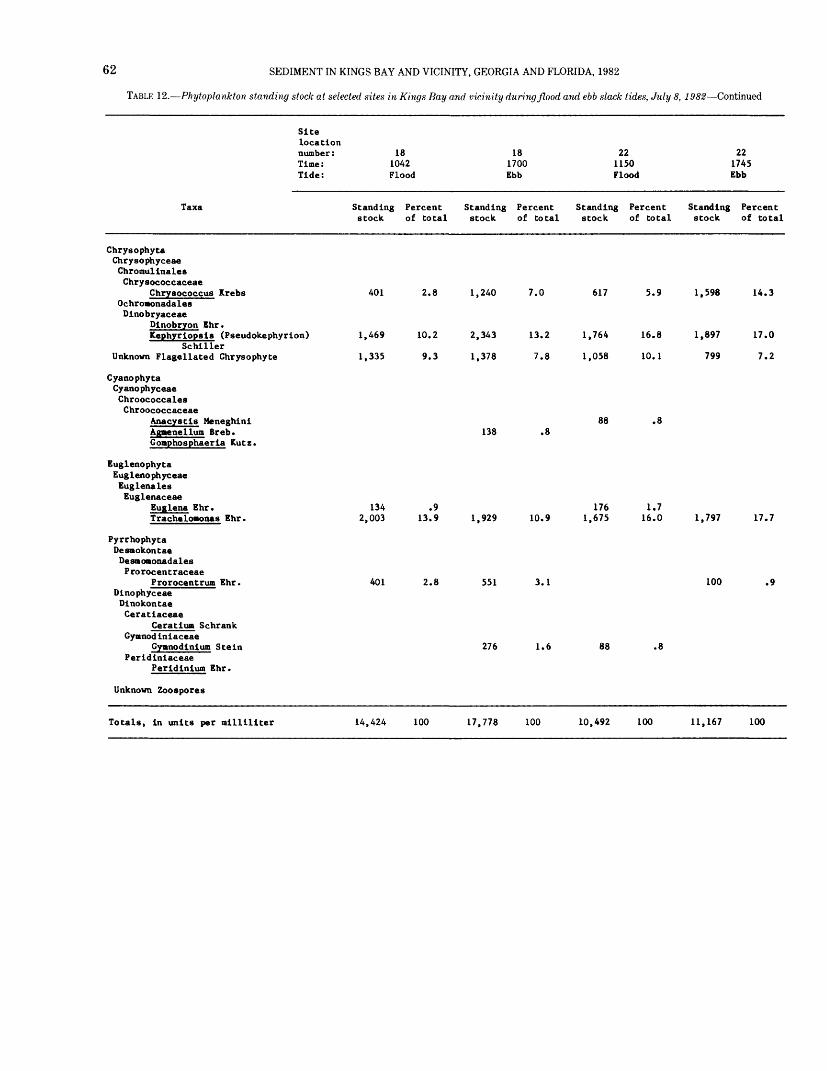
62 SEDIMENT IN KINGS BAY AND VICINITY, GEORGIA AND FLORIDA, 1982
TABLE 12. Phytoplankton standing stock at selected sites in Kings Bay and vicinity during flood and ebb slack tides, July 8, 1982 Continued
Sitelocationnumber: 18Time: 1042Tide: Flood
Taxa Standing Percentstock of total
181700Ebb
Standing Percentstock of total
221150Flood
Standing Percentstock of total
221745Ebb
Standing Percentstock of total
Chrysophyta Chrysophyceae Chromullnales Chrysococcaceae
Chryaococcus Krebs Ochroaonadales Dlnobryaceae
Dlnobryon Ehr.Kephyrtopsls (Pseudokephyrlon)
Schiller Unknown Flagellated Chrysophyte
Cyanophyta Cyanophyceae Chroococcales Chroococcaceae
Anacystls Meneghlnl Agmenellum Breb. Gomphosphaerla Kutz.
Euglenophyta Euglenophyceae Euglenales Euglenaceae
Euglena Ehr. Tracheloaonas Ehr.
Pyrrhophyta Desaokontae Desaomonadales Prorocentraceae
Prorocentrum Ehr. Dlnophyceae Dlnokontae Ceratlaceae
Ceratlun Schrank GymnodInlaceae
Gynnodtntua Stein Perldlnlaceae
Perldlnlum Ehr.
Unknown Zoospores
401
1,469
1,335
1342,003
401
2.8
.9 13.9
2.8
1,240 7.0
1,929
551
617 5.9 1,598 14.3
10.2 2,343 13.2 1,764 16.8 1,897 17.0
9.3 1,378 7.8 1,058 10.1 799 7.2
88 .8138 .8
10.9
3.1
1761,675
1.7 16.0
276 1.6 88 .8
1,797
100
17.7
.9
Totals, In units per mllllllter 14,424 100 17,778 100 10,492 100 11,167 100
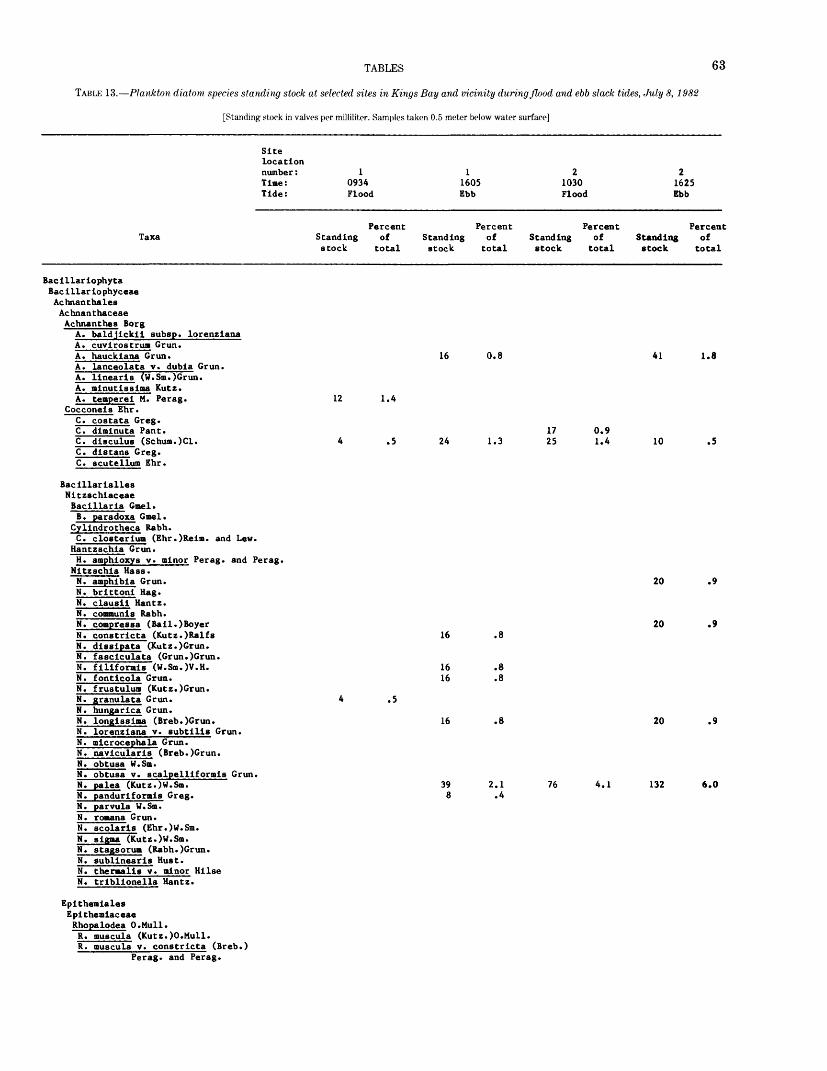
TABLES 63
TABLE 13. Plankton diatom species standing stock at selected sites in Kings Bay and vicinity during flood and ebb slack tides, July 8, 1982
[Standing stock in valves per milliliter. Samples taken 0.5 meter below water surface]
Sitelocation number: Time: Tide:
10934 Flood
11605 Ebb
21030 Flood
21625 Ebb
TaxaPercent
Standing of stock total
PercentStanding of stock total
PercentStanding of stock total
PercentStanding of stock total
Bacillariophyta Bacillarlophyceae Achnanthales Achnanthaceae Achnanthes Borg
A. baldjickii subsp. lorenziana A. cuvirostrua Grun. A. hauckiana Grun. A. lanceolata v. dubia Grun. A", linearis (W.Sm.)Grun. A. minutissima Kutz. A. temperei M. Perag.
Cocconeis Ehr. C. costata Greg. C. diminuta Pant. C. disculus (Schum.)Cl. C. distans Greg. C. scutellum Ehr.
16 0.8 41 1.8
12 1.4
.5 24 1.31725
0.9 1.4 10 .5
BacillariallesNitzschlaceaeBacillaria GB si.B. paradoxa Gmel.
Cylindrotheca Rabh.C. closterium (Ehr.)Reim. and Lew.
Hantzschia Grun.H. amphioxys v» minor Perag. and Perag.Nitzschia Hass.N. amphibia Grun.N. brittoni Hag.N. clausii Uantz.N. coamunis Rabh.N. compressa (Bail.)BoyerN. constricta (Kutz.)RalfsN. dissipata (Kutz.)Grun.N. fasciculata (Grun.)Grun.N. filiformis (W.Sm.)V.H.N. fonticola Grun.N. frustulua (Kutz.)Grun.N. granulata Grun.N. hungarica Grun.N. longissiaa (Breb.)Grun.N. lorenziana v. subtilis Grun.N. microcephala Grun.N. navicularis (Breb.)Grun.N. obtusa W.Sm.N. obtusa v. scalpelliformis Grun.N. palea (Kutz.)W.Sm.N. panduriformis Greg.N. parvula W.Sm.N. romana Grun.N. scolaris (Ehr.)W.Sm.N. sigma (Kutz.)W.Sm.N. stagsorua (Rabh.)Grun.N. sublinearis Hust.N. theraalis v. Minor HilseN. triblionella Hantz.
Epithemiales Epithemiaceae Rhopalodea O.Mull. R. muscula (Kutz.)O.Mull. R. muscula v. constricta (Breb.)
Perag. and Perag.
20
20
.9
.9
.5
16
1616
16
398
.8
.8
.8
.8
2.1.4
76 4.1
20
132
.9
6.0
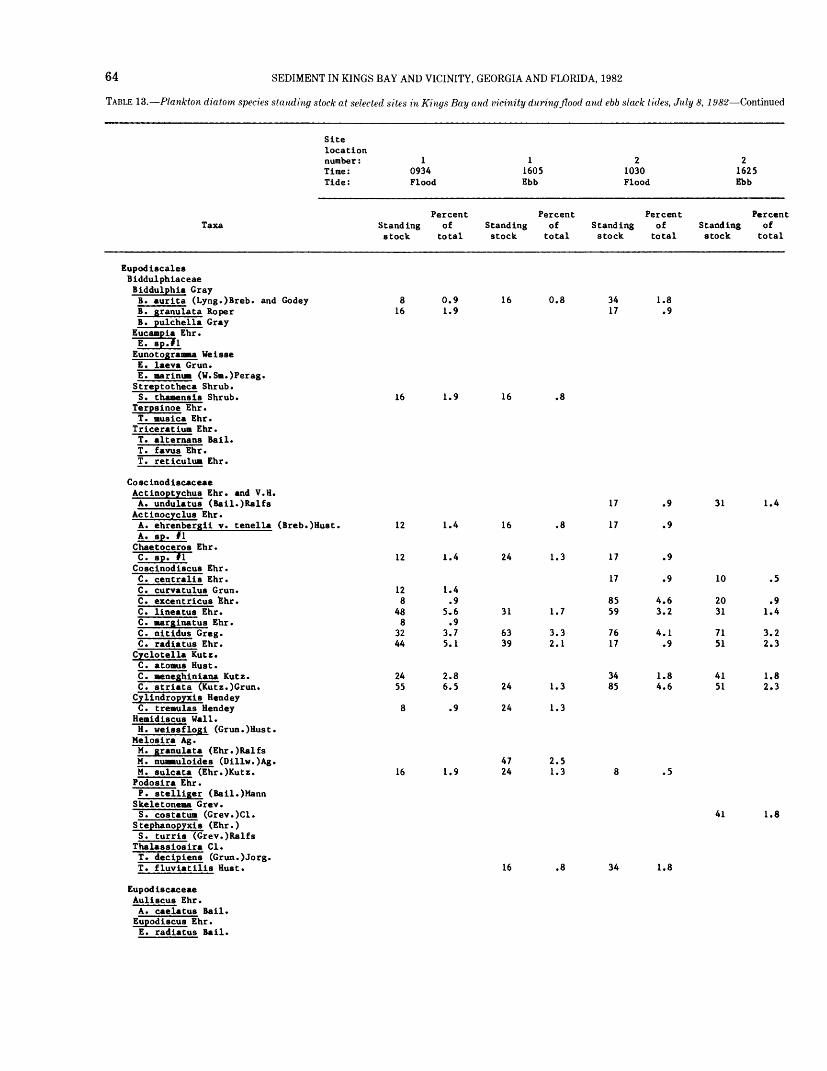
64 SEDIMENT IN KINGS BAY AND VICINITY, GEORGIA AND FLORIDA, 1982
TABLE 13. Plankton diatom species standing stock at selected sites in Kings Bay and vicinity during flood and ebb slack tides, July 8, 1982 Continued
Site location number : 1 Time: 0934 Tide: Flood
Percent Taxa Standing of
stock total
Eupodiscales Biddulphiaceae Biddulphia Gray B. aurita (Lyng.)Breb. and Godey 8 0.9B. granulata Roper 16 1.9B. jmlchella Gray
Eucampia Ehr.
Eunotogjranna WeisseE. laeva Grun.E. marinum (W.Sm.)Perag.Streptotheca Shrub. S. thanensis Shrub. 16 1.9
Terpsinoe Ehr. T. musica Ehr.
Triceratiun Ehr.T. alternans Bail.T. favus Ehr.T. reticulun Ehr.
Coscinodiscaceae Actinoptychus Ehr. and V.H. A. undulatus (Bail.)Ralfs
Actinocyclus Ehr. A. ehrenbergii v. tenella (Breb.)Hust. 12 1.4A. sp. #1Chaetoceros Ehr.C. sp. #1 12 1.4Coscinodiscus Ehr.C. centralis Ehr.C. curvatulus Grun. 12 1.4C. excentricus Ehr. 8 .9C. lineatus Ehr. 48 5.6C. narginatus Ehr. 8 .9C. nitidus Greg. 32 3.7C. radiatus Ehr. 44 5.1
Cyclotella Kutz. C. atomus Hust.C. Beneghiniana Kutz. 24 2.8C. striata (Kutz.)Grun. 55 6.5Cylindropyxis Hendey C. tremulas Hendey 8 .9
Hemidiscus Wall.H. weissflogi (Grun.)Hust.
Melosira Ag.M. granulata (Ehr.)RalfsM. nunmuioides (Dillw.)Ag.M. sulcata (Ehr.)Kutz. 16 1.9Podosira Ehr.P. stelliger (Bail.)Mann
Skeletonema Grev."s". costatum (Grev.)Cl.Stephanopyxis (Ehr.) S. turris (Grev.)Ralfs
Thalassiosira Cl.T. decipiens (Grun.)Jorg.T. fluviatilis Hust.
1 2 2 1605 1030 1625 Ebb Flood Ebb
Percent Percent Percent Standing of Standing of Standing of stock total stock total stock total
16 0.8 34 1.8 17 .9
16 .8
17 .9 31 1.4
16 .8 17 .9
24 1.3 17 .9
17 .9 10 .5
85 4.6 20 .9 31 1.7 59 3.2 31 1.4
63 3.3 76 4.1 71 3.2 39 2.1 17 .9 51 2.3
34 1.8 41 1.8 24 1.3 85 4.6 51 2.3
24 1.3
47 2.5 24 1.3 8 .5
41 1.8
16 .8 34 1.8
Eupodiscaceae Auliscus Ehr.
A. caelatus Bail. Eupodiscus Ehr.
E. radiatus Bail.
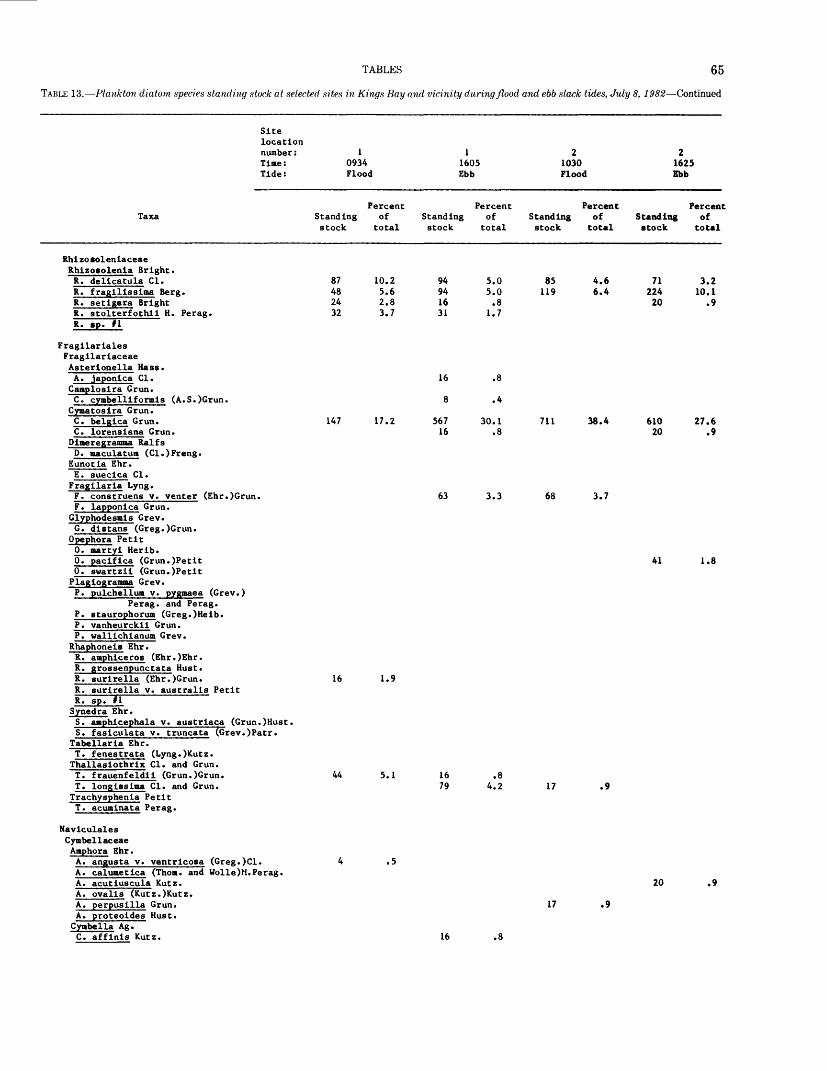
TABLES 65
TABLE 13. Plankton diatom species standing stock at selected sites in Kings Bay and vicinity during flood and ebb slack tides, July 8, 1982 Continued
Site location number : 1 Time : 0934 Tide : Flood
Percent Taxa Standing of
stock total
Rhizosoleniaceae Rhizosolenia Bright.R. delicatula Cl. 87 10.2R. fragilissima Berg. 48 5.6R. setigera Bright 24 2.8R. stolterfothii H. Perag. 32 3.7R. sp. fl
Fragilariales Fragilariaceae Asterionella Hass.A. japonica Cl.Camplosira Grun. C. cynbelliformis (A.S.)Grun. Cyaatosira Grun. C. belgica Grun. 147 17.2C. lorensiana Grun.Dimeregramma RalfsD. maculatum (Cl.)Freng.
Eunotia Ehr.E. suecica Cl.Fragilaria Lyng. F. construens v. venter (Ehr.)Grun.F. lapponica Grun.
Glyphodesmis Grev. G. distans (Greg.)Grun.
Opephora Petit 0. martyi Herib.0. pacifica (Grun.)Petit0. swartzii (Grun.)PetitPlagtogramma Grev. P. jpulchellum v. pjrgjaaea (Grev.)
Perag. and Perag. P. staurophorum (Greg.)Heib.P. vanheurckii Grun.P. wallichianum Grev.
R ha phone is Ehr. R. amphiceros (Ehr.)Ehr.R. grossenpunctata Bust. R. surirella (Ehr.)Grun. 16 1.9R. surirella v. australis PetitR. sp. tlSynedra Ehr. S. anphicephala v. austriaca (Grun.)Hust.S. fasiculata v. truncata (Grev.)Patr.
Tabellaria Ehr.T. fenestrata (Lyng.)Kutz.Thallasiothrix Cl. and Grun.T. frauenfeldii (Grun.)Grun. 44 5.1T. longissima Cl. and Grun.Trachysphenia Petit T. acuminata Perag.
1 2 2 1605 1030 1625 Ebb Flood Ebb
Percent Percent Percent Standing of Standing of Standing of stock total stock total stock total
94 5.0 85 4.6 71 3.2 94 5.0 119 6.4 224 10.1 16 .8 20 .9 31 1.7
16 .8
8 .4
567 30.1 711 38.4 610 27.6 16 .8 20 .9
63 3.3 68 3.7
41 1.8
16 .8 79 4.2 17 .9
Naviculales Cymbellaceae
Amphora Ehr.A. angusta v. ventricosa (Greg.)Cl.A. calumetica (Thorn, and Wolle)H.Perag.A. acutiuscula Kutz.A. ovalis (Kutz.)Kutz.A. perpus11la Grun.A. proteoides Bust. Cymbella Ag.C. affinis Kutz.
.5
20 .9
17 .9
16 .8
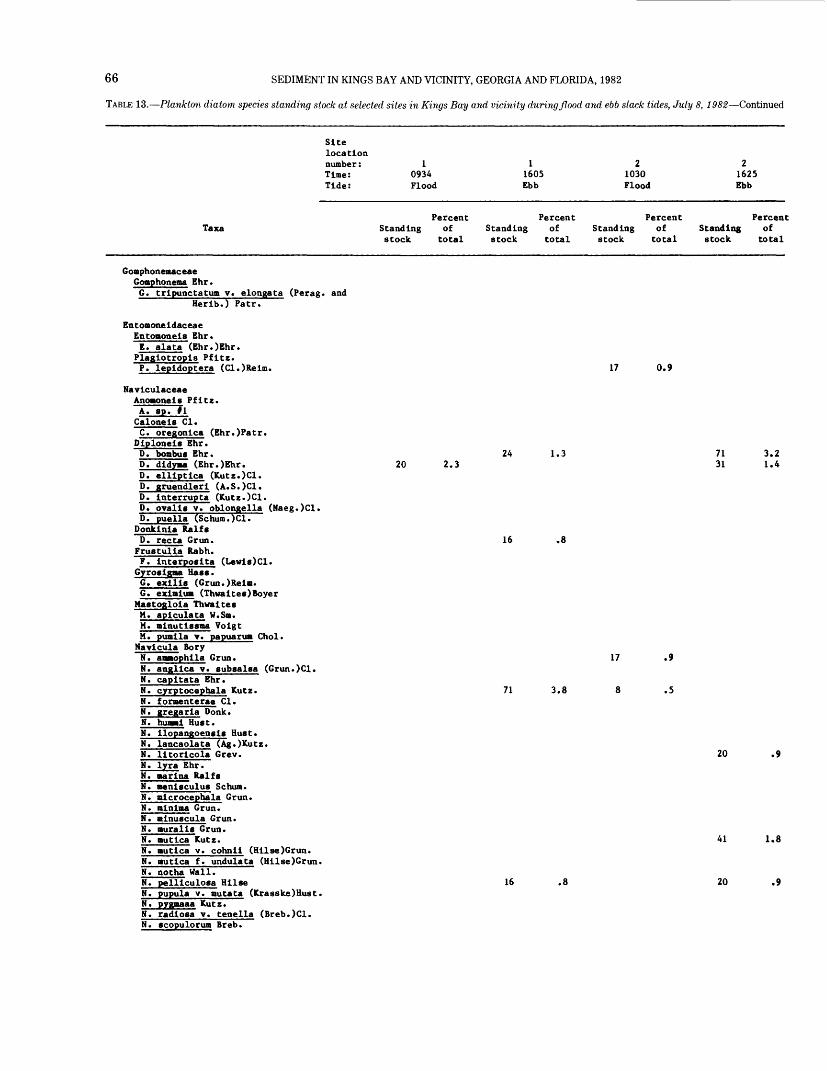
66 SEDIMENT IN KINGS BAY AND VICINITY, GEORGIA AND FLORIDA, 1982
TABLE 13. Plankton diatom species standing stock at selected sites in Kings Bay and vicinity during flood and ebb slack tides, July 8, 1982 Continued
Sitelocation number: Time: Tide:
10934 Flood
11605 Ebb
21030 Flood
21625 Ebb
TaxaPercent
Standing of stock total
PercentStanding of stock total
PercentStanding of stock total
PercentStanding of stock total
Gonphonemaceae Gomphoneaa Ehr. G. tripunctatum v. elongata (Perag. and
Herlb.) Patr,
Entononeidaceae Entomonels Ehr.E. alata (Ehr.)Ehr.
Plaglotropis Pfltz.P. lepidoptera (Cl.)Relm.
NavlculaceaeAnomonels Pfitz.A. gp77l Caloneis Cl.C. oregonlca (Ehr.)Patr.
Diploneis Ehr.D. boabus Ehr.D. dldyma (Ehr.)Ehr.D. elliptica (Kutz.)Cl.D. gruendleri (A.S.)Cl.D. interrupta (Kutz.)Cl.D. ovalis v. oblongella (Naeg.)Cl.D. puella (Schum.)Cl.
Donkinia RalfsD. recta Grun. Frustulia Rabh.F. interposita (Lewis)Cl.
Gyrosigma Uass.G. exilis (Grun.)Rela.G. exiaiua (Thwaltes)Boyer
Mastogloia ThwaltesM. apiculata W.Sa.M. ainutlssma VoigtM. pumila v. papuarua Chol. Navicula BoryN. anaophlla Grun.N. anglica v. subsalsa (Grun.)Cl.N. capitata Ehr.N. cyrptocephala Kutz.N. formenterae Cl.N. gregaria Donk.N. huaai Bust.N. ilopangoengjg Bust.N. lancaolata (Ag.)Kutz.N. litoricola Grev.N. lyra Ehr.N. marina RalfsN. aenlsculus Schum.N. aicrocephala Grun.N. minima Grun.N. alnuscula Grun.N. muralis Grun.
17 0.9
24 1.320 2.3
7131
3.2 1.4
16 .8
17
71 3.8
.9
.5
20 .9
N. nutlea Kutz.N. autlca v. cohnll (Hilse)Grun.N. autica f. undulata (Hilse)Grun.N. notha Wall.N. pelliculosa HilseN. pupula v. autata (Krasske)Hust.N. pygaaaa Kutz.N. radiosa v. tenella (Breb.)Cl.N. scopulorum Breb.
41 1.8
16 .8 20 .9
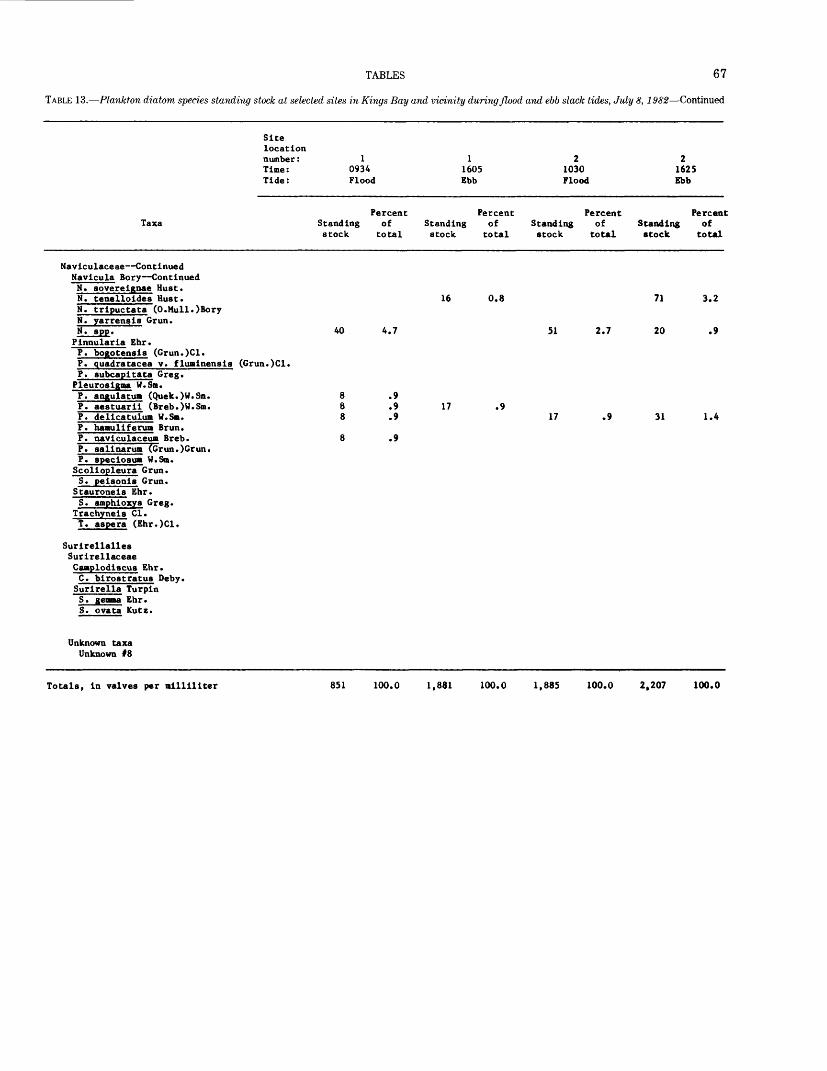
TABLES 67
TABLE 13. Plankton diatom species standing stock at selected sites in Kings Bay and vicinity during flood and ebb slack tides, July 8, 1982 Continued
Sitelocationnumber: 1122Time: 0934 1605 1030 1625Tide: Flood Ebb Flood Ebb
Percent Percent Percent PercentTaxa Standing of Standing of Standing of Standing of
stock total stock total stock total stock total
Naviculaceae Continued Navicula Bory Continued
N. severeignae Bust.N. tenelloides Bust. 16 0.8 71 3.2N. tripuctata (O.Mull.)BoryN. yarrensis Grun.N. spp. 40 4.7 51 2.7 20 .9
Pinnularia Ehr.P. bogotensis (Grun.)Cl.P. quadratacea v. fluminensis (Grun.)Cl.P. subcapitata Greg.
Pleurosigma W.Sm.P. angulatua (Quek.)U.Sm. 8 .9P. aestuarii (Breb.)W.Sm. 8 .9 17 .9P. delicatulum W.Sm. 8 .9 17 .9 31 1.4P. haauliferum Brun.P. naviculaceum Breb. 8 .9P. salinarum TGrun.)Grun.P. speciosua W.Sn. Scoliopleura Grun.S. peisonis Grun.
Stauroneis Ehr.S. amphioxys Greg.
Trachyneis Cl.T. aspera (Ehr.)Cl.
Surirellalles Surirellaceae Caaplodiscus Ehr.C. birostratus Deby. Surirella Turpin S. gemaa Ehr. S. ovata Kutz.
Unknown taxa Unknown 18
Totals, in valves per milliliter 851 100.0 1,881 100.0 1,885 100.0 2,207 100.0

68 SEDIMENT IN KINGS BAY AND VICINITY, GEORGIA AND FLORIDA, 1982
TABLE 13. Plankton diatom species standing stock at selected sites in Kings Bay and vicinity during flood and ebb slack tides, July 8, 1982 Continued
Sitelocation number: Time: Tide:
71120 Flood
71720 Ebb
81000 Flood
81610 Ebb
TaxaPercent
Standing of stock total
PercentStanding of stock total
Percent Standing of stock total
Percent Standing of stock total
Bacillariophyta Bacillariophyceae Achnanthales Achnanthaceae Achnanthes Borg
A. baldjickii subsp. lorenzlana A. cuvirostrum Grun. A. hauckiana Grun. A. lanceolata v. dubia Grun. A. linearis (W.Sm.)Grun. A. minutissima Kutz. A. temperei H. Perag.
Cocconeis Ehr. C. costata Greg. C. diminuta Pant. C. disculus (Schum.)Cl. C. distans Greg. C. scutelluB Ehr.
65 2.2 47
31
31
1.4
.9
.9
113 2.6
47 1.3
7538
1.8 .9
Baclllarialles Mitzschiaceae Baclllarla Gmel.B. paradoxa Gael.
Cylindrotheca Rabh.C. closCerium (Ehr.)Reim. and Lew.
Hantzschia Grun.H. amphioxys v. minor Perag. and Perag. Hitzschia Hass.H. amphibia Grun.H. brtttoni Hag.N. clausii Hantz.H. communis Rabh.N. compressa (Bail.)BoyerH. constricts (Kutz.)RalfsN. disstpata (Kutz.)Grun.H. fasctculata (Grun.)Grun.N. filiformis (W.Sm.)V.H.N. fonticola Grun.N. frustulum (Kutz.)Grun.H. granulata Grun.N. hungarica Grun.H. longissima (Breb.)Grun.H. lorenziana v. subtilts Grun.H. microcephala Grun.N. navicularis (Breb.)Grun.N. obtusa W.Sm.N. obtusa v. scalpelliformis Grun.H. palea (Kutz.)W.Sm.N. pandurifonais Greg.N. parvula W.Sm.H. romana Grun.N. scolaris (Ehr.)W.Sm.N. sigma (Kutz.)W.Sm.N. stagaorum (Rabh.)Grun.N. sublinearis Bust.H. thermalis v. minor HilseN. triblionella Hantz.
52
26
5213
13
79
209
1.7
.9
1.7.4
.4
2.6
6.9
16
93
3131
31
31
202
31
.5
2.838 .9
323232
.9
.9
.9
6.1
.9
38
207
.9
4.8 25232
7.0 .9
31 .9
Epithemiales Epithemiaceae Rhopalodea O.Hull. R. muscula (Kutz.)0.Mull. R. muscula v. constricts (Breb.)
Perag. and Perag.
16 .4
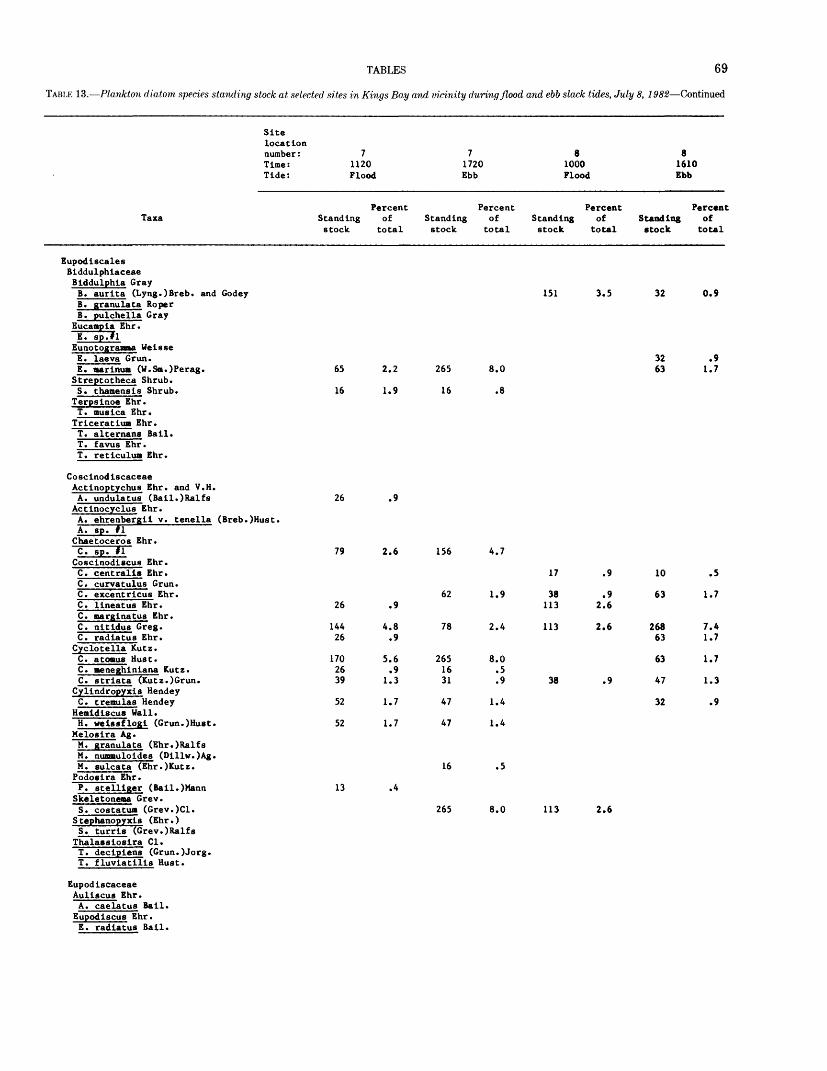
TABLES 69
TABLE 13. Plankton diatom species standing stock at selected sites in Kings Bay and vicinity during flood and ebb slack tides, July 8, 1982 Continued
Site location number : 7 Time: 1120 Tide: Flood
Percent Taxa Standing of
stock total
Eupod iscales Biddulphiaceae Biddulphia Gray B. aurita (Lyng.)Breb. and GodeyB. granulata RoperB. pulchella Gray
Eucampia Ehr.
Eunotogramma WeisseE. laeva Grun.E. aarinua (W.Sa.)Perag. 65 2.2Streptotheca Shrub. S. thamensis Shrub. 16 1.9
Terpsinoe Ehr. T. ausica Ehr.Triceratiua Ehr.T. alternans Bail.T. favus Ehr.T. reticulua Ehr.
Coscinodiscaceae Actinoptychus Ehr. and V.H. A. undulatus (Bail.)Ralfs 26 .9Actinocyclus Ehr. A. ehrenbergii v. tenella (Breb.)Hust.A. sp. #1Chaetoceros Ehr.C. sp. ll 79 2.6Coscinodiscus Ehr.C. centralis Ehr.C. curvatulus Grun.C. excentricus Ehr.C. lineatus Ehr. 26 .9C. aarg^inatus Ehr.C. nitidus Greg. 144 4.8C. radiatus Ehr. 26 .9Cyclotella Kutz. C. atoaus Bust. 170 5.6C. aeneghiniana Kutz. 26 .9C. striata (Kutz.) Grun. 39 1.3
Cylindropyxis Hendey C. tr emu las Hendey 52 1.7
HeaidlscuB Wall.H. velssflogi (Grun.)Hust. 52 1.7
Melosira Ag.M. granulata (Ehr.)RalfsM. nummuloides (Dillw.)Ag.M. sulcata (Ehr.)Kutz.Podosira Ehr.P. stelllger (Bail.)Mann 13 .4
Skeletoneaa Grev.S. costatua (Grev.)Cl.
S tephanopyxis (Ehr.) S. turrls (Grev.)Ralfs
Thalasslosira Cl.T. deciplens (Grun.)Jorg.T. fluviatilis Hust.
Eupod iscaceae Auliscus Ehr.A. caelatus Bail.Eupodiscus Ehr.
788 1720 1000 1610 Ebb Flood Ebb
Percent Percent Percent Standing of Standing of Standing of stock total stock total stock total
151 3.5 32 0.9
32 .9265 8.0 63 1.7
16 .8
156 4.7
17 .9 10 .5
62 1.9 38 .9 63 1.7 113 2.6
78 2.4 113 2.6 268 7.4 63 1.7
265 8.0 63 1.7 16 .5 31 .9 38 .9 47 1.3
47 1.4 32 .9
47 1.4
16 .5
265 8.0 113 2.6

70 SEDIMENT IN KINGS BAY AND VICINITY, GEORGIA AND FLORIDA, 1982
TABLE 13. Plankton diatom species standing stock at selected sites in Kings Bay and vicinity during flood and ebb slack tides, July 8, 1982 Continued
Sitelocation number: Time: Tide:
71120 Flood
71720 Ebb
81000 Flood
81610 Ebb
TaxaPercent Percent Percent Percent
Standing of Standing of Standing of Standing ofstock total stock total stock total stock total
Rhlzo soleniaceae Rhizosolenia Bright. R. delicatula Cl. R. fragilisaima Berg. R. setigera Bright R. tolterfothii H. Perag. R. »p. fl'
Fragilariales Fragilariaceae Asterionella Haas.
265226
0.91.7.9
3131
31
0.9 .9
.9
75113
1.8 2.6
12634732
3.59.6.9
A. japonica Cl. Caaploaira Grun. C. cy»belliforals (A.S.)Grun.CyaatOBira Grun. C. belglca Grun. C. lorensiana Grun.Diaeregr RalfsD. maculatun (Cl.)Freng.
Eunotia Ehr.E. suecica Cl. Fragilaria Lyng.F. construens v. venter (Ehr.)Grun.
62826
144
20.8 .9
4.8
685 20.8
31 .9
38
1,750
301
.9
40.8
7.0
71016
126
19.7 .4
3.5F. lapponica Grun.
Glyphodesais Grev.G. distans (Greg.)Grun. Opephora Petit0. martyi Herib.0. pacifica (Grun.)Petit0. swarttil (Grun.)Petit Plagiograaaa Grev.P. pulchellua v. pygmaea (Grev.)
Perag. and Perag.P. staurophorua (Greg.)Heib.P. vanheurckii Grun.P. wallichianmi Grev.
Rhaphoneia Ehr.R. aaphlceroa (Ehr.)Ehr.R. grossenpunctata Hust.R. surlrella (Ehr.)Grun.R. surirella v. auatralis PetitR. «p. II Synedra Ehr.S. amphicephala v.
52 1.7 47 1.4 38 .9 16 .4
austriaca (Grun.)Hust.S. fasiculata v. truncata (Grev.)Patr. Tabellaria Ehr.T. fenestrata (Lyng.)Kutz.
Thallaaiothrix Cl. and Grun.T. frauenfeldii (Grun.)Grun.T. longissima Cl. and Grun. Trachyaphenia PetitT. actminata Perag.
Naviculales Cymbellaceae Aaphora Ehr.A. angusta v. ventricosa (Greg.)Cl.A. caluaetica (Thorn, and Wolle)M.Perag.A. acutiuscula Kutz.A. ovalis (KuFz.)Kutz.A. perpusilla Grun.A. proteoides Hust. Cyabella Ag.C. affinis Kutz.
26 .9 38
19
.9
.4
32 .9
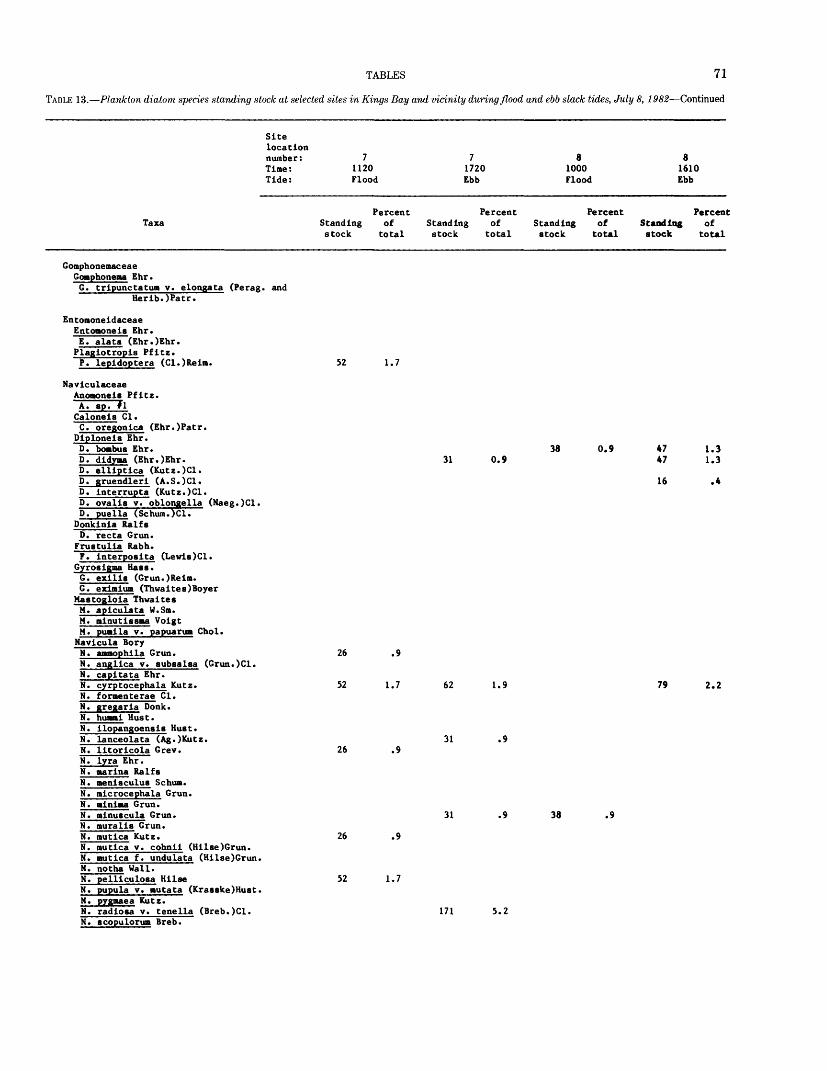
TABLES 71
TABLE 13. Plankton diatom species standing stock at selected sites in Kings Bay and vicinity during flood and ebb slack tides, July 8, 1982 Continued
Sitelocation number: Time: Tide:
71120 Flood
71720 Ebb
81000 Flood
81610 Ebb
TaxaPercent
Standing of stock total
PercentStanding of stock total
PercentStanding of stock total
PercentStanding of stock total
Gomphonemaceae Gomphonema Ehr. G. tripunctatum v. elongata (Perag. and
Herib.)Patr,
Entomoneidaceae Entomoneis Ehr.E. alata (Ehr.)Ehr. Plagiotropis Pfitz.P. lepidoptera (Cl.)Reim.
NaviculaceaeAnomoneis Pfitz.A. sp.Tl Caloneis Cl.C. oregonica (Ehr.)Patr.
Diploneis Ehr.D. boabus Ehr.D. didyaa (Ehr.)Ehr.D. elliptica (Kutz.)Cl.D. gruendleri (A.S.)Cl.D. interrupta (Kutz.)Cl.D. ovalis v. oblongella (Maeg.)Cl.D. puella (Schum.)Cl.
Donkinia RalfsD. recta Grun.
Frustulia Rabh.P. interposita (Lewis)C1. Gyrosigma Hass.G. exilis (Grun.)Reim.G. eximium (Thwaites)Boyer
Mastogloia ThwaitesM. apiculata W.Sm.M. minutissaa VoigtM. pumila v. papuarum Chol. Navicula BoryN. ammophila Grun.N. anglica v. subsalsa (Grun.)Cl.N. capitata Ehr.N. cyrptocephala Kutz.N. formenterae Cl.N. gregaria Donk.N. humai Hust.N. ilopangoensis Hust.N. lanceolata (Ag.)Kutz.N. litoricola Grev.N. lyra Ehr.N. narioa RalfsN. menisculus Schun.N. microcephala Grun.N. minima Grun.N. minuscula Grun.N. muralis Grun.N. mutica Kutz.N. mutica v. cohnii (Hilse)Grun.N. mutica f. undulata (Hilse)Grun.N. notha Wall.N. pelliculosa HilseN. pupula v. mutata (Krasske)Hust.N. pygaaea Kutz.N. radiosa v. tenella (Breb.)Cl.N. scopulorua Breb.
52 1.7
31 0.938 0.9 47 1.3
47 1.3
16 .4
26 .9
52 1.7 62 1.9 79 2.2
31 .926 .9
31 .9 38 .9
26 .9
52 1.7
171 5.2
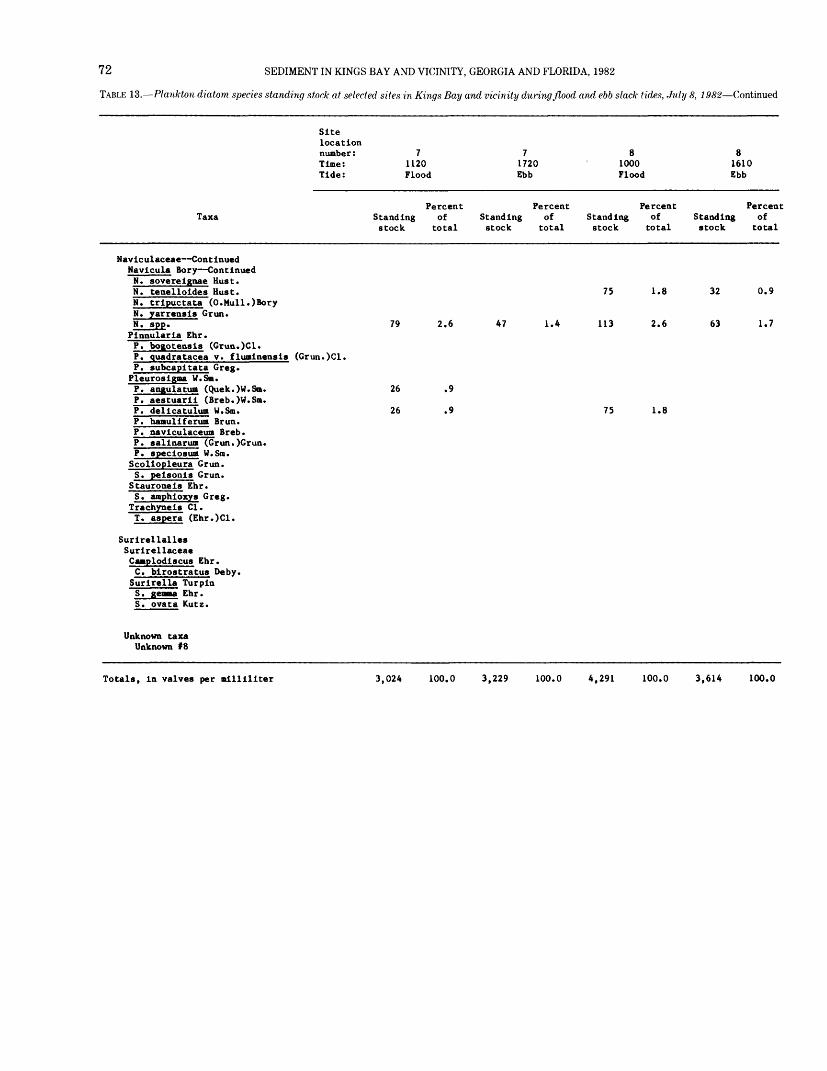
72 SEDIMENT IN KINGS BAY AND VICINITY, GEORGIA AND FLORIDA, 1982
TABLE 13. Plankton diatom species standing stock at selected sites in Kings Bay and vicinity during flood and ebb slack tides, July 8, 1982 Continued
Sitelocationnumber: 7788Time: 1120 1720 1000 1610Tide: Flood Ebb Flood Ebb
Percent Percent Percent PercentTaxa Standing of Standing of Standing of Standing of
stock total stock total stock total stock total
Naviculaceae Continued Navicula Bory Continued
N. sovereignae Bust.N. tenelloides Bust. 75 1.8 32 0.9N. tripuctata (O.Mull.)BoryN. yarrensis Grun.N. spp. 79 2.6 47 1.4 113 2.6 63 1.7
Pinnularia Ehr.P. bogotensis (Grun.)Cl.P. quadratacea v. fluminensis (Grun.)Cl.P. subcapitata Greg.
Pleurosigma W.Sm.P. angulatun (Quek.)W.Sm. 26 .9P. aestuarii (Breb.)W.Sm.P. delicatulun W.Sm. 26 .9 75 1.8P. hamuliferum Brun.P. naviculaceum Breb.P. salinarum (Grun.)Grun.P. speciosum W.Sm. Scoliopleura Grun.S. peisonis Grun.
Stauroneis Ehr.S. amphioxys Greg.
Trachyneis Cl.T. aspera (Ehr.)Cl.
Surirellalles Surirellaceae Camplodiscus Ehr.C. birostratus Deby. Surirella Turpin S. gemma Ehr. S. ovata Kutz.
Unknown taxa Unknown 18
Totals, in valves per milliliter 3,024 100.0 3,229 100.0 4,291 100.0 3,614 100.0
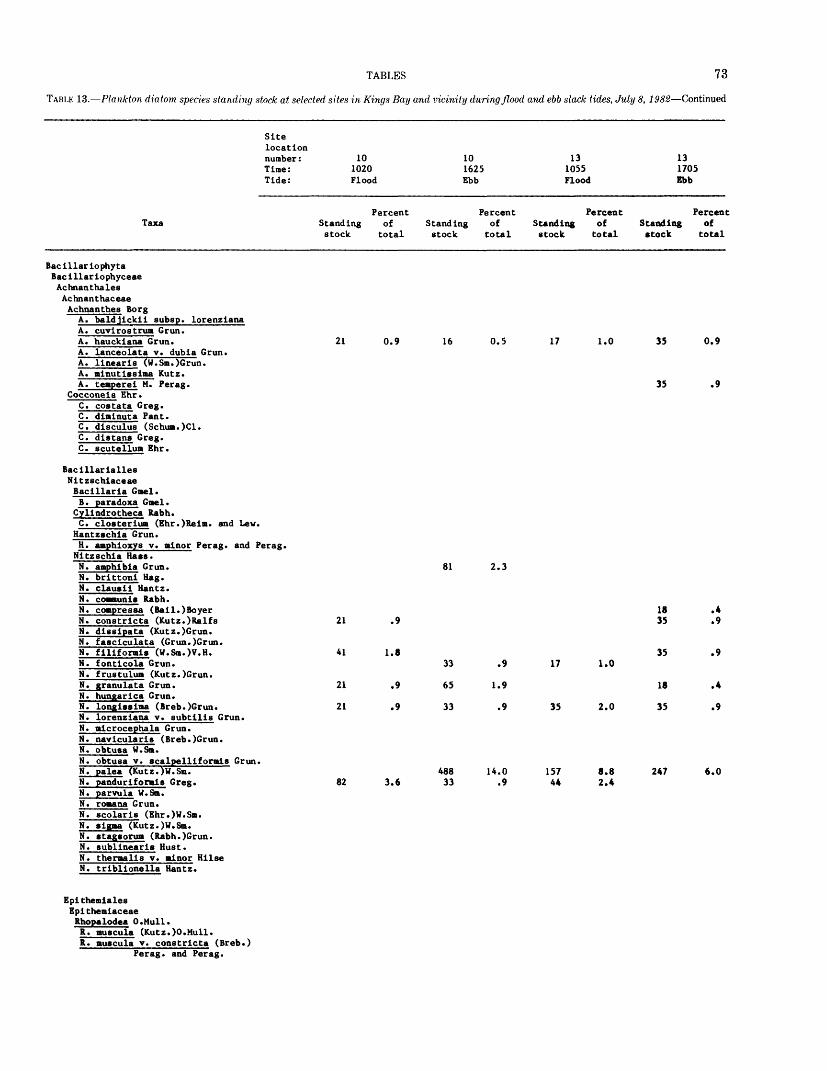
TABLES 73
TABLE 13. Plankton diatom species standing stock at selected sites in Kings Bay and vicinity during flood and ebb slack tides, July 8, 1982 Continued
Sitelocation number: Time: Tide:
101020 Flood
101625Ebb
131055 Flood
131705Ebb
TaxaPercent
Standing of stock total
PercentStanding of stock total
Percent Standing of stock total
PercentStanding of stock total
Bacillariophyta Bacillariophyceae Achnanthales Ac hnan t hac eae Achnanthes Borg
A. baldjlckll subsp. lorenziana A. cuvirostrum Grun. A. hauckiana Grun. A. lanceolata v. dubla Grun. A. linearls (W.Sm.)Grun. A. minutissima Kutz. A. temperei M. Perag.
Cocconeis Ehr. C. costata Greg. C. diminuta Pant. C. disculus (Schua.)Cl. C. dietana Greg. C. scutellum Ehr.
Baclllarialles Nitzschiaceae Bacillaria Gael.B. paradoxa Gael.
Cylindrotheca Rabh.C. closteriua (Ehr.)Reim. and Lew.
Hantsschia Grun.H. aaphioxys v. ainor Perag. and Perag. Nitzschia HasB.N. amphibia Grun.N. brittoni Hag.N. clausii Hantz.N. coaaunis Rabh.N. coapressa (Bail.)BoyerN. constricta (Kutz.)RalfsN. dissipata (Kutz.)Grun.N. fasciculata (Grun.)Grun.N. filiforais (W.Sm.)V.H.N. fonticola Grun.N. frustulua (Kutz.)Grun.N. granulata Grun.N. hungarica Grun.N. longisslaa (Breb.)Grun.N. lorenziana v. subtilis Grun.N. aicrocephala Grun.N. naviculariB (Breb.)Grun.M. obtuea W.Sa.N. obtusa v. scalpelliforaiB Grun.N. palea (Kutz.)W.Sa.N. panduriforaiB Greg.N. parvula W.Sa.N. roaana Grun.N. scolaris (Ehr.)W.Sa.N. sigaa (Kutz.)W.Sa.N. stagsorua (Rabh.)Grun.N. Bublinearis Bust.N. theraalis v. ainor HilseN. triblionella Hantz.
21 0.9 16 0.5 17 1.0 35
35
0.9
.9
81 2.3
21
41
21
21
.9
1.8
.9
.9
82 3.6
33
65
33
48833
.9
1.9
.9
14.0 .9
17
35
15744
1.0
2.0
8.8 2.4
1835
35
18
35
247
.4
.9
.9
.4
.9
6.0
Epithemiales Epitheaiaceae Rhopalodea O.Mull. R. auscula (Kutz.)O.Mull. R. auscula v. constricta (Breb.)
Perag. and Perag.
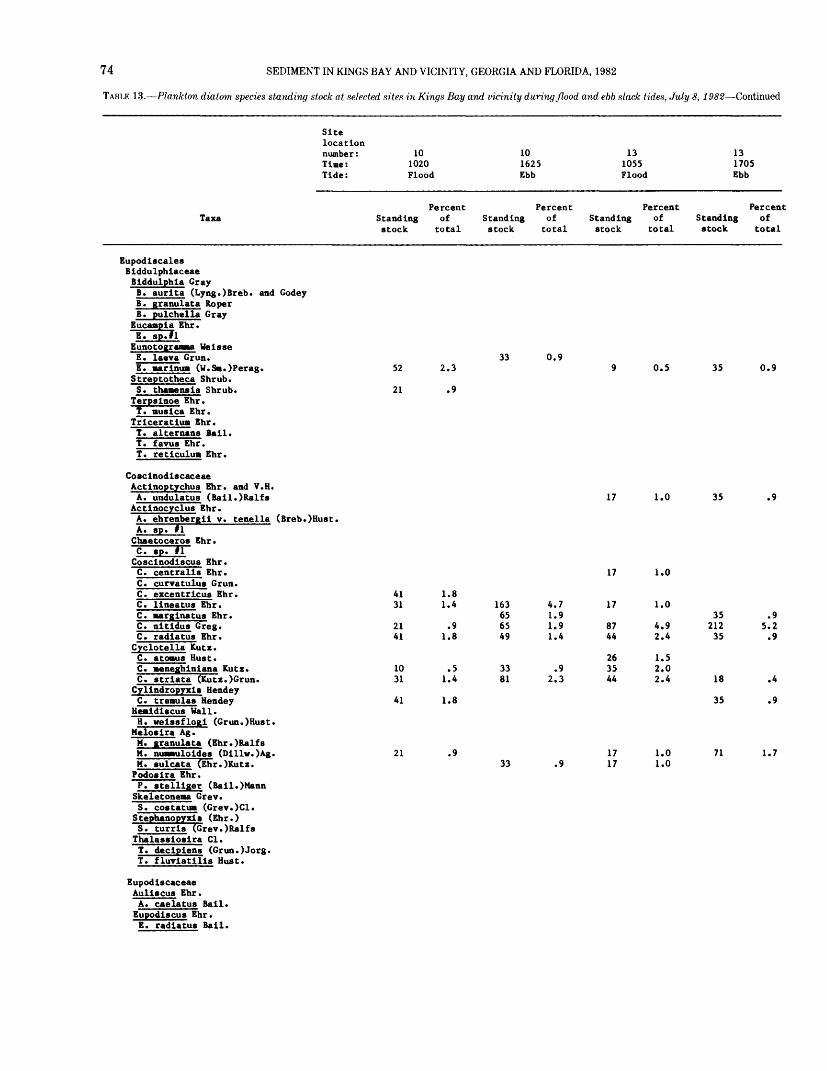
74 SEDIMENT IN KINGS BAY AND VICINITY, GEORGIA AND FLORIDA, 1982
TABLE 13. Plankton diatom species standing stock at selected sites in Kings Bay and vicinity during flood and ebb slack tides, July 8, 1982 Continued
Site location number: 10 Time: 1020 Tide: Flood
Percent Taxa Standing of
stock total
Eupodiscales Biddulphiaceae Biddulphia Gray B. aurita (Lyng.)Breb. and GodeyB. granulata RoperB. pulchella Gray
Eucaapia Ehr.
Eunotograaaa WeisseE. laeva Grun.E. aarinua (W.Sm.)Perag. 52 2.3Streptotheca Shrub. S. thamensis Shrub. 21 .9
Terpslnoe Ehr. T. musica Ehr.
Triceratiua Ehr.T. alternans Bail.T. favus Ehr.T. reticulua Ehr.
Co sc inod is caceae Actlnoptychus Ehr. and V.H. A. undulatus (Bail.)Ralfs
Actinocyclus Ehr. A. ehrenbergii v. tenella (Breb.)Hust.A. sp. tlChaetoceros Ehr.C. sp. flCoscinodiscus Ehr.C. centralis Ehr.C. curvatulus Grun.C. excentricus Ehr. 41 1.8C. lineatus Ehr. 31 1.4C. aarginatus Ehr.C. nitidus Greg. 21 .9C. radiatus Ehr. 41 1.8Cyclotella Kutz. C. atoaus Bust.C. aeneghiniana Kutz. 10 .5C. striata (Kutz.)Grun. 31 1.4
Cylindropyxls Hendey C. treaulas Hendey 41 1.8Hemidiscus Wall.H. weissflogi (Grun.)Hust.
Melosira Ag. M. granulata (Ehr.)RalfsM. nuaauloides (Dillw.)Ag. 21 .9M. sulcata (Ehr.)Kutz.Podosira Ehr.P. stelliger (Bail.)MannSkeletoneaa Grev.S. cos tat ua (Grev.)Cl.Stephanopyxts (Ehr.) S. turris (Grev . )Ralf s
Thalassiosira Cl.T. decipiens (Grun.)Jorg.T. fluviatilis Bust.
10 13 13 1625 1055 1705 Ebb Flood Ebb
Percent Percent Percent Standing of Standing of Standing of stock total stock total stock total
33 0.9 9 0.5 35 0.9
17 1.0 35 .9
17 1.0
163 4.7 17 1.0 65 1.9 35 .9 65 1.9 87 4.9 212 5.2 49 1.4 44 2.4 35 .9
26 1.5 33 .9 35 2.0 81 2.3 44 2.4 18 .4
35 .9
17 1.0 71 1.7 33 .9 17 1.0
Eupodiscaceae Aullscus Ehr.
A. caelatus Bail. Eupodiscus Ehr.
E. radiatus Bail.

TABLES 75
TABLE 13. Plankton diatom species standing stock at selected sites in Kings Bay and vicinity during flood and ebb slack tides, July 8, 1982 Continued
Site location number: Time: Tide:
101020 Flood
101625Ebb
131055 Flood
131705Ebb
TaxaPercent
StandIng of stock total
Percent StandIng of stock total
Percent Standing of stock total
PercentStanding of stock total
Rhlzosolenlaceae Rhlzosolenla Bright. R. dellcatula Cl. R. fraglllsslma Berg. R. setlgera Bright R. stolterfothll B. Perag. R. sp. II
Fragllarlales Fragllarlaceae Astertone1la Mass.A. japonlca Cl. CamplesIra Grun.C. cyabelllforals (A.S.)Grun.
Cyaatoslra Grun.C. belglca Grun.C. lorenslana Grun.
Dlaeregraama RalfsD. maculatun (Cl.)Freng.
Eunotla Ehr.
113144
5.0 6.3
33374
33
0.9 10.7
.9
5215717
2.9 8.8 1.0
67135
16.3 .9
E. suecica Cl. Fragllarla Lyng. F. construens v. venter (Ehr.)Grun.
52521
21
23.1 .9
.9F. lapponlca Grun.
Glyphodesmls Grev.G. dlstans (Greg.)Grun.
Opephora Petit0. nartyl Herlb.0. paclflca (Grun.)Petlt0. swartzll (Grun.)Petit Plaglogranna Grev.P. pulchellun v. pygnaea (Grev.)
Perag. and Perag.P. staurophorun (Greg.)Helb.P. vanheurckll Grun.P. walllchlanun Grev. Rhaphonels Ehr.R. amphlceros (Ehr.)Ehr.R. grossenpunctata Bust.R. surlrella (Ehr.)Grun.R. surlrella v. australls PetitR. sp. If
Synedra Ehr.S. anphlcephala
79716
130
33
22.9 .5
3.7
.9
444 24.9
17 1.0
71
1,272
141
1.7
30.9
3.4
33 .9 .5
18
35
.4
.9
v. austriaca (Grun.)Hust.S. faslculata v. truncata (Grev.)Patr. Tabellarla Ehr.T. fenestrata (Lyng.)Kutz. Thallaslothrlx Cl. and Grun.T. frauenfeldli (Grun.)Grun.T. longlssiaa Cl. and Grun. Trachysphenla PetitT. acunlnata Perag.
98 2.862 2.7
Navlculales Cyabellaceae Amphora Ehr. A. angusta v. ventricosa (Greg.)Cl.A. calunetlca (Thorn, and Wolle)M.Perag.A. acutluscula Kutz.A. ovalls (Kutz.)Kutz.A. perpusllla Grun.A. proteoldes Bust. Cymbella Ag.C. affinis Kutz.
2121
.9
.93535
.9
.9
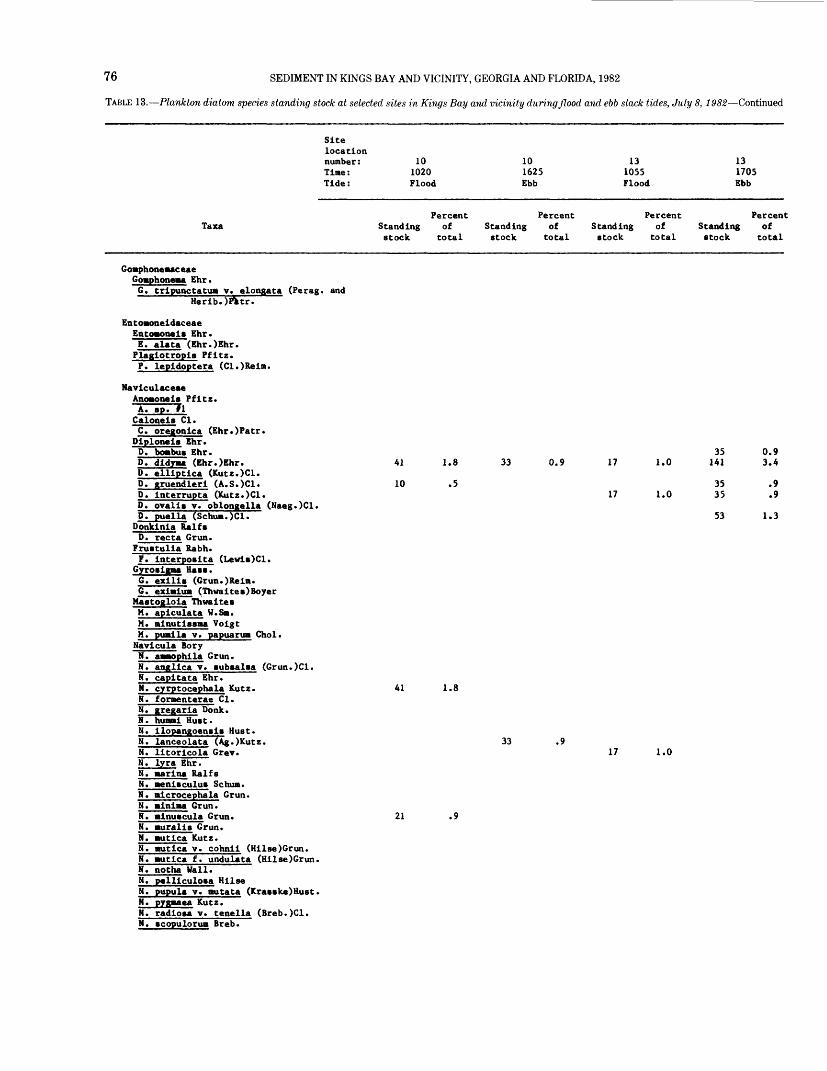
76 SEDIMENT IN KINGS BAY AND VICINITY, GEORGIA AND FLORIDA, 1982
TABLE 13. Plankton diatom species standing stock at selected sites in Kings Bay and vicinity during flood and ebb slack tides, July 8, 1982 Continued
Sitelocation number: Time: Tide:
101020 Flood
101625Ebb
131055 Flood
131705Ebb
TaxaPercent
Standing of stock total
PercentStanding of stock total
PercentStanding of stock total
PercentStanding of stock total
Gomphonemaceae Gomphonema Ehr. G. tripuactatun v.
Herib.)P\tr.
Entomoneidaceae Entoaoneis Ehr.E. alata (Ehr.)Ehr. Plagiotropia Pfitz.P. lepidoptera (Cl.)Reim.
NaviculaceaeAnomoneia Pfitz.
A. BpTTi
elongata (Perag. and
Caloneia Cl.C. oregonica (Ehr.)Patr.
Diploneia Ehr.D. bombu« Ehr.D. didyma (Ehr.)Ehr.D. elliptica (Kutz.)Cl.D. gruendleri (A.S.)Cl.D. interrupta (Kutz.)Cl.D. ovalit v. oblongella (Naeg.)Cl.P. puella (Scham.TcU Donkinia RalfiD. recta Grun.
Fruatulia Rabh.F. interpoaita (Lewi«)Cl.
Gyroaigma Has*.C. exilU (Grun.)Reim.C. eximiun (Thwaitei)Boyer
Maatogloia Thwaite*M. apiculata W.S«.M. minuti»»ma VoigtM. pumila v. papuarum Chol. Navicula BoryH. aaaophila Grun.N. anglica v. «ub«al«a (Grun.)Cl.N. capitata Ehr.N. cyrptocephala Kutz.N. foraenterae Cl.N. gregaria Donk.N. humai Hu«t.N. ilopangoen»i» Hust.N. lanceolata (Ag.)Kutz.N. litoricola Grev.N. lyra Ehr.N. marina RalfsN. »eni»culu» Schum.N. microcephala Grun.N. minima Grun.M. minuacula Grun.N. muralia Grun.M. mutica Kutz.N. mutica v. cohnii (Hilse)Grun.M. mutica f. undulata (Hilse)Grun.M. notha Wall.N. pelliculoaa HilseN. papula v. mutata (Kra»ke)Hust.M. pygmaea Kutz.M. radiosa v. tenella (Breb.)Cl.N. copulorum Breb.
41
10
1.8
.5
33 0.9 17
17
1.0
1.0
35141
3535
53
0.9 3.4
.9
.9
1.3
41 1.8
33 .917 1.0
21 .9
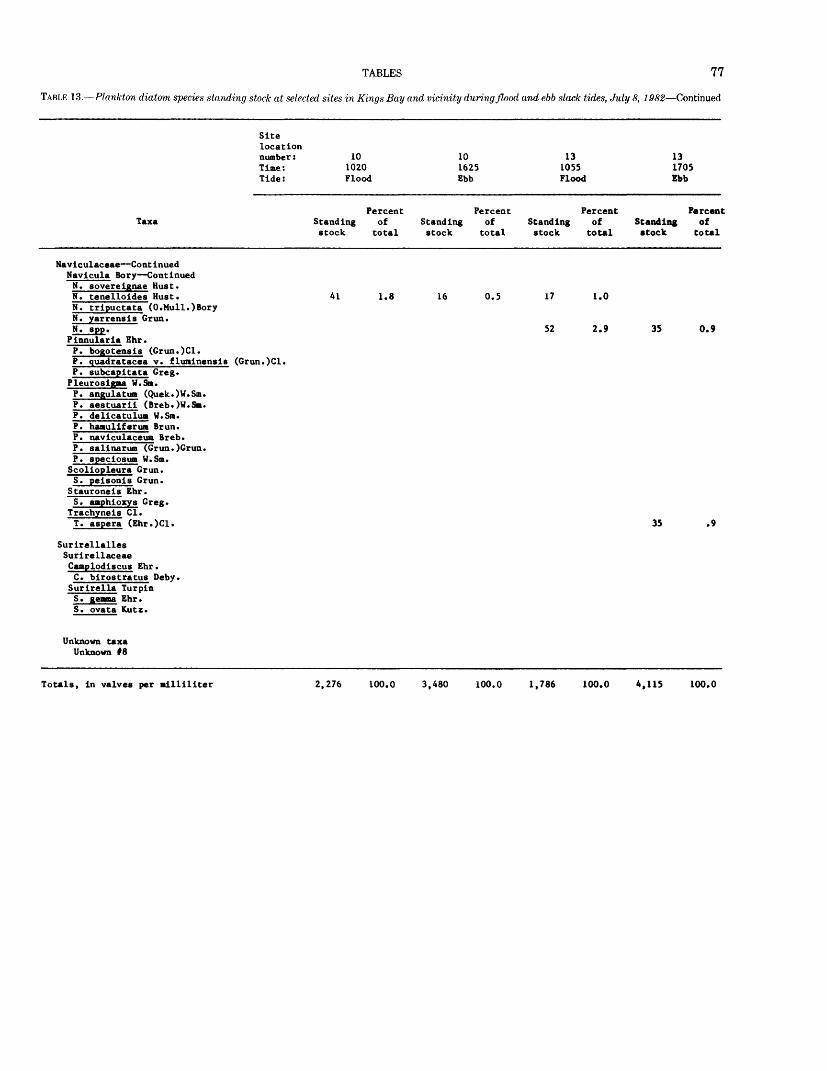
TABLES 77
TABLE 13. Plankton diatom species standing stock at selected sites in Kings Bay and vicinity during flood and ebb slack tides, July 8, 1982 Continued
Sitelocationnumber: 10 10 13 13Time: 1020 1625 1055 1705Tide: Flood Ebb Flood Ebb
Percent Percent Percent PercentTaxa Standing of Standing of Standing of Standing of
stock total stock total stock total stock total
Naviculaceae Cont inued Navicala Bory ContinuedN. sovereignae Bust.N. tenelloides Hast. 41 1.8 16 0.5 17 1.0N. tripuctata (0.Mull.)BoryN. yarrensis Grun.N. spp. 52 2.9 35 0.9 Pinnularia Ehr.P. bogotensis (Grun.)Cl.P. quadratacea v. fluminensis (Grun.)Cl.P. subcapitata Greg. Pleurosigaa W.Sa.P. angulatum (Quek.)W.Sm.P. aestuarii (Breb.)W.Sm.P. delicatulum W.Sm.P. hamuliferum Brun.P. naviculaceum Breb.P. salinarum (Grun.)Grun.P. speciosum W.Sm. Scoliopleura Grun.S. peisonis Grun.
Stauroneis Ehr.S. amphiozys Greg.
Trachyneis Cl.T. aspera (Ehr.)Cl. 35 .9
Surirellalles Surirellaceae Camplodiscus Ehr.C. birostratus Deby.
Surirella Turpin S. gemma Ehr. S. ovata Kutz.
Unknown taxa Unknown 18
Totals, in valves per milliliter 2,276 100.0 3,480 100.0 1,786 100.0 4,115 100.0

78 SEDIMENT IN KINGS BAY AND VICINITY, GEORGIA AND FLORIDA, 1982
TABLE 13. Plankton diatom species standing stock at selected sites in Kings Bay and vicinity during flood and ebb slack tides, July 8, 1982 Continued
Sitelocation number: Time: Tide:
141110 Flood
141710Ebb
151120 Flood
151725Ebb
TaxaPercent
Standing of stock total
PercentStanding of stock total
Percent Standing of stock total
PercentStanding of stock total
Bacillariophyta Bac illariophyceee Achnanthalea Achnanthaceae Achnanthea Borg
A. baldjickii aubap. lorenzianaA. cuviroatrum Grun. A. hauckiana Grun. A. lanceolata v. dubia Grun. A. linearia (W.Sm.)Grun. A. ainutiaaiaa Kutz. A. temperet M. Perag.
Cocconeia Ehr. C. coatata Greg. C. diainuta Pant. C. diaculua (Schua.)Cl. C. diatana Greg. C. scute Hum Ehr.
33 1.5 93
21
4.1
.9
6834
2.8 1.4
25
25
38
1.0
1.0
1.4
Bacillariallaa Nitzachiaceae Bacillaria Gi si.B. paradoxa Gael.
Cylindrotheca Rabh.C. cloaterium (Ehr.)Reim. and Lew.
Hantzachia Grun.H. aaphioxya v. minor Perag. and Perag. Mitzachia Haaa.M. amphibia Grun.M. brtttont Hag.N. clauali Hantz.N. c inia Rabh.M. compreaaa (Bail.)BoyerN. conatricta (Kutz.)RalfaM. diaaipata (Kutz.)Grun.M. faaciculata (Grun.)Grun.M. filiformia (W.Sm.)V.H.M. fonticola Grun.M. fruatulum (Kutz.)Grun.M. granulata Grun.M. hungarica Grun.M. longiaaima (Breb.)Grun.M. lorenziana v. aubtilia Grun.M. microcephala Grun.M. navicularia (Breb.)Grun.M. obtusa W.Sm.M. obtuaa v. acalpelliformia Grun.M. palea (Kutz.)W.Sm.M. panduriformia Greg.M. parvula W.Sm.M. romana Grun.M. acolaria (Ehr.)W.Sm.M. aigma (Kutz.)W.Sa.M. atagaorua (Rabh.)Grun.M. aublinearia Huat.M. theraalia v. ainor HilseN. triblionelle Hantz.
22 1.0 42
42
1.8
1.8
34
23
11
57
1.4
.9
.5
2.4
25 1.0
25
2576
1.0
1.0 2.9
44
35122
2.0
15.6 1.0
239 10.5 17045
7.1 1.9
31550
12.0 1.9
Epitheaialea Epithealaceae Rhopalodea O.Mull. R. muacula (Kutz.)0.Mull. R. muscula v. conatricta (Breb.)
Parag. and Perag.
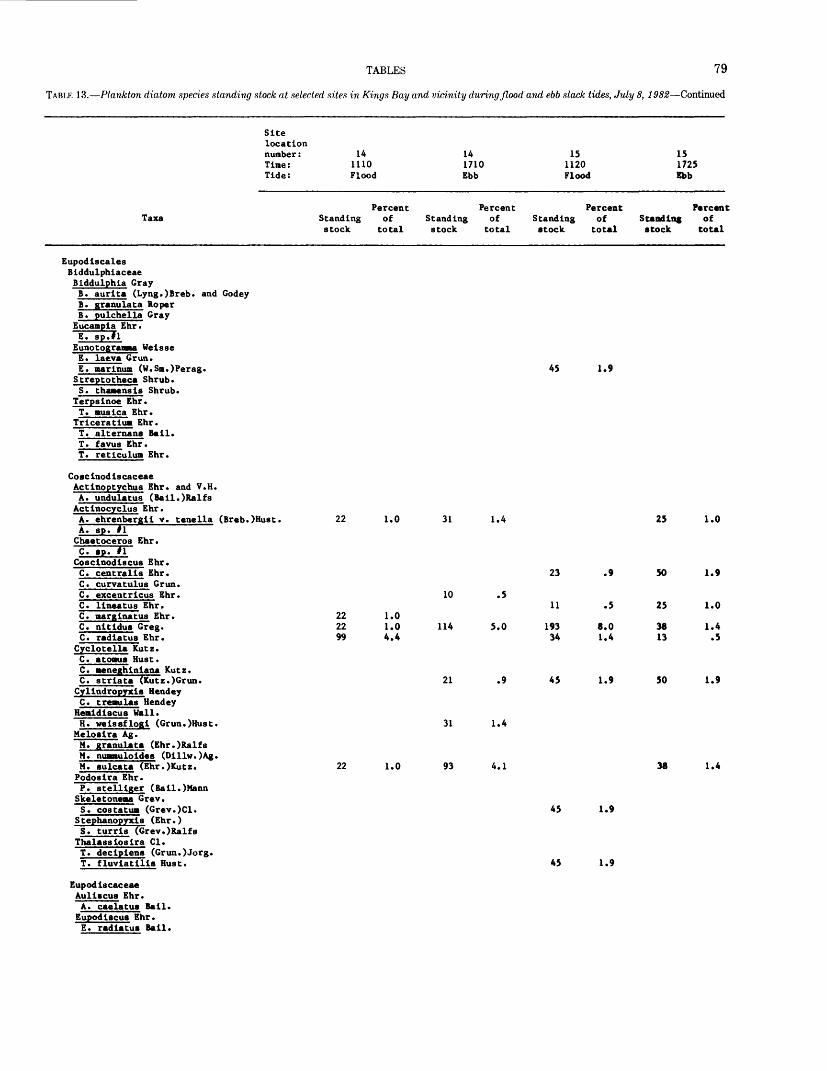
TABLES 79
TABLE 13. Plankton diatom species standing stock at selected sites in Kings Bay and vicinity during flood and ebb slack tides, July 8,1982 Continued
Sitelocationnumber: 14 14 15 15Time: 1110 1710 1120 1725Tide: Flood Ebb Flood Ebb
Percent Percent Percent PercentTaxa Standing of Standing of Standing of Standing of
stock total stock total stock total stock total
Eupodiscales Biddulphiaceae Biddulphia GrayB. aurlta (Lyng.)Breb. and Godey B. granulata Roper B. pulchella Gray Eucampia Ehr.
Eunotograaaa WeisseE. laeva Grun.E. aarinua (W.Sm.)Perag. 45 1.9 Streptotheca Shrub.S. thaaenaia Shrub.
Terpslnoe Ehr.T. auaica Ehr.
Triceratiua Ehr.T. alternans Bail.T. favua Ehr.T. reticulua Ehr.
Coscinodiscaceae Actinoptychus Ehr. and V.H.A. undulatus (Bail.)Ralfs Actinocyclus Ehr.A. ehrenbergii v. tenella (Breb.)Hust. 22 1.0 31 1.4 25 1.0A. ap. fi Chaetoceros Ehr. ~C. ap. f1 ' Coacinodiacua Ehr.C. centralis Ehr. 23 .9 50 1.9C. curvatulus Grun.C. excentricus Ehr. 10 .5C. lineatus Ehr. 11 .5 25 1.0C. marginatus Ehr. 22 1.0C. nitidua Greg. 22 1.0 114 5.0 193 8.0 38 1.4C. radiatus Ehr. 99 4.4 34 1.4 13 .5 Cyclotella Kutz.C. atoms Bust.C. aeneghiniana Kutz.C. atriata (Kutz.)Grun. 21 .9 45 1.9 50 1.9 Cylindropyxis HendeyC. treaulaa Hendey Heaidiacua Wall.H. weiaaflogi (Grun.)Hust. 31 1.4
Melosira Ag.M. granulata (Ehr.)RalfsM. nuaauloides (Dillw.)Ag.M. sulcata (Ehr.)Kutz. 22 1.0 93 4.1 38 1.4 Podoaira Ehr.P. atelliger (Bail.)Nann Skeletonema Grev.S. coatatua (Grev.)Cl. 45 1.9
Stephanopyxia (Ehr.) ~S. turria (Grev.)Ralfa Thalaaaioaira Cl.T. decipiens (Grun.)Jorg.T. fluviatilia Huat. 45 1.9
Eupodiacaceae Auliacua Ehr.A. caelatus Bail. Eupodiscus Ehr. E. radiatus Bail.
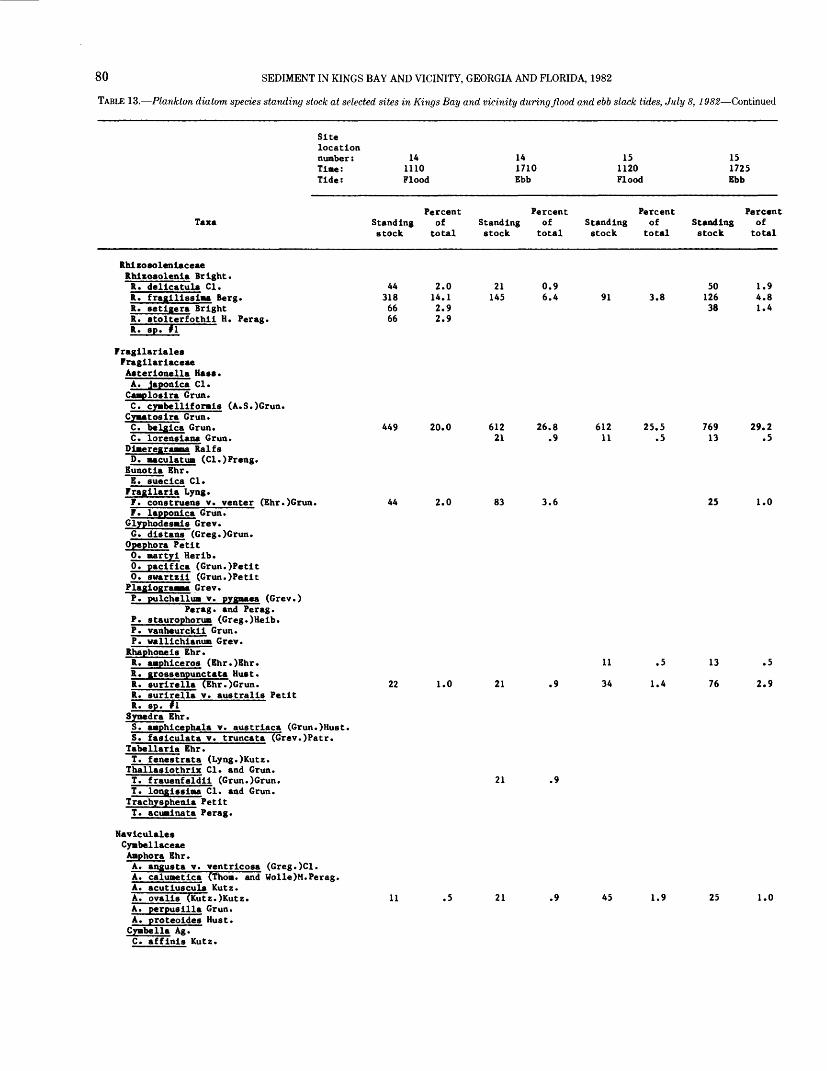
80 SEDIMENT IN KINGS BAY AND VICINITY, GEORGIA AND FLORIDA, 1982
TABLE 13. Plankton diatom species standing stock at selected sites in Kings Bay and vicinity during flood and ebb slack tides, July 8, 1982 Continued
Sitelocation number: Time: Tide:
141110 Flood
141710Ebb
151120 Flood
151725Ebb
TaxaPercent
Standing of stock total
PercentStanding of stock total
PercentStanding of stock total
PercentStanding of stock total
Rhizoaoleniaceae RhizQgolenia Bright. R. delicatula Cl. R. fragilissima Berg. R. getigera Bright R. tolterfothii H. Perag. R. sp. ll'
Fragilarialeg Fragilariaceae Asterionella Has*.A. japonica Cl. Camplosira Grun.C. cymbelliformis (A.S.)Grun. Cymatosira Grun.C. belgica Grun.C. lorensiana Grun. Dimeregraaaa Ralfs
443186666
2.014.12.92.9
21145
0.9 6.4 91 3.8
5012638
1.9 4.8 1.4
449 20.0
D. maculatum (Cl.)Freng. Eunotia Ehr.E. suecica Cl. Fragilaria Lyng.F. construens v. venter (Ehr.)Grun. 44 2.0
61221
83
26.8 .9
3.6
61211
25.5 .5
76913
25
29.2 .5
1.0F. lapponica Grun.
Glyphodesais Grev.G. digtang (Greg.)Grun.
Opcphora Petit0. martyi Herib.0. paclfica (Grun.)Petit0. gwartzii (Grun.)Petit Plagiograaaa Grev.P. pulchellua v. pygnaea (Grev.)
Perag. and Perag.P. staurophorum (Greg.)Heib.P. vanheurckii Grun.P. wallichianum Grev.
Rhaphoneis Ehr.R. amphiceros (Ehr.)Ehr.R. groggenpunctata Hust.R. gurirella (Ehr.)Grun.R. gurirella v. australis PetitR. gp. fl'
Synedra Ehr.S. amphicephala
22 1.0 21 .9
11
34
.5
1.4
13
76
.5
2.9
v. austriaca (Grun.)Hust.S. fasiculata v. truncata (Grev.)Patr.
Tabellaria Ehr.T. fenestrata (Lyng.)Kutz. Thallasiothrix Cl. and Grun.T. frauenfeldii (Grun.)Grun.T. longissima Cl. and Grun. Trachysphenia PetitT. acuminata Perag.
Naviculaleg Cynbellaceae Aaphora Ehr.A. angugta v. ventricosa (Greg.)Cl.A. calumetica (Thorn, and Wolle)M.Perag.A. acutiugcula Kutz.A. ovalis (Kutz.)Kutz.A. perpusilia Grun.A. proteoideg Hust. Cymbella Ag.C. affinis Kutz.
21 .9
11 .5 21 .9 45 1.9 25 1.0
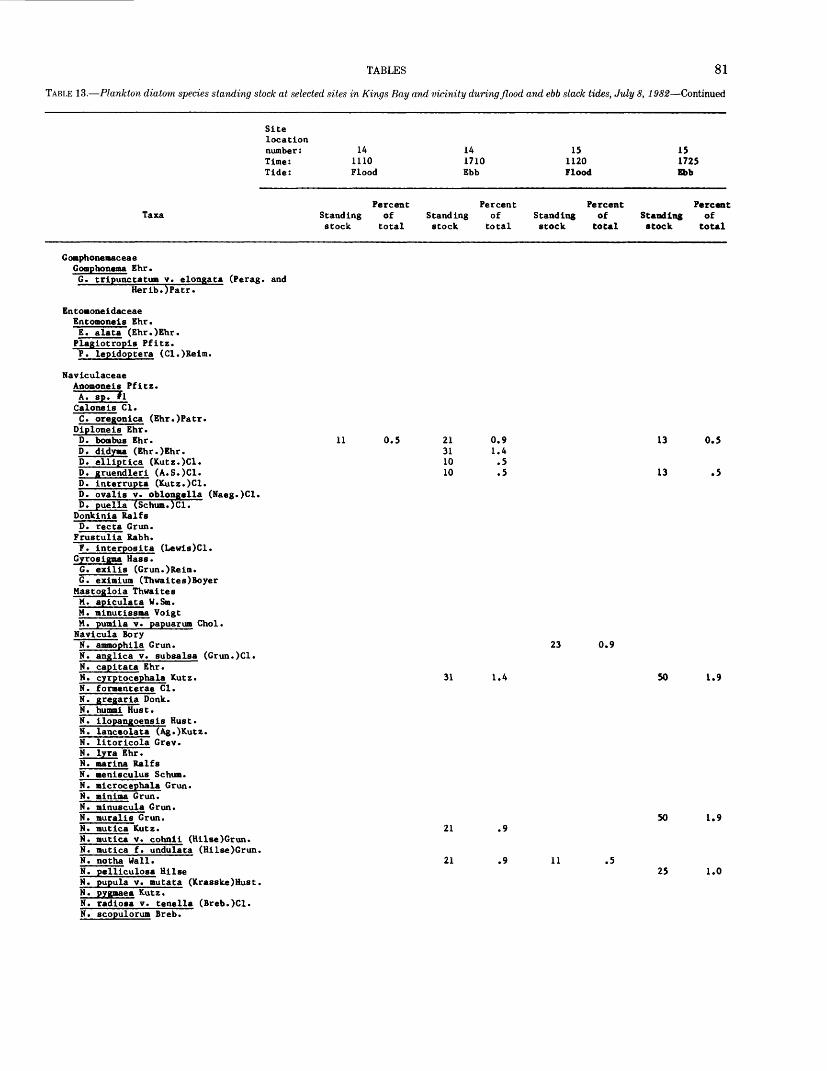
TABLES 81
TABLE 13. Plankton diatom species standing stock at selected sites in Kings Bay and vicinity during flood and ebb slack tides, July 8, 1982 Continued
Sitelocation number: Time: Tide:
141110 Flood
141710Ebb
151120 Flood
151725Ebb
TaxaPercent
Standing of stock total
PercentStanding of stock total
Percent PercentStanding of Standing ofstock total stock total
Gomphonemaceae Gomphonema Ehr. G. trlpunctatum v. elongata (Perag. and
Herlb.)Patr.
Entomoneidaceae Entomonels Ehr.E. alata (Ehr.)Ehr. Plagiotropis Pfltz.P. lepldoptera (Cl.)Relm.
NavlculaceaeAnomoneis Pfltz.A. sp. II Caloneis Cl.C. oregonlca (Ehr.)Patr.
Diploneis Ehr.D. bonbus Ehr.D. didyma (Ehr.)Ehr.D. elliptica (Kutz.)Cl.D. gruendleri (A.S.)Cl.D. interrupta (Kutz.)Cl.D. ovalis v. oblongella (Naeg.)Cl.D. puella (Schum.)Cl.
Donkinia RalfsD. recta Grun. Frustulia Rabh.F. interposita (Lewis)Cl.
Gyrosigma Mass.G. exilis (Grun.)Reim.G. eximium (Thwaites)Boyer
Mastogloia ThwaitesM. apiculata W.Sm.M. minutissma VoigtM. pumila v. papuarum Chol. Navicula BoryN. ammophila Grun.N. anglica v. subsalsa (Grun.)Cl.N. capitata Ehr.N. cyrptocephala Kutz.N. formenterae Cl.N. gregaria Donk.N. humni Hust.N. ilopangoensis Hust.N. lanceolata (Ag.)Kutz.N. litoricola Grev.N. lyra Ehr.N. marina RalfsN. menisculus Schum.N. microcephala Grun.N. minima Grun.N. minuscula Grun.N. muralis Grun.N. mutica Kutz.N. mutica v. cohnii (Hilse)Grun.N. mutica f. undulata (Hilse)Grun.N. notha Wall.N. pelliculosa HilseN. pupula v. mutata (Krasske)Hust.N. pygmaea Kutz.N. radiosa v. tenella (Breb.)Cl.N. scopulorum Breb.
11 0.5 21311010
0.91.4.5.5
13
13
0.5
.5
23 0.9
31 1.4 50 1.9
21 .9
21 .9 11 .5
SO 1.9
25 1.0
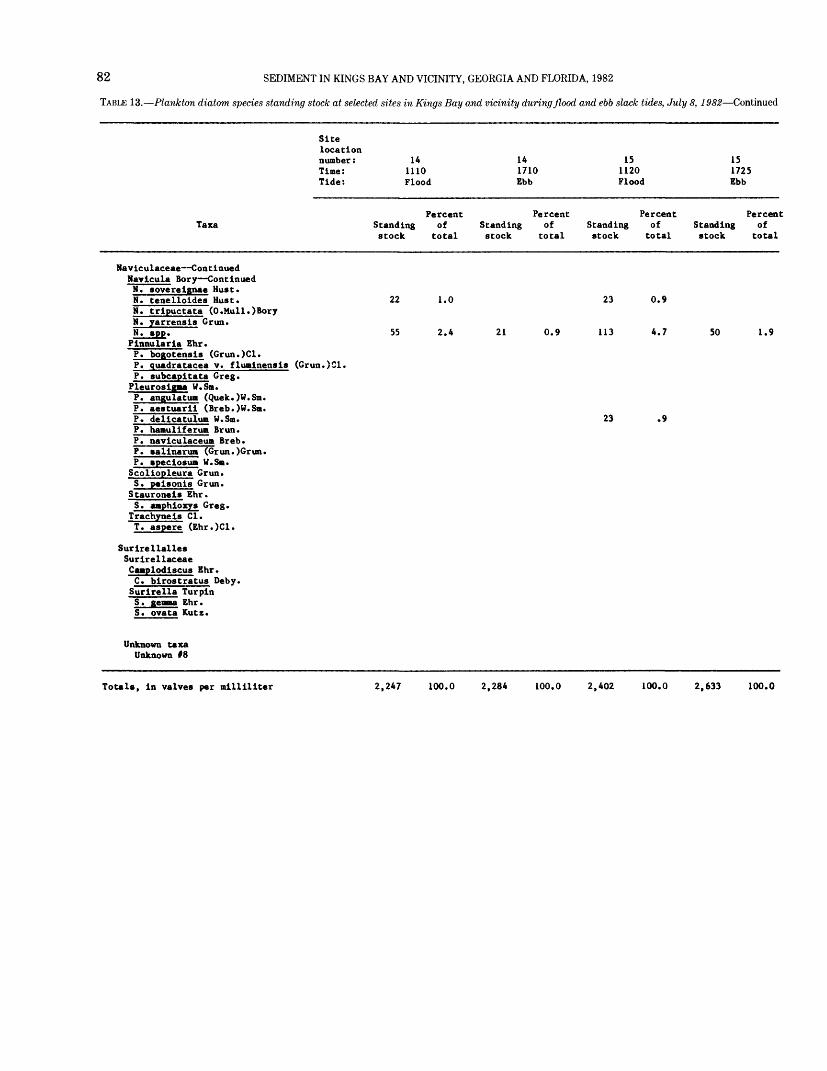
82 SEDIMENT IN KINGS BAY AND VICINITY, GEORGIA AND FLORIDA, 1982
TABLE 13. Plankton diatom species standing stock at selected sites in Kings Bay and vicinity during flood and ebb slack tides, July 8, 1982 Continued
Sitelocationnumber: 14 14 15 15Time: 1110 1710 1120 1725Tide: Flood Ebb Flood Ebb
Percent Percent Percent PercentTaxa Standing of Standing of Standing of Standing of
stock total stock total stock total stock total
Maviculaceae Continued Navicula Bory ContinuedN. soverelgnae Must.N. tenelloides Must. 22 1.0 23 0.9N. trlpuctata (0.Mull.)BoryN. yarrensis Grun.N. spp. 55 2.4 21 0.9 113 4.7 50 1.9 Pinnularia Ehr.P. bogotensls (Grun.)Cl.P. quadratacea v. flumlnensls (Grun.)Cl.P. subcapitata Greg. Pleurosigma W.Sa.P. angulatum (Quek.)W.Sm.P. aestuarll (Breb.)W.Sa.P. delicatulum W.Sm. 23 .9P. hamuliferum Brun.P. navlculaceum Breb.P. sallnarum (Grun.)Grun.P. peciosum W.Sm. Scoliopleura Grun.S. pelsonis Grun.
Stauroneis Ehr.S. amphioxys Greg.
Trachynels Cl.T. aspere (Ehr.)Cl.
Surlrellalles Surirellaceae Camplodiscus Ehr.C. blrostratus Deby. Surlrella Turpln
S. ovata Kutz.
Unknown taxa Unknown t&
Totals, In valves per mllllllter 2,247 100.0 2,284 100.0 2,402 100.0 2,633 100.0
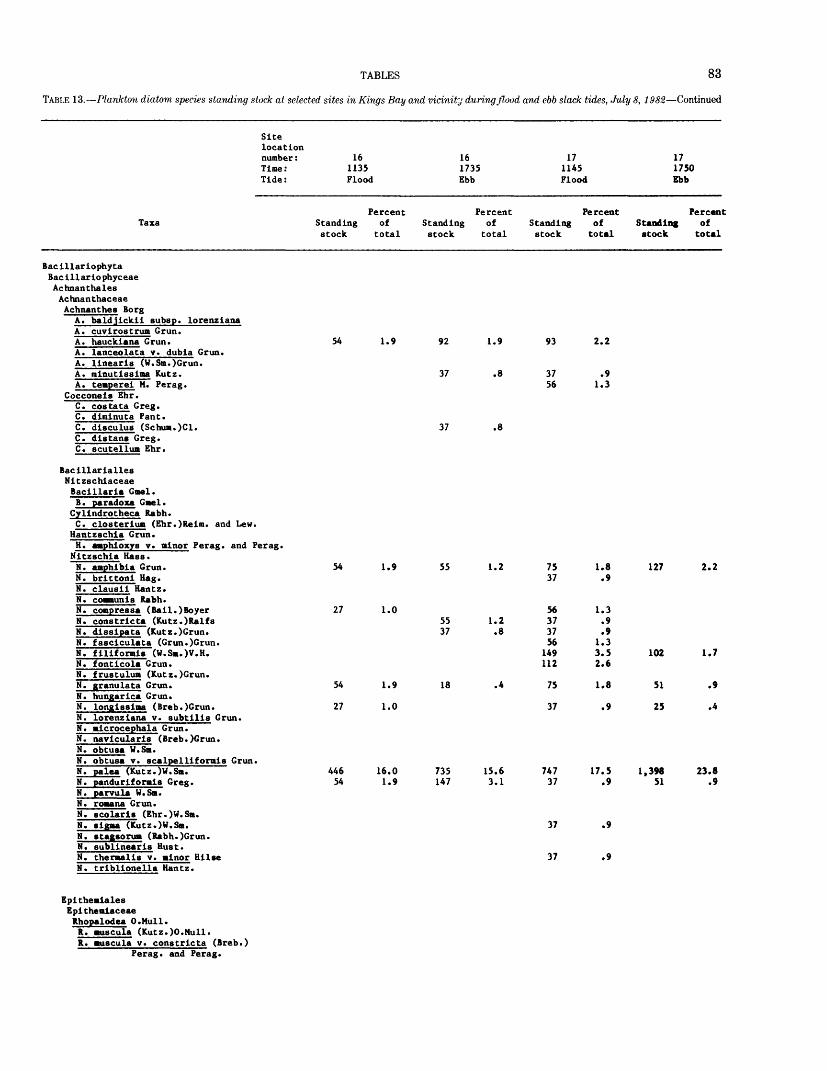
TABLES 83
TABLE 13. Plankton diatom species standing stock at selected sites in Kings Bay and vicinity during flood and ebb slack tides, July 8, 1982 Continued
Site location number: 16 16 Time: 1135 1735 Tide: Flood Ebb
Percent Percent Taxa Standing of Standing of
stock total stock total
Bacillariophyta Bacillariophyceae Achnanthales Achnanthaceae Achnanthes Borg
A. baldjickii subsp. lorenzianaA. cuvirostruB Grim.A. hauckiana Grim. 54 1.9 92 1.9A. lanceolata v. dubia Grun.A. linearis (W.Sm.)Grun.A. minutissima Kutz. 37 .8A. teaperei M. Perag.
Cocconeis Ehr.C. cos tat a Greg.C. diminuta Pant.C. disculus (Schua.)Cl. 37 .8C. distant Greg.C. scutelluB Ehr.
Bacillarialles Nitzschiaceae Bacillaria Gael.B. paradox* Gael.
Cylindrotheca Rabh. C. closteriuB (Ehr.)Reim. and Lew.
Hantzschla Grun.H. aaphioxys v. minor Perag. and Perag.Nitzschia Mass.N. amphibia Grun. 54 1.9 55 1.2N. brittoni Hag.N. clausii Hantz.N. comaunis Rabh.N. coapressa (Bail.)Boyer 27 1.0N. constricta (Kutz.)Ralfs 55 1.2N. dissipata (Kutz.)Grun. 37 .8N. fasciculata (Grun.)Grun.N. filiforais (W.Sa.)V.H.N. fonticola Grun.N. frustulua (Kutz.)Grun.N. _granulata Grun. 54 1.9 18 .4N. hungarica Grun.N. longissiaa (Breb.)Grun. 27 1.0N. lorenziana v. subtilis Grun.N. aicrocej>hala Grun.N. navicularis (Breb.)Grun.N. obtusa W.Sa.N. obtusa v. scalpel liforai s Grun.N. palea (Kutz.)W.Sa. 446 16.0 735 15.6 N. panduriforais Greg. 54 1.9 147 3.1N. parvula W.Sa.N. roaana Grun.N. scolarls (Ehr.)W.Sa.N. sigaa (Kutz.)W.Sa. N. stagsorua (Rabh.)Grun.N. sublinearis Hust.N. theraalis v. minor HilseN. triblionella Hantz.
Epitheaiales Epi theaiaceae Rhopalodea O.Mull. R. auscula (Kutz.)O.Hull.R. auscula v. constricta (Breb.)
Perag. and Perag.
17 17 1145 1750 Flood Ebb
Percent Percent Standing of Standing of stock total stock total
93 2.2
37 .9 56 1.3
75 1.8 127 2.2 37 .9
56 1.3 37 .9 37 .9 56 1.3
149 3.5 102 1.7 112 2.6
75 1.8 51 .9
37 .9 25 .4
747 17.5 1,398 23.8 37 .9 51 .9
37 .9
37 .9

84 SEDIMENT IN KINGS BAY AND VICINITY, GEORGIA AND FLORIDA, 1982
TABLE 13. Plankton diatom species standing stock at selected sites in Kings Bay and vicinity during flood and ebb slack tides, July 8, 1982 Continued
Sittlocation number: Time: Tide:
161135 Flood
161735Ebb
171145 Flood
171750Ebb
TaxaPercent
Standing of stock total
PercentStanding of stock total
Percent PercentStanding of Standing ofstock total stock total
Eupodiscales Biddulphiaceae Biddulphia GrayB. aurlta (Lyng.)Breb. and Godey B. granulata Roper B. pulchella Gray
Eucampla Ehr.
Eunotograaaa WeisseE. laeva Grun.E. aarlnun (W.Sm.)Perag. Streptotheca Shrub.S. thamensis Shrub.
Terpsinoe Ehr.T. auslca Ehr.
Triceratium Ehr.T. alternans Bail.T. favus Ehr.T. retlculum Ehr.
Coscinodiscaceae Actinoptychus Ehr. and V.H.A. undulatus (Bail.)Ralfs
Actinocyclus Ehr.A. ehrenbergii v. tenella (Breb.)Hust.A. sp. IJ
Chaetoceros Ehr.C. sp.TF Coscinodiscus Ehr.C. centrails Ehr.C. curvatulus Grun.C. excentricus Ehr.C. lineatus Ehr.C. aarglnatus Ehr.C. nitidus Greg.C. radiatus Ehr. Cyclotella Kutz.C. atoaus Hust.C. meneghiniana Kutz.C. striata (Kutz.)Grun.
Cylindropyxis HendeyC. tremulas Hendey
Heaidiscus Wall.H. weissflogi (Grun.)Hust.
Melosira Ag.M. granulata (Ehr.)RalfsM. numauloides (Dillw.)Ag.M. sulcata ^EhrQKutz. Podosira Ehr.P. stelllger (Bail.)Mann Skeletonema Grev.S. costatum (Grev.)Cl.
Stephanopyxis (Ehr.)S. turris 7Grev.)Ralfs
Thalassiosira Cl.T. deciplens (Grun.)Jorg.T. fluviatilis Hust.
14 0.537 0.8 149 3.5
27
27
27
8181
27
1.0
1.0
1.0
2.9 2.9
1.0
37 .8 37 .9
1855377337
1855
37
37
.4 1.2,8
1.6.8
.4 1.2
.8
.8
19
11237
149
.4
2.6 .9
3.5
25
280
51
102
76
51
0.4
4.8
.9
1.7
1.3
.9
27 1.0
Eupodlscaceae Auliscus Ehr.A. caelatus Bail. Eupodiscus Ehr.E. radiatus Bail.
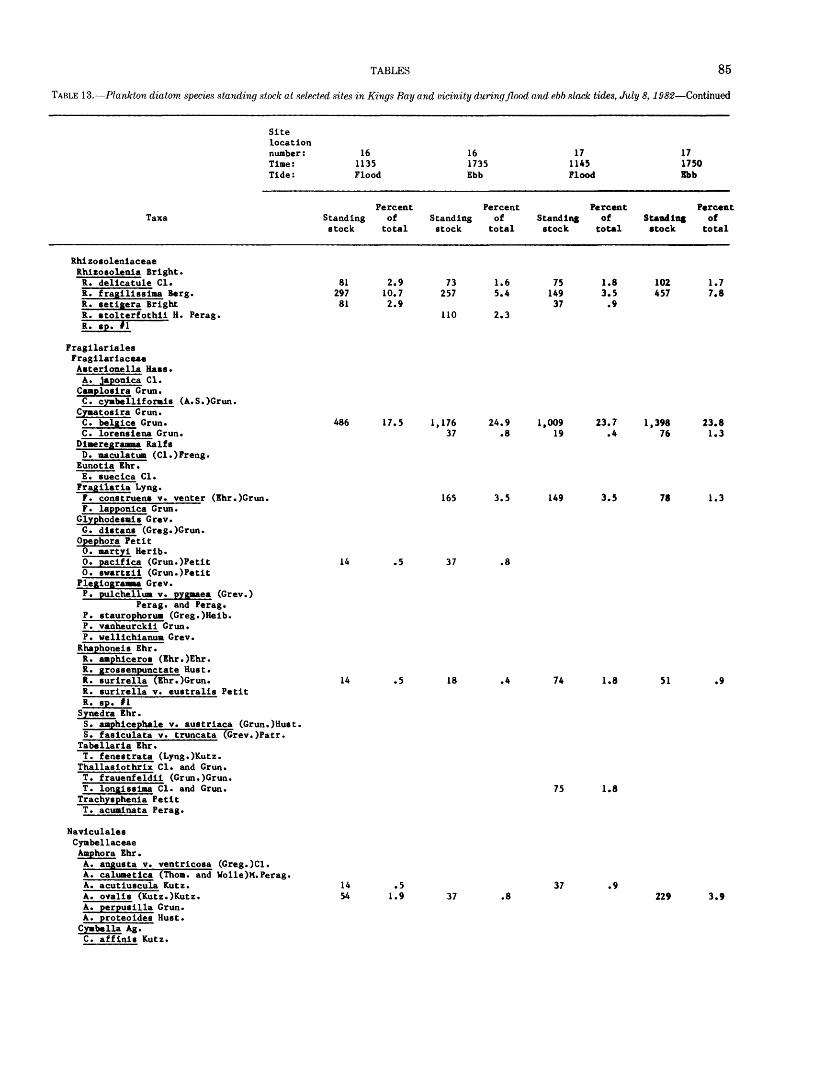
TABLES 85
TABLE 13. Plankton diatom species standing stock at selected sites in Kings Bay and vicinity during flood and ebb slack tides, July 8, 1982 Continued
Sitelocationnumber:Time:Tide:
161135 Flood
161735Ebb
171145 Flood
171750Ebb
TaxaPercent
Standing of stock total
PercentStanding of stock total
PercentStanding of stock total
PercentStanding of stock total
Rhi zo soleniaceae Rhizosolenia Bright. R. delicatule Cl. R. fragilissima Berg. R. se tiger a Bright R. tolterfothii H. Perag. R. sp. »l'
8129781
2.910.72.9
73257
110
1.6 5.4
2.3
7514937
1.83.5.9
102457
1.7 7.8
Fragilariales Fragilariaceae Asterionella Hass.A. japonica Cl. Caaploslra Grun.C. cymbellif orals (A.S.)Grun.
Cymatosira Grun. C. belgice Grun. C. lorensiena Grun.
486 17.5
Dlmeregr. RalfsD. maculatum (Cl.)Freng.
Eunotla Ehr.E. suecica Cl. Fragilaria Lyng.F. constructs v. venter (Ehr.)Grun.F. lapponica Grun.
Glyphodesmls Grev.G. distans (Greg.)Grun. Opephora Petit0. aartyi Herib.0. pacifica (Grun.)Petit0. swartzii (Grun.)Petit Plegiogramma Grev.P. pulchellua v. pygmaea (Grev.)
Perag. and Perag.P. staurophorum (Greg.)Heib.P. vanheurckii Grun.P. wellichianua Grev.
Rhaphoneis Ehr.R. amphlceros (Ehr.)Ehr.R. grossenpunctate Hust.R. surirella (EhrT)Grun.R. surirella v. eustralis PetitR. sp. II Synedra Ehr.S. amphicephale v. austriaca (Grun.)Hust.S. fasiculata v. truncata (Grev.)Patr.
Tabellaria Ehr.T. fenestrata (Lyng.)Kutz. Thallaslothrix Cl. and Grun.T. frauenfeldii (Grun.)Grun.T. longissima Cl. and Grun. Trachysphenia PetitT. acuminata Perag.
Naviculales Cymbellaceae Amphora Ehr. A. angusta v.
14 .5
1,17637
165
37
24.9 .8
3.5
.8
1,00919
149
23.7
3.5
1,39876
78
23.81.3
1.3
14 .5 18 74 1.8 51 .9
75 1.8
ventricosa (Greg.)Cl.A. calumetlea (Thorn, and Wolle)M.Perag. A. acutiuscula Kutz. A. ovalls (Kutz.)Kutz. A. perpus11la Grun. A. proteoides Hust. Cymbella Ag. C. affinis Kutz.
1454
.5 1.9
37 .937 .8 229 3.9
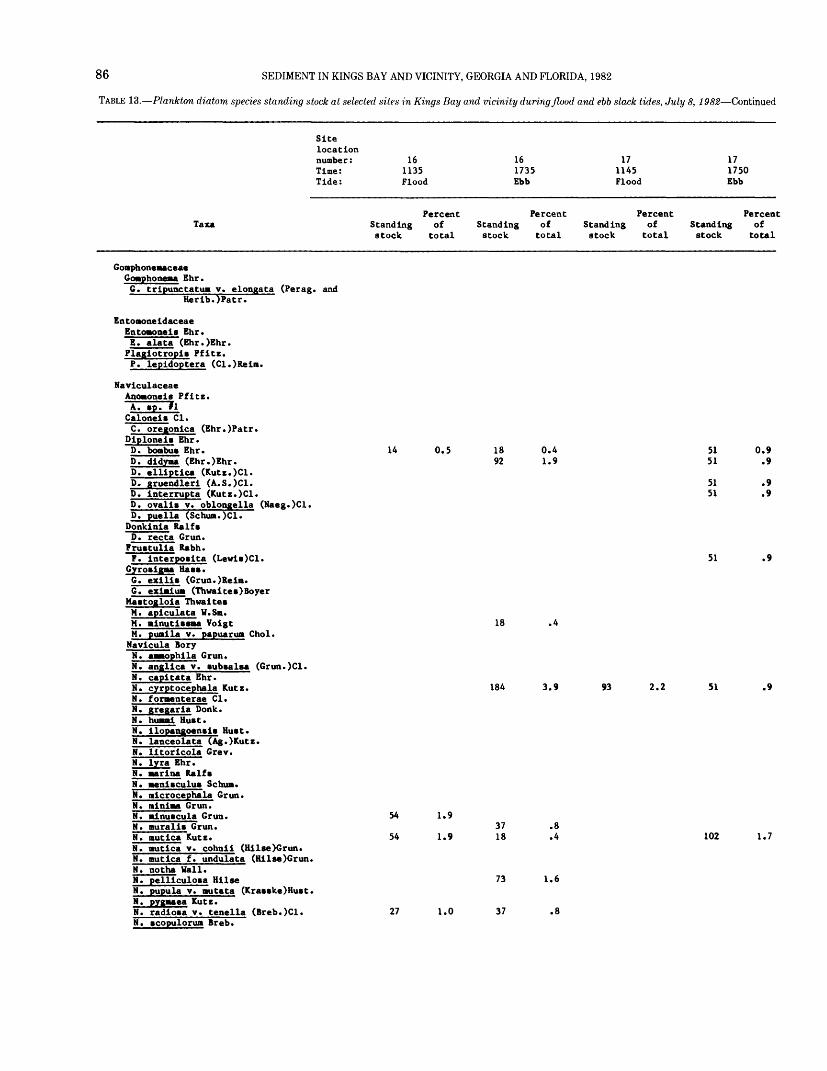
86 SEDIMENT IN KINGS BAY AND VICINITY, GEORGIA AND FLORIDA, 1982
TABLE 13. Plankton diatom species standing stock at selected sites in Kings Bay and vicinity during flood and ebb slack tides, July 8, 1982 Continued
Sitelocation number: Time: Tide:
161135 Flood
161735Ebb
171145 Flood
171750Ebb
TaxaPercent
Standing of stock total
PercentStanding of stock total
PercentStanding of stock total
PercentStanding of stock total
Goaphoneaaceae Goaphonema Ehr.G. tripunctatua y. elongata (Perag. and
Herib.)Patr.
Entoaoneidaceae Entoaoneis Ehr. E. alata (Ehr.)Ehr. Plagiotropi* Pfitz. P. lepidoptera (Cl.)Reim.
NaviculaceaeAnomonei* Pfitz. A. tpTTlCalonei* Cl.C. oregonica (Ehr.)Patr.
Diplonei* Ehr.D. boabu* Ehr.D. didyma (Ehr.)Ehr.D. elliptica (Kutz.)Cl.D. gruendleri (A.S.)Cl.D. interrupta (Kutz.)Cl.D. ovali* v. oblongella (Maeg.)Cl.D. puella (Schua.)Cl.
Donkinia RalftD. recta Grun. Fru»tulia Rabh.P. interpo»ita (Lewit)Cl.
Gyro»igaa Ha».G. ezili» (Grun.)Reim.G. exiaiua (Thwaitec)Boyer
Ma»togloia ThwaitetM. apiculata W.Sm.M. minuti»8aa VolgtM. puaila v. papuarua Chol. Navicula BoryN. aaaophila Grun.N. anglica v. »ub»alsa (Grun.)Cl.N. capitata Ehr.N. cyrptocephala Kutz.N. foraenterae Cl.M. gregaria Donk.N. hunai Hutt.
14 0.5 1892
0.4 1.9
5151
5151
0.9 .9
.9
.9
51 .9
18 .4
184 3.9 93 2.2 51 .9
N. ilopangoen»i» Huct. lanceolata (Ag.)Kutz. litoricola Grev.lyra Ehr. marina Ralft
N. enitculu* Schun.N. microcephala Grun.N. minima Grun.N. mimncula Grun.N. aurali» Grun.N. mutica Kutz.N. autica v. cohnii (Hilse)Grun.N. autica f. undulata (Hilse)Grun.N. notha Wall.N. pelliculoM HilseN. pupula v. autata (Krattke)Hutt.N. pygaaea Kutz.N. radio»a v. tenella (Breb.)Cl.N. tcopulorua Breb.
54
54
1.9
1.9
27 1.0
3718
73
37
.8
.4
1.6
.8
102 1.7
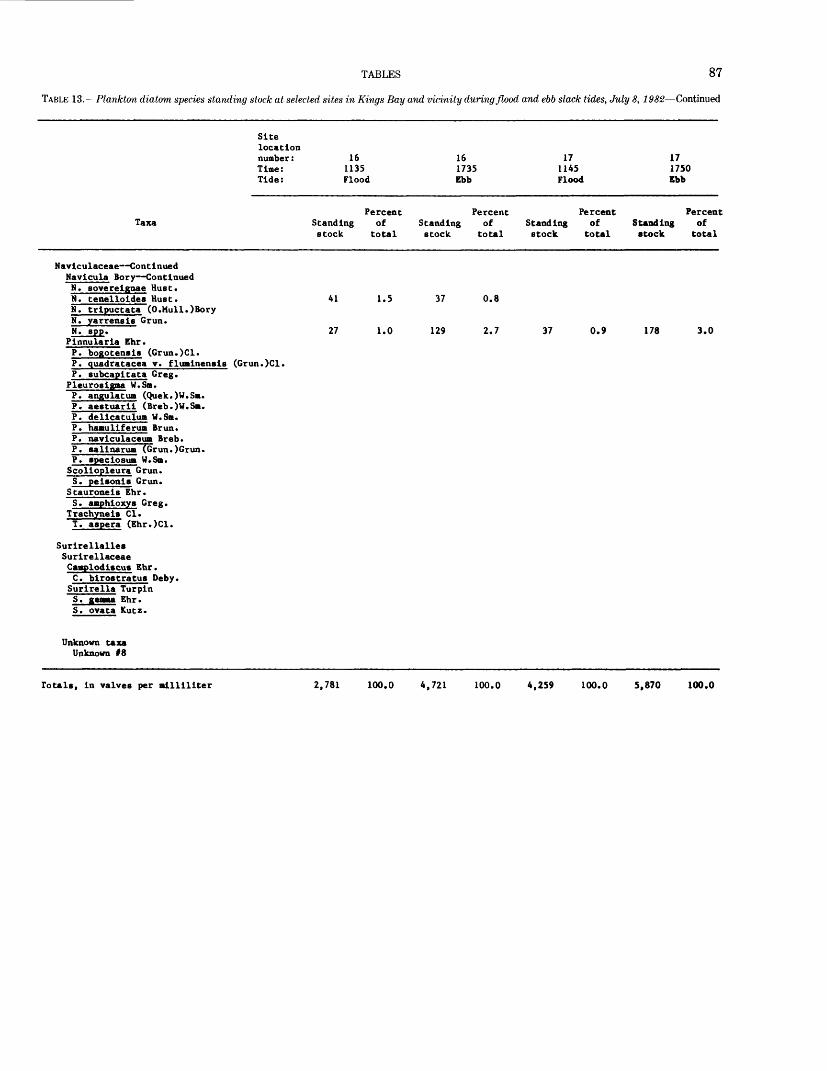
TABLES 87
TABLE 13. Plankton diatom species standing stock at selected sites in Kings Bay and vicinity during flood and ebb slack tides, July 8, 1982 Continued
Sitelocationnumber: 16 16 17 17Time: 1135 1735 1145 1750Tide: Flood Ebb Flood Ebb
Percent Percent Percent PercentTaxa Standing of Standing of Standing of Standing of
stock total stock total stock total stock total
Naviculaceae Continued Navicula Bory ContinuedN. sovereignae Bust.N. tenelloides Bust. 41 1.5 37 0.8N. tripuctata (O.Mull.)BoryN. yarrensis Grun.N. spp. 27 1.0 129 2.7 37 0.9 178 3.0
Pinnularia Ehr.P. bogotensis (Grun.)Cl.P. quadratacea v. fluminensis (Grun.)Cl.P. subcapitata Greg. Pleurosigma W.Sm.P. angulatum (Quek.)W.Sm.P. aestuarii (Breb.)W.Sm.P. delicatulum W.Sm.P. hamuliferua Brun.P. naviculaceum Breb.P. salinarum ?Grun.)Grun.P. gpeciosua W.Sm. Scoliopleura Grun.S. peisonis Grun.
Stauroneis Ehr.S. amphioxys Greg.
Trachyneis Cl.T. aspera (Ehr.)Cl.
Surirellalles Surirellaceae Camplodiscus Ehr.C. birostratus Deby. Surirella Turpin S. gemma Ehr. S. ovata Kutz.
Unknown taxa Unknown 18
Totals, in valves per mllliliter 2,781 100.0 4,721 100.0 4,259 100.0 5,870 100.0
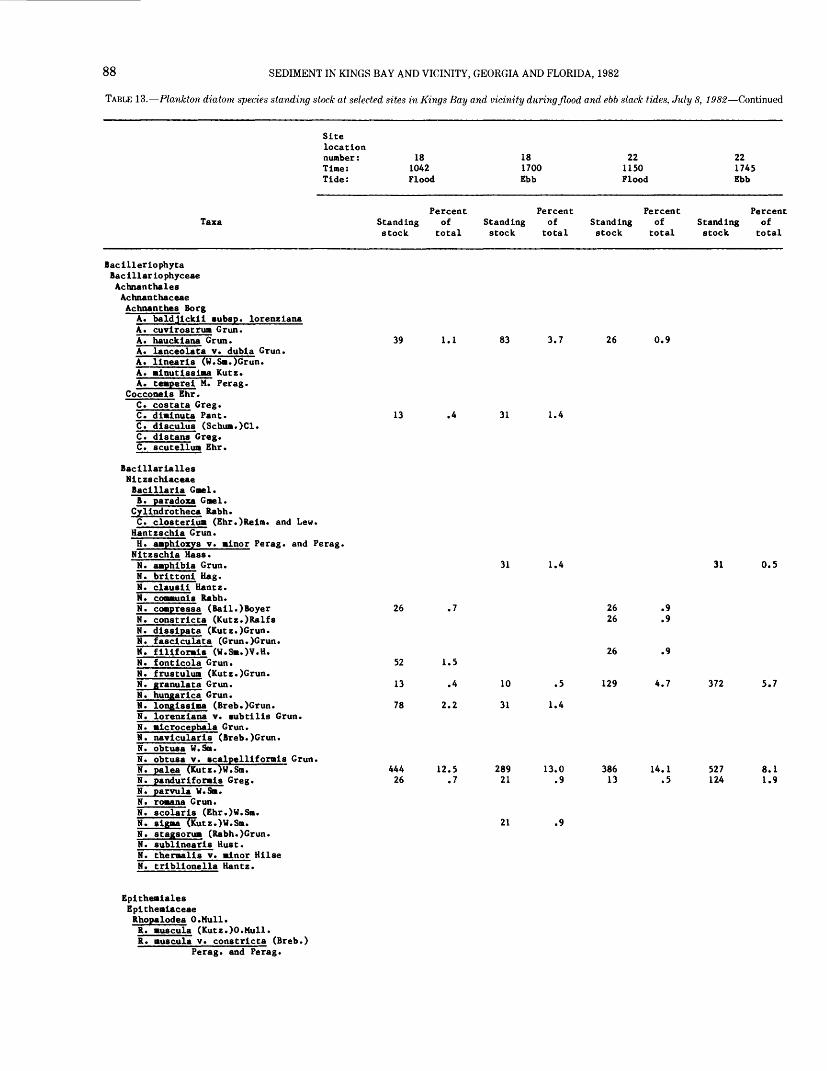
88 SEDIMENT IN KINGS BAY AND VICINITY, GEORGIA AND FLORIDA, 1982
TABLE 13. Plankton diatom species standing stock at selected sites in Kings Bay and vicinity during flood and ebb slack tides, July 8, 1982 Continued
Sitelocation number: Time: Tide:
181042 Flood
181700Ebb
221150 Flood
221745Ebb
TaxaPercent
Standing of stock total
PercentStanding of stock total
PercentStanding of stock total
PercentStanding of stock total
Bacilleriophyta Bac illar io phyceae Achnanthales Achnanthaceae Achnanthes Borg
A. baldjickii subsp. lorenzlana A. cuvirostrun Grun. A. hauckiana Grun. A. lanceolata v. dubia Grun. A. llnearls (W.Sm.)Grun. A. alnutlsslaa Kutz. A. tcaperei M. Perag.
Cocconels Ehr. C. costata Greg. C. diainuta Pant. C. dlsculus (Schum.)Cl. C. dlstana Greg. C. scutellum Ehr.
39 1.1 83 3.7 26 0.9
13 .4 31 1.4
Bacillarialles Nitzschiaceae Bad liar la Go si.B. paradoxa Gael.
Cyllndrotheca Rabh.C. closterlua (Ehr.)Reim. and Lew.
Hantzschla Grun.H. amphioxys v. minor Perag. and Perag. Nltzschla Hass.N. amphibia Grun.N. brlttonl Hag.N. clausii Uantz.N. coamunls Rabh.N. compressa (Bail.)BoyerN. constrlcta (Kutz.)RalfsN. dissipata (Kutz.)Grun.N. fasclculata (Grun.)Grun.N. filiformis (W.Sa.)V.H.N. fonticola Grun.N. frustulum (Kutz.)Grun.N. granulata Grun.N. hungarlca Grun.N. longissima (Breb.)Grun.N. lorenzlana v. subtills Grun.N. microcephala Grun.N. navlcularls (Breb.)Grun.N. obtusa W.Sm.N. obtusa v. scalpelllformls Grun.N. palea (Kutz.)W.Sm.N. pandurIforals Greg.N. parvula W.Sm.N. romana Grun.N. scolarls (Ehr.)W.Sm.N. slgma~?Kutz.)W.Sa.N. stagsorua (Rabh.)Grun.N. subllnearls Hust.N. theraalls v. minor HllseN. trlbllonella Hantz.
31 1.4 31 0.5
26
52
13
78
44426
.7
1.5
.4
2.2
12.5 .7
10
31
28921
21
.5
1.4
13.0 .9
.9
2626
26
129
.9
.9
.9
4.7 372 5.7
38613
14.1 .5
527124
8.1 1.9
Eplthemlales Epithemiaceae Rhopalodea O.Mull. R. auscula (Kutz.)O.Mull. R. auscula v. constrlcta (Breb.)
Perag. and Perag.
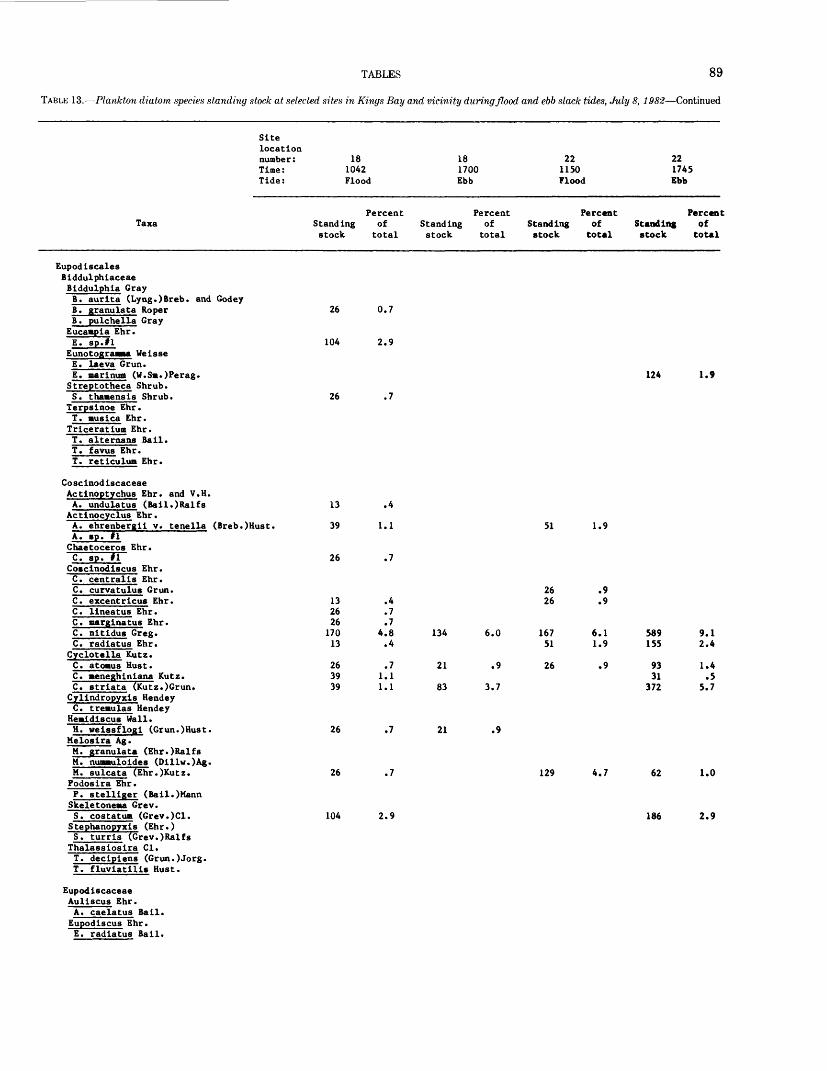
TABLES 89
TABLE 13. Plankton diatom species standing stock at selected sites in Kings Bay and vicinity during flood and ebb slack tides, July 8, 1982 Continued
Site location number: 18 Time: 1042 Tide: Flood
Percent Taxa Stand ing of
stock total
Eupodiscales Biddulphiaceae Biddulphia Gray B. aurlta (Lyng.)Breb. and GodeyB. granulata Roper 26 0.7B. pulchella Gray
Eucampia Ehr. E. sp.ll 104 2.9
Eunotogranma WeisseE. laeva Grun.E. marinum (W.Sm.)Perag.Streptotheca Shrub. S. thamensis Shrub. 26 .7
Terpsinoe Ehr. T. musica Ehr.Triceratium Ehr.T. alternans Bail.T. favus Ehr.T. reticulum Ehr.
Co sc inod iscaceae Ac tiuoptychus Ehr. and V.H. A. undulatus (Bail.)Ralfs 13 .4
Actinocyclus Ehr. A. ehrenbergii v. tenella (Breb.)Hust. 39 1.1A. sp. *1Chaetoceros Ehr.C. sp. il 26 .7
Cosclnodlscus Ehr.C. centralis Ehr.C. curvatulus Grun.C. excentricus Ehr. 13 .4C. lineatus Ehr. 26 .7C. marginatus Ehr. 26 .7C. nitidus Greg. 170 4.8C. radiatus Ehr. 13 .4
Cyclotella Kutz. C. atomus Hust. 26 .7C. menegjhiniana Kutz. 39 1.1C. striata (k'utz.)Grun. 39 1.1
Cylindropyxis Hendey C. tremulas HendeyHemidiscus Wall.H. welssflogi (Grun.)Hust. 26 .7
Melosira Ag.M. granulata (Ehr.)RalfsM. numuloides (Dillw.)Ag.M. sulcata (Ehr.)Kutz. 26 .7Podosira Ehr.P. stelliger (Bail.)MannSkeletonema Grev.S. costatun (Grev.)Cl. 104 2.9Stephanopyxis (Ehr.) S. turris (Grev.)Ralfs
Thalassiosira Cl.T. decipiens (Grun.)Jorg.T. fluviatilis Hust.
18 22 22 1700 1150 1745 Ebb Flood Ebb
Percent Percent Percent Standing of Standing of Standing of stock total stock total stock total
124 1.9
51 1.9
26 .9 26 .9
134 6.0 167 6.1 589 9.1 51 1.9 155 2.4
21 .9 26 .9 93 1.4 31 .5
83 3.7 372 5.7
21 .9
129 4.7 62 1.0
186 2.9
Eupod iscaceae Auliscus Ehr.
A. caelatus Bail. Eupodiscus Ehr.E. radiatus Bail.
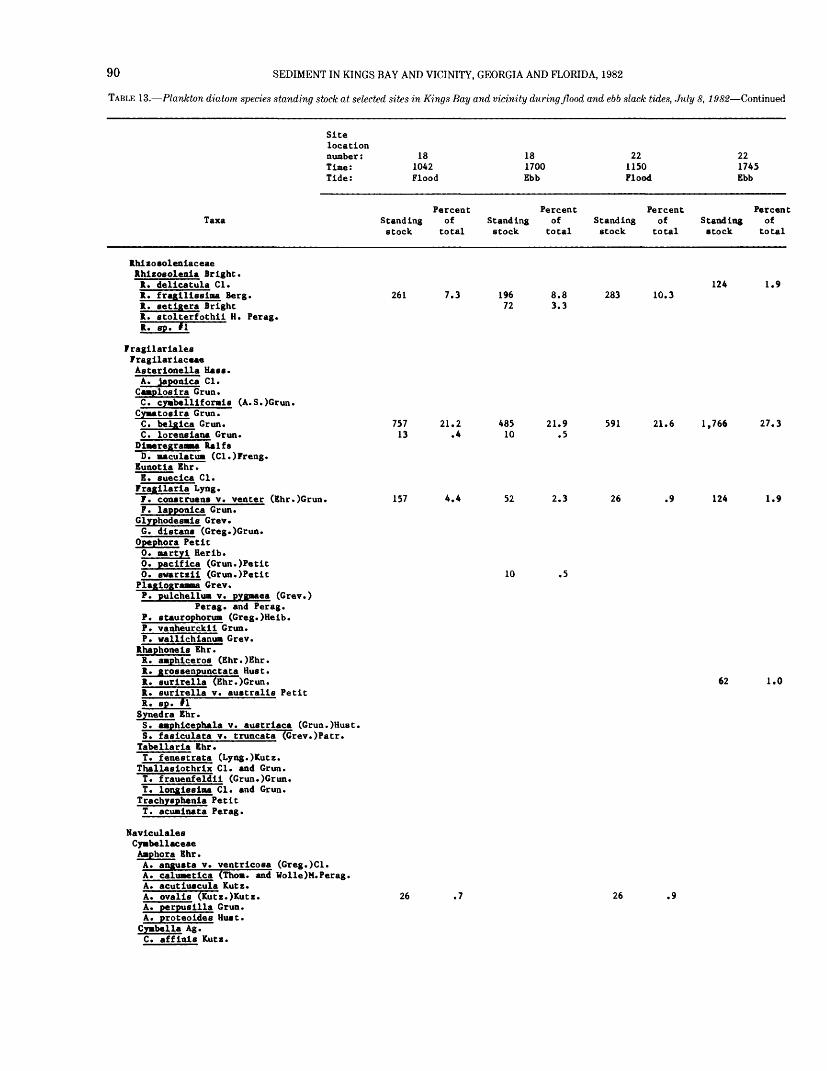
90 SEDIMENT IN KINGS BAY AND VICINITY, GEORGIA AND FLORIDA, 1982
TABLE 13. Plankton diatom species standing stock at selected sites in Kings Bay and vicinity during flood and ebb slack tides, July 8, 1982 Continued
Site location number: Time: Tide:
181042 Flood
181700Ebb
221150 Flood
221745Ebb
TaxaPercent
Standing of stock total
Percent Standing of stock total
Percent Standing of stock total
PercentStanding of stock total
Rhlzosolenlaceae Rhlzosolenla Bright. R. dellcatula Cl. R. fraglllsslma Berg. R. setlgera Bright R. stolterfothll H. Perag. R. sp. »1
124 1.9261 7.3 196
728.8 3.3
283 10.3
Fragllarlales Fragllarlaceae Asterlonella Hass.A. Japonic* Cl. Canploslra Grun.C. cymbelllf orals (A.S.)Grun. Cyaatoslra Grun. C. belglca Grun. C. lorenslana Grun.
Dlmeregr RalfsD. maculatum (Cl.)Freng.
Eunotla Ehr.E. sueclca Cl. Fragllarla Lyng.F. conatruens v. venter (Ehr.)Grun.
75713
157
21.2 .4
4.4
48510
52
21.9 .5
2.3
591 21.6 1.766 27.3
26 .9 124 1.9F. lapponlca Grun.
Glyphodesmls Grev.G. dlstans (Greg.)Grun.
Opephora Petit0. martyl Herlb.0. paclflca (Grun.)Petit0. swartzll (Grun.)Petit Plaglogramma Grev.P. pulchellum v. pygmaea (Grev.)
Perag. and Perag.P. staurophorum (Greg.)Heib.P. vanhcurckll Grun.P. walllchiamim Grev.
Rhaphonels Ehr.R. amphlceros (Ehr.)Ehr.R. grossenpunctata Hust.R. surlrella (Ehr.)Grun.R. surlrella v. australis PetitR. sp. ff Synedra Ehr.S. amphlcephala
10 .5
62 1.0
v. austrlaca (Grun.)Hust.S. faslculata v. truncata (Grev.)Patr. Tabellarla Ehr.T. fenestrata (Lyng.)Kutz.
Thallaslothrix Cl. and Grun.T. frauenfeldll (Grun.)Grun.T. longlsslma Cl. and Grun. Trachysphenla PetitT. acualnata Perag.
Navlculales Cymbellaceae Amphora Ehr. A. angusta v. ventrlcosa (Greg.)Cl.A. calumetlea (Thorn, and Wolle)M.Perag. A. acutluscula Kutz. A. ovalls (Kutz.)Kutz. A. perpusllla Grun. A. proteoldes Hust. Cymbella Ag. C. affinis Kutz.
26 .7 26 .9
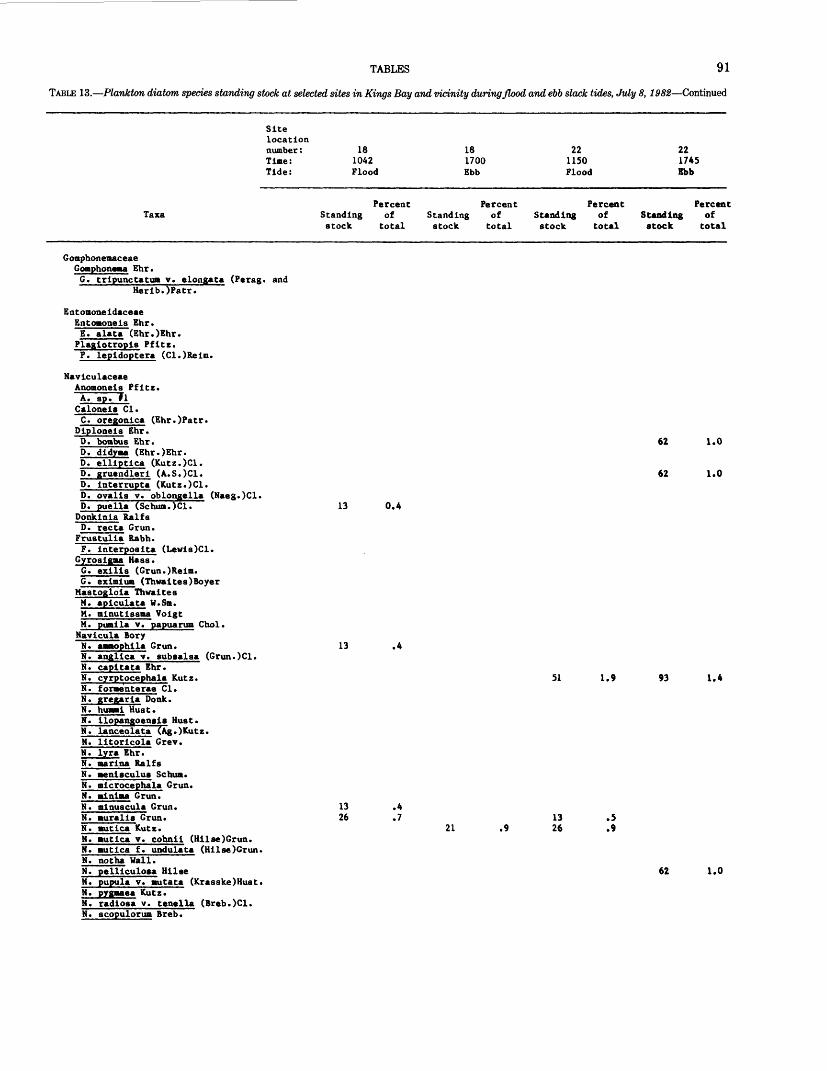
TABLES 91
TABLE 13. Plankton diatom species standing stock at selected sites in Kings Bay and vicinity during flood and ebb slack tides, July 8,1982 Continued
Site location number: Time: Tide:
181042 Flood
181700Ebb
221150 Flood
221745Ebb
TaxaPercent
Standing of stock total
PercentStanding of stock total
Percent Standing of stock total
PercentStanding of stock total
Gomphonemaceae Gomphonema Ehr. G. tripunctatum v. elongata (Perag. and
Herib.)Patr.
Entomoneidaceae Entomoneis Ehr.E. alata (Ehr.)Ehr. Plagtotropis Pfitz.P. leptdoptera (Cl.)Reim.
NaviculaceaeAnomonets Pfitz.
A. spTTl Calonei* Cl.C. oregonica (Ehr.)Patr.
Diploneis Ehr.D. boabus Ehr.D. didyaa (Ehr.)Ehr.D. elliptica (Kutz.)Cl.D. gruendleri (A.S.)Cl.D. interrupta (Kutz.)Cl.D. ovalts v. oblongella (Naeg.)Cl.D. puella (Schum.)Cl.
Donkinia RalfsD. recta Grun.
Frustulia Rabh.F. interposita (Lewis)C1.
Gyrosigaa Mass.G. exilts (Grun.)Reim.G. eximium (Thwaites)Boyer
Mastoglota ThwaitesM. aptculata W.Sm.M. minutissma VoigtM. pumila v. papuarum Chol. Navicula BoryN. amaophtla Grun.N. angltca v. subsalsa (Grun.)Cl.
62
62
1.0
1.0
13 0.4
13 .4
N. N. N.
capttata Ehr. cyrptocephala Kutz. fonenterae Cl.
51 1.9 93 1.4
N. N.
gregarta Donk. huBMl Hust.
N. N.
tlopangoensts Hust lanceolata ff
M. litoricola Grev. N. lyra Ehr. N. marina RalfsN. menlaculua Schum.N. microcephala Grun.N. minima Grun.N. minuscula Grun.N. muralia Grun.N. mutica Kutz.N. mutica v. cohnit (Hllse)Grun.N. mutica f. undulata (Hilse)Grun.N. notha Wall.N. pelliculosa HilseN. pupula v. mutata (Krasske)Hust.N. pygmaea Kutz.N. radiosa v. tenella (Breb.)Cl.N. scopulorum Breb.
1326
.4
.721 .9
1326
.5
.9
62 1.0
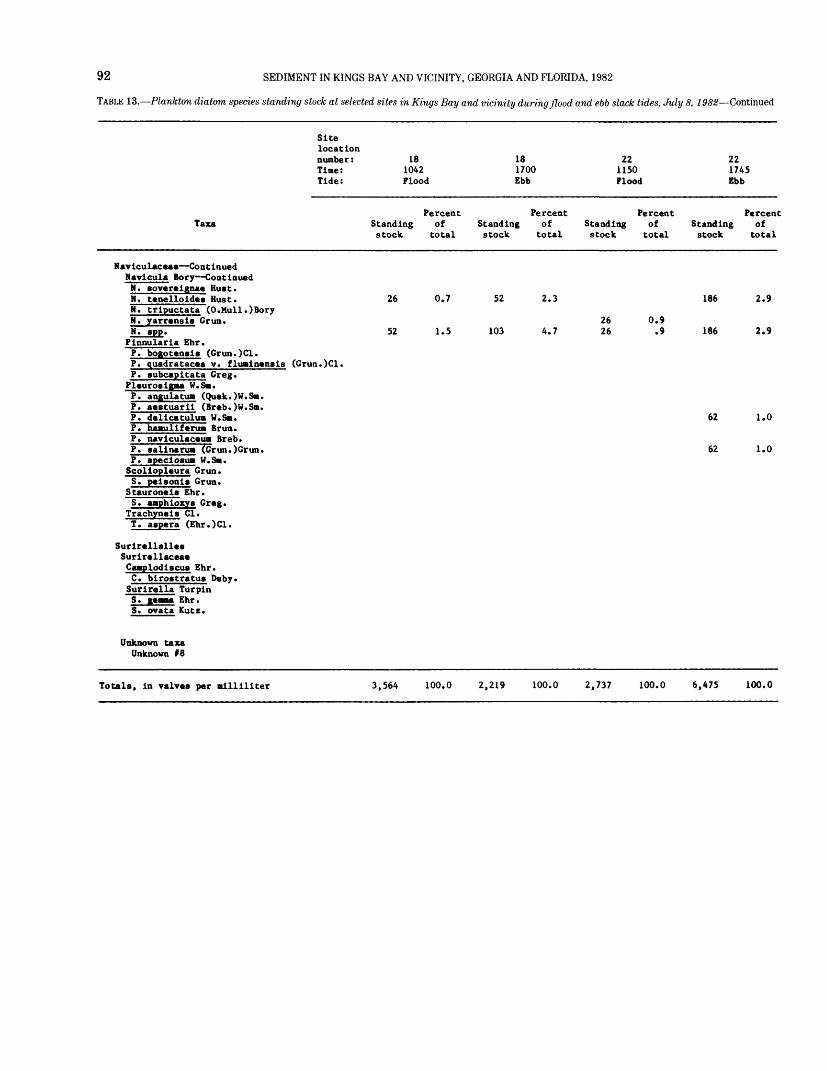
92 SEDIMENT IN KINGS BAY AND VICINITY, GEORGIA AND FLORIDA, 1982
TABLE 13. Plankton diatom species standing stock at selected sites in Kings Bay and vicinity during flood and ebb slack tides, July 8, 1982 Continued
Sitelocationnumber: 18 18 22 22Time: 1042 1700 1150 1745Tide: Flood Ebb Flood Ebb
Percent Percent Percent PercentTaxa Standing of Standing of Standing of Standing of
stock total stock total stock total stock total
Naviculac«ae Continued Navicula Bory ContinuedN. sovereignae Hust.N. tenelloides Bust. 26 0.7 52 2.3 186 2.9N. tripuctata (O.Mull.)BoryN. yarrensis Grun. 26 0.9N. «pp. 52 1.5 103 4.7 26 .9 186 2.9 Pinnularia Ehr.P. bogotensis (Grun.)Cl.P. quadratacea v. fluainensis (Grun.)Cl.P. subcapitata Greg. Pleurosigaa W.S».P. angulatua (Quek.)W.Sa.P. aestuarii (Breb.)W.Sm.P. delicatulua W.Sa. 62 1.0P. hamuliferum Brun.P. naviculaceua Breb.P. alinarua (Grun.)Grun. 62 1.0P. specicsum W.S». Scoliopleura Grun.S. p«i«oni« Grun.
Stauroneis Ehr.S. amphio*y« Greg.
Trachynei* Cl.T. aspera (Ehr.)Cl.
Surlrellalles Surlrellaceae
Camplodi«cu« Ehr. C. biro«tratu« Deby.
Surirella Turpin S. gemM Ehr. S. ovata Kutz.
Unknown taxa Unknown #8
Totals, in valves per milliliter 3,564 100.0 2,219 100.0 2,737 100.0 6,475 100.0
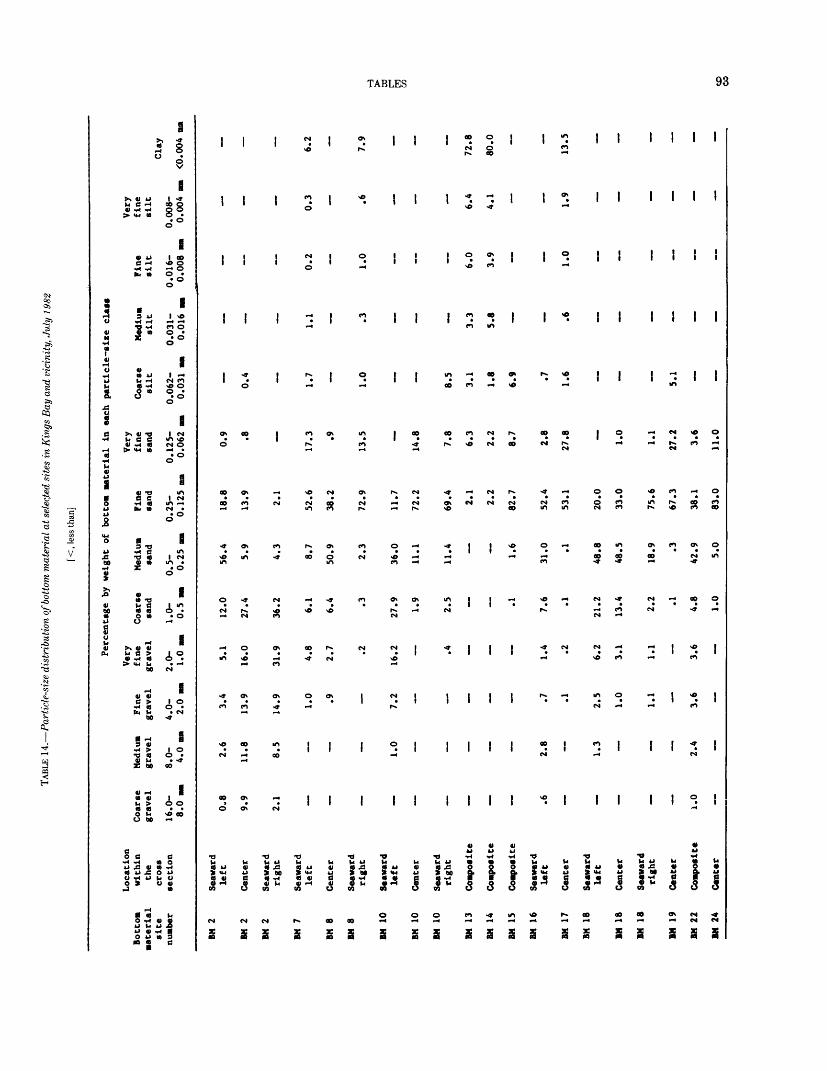
TABL
E 1
4.
Par
ticle
-siz
e di
stri
buti
on o
f bot
tom
mat
eria
l at
sel
ecte
d si
tes
in K
ings
Bay
and
vic
inity
, Jul
y 19
82
[<,
less
than
]
Bott
omma
teri
alsite
number
BM 2
BM 2
BM 2
BM 7
BM 8
BM 8
BM 10
BM 10
BM 10
BM 13
BM 14
BM 15
BM 16
BM 17
BM 18
BM 1
8
BM 18
BM 19
BM 2
2
BM 2
4
Loca
tion
within
the
cross
sect
ion
Seaw
ard
left
Cent
er
Seaw
ard
righ
t
Seaw
ard
left
Cent
er
Seaw
ard
righ
t
Seaw
ard
left
Cent
er
Seaw
ard
righ
t
Composite
Comp
osit
e
Composite
Seaw
erd
left
Cent
er
Seaw
ard
left
Cent
er
Seaw
ard
right
Cent
er
Comp
osit
e
Cent
er
Percentage by
Very
Coar
se
Medi
um
Fine
fine
Coar
segr
avel
gr
avel
gr
avel
gravel
sand
16.0-
8.0-
4.0-
2.0-
1.0-
8.0 mm
4.0 mm
2.0 mm
1.0 mm
0.5 mm
0.8
2.6
3.4
5.1
12.0
9.9
11.8
13.9
16.0
27.4
2.1
8.5
14.9
31.9
36.2
1.0
4.8
6.1
.9
2.7
6.4
.2
.3
1.0
7.2
16.2
27.9
^_
_^
^^
1 Q
.4
2.5
__-
"
"*
"
"""*
»1
.6
2.8
.7
1.4
7.6
.1
.2
.1
1.3
2.5
6.2
21.2
1.0
3.1
13.4
1.1
1.1
2.2
.1
1.0
2.4
3.6
3.6
4.8
1.0
weig
ht of
Medium
sand
0.5- 0.25 mm
56.4 5.9
4.3
8.7
50.9 2.3
36.0
11.1
11.4 1.6
31.0 .1
48.8
48.5
18.9 .3
42.9 5.0
bott
om material in
each part
icle
-siz
e cl
ass
Fine
sand
0.25-
0.125 mm
18.8
13.9 2.1
52.6
38.2
72.9
11.7
72.2
69.4 2.1
2.2
82.7
52.4
53.1
20.0
33.0
75.6
67.3
38.1
83.0
Very
Very
fine
Co
arse
Medium
Fine
fi
nesa
nd
silt
silt
silt
silt
Clay
0.125-
0.06
2-
0.03
1-
0.01
6-
0.00
8-0.
062 mm
0.031 mm
0.01
6 mm
0.
008 mm
0.00
4 mm
<0.004 m
m
0.9
.8
0.4
17.3
1.7
1.1
0.2
0.3
6.2
.9
_-_-
13.5
1.0
.3
1.0
.6
7.9
Cd
g CO
14.8 ___--__
7.8
8.5
6.3
3.1
3.3
6.0
6.4
72.8
2.2
1.8
5.8
3.9
4.1
80.0
8.7
6.9
2.8
.7
"* *"
27.8
1.6
.6
1.0
1.9
13.5
1.0
1.1
27.2
5.1
3.6 -----
-
11.0
0 ,
co
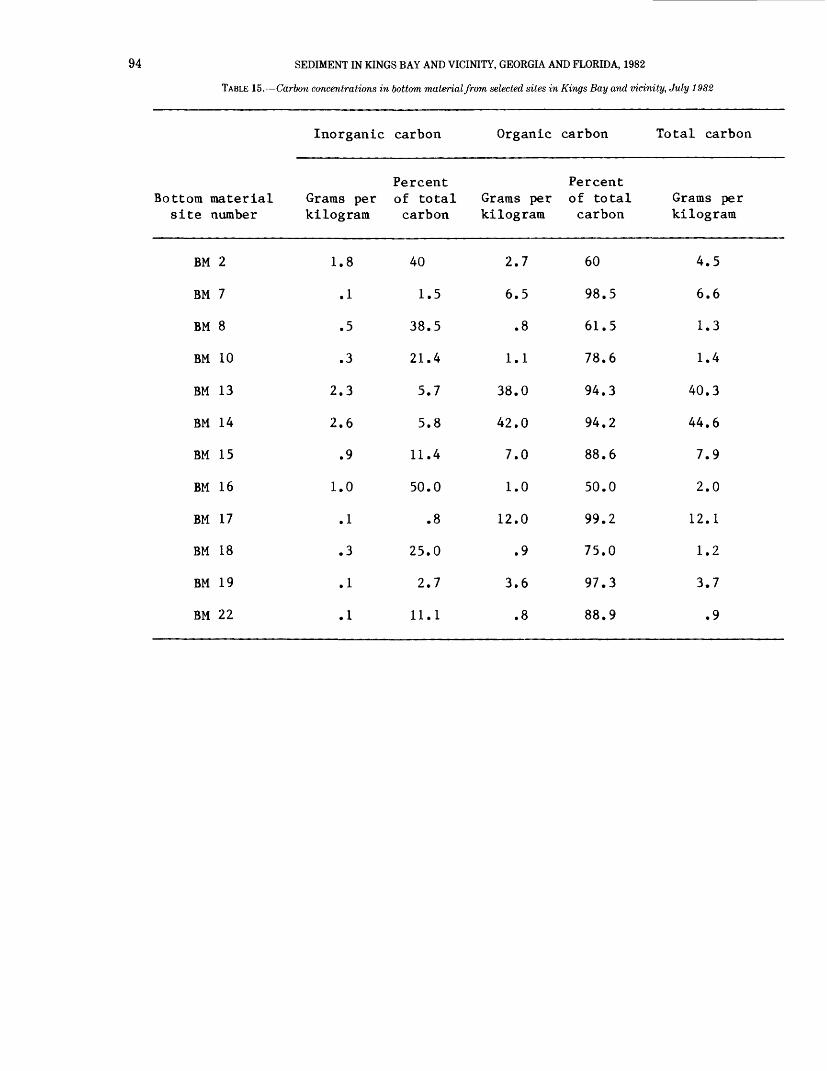
94 SEDIMENT IN KINGS BAY AND VICINITY, GEORGIA AND FLORIDA, 1982
TABLE 15. Carbon concentrations in bottom material from selected sites in Kings Bay and vicinity, July 1982
Bottom material site number
BM 2
BM 7
BM 8
BM 10
BM 13
BM 14
BM 15
BM 16
BM 17
BM 18
BM 19
BM 22
Inorganic
Grams per kilogram
1.8
.1
.5
.3
2.3
2.6
.9
1.0
.1
.3
.1
.1
carbon
Percent of total carbon
40
1.5
38.5
21.4
5.7
5.8
11.4
50.0
.8
25.0
2.7
11.1
Organic
Grams per kilogram
2.7
6.5
.8
1.1
38.0
42.0
7.0
1.0
12.0
.9
3.6
.8
carbon
Percent of total carbon
60
98.5
61.5
78.6
94.3
94.2
88.6
50.0
99.2
75.0
97.3
88.9
Total carbon
Grams per kilogram
4.5
6.6
1.3
1.4
40.3
44.6
7.9
2.0
12.1
1.2
3.7
.9
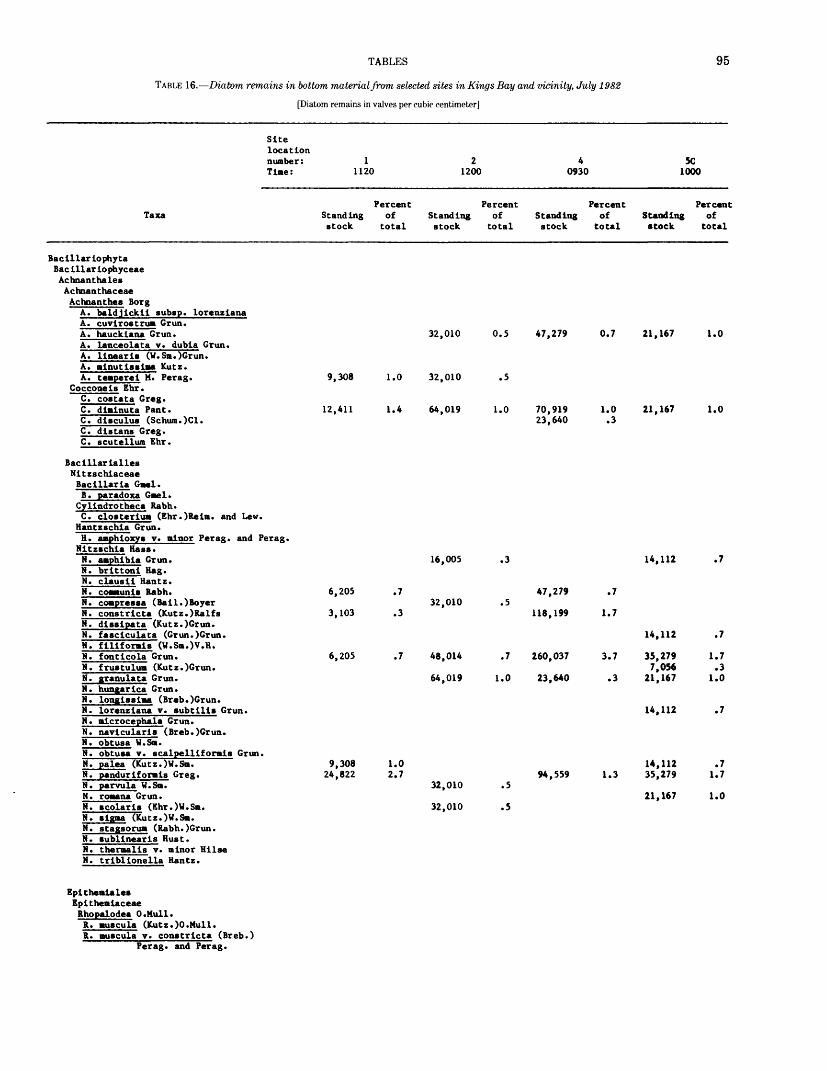
TABLES
TABLE 16. Diatom remains in bottom material from selected sites in Kings Bay and vicinity, July 1982
[Diatom remains in valves per cubic centimeter]
95
Site location number : 1 Time: 1120
Percent Taxa Standing of
stock total
Bacillariophyta Bacillariophyceae Achnanthales Achnanthaceae Achnanthes Borg
A. baldjickii subsp. lorenzianaA. cuvi rostrum Grun.A. hauckiana Grun.A. lanceolata v. dubia Grun.A. linearis (W.Sm.)Grun.A. minutissima Kutz.A. temperei M. Perag. 9,308 1.0
Cocconeis Ehr.C. costata Greg.C. diminuta Pant. 12.411 1.4C. disculus (Schum.)Cl.C. dlstans Greg.C. scutellum Ehr.
Bacillarialles Nitzschiaceae Bacillaria Gmel.B. paradoxa Gmel.
Cylindrotheca Rabh. C. closterium (Ehr.)Relm. and Lew.Hantzschia Grun.H. amphioxys v. minor Perag. and Perag.Hitzschia Hast.N. amphibia Grun.N. brittoni Hag.N. clausii Hantz.N. communiB Rabh. 6,205 .7N. compre«sa (Bail.)BoyerN. constricta (Kutz.)Ralfs 3,103 .3N. dissijgata (Kutz.)Grun.N. fasciculata (Grun.) Grun.N. filiformis (W.Sm.)V.H.N. fonticola Grun. 6,205 .7N. frustulum (Kutz.)Grun.N. granulata Grun.N. hungarica Grun.N. longissiaa (Breb.)Grun.N. lorenziana v. subtilis Grun.N. microcephala Grun.N. navicularis (Breb.)Grun.N. obtusa W.Sm.N. obtusa v. scalpelliformis Grun.M. palea (Kutz.)W.Sm. 9,308 1.0 N. panduriformis Greg. 24,822 2.7N. parvula W.Sm.N. romana Grun.N. scolaris (Ehr.)W.Sm.M. sigma (Kutz.)W.Sm. N. stagsorum (Rabh.)Grun.N. sublinearis Hust.N. thermalis v. minor UilseN. triblionella Hantz.
Epithemlales Epithemiaceae Rhopalodea O.Mull. R. muscula (Kutz.)O.Mull.R. muscula v. constricta (Breb.)
Perag. and Perag.
2 4 5C 1200 0930 1000
Percent Percent Percent Standing of Standing of Standing of stock total stock total stock total
32,010 0.5 47,279 0.7 21,167 1.0
32,010 .5
64,019 1.0 70,919 1.0 21,167 1.0 23,640 .3
16,005 .3 14,112 .7
47,279 .7 32,010 .5
118,199 1.7
14,112 .7
48,014 .7 260,037 3.7 35,279 1.7 7,056 .3
64,019 1.0 23,640 .3 21,167 1.0
14,112 .7
14,112 .7 94,559 1.3 35,279 1.7
32,010 .5 21,167 1.0
32,010 .5
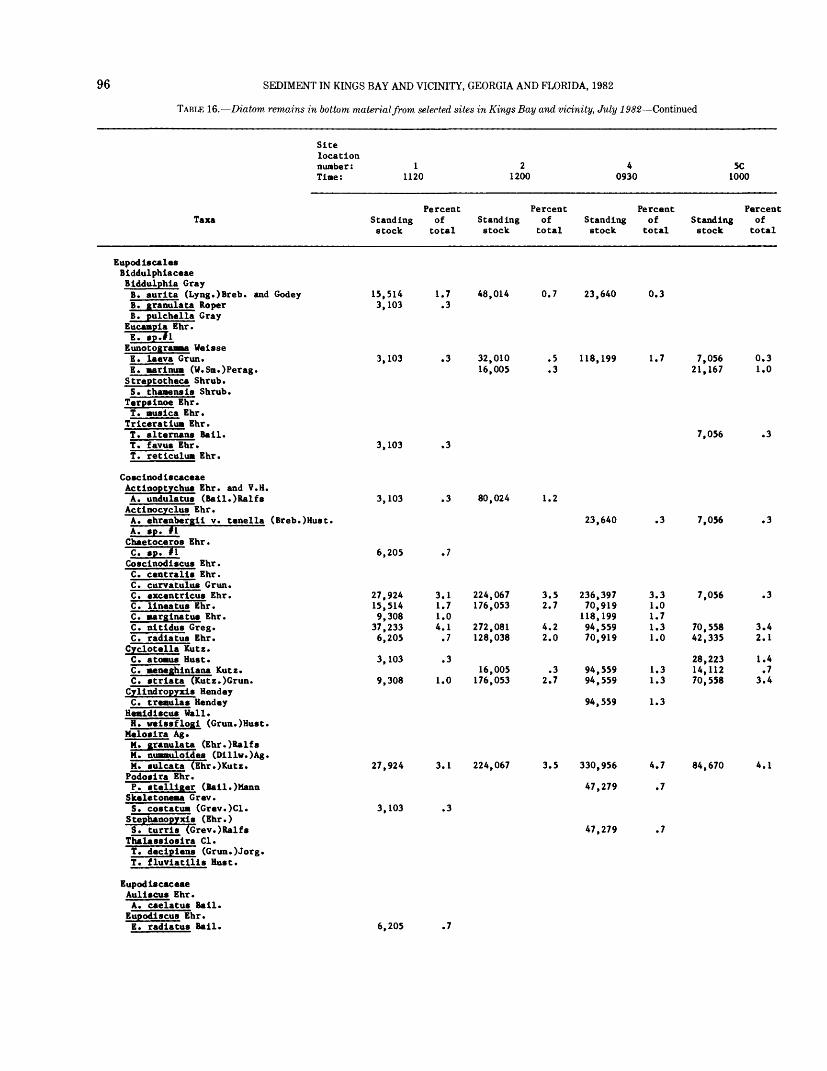
96 SEDIMENT IN KINGS BAY AND VICINITY, GEORGIA AND FLORIDA, 1982
TABLE 16. Diatom remains in bottom material from selected sites in Kings Bay and vicinity, July 1982 Continued
Site location number: 124 Time: 1120 1200 0930
Percent Percent Percent Taxa Standing of Standing of Standing of
stock total stock total stock total
Eupodiccales Blddulphlaceae Blddulphia Gray B. aurlta (Lyng.)Breb. and Godey 15,514 1.7 48,014 0.7 23,640 0.3B. gfanufata Roper 3,103 .3B. pulchella Gray
Eucampla Ehr."TTTpTyiEunocogramaa WelaseE. laeva Grun. 3,103 .3 32,010 .5 118,199 1.7E. marlnum (W.Sm.)Perag. 16.005 .3Streptotheca Shrub. S. thamensls Shrub.
Terp«lnoe Ehr. T. nusica Ehr.
Trlceratlum Ehr.T. alternana Ball.T. favua Ehr. 3,103 .3 T. retlcultui Ehr.
CoBclnodlacaceae Actlnoptychua Ehr. and V.H. A. undulatua (Ball.)Ralfa 3.103 .3 80.024 1.2Actloocyclua Ehr. A. ehrenbergll v. tenella (Breb.)Huat. 23,640 .3A. «p. flChaetoceros Ehr. C. «p. fl 6,205 .7Coscinodiscus Ehr.C. centralls Ehr.C. curvatului Grun.C. excentrlcua Ehr. 27.924 3.1 224,067 3.5 236.397 3.3C. llneatua Ehr. 15.514 1.7 176,053 2.7 70.919 1.0C. aarglnatus Ehr. 9,308 1.0 118,199 1.7C. nltldua Greg. 37.233 4.1 272.081 4.2 94.559 1.3C. radlatua Ehr. 6,205 .7 128,038 2.0 70.919 1.0
Cyclotella Kutz. C. atoms Bust. 3,103 .3C. eneghinlana Kutz. 16.005 .3 94.559 1.3C. t'rlata (Kutz.)Grun. 9.308 1.0 176.053 2.7 94,559 1.3Cyllndropyxl* Hendey C. treaulas Hendey 94,559 1.3
He«idi«cu« Wall.H". welssflogl (Grun.)Hust.
Melo«ira Ag. M. _granulata (Ehr.)RalfsM. nuMmloldes (Dlllw.)Ag.M. culcata <Ehr.)Kutz. 27.924 3.1 224.067 3.5 330.956 4.7Podoclra Ehr. P. telllger (Ball.)Mann 47,279 .7Skeletoneaa Grev. S. co«tatum (Grev.)Cl. 3,103 .3Stephanopyxi« (Ehr.) S. turrli (Grev.)Ralf* 47,279 .7
Thala««lo«lra Cl.T. decipiena (Grun.)Jorg.T. fluvlatlll* Hu«t.
5C 1000
Percent Standing of stock total
7,056 0.3 21,167 1.0
7,056 .3
7,056 .3
7,056 .3
70,558 3.4 42,335 2.1
28,223 1.4 14,112 .7 70,558 3.4
84,670 4.1
Eupodlscaceae Aull«cu« Ehr.
A. caelatu* Ball. Eupodlacua Ehr.
E. radlatua Ball. 6,205 .7
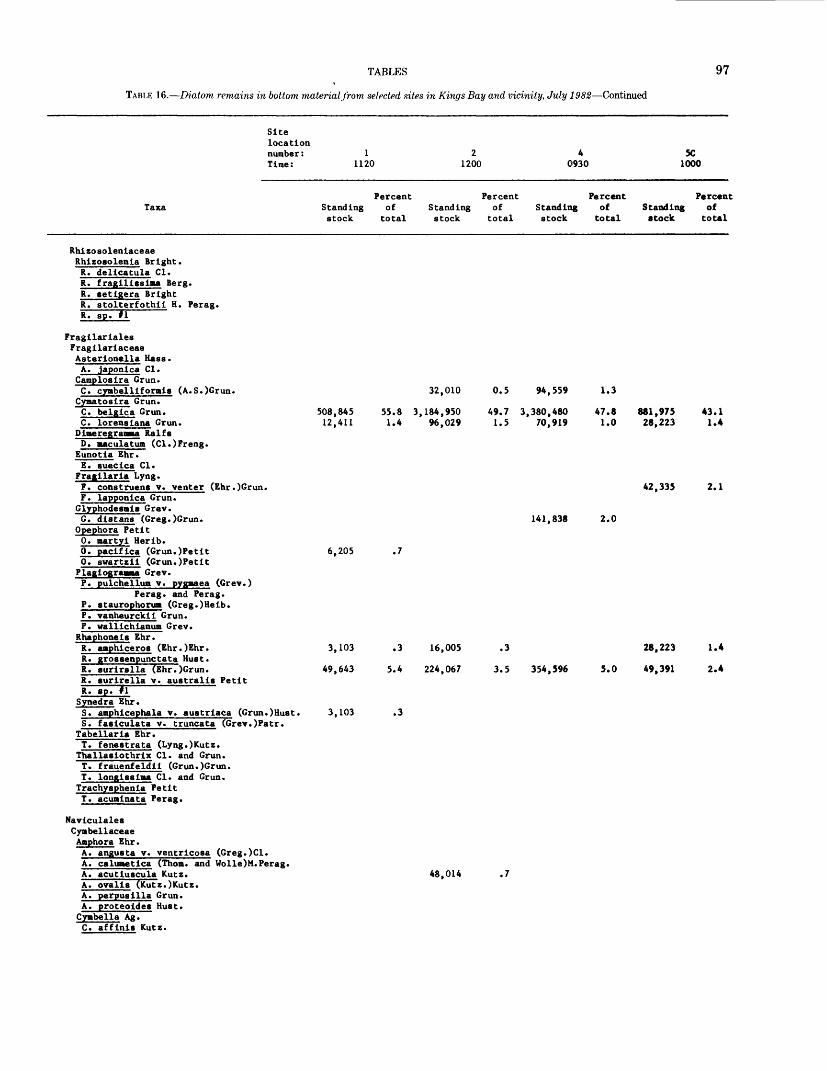
TABLES 97
TABLE 16. Diatom remains in bottom material from selected sites in Kings Bay and vicinity, July 1982 Continued
Sitelocationnumber: 1 2 4 5CTime: 1120 1200 0930 1000
Percent Percent Percent PercentTaxa Standing of Standing of Standing of Standing of
stock total stock total stock total stock total
Rhlzosolenlaceae Rhizoeolenla Bright.
R. dellcatula Cl. R. fraglllsslma Berg. R. setlgera Bright R. stolterfothll H. Perag. R. sp. *\
Fragllarlales Fragllarlaceae Asterlonella Hass.
A. japonlca Cl. CamplosIra Grun.
C. cymbelllformls (A.S.)Grun. 32,010 0.5 94,559 1.3 Cymatoslra Grun.
C. belglca Grun. 508,845 55.8 3,184,950 49.7 3,380,480 47.8 881,975 43.1C. lorenslana Grun. 12,411 1.4 96,029 1.5 70,919 1.0 28,223 1.4
Dlmeregraiama RalfsD. maculaturn (Cl.)Freng.
Eunotla Ehr.E. sueclca Cl.
Fragilaria Lyng.F. construens v. venter (Ehr.)Grun. 42,335 2.1F. lapponica Grun. Glyphodesale Grev.G. dlstans (Greg.)Grun. 141,838 2.0
Opephora Petit0. martyi Herlb.0. pacifica (Grun.)Petlt 6,205 .70. swartzii (Grun.)Petlt
Plagiograaaa Grev.P. pulchellum v. pygmaea (Grev.)
Perag. and Perag.P. staurophorum (Greg.)Helb.P. vanheurckll Grun.P. wallichianum Grev.
Rhaphonels Ehr.R. amphiceros (Ehr.)Ehr. 3,103 .3 16,005 .3 28,223 1.4R. grossenpunctata Must.R. surlralla (Ehr.)Grun. 49,643 5.4 224,067 3.5 354,596 5.0 49,391 2.4R. surirella v. australls PetitR. gp. fl
Synedra Ehr.S. aaphicephala v. austrlaca (Grun.)Hust. 3,103 .3S. faslculata v. truncata (Grev.)Patr.
Tabellaria Ehr.T. fenestrata (Lyng.)Kutz. Thallasiothrlx Cl. and Grun.T. frauenfeldll (Grun.)Grun.T. long!salma Cl. and Grun. Trachysphenla PetitT. acumlnata Perag.
Navlculales Cymbellaceae Amphora Ehr.A. anguata v. ventricosa (Greg.)Cl.A. caluaetica (Thorn, and Wolle)M.Perag.A. acutluscula Kutz. 48,014 .7A. ovalis (Kutz.)Kutz.A. perpusilia Grun.A. proteoldes Must. Cyabella Ag.C. afflnis Kutz.
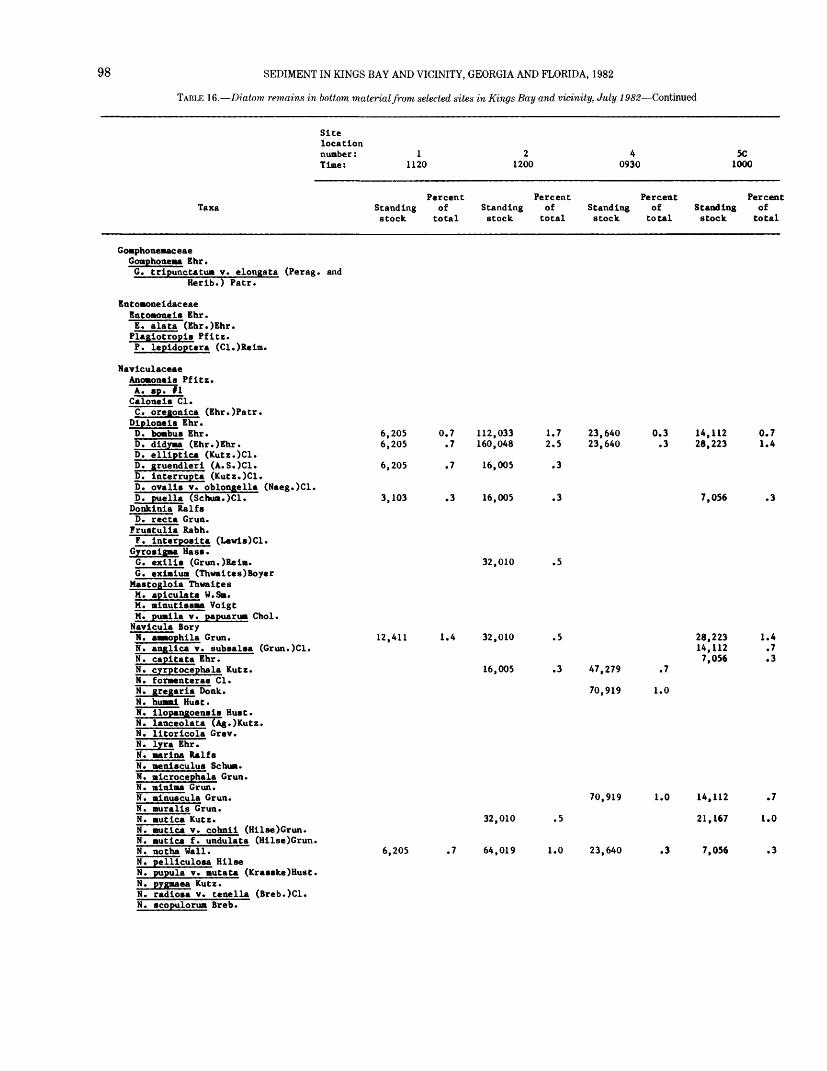
98 SEDIMENT IN KINGS BAY AND VICINITY, GEORGIA AND FLORIDA, 1982
TABLE 16. Diatom remains in bottom material from selected sites in Kings Bay and vicinity, July 1982 Continued
Sitelocation number: Time:
11120
21200
40930
5C 1000
TaxaPercent
Standing of stock total
PercentStanding of stock total
Percent Standing of stock total
PercentStanding of stock total
Goaphoneaaceae Goaphoneaa Ehr. G. tripunctatua v. elongata (Perag. and
Herib.) Patr.
Entoaoneidaceae EntoaoneJB Ehr.E. alata (Ehr.)Ehr. PlagiotropJB Pfitz.P. lepidoptera (Cl.)Reim.
NaviculaceaeAnoaoncU Pfitz.A. p.Tl Calonei* Cl.C. oregonica (Ehr.)Patr.
Diploneis Ehr.D. boabus Ehr.D. didyma (Ehr.)Ehr.D. elliptica (Kutz.)Cl.D. gruendleri (A.S.)Cl.D. interrupta (Kutz.)Cl.D. ovaliB v. oblongella (Naeg.)Cl.D. puella (Schua.)ClT Donkinia RalfsD. recta Grun.
Fruatulia Rabh.F. interpoBita (Lewiv)Cl.
Gyroaigaa Has*.G. exilU (Grun.)Reia.G. exijiiuB (Thwaites)Boyer
Maatogloia ThwaitesM. apiculata W.Sm.M. ainutlBBBa VoigtM. puBJla v. papuarum Chol. Havicula BoryN. aBBOphila Grun.H. anglica v. subaalaa (Grun.)Cl.H. capitata Ehr.H. cyrptocephala Kutz.N. foraenterae Cl.H. gregaria Donk.H. huaBi Hu»t.N. ilopangoen»i» Hu«t.H. lanceolata (Ag.)Kutz.H. litoricola Grev.H. lyra Ehr.N. aarina RalfsN. BenisculuB Schua.N. aicrocephala Grun.N. ainiaa Grun.H. ainuscula Grun.H. auralis Grun.H. autica Kutz.H. autica v. cohnii (Hilse)Grun.H. autlca f. undulata (Hilse)Grun.H. notha Wall.H. pelliculosa HilseH. pupula v. autata (Kra««ke)Hust.H. pygaaea Kutz.H. radiosa v. tenella (Breb.)Cl.H. copulorua Breb.
6,2056,205
6,205
3,103
0.7 .7
.7
.3
12,411 1.4
112,033160,048
16,005
16,005
32,010
32,010
16,005
1.7 2.5
.3
.3
.5
23,64023,640
0.3 .3
14,11228,223
7,056
.5
.3 47,279
70,919
.7
1.0
70,919
32,010 .5
6,205 .7 64,019 1.0 23,640 .3 7,056
0.7 1.4
.3
28,223 1.414,112 .77,056 .3
1.0 14,112 .7
21,167 1.0
.3

TABLES 99
TABLE 16. Diatom remains in bottom material from selected sites in Kings Bay and vicinity, July 1982 Continued
Sitelocationnumber: 1 2 4 5CTine: 1120 1200 0930 1000
Percent Percent Percent PercentTaxa Standing of Standing of Standing of Standing of
stock total stock total stock total stock total
Maviculaceae Continued Navicula Bory Continued
N. sovereignae Hust.N. tenelloides Hust. 48,014 0.7 35,279 1.7 N. tripuctata (O.Mull.)Bory N. yarrenais Grun.
Pinnularia Ehr. P. bogotensis (Grun.)Cl.
P eurosigaa W.Sm.
quadratacea v. fluminensis (Grun.)Cl.subcapitata Greg.
angulatum (Quek.)W.Sn. 3,103 0.3aestuaril (Breb.)W.Sm.delicatulum W.Sm.haauliferua Brun.naviculaceum Breb.salinarum (Grun. )Grun.
P. speciosun W.Sm. Scoliopleura Grun.S. peisonis Grun.
Stauroneis Ehr.S. amphioxys Greg.
Trachyneis Cl.T. aspera (Ehr.)Cl.
Surirellalles Surirellaceae Camplodiscus Ehr.C. biro«tratu« Deby. Surirella Turpin
S. ovata Kutz.
Unknown taxa Unknown 18
Totals, in valves per cubic centimeter 912,197 100.0 6,401,950 100.0 7,068,300 100.0 2,046,190 100.0
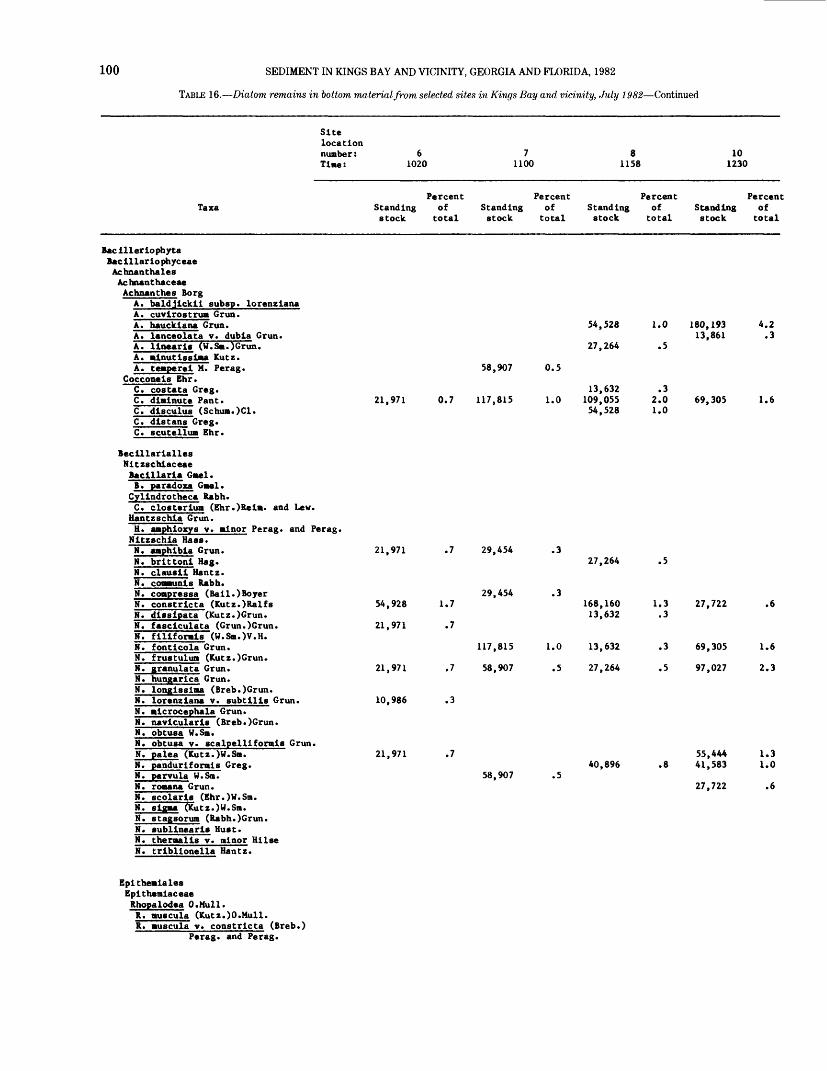
100 SEDIMENT IN KINGS BAY AND VICINITY, GEORGIA AND FLORIDA, 1982
TABLE 16. Diatom remains in bottom material from selected sites in Kings Bay and vicinity, July 1982 Continued
Site location number : 6 Time: 1020
Percent Taxa Standing of
stock total
B*c lllerlophyta Baclllariophyceae Achnanthales Achnanthaceae Achnanthes Borg
A. baldjickil subsp. lorenzlanaA. cuvirostrum Grun.A. hauckiana Grun.A. lanceolata v. dubla Grun.A. linear!* (W.Sm.)Grun.A. minutissima Kutz.A. teaperei M. Perag.
Cocconeis Ehr.C. costata Greg.C. diminute Pant. 21,971 0.7C. dlsculus (Schum.)Cl.C. distans Greg.C. scutellum Ehr.
Beclllarlalles Nltzschiaceae Bacillaria Gael.B . paradox* Gael .
Cylindrotheca Rabh. C. clocterlum (Ehr.)Reim. and Lew.Hantzschia Grun.H. amphioxys v. minor Perag. and Perag.Nltzcchla Macs.N. amphibia Grun. 21,971 .7N. brittonl Hag.N. claucli Hantz.N. communis Rabh.N. comgressa (Bail.)BoyerN. constricta (Kutz.)Ralfs 54,928 1.7N. dissipate (Kutz.)Grun.N. fasclculata (Grun.)Grun. 21,971 .7N. flllformls (W.Sm.)V.H.N. fonticola Grun.N. fructulum (Kutz.) Grun.N. granulate Grun. 21,971 .7N. hungarica Grun.N. long iss ima (Breb.)Grun.N. lorenzlana v. subtilis Grun. 10,986 .3N. microcej>hala Grun.N. navlcularls (Breb.)Grun.N. obtusa U.Sm.N. obtusa v. scalpelllformis Grun.N. palea (Kutz.)U.Sm. 21,971 .7 N. panduriformis Greg.N. parvula W.Sm.N. romana Grun.N. scolarlc (Ehr.)W.Sm.N. slgma ([Kutz.)W.Sm. N. sta^sprum (Rabh.)Grun.N. subllnearlc Huct.N. thermalls v. minor HilseN. trlbllonella Hantz.
Epithemiales Eplthemiaceae Rhopalodea O.Mull. R. muscula (Kutz. )0. Mull.R. muscula v. constricta (Breb.)
Perag. and Perag.
7 8 10 1100 1158 1230
Percent Percent Percent Standing of Standing of Standing of stock total stock total stock total
54,528 1.0 180,193 4.2 13,861 .3
27,264 .5
58,907 0.5
13,632 .3 117,815 1.0 109,055 2.0 69,305 1.6
54,528 1.0
29,454 .3 27,264 .5
29,454 .3 168,160 1.3 27,722 .6 13,632 .3
117,815 1.0 13,632 .3 69,305 1.6
58,907 .5 27,264 .5 97,027 2.3
55,444 1.3 40,896 .8 41,583 1.0
58,907 .5 27,722 .6
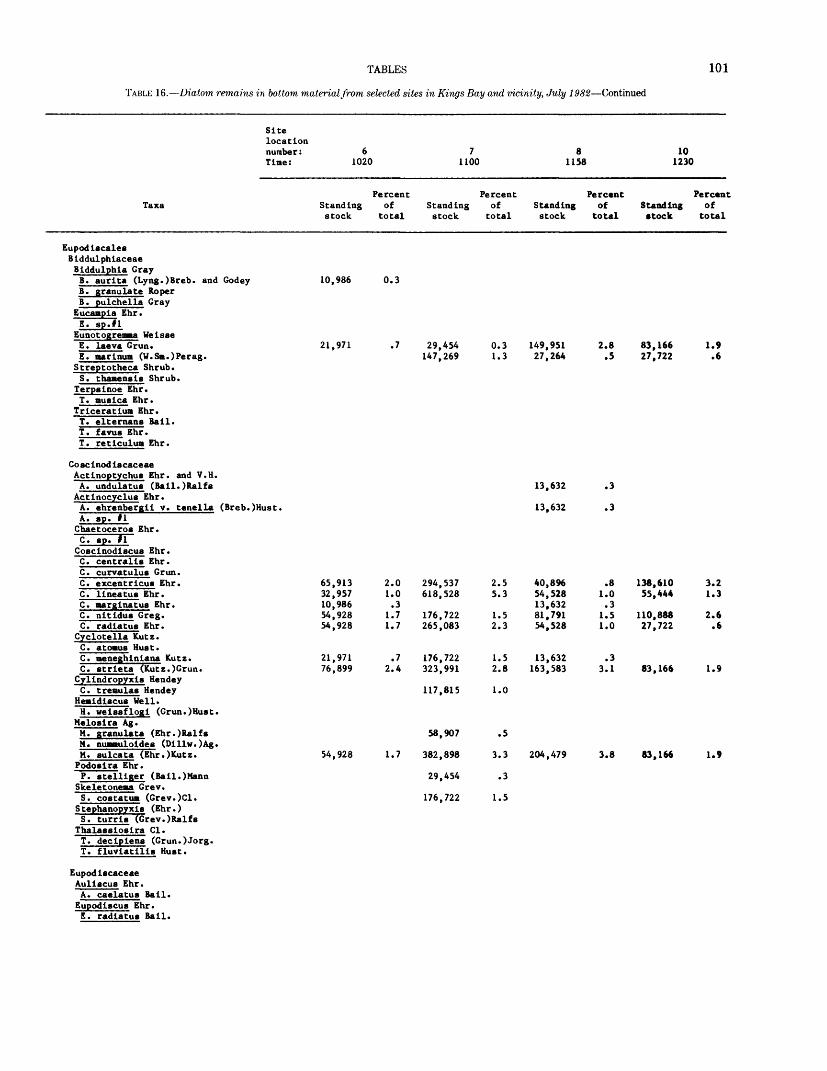
TABLES
TABLE 16. Diatom remains in bottom material from selected sites in Kings Bay and vicinity, July 1982 Continued
101
Site location number : 6 Time: 1020
Percent Taxa Standing of
stock total
Eupodiscales Biddulphiaceae Biddulphia Gray B. aurita (Lyng.)Breb. and Godey 10,986 0.3B. granulate RoperB. pulchella Gray
Eucaapia Ehr.
EunotqgreoBa WeisseE. laeva Grun. 21,971 .7E. narinum (W.Sn.)Perag.Streptotheca Shrub. S. thaoensis Shrub.Terpsinoe Ehr. T. ausica Ehr.
Triceratium Ehr.T. elteraans Bail.T. favus Ehr.T. reticulum Ehr.
Co sc inod is caceae Actinoptychus Ehr. and V.H. A. undulatus (Bail.)Ralfs
Actinocyclus Ehr. A. ehrenbergii v. tenella (Breb.)Hust.A. sp. #1Chaetoceros Ehr.C. sp. 1*1Coscinodiscus Ehr.C. centralis Ehr.C. curvatulus Grun.C. excentricus Ehr. 65,913 2.0C. lineatus Ehr. 32,957 1.0C. narginatus Ehr. 10,986 .3C. nitidus Greg. 54,928 1.7C. radiatus Ehr. 54,928 1.7
Cyclotella Kutz. C. atoaus Hust.C. neneghiniana Kutz. 21,971 .7C. strieta (Kutz.)Grun. 76,899 2.4
Cylindropyxis Hendey C. tremulas Hendey
Heaidiscus Well.H. uei'ssflogi (Grun.)Hust.
Melosira Ag.M. £ranulata (Ehr.)RalfsM. numouloides (Dillw.)Ag.M. sulcata (Ehr.)Kutz. 54,928 1.7Podosira Ehr.P. stelliger (Bail.)MannSkeletonema Grev.S. costatum (Grev.)Cl.
S tephanopyxis (Ehr.) S. turris (Grev.)Ralfs
Thalassiosira Cl.T. dec Ip lens (Grun.)Jorg.T. fluviatilis Hust.
7 8 10 1100 1158 1230
Percent Percent Percent Standing of Standing of Standing of stock total stock total stock total
29,454 0.3 149,951 2.8 83,166 1.9 147,269 1.3 27,264 .5 27,722 .6
13,632 .3
13,632 .3
294,537 2.5 40,8% .8 138,610 3.2 618,528 5.3 54,528 1.0 55,444 1.3
13,632 .3 176,722 1.5 81,791 1.5 110,888 2.6 265,083 2.3 54,528 1.0 27,722 .6
176,722 1.5 13,632 .3 323,991 2.8 163,583 3.1 83,166 1.9
117,815 1.0
58,907 .5
382,898 3.3 204,479 3.8 83,166 1.9
29,454 .3
176,722 1.5
Eupodiscaceae Auliscus Ehr.A. caelatus Bail. Eupodiscus Ehr.E. radiatus Bail.
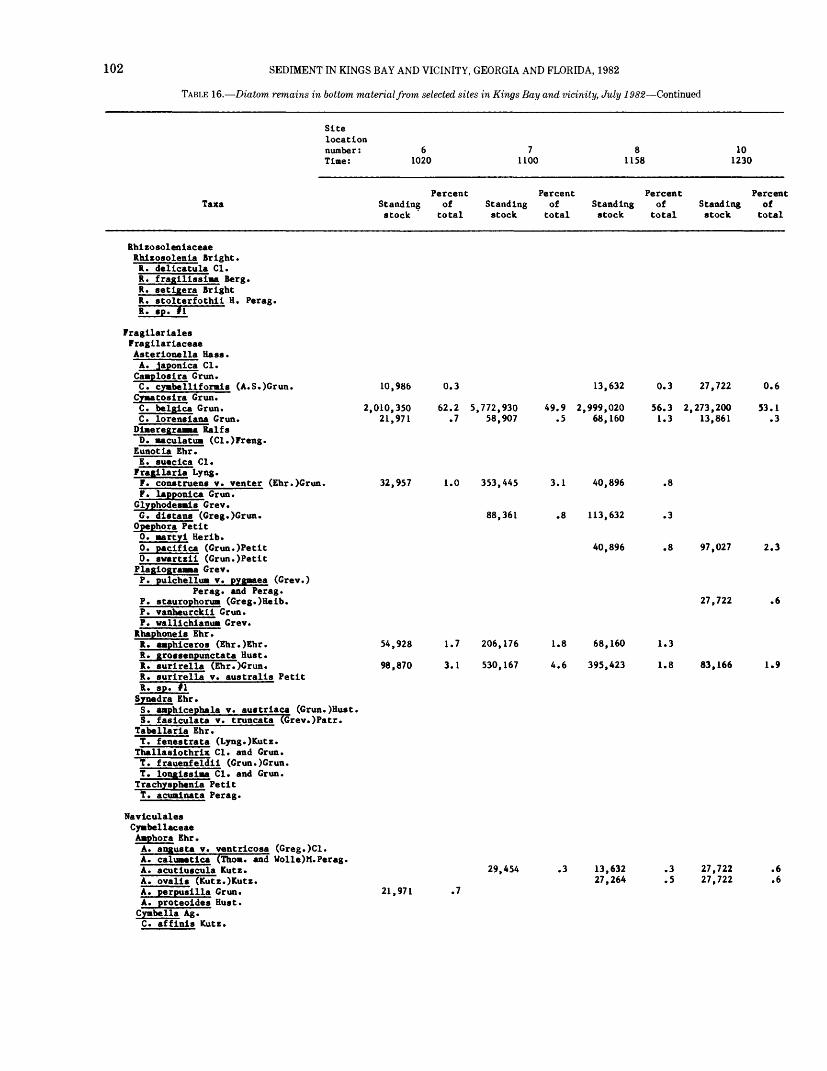
102 SEDIMENT IN KINGS BAY AND VICINITY, GEORGIA AND FLORIDA, 1982
TABLE 16. Diatom remains in bottom material from selected sites in Kings Bay and vicinity, July 1982 Continued
Sitelocationnumber: 6 7 8 10Time: 1020 1100 1158 1230
Percent Percent Percent PercentTaxa Standing of Standing of Standing of Standing of
stock total stock total stock total stock total
Rhizosoleniaceae Rhizosolenia Bright.
R. delicatula Cl. R. fragilissima Berg. R. aetigera Bright R. stolterfothli H. Perag. R. »p. tl
Fragilariales Fragilariaceae Asterlonella Hass.
A. Japonlca Cl. Camplo»ira Grun.C. cyabelliformi» (A.S.)Grun. 10,986 0.3 13,632 0.3 27,722 0.6
Cymatosira Grun.C. belglca Grun. 2,010,350 62.2 5,772,930 49.9 2,999,020 56.3 2,273,200 53.1C. lorenalaaa Grun. 21,971 .7 58,907 .5 68,160 1.3 13,861 .3
Dimeregraaaa RalfsD. maculatim (Cl.)Freng.
Eunotia Ehr.E. »uecica Cl.
Fragilaria Lyng.F. con«truen» v. venter (Ehr.)Grun. 32,957 1.0 353,445 3.1 40,896 .8F. lapponica Grun.
Glyphodesmi» Grev.G. di«tan» (Greg.)Grun. 88,361 .8 113,632 .3
Opephora Petit0. martyi Herib.0. pacifica (Grun.)Petit 40,896 .8 97,027 2.30. »wartxii (Grun.)Petit
Plagiograaaa Grev.P. pulchellua v. pygaaea (Grev.)
Perag. and Perag.P. staurophonat (Greg.)Ueib. 27,722 .6P. vanheurckil Grun.P. walllchlanua Grev.
Rhaphonei» Ehr.R. Mphlceros (Ehr.)Ehr. 54,928 1.7 206,176 1.8 68,160 1.3R. gro»»enpunctata Bust.R. gurirella (Ehr.)Grun. 98,870 3.1 530,167 4.6 395,423 1.8 83,166 1.9R. turirella v. australis PetitR. sp. fl'
Synedra Ehr.S. aaphicephala v. auatrlaca (Grun.)Hust.S. faslculata v. truncata flSrev.)Patr.
Tabellarla Ehr.T. fenestrata (Lyng.)Kutz. Thallasiothrix Cl. and Grun.T. frauenfeldll (Grun.)Grun.T. longiasima Cl. and Grun. Trachysphenla PetitT. acuainata Perag.
Navlculales Cymbellaceae Aaphora Ehr.A. angmta v. ventrlcosa (Greg.)Cl. A. caluaetica (Thorn, and Wolle)M.Perag.A. acutluȣula Kutz. 29,454 .3 13,632 .3 27,722 .6 A. ovalls (Kutz.)Kutz. 27,264 .5 27,722 .6 A. perpusllla Grun. 21,971 .7 A. proteoldes Bust. Cyabella Ag. C. affinis Kutz.
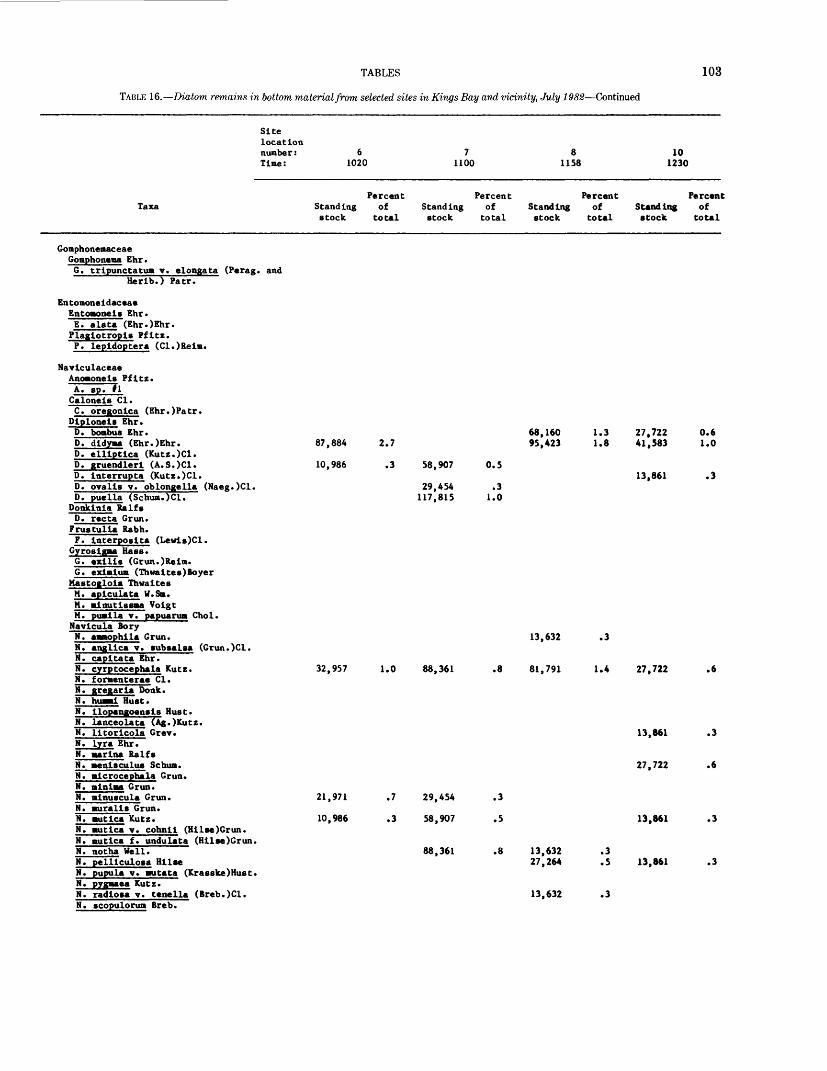
TABLES 103
TABLE 16. Diatom remains in bottom material from selected sites in Kings Bay and vicinity, July 1982 Continued
Sitelocationnumber: 6 7 8 10Time: 1020 1100 1158 1230
Percent Percent Percent PercentTaxa Standing of Standing of Standing of Standing of
stock total stock total stock total stock total
Gomphoneoaceae Gomphonema Ehr.
G. trlpunctatum v. elongata (Perag. and Herlb.) Patr.
Entomoneldaceae Entomonels Ehr.
E. alata (Ehr.)Ehr. Plaglotropls Pfltz.P. lepldoptera (Cl.)Relm.
NavlculaceaeAnoaonels Pfltz.
A. spTTl Calonets Cl.
C. oregonlca (Ehr.)Patr. Dlplonels Ehr.
D. bottbua Ehr. 68,160 1.3 27,722 0.6D. dldyma (Ehr.)Ehr. 87,884 2.7 95,423 1.8 41,583 1.0D. elllptlca (Kutz.)Cl.D. gruendlerl (A.S.)Cl. 10,986 .3 58,907 0.5D. Interrupta (Kutz.)Cl. 13,861 .3D. ovalls v. oblongella (Naeg.)Cl. 29,454 .3D. puella (Schum.)Cl. 117,815 1.0
Donklnla RalfsD. recta Grun. Frustulla Rabh.F. Interposlta (Levis)Cl.
GyrosIgma Hass.G. exllls (Grun.)Relm.G. ezlmlum (Thwaltes)Boyer
Mastoglola ThwaltesM. aplculata W.Sm.M. mlnutlssma VolgtM. pumila v. papuarum Chol. Navlcula BoryN. ammophlla Grun. 13,632 .3N. angllca v. subaalsa (Grun.)Cl.N. capitata Ehr.N. cyrptocephala Kutz. 32,957 1.0 88,361 .8 81,791 1.4 27,722 .6N. formenterae Cl.H. gregaria Donk.N. humml Rust.M. llopangoenals Rust.NTlanceolata (Ag.)Kutz.N. lltorlcola Grev. 13,861 .3N. lyra Ehr.N. marina RalfsS. menlsculua Schum. 27,722 .6N. Icrocephala Grun.N. minima Grun.N. inuscula Grun. 21,971 .7 29,454 .3N. muralls Grun.N. mutlca Kutz. 10,986 .3 58,907 .5 13,861 .3S. mutlca v. cohnll (Hllse)Grun.N. mutlca f. undulata (Hllse)Grun.N. notha Well. 88,361 .8 13,632 .3N. pelllculosa Rllse 27,264 .5 13,861 .3N. pupula v. mutata (Krasske)Hust.N. pygmaea Kutz.N. radlosa v. tenella (Breb.)Cl. 13,632 .3N. scopulorum Breb.
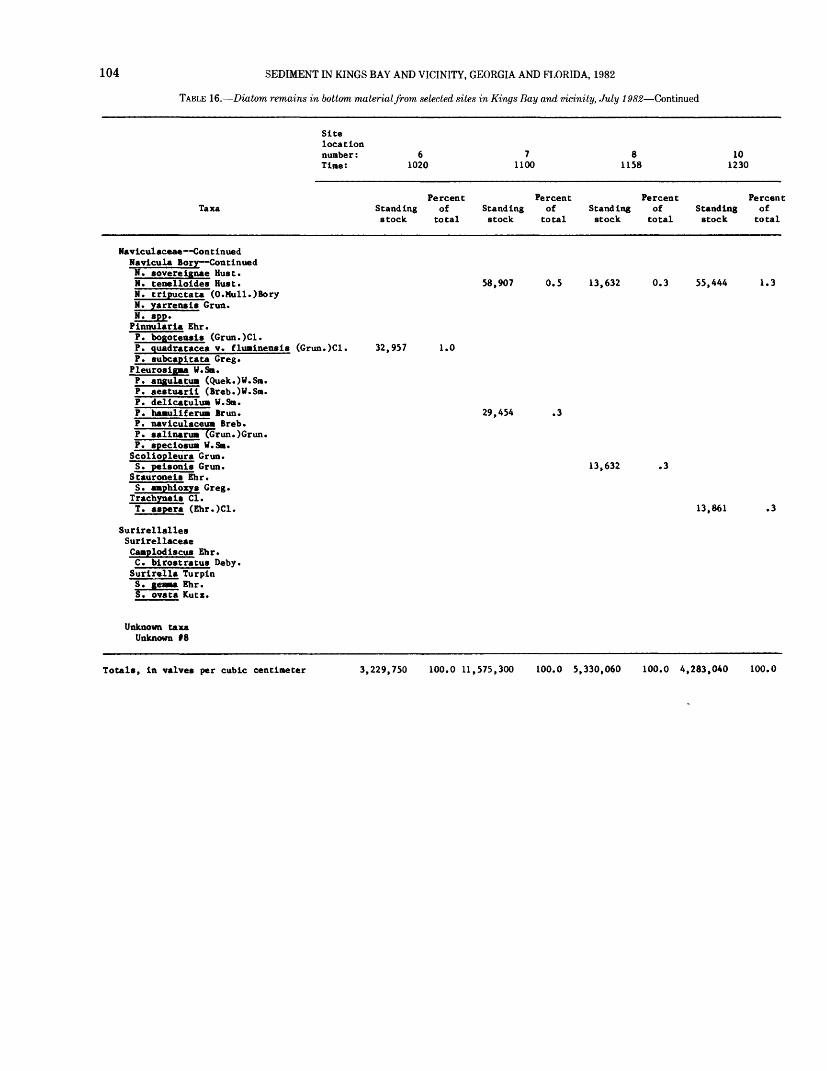
104 SEDIMENT IN KINGS BAY AND VICINITY, GEORGIA AND FLORIDA, 1982
TABLE 16. Diatom remains in bottom material from selected sites in Kings Bay and vicinity, July 1982 Continued
Sitelocationnumber: 6 7 8 10Time: 1020 1100 1158 1230
Percent Percent Percent PercentTaxa Standing of Standing of Standing of Standing of
stock total stock total stock total stock total
Naviculaceae Continued Havicula Bory -Continued
N. severeignae Hust.N. tenelloldes Hu«t. 58,907 0.5 13,632 0.3 55,444 1.3H. tripuctata (O.Mull.)BoryH. yarrensls Grun.H. «pp.
Plnnularla Ehr.P. bogoten«l« (Grun.)Cl.P. quadratacea v. fluainensls (Grun.)Cl. 32,957 1.0P. subcapitata Greg. Pleuroslgaa W.Sm.P. angulatum (Quek.)W.Sm.P. aestuarii (Breb.)W.Sm.P. delicatulua W.S«.P. hamullferum Brun. 29,454 .3P. navlculaceua Breb.P. «a Una rum (Grun.)Grun.P. «pecio«ua W.Sm. Scoliopleura Grun.S. pel«onl« Grun. 13,632 .3
Stauroneis Ehr.S. a»phlozy« Greg.
Trachyneli Cl.T. a«pera (Ehr.)Cl. 13,861 .3
Surirellalles Surirellaceae Camplodl«cu« Ehr. C. birostratus Deby. Surirella Turpln
S. ovata Kutz.
Unknown taxa Unknown 18
Totals, in valves per cubic centimeter 3,229,750 100.0 11,575,300 100.0 5,330,060 100.0 4,283,040 100.0

TABLES
TABLE 16. Diatom remains in bottom material from selected sites in Kings Bay and vicinity, July 1982 Continued
105
Site location number: 13 Time: 1340
Percent Taxa Standing of
stock total
Baclllarlophyta Baclllarlophyceae Achnanthales Achnanthaceae Achnanthes Borg
A. baldjickii subsp. lorenzlanaA. cuvlrostrum Grun.A. hauckiana Grun.A. lanceolata v. dubla Grun.A. linear Is (W.Sm.)Grun.A. alnutlsslaa Kutz.A. teaperel M. Perag. 78,119 0.9
Cocconels Ehr.C. costata Greg.C. dlmlnuta Pant. 39,060 .4C. dlsculus (Schum.)Cl.C. dlstans Greg.C. scutellum Ehr.
Baclllarlalles Nltzschlaceae Baclllarla Gael.B. paradox* Gael.
Cyllndrotheca Rabh. C. closterlum (Ehr.)Relm. and Lew.Hantzschla Grun.H. amphloxys v. minor Perag. and Perag.
Nitzschia Has s.N. amphibia Grun.N. brlttonl Hag. 39,060 .4N. clausll Hantz.N. coaaunls Rabh.N. coapressa (Ball.)Boyer 156,238 1.8N. constrlcta (Kutz.)Ralfs 78,119 .9N. dlsslpata (Kutz.)Grun. 156,238 1.8N. fasclculata (Grun.)Grun.N. flllf orals (W.Sn.)V.H.N. fontlcola Grun.N. frustulum (Kutz.)Grun.N. granulata Grun. 195,298 2.2N. hun&arica Grun.N. longlsslaa (Breb.)Grun.N. lorenzlana v. subtllls Grun.N. mlcrocephala Grun.N. navicularis (Brab.)Grun. 39,060 .4N. obtusa W.Sm.N. obtusa v. »calpelliformi8 Grun.N. palea (Kutz.)W.Sm. 78,119 .9 N. pandurlf orals Greg. 117,179 1.3N. parvula W.Sm.N. romana Grun. 39,060 .4N. scolarls (Ehr.)W.Sa.N. «igaa (Kutz.) W.Sm. N. stagsorum (Rabh.)Grun.N. subllnearls Bust.N. theraalls v. minor Hllse 39,060 .4N. trlbllonella Hantz.
Eplthealales Eplthemlaceae Rhopalodea O.Hull. R. muscula (Kutz.)O.Mull.R. muscula v. constrlcta (Breb.)
Perag. and Perag.
14 15 16 1355 1415 1430
Percent Percent Percent Standing of Standing of Standing of stock total stock total stock total
23,555 0.3 62,029 1.0 101,380 5.1
23,555 .3 23,555 .3 20,676 .3
41,353 .6
6,336 .3
20,676 .3
47,110 .6 12,673 .6 23,555 .3
70,665 .9 82,705 1.3 23,555 .3 41,353 .6 44,354 2.2 70,665 .9 12,673 .6
6,336 .3 94,220 1.2 20,676 .3 19,009 .9
41,353 .6 235,551 3.0 268,792 4.1 88,708 4.4
20,676 .3 12,673 .6
23,555 .3 47,110 .6 70,665 .9 62,029 1.0 19,009 .9 47,110 .6
70,665 .9 20,676 .3
20,676 .3 6,336 .3
23,555 .3 23,555 .3 62,029 1.0
62,029 1.0
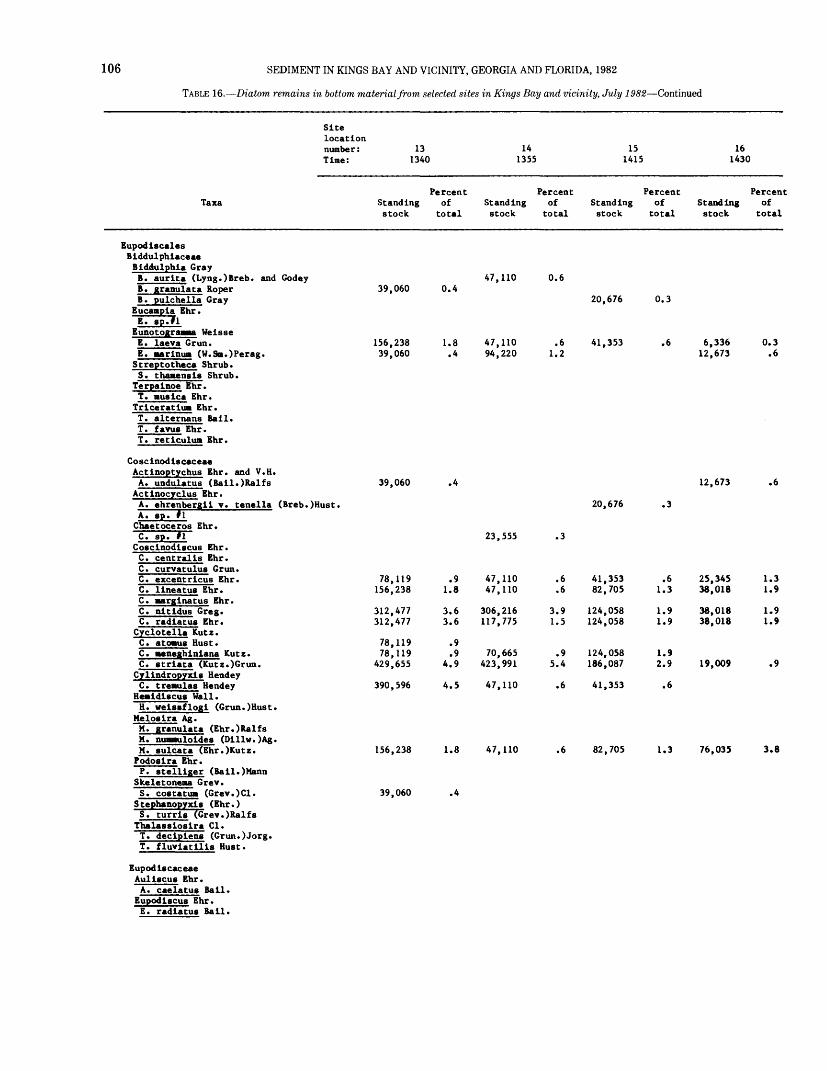
106 SEDIMENT IN KINGS BAY AND VICINITY, GEORGIA AND FLORIDA, 1982
TABLE 16. Diatom remains in bottom material from selected sites in Kings Bay and vicinity, July 1982 Continued
Sitelocation number: Time:
131340
141355
151415
161430
TaxaPercent
Standing of stock total
PercentStanding of stock total
Percent Standing of stock total
PercentStanding of stock total
Eupodiscales Blddulphlaceae Biddulphia Gray B. aurita (Lyng.)Breb. B. granulata Roper B. pulchella Gray
Eucampia Ehr.
Eunotograaaa WeisseE. laeva Grun.E. marinum (W.Sm.)Perag. Streptotheca Shrub.S. thaaenglg Shrub.
Terpalnoe Ehr.T. ugica Ehr. Trlceratlua Ehr.
and Godey39,060
156,23839,060
II. T.
alternans Ball, favug Ehr.
T. reticulum Ehr.
Cosclnodiscaceae Actinoptychus Ehr. and V.H.A. undulatus (Ball.)Ralfs
Actinocyclus Ehr.A. ehrenbergii v. tenella (Breb.)Hust.A. gp. fl Chaetoceros Ehr.C. sp.TT
Cogclnodlgcus Ehr.C. centralis Ehr.C. curvatulug Grun.C. excentricus Ehr.C. llneatug Ehr.C. marginatus Ehr.C. nitidus Greg.C. radiatug Ehr.
Cyclotella Kutz.C. atoaus Hust.C. aeneghlnlana Kutz.C. gtrlata (Kutz.)Grun.
Cyllndropyxig HendeyC. treaulag Hendey
Heaidiscus Wall.H. welggflogl (Grun.)Hust.
Melosira Ag.M. granulata (Ehr.)RalfsM. nuaauloides (Dlllw.)Ag.M. gulcata (Ehr.)Kutz. Podosira Ehr.P. gtelllger (Bail.)Mann
Skeletonema Grev.S. costatun (Grev.)Cl.
Stephanopyxis (Ehr.)S. turrlg (Grev.)Ralfg
Thalaggloglra Cl.T. decipieng (Grun.)Jorg.T. fluviatilig Hugt.
Eupodlgcaceae Auligcug Ehr.A. caelatug Ball.
Eupodigcug Ehr.E. radiatug Ball.
39,060
78,119156,238
312,477312,477
78,11978,119
429,655
390,596
156,238
39,060
0.4
1.8 .4
.4
.9 1.8
3.6 3.6
.9
.94.9
4.5
1.8
.4
47,110
47,11094,220
23,555
47,11047,110
306,216117,775
70,665423,991
47,110
47,110
0.6
.6 1.2
.3
.6
.6
3.91.5
.95.4
.6
.6
20,676 0.3
41,353 .6
20,676
41,35382,705
124,058124,058
124,058186,087
41,353
82,705
.3
.6 1.3
1.9 1.9
1.9 2.9
.6
1.3
6,33612,673
0.3 .6
12,673 .6
25,34538,018
38,01838,018
19,009
1.3 1.9
1.9 1.9
.9
76,035 3.8
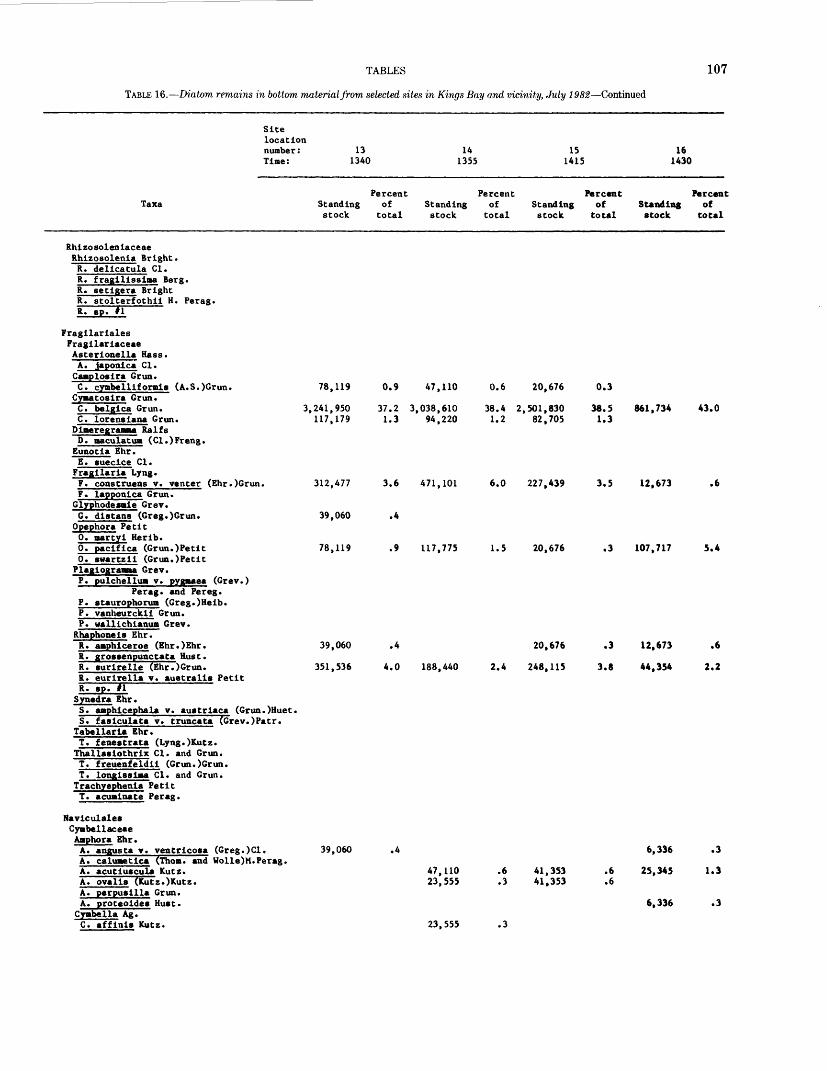
TABLES 107
TABLE 16. Diatom remains in bottom material from selected sites in Kings Bay and vicinity, July 1982 Continued
Sitelocationnumber: 13 14 15 16Time: 1340 1355 1415 1430
Percent Percent Percent PercentTaxa Standing of Standing of Standing of Standing of
stock total stock total stock total stock total
Rhlzosolenlaceae Rhlzosolenia Bright.
R. dellcatula Cl. R. fraglllsslma Berg. R. setigera Bright R. stolterfothll H. Perag. R. 8P . *1
Fragilariales Fragllarlaceae Asterlonella Hass.
A. japonic* Cl. Caaplosira Grvin.C. cymbelliforals (A.S.)Grun. 78,119 0.9 47,110 0.6 20,676 0.3
Cymatoalra Grun.C. belglca Grun. 3,241,950 37.2 3,038,610 38.4 2,501,830 38.5 861,734 43.0C. lorenaiana Grun. 117,179 1.3 94,220 1.2 82,705 1.3
Diaeregramma RalfsD. maculatua (Cl.)Freng.
Eunotla Ehr.E. sueclce Cl.
Fragilarla Lyng.F. construens v. venter (Ehr.)Grun. 312,477 3.6 471,101 6.0 227,439 3.5 12,673 .6F. lapponlca Grun.
Glyphodesmie Grev.G. dlstana (Greg.)Grun. 39,060 .4
Opephora Petit0. aartyl Herlb.0. pacifica (Grun.)Petlt 78,119 .9 117,775 1.5 20,676 .3 107,717 5.40. swartzii (Grun.)Petlt
Plagiogramaa Grev.P. pulchellua v. pygaaea (Grev.)
Perag. and Pereg.P. staurophorua (Greg.)Helb.P. vanheurckli Grun.P. wallichianua Grev.
Rhaphoneis Ehr.R. aaphlceroe (Ehr.)Ehr. 39,060 .4 20,676 .3 12,673 .6R. grossenpunctata Hust.R. surlrelle (Ehr.)Grun. 351,536 4.0 188,440 2.4 248,115 3.8 44,354 2.2R. eurlrella v. auetralls PetitR. sp. If
Synedra Ehr.S. aaphicephala v. austrlaca (Grun.)Huet.S. faslculata v. truncate (Grev.)Patr.
Tabellarla Ehr.T. fenestrata (Lyng.)Kutz. Thallailothrlx Cl. and Grun.T. freuenfeldll (Grun.)Grun.T. longiaslma Cl. and Grun.
Trachyephenla PetitT. acuainate Perag.
Navlculales Cymbellaceae Aaphora Ehr.A. angusta v. ventrlcoia (Greg.)Cl. 39,060 .4 6,336 .3A. caluaetlca (Thorn, and Wolle)M.Perag.A. acutluicula Kutz. 47,110 .6 41,353 .6 25,345 1.3A. ovalli (Kutz.)Kutz. 23,555 .3 41,353 .6A. perpmilla Grun.A. proteoldei Hust. 6,336 .3
Cyabella Ag.C. affinis Kutz. 23,555 .3
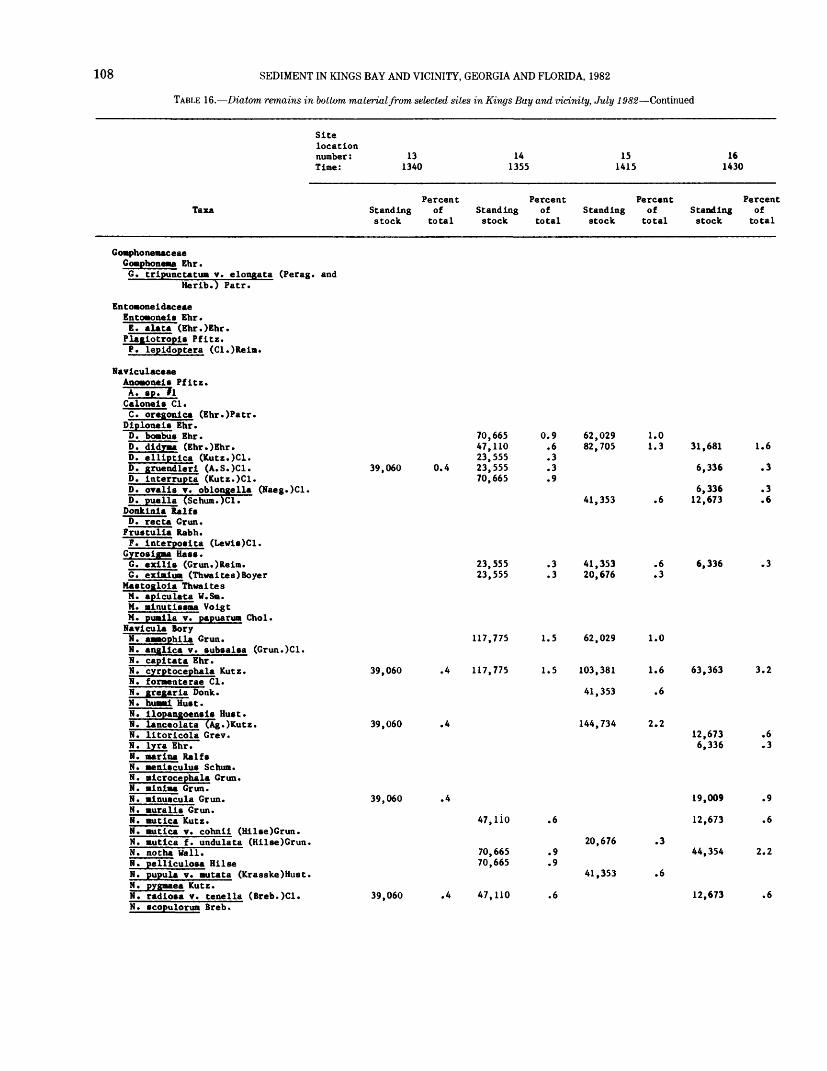
108 SEDIMENT IN KINGS BAY AND VICINITY, GEORGIA AND FLORIDA, 1982
TABLE 16. Diatom remains in bottom material from selected sites in Kings Bay and vicinity, July 1982 Continued
Sitelocation number: Time:
131340
141355
151415
161430
TaxaPercent
Standing of stock total
Percent PercentStanding of Standing ofstock total stock total
PercentStanding of stock total
Goaphoneaac eae Goaphoneaa Ehr. G. tripunctatua v.
Herib.) Patr.
Entoaoneidaceae Entoaonei« Ehr.E. alata (Ehr.)Ehr. Plagiotropis Pfitz.P. lepidoptera (Cl.)Reia.
NaviculaceaeAnoaonei« Pfitz. A. sp.nFl
elongata (Perag. and
Caloneis Cl.C. oregonica (Ehr.)Patr.
Diploneis Ehr.D. boabus Ehr.D. didyaa (Ehr.) Ehr.D. elliptic* (Rutz.)Cl.D. gruendleri (A.S.)Cl.D. interrupta (Kutz.)Cl.D. ovalig v. obloogella (Maeg.)Cl.D. puella (Schum.)Cl.
Donkinia RalfsD. recta Grun.
Frustulia Rabh.F. interposita (Lewis)Cl.
Gyros igaa Has*.G. exili* (Grun.)Reim.G. exiad.ua (Thwaites)Boyer
Mastogloia ThwaitesM. apiculata W.Sa.M. ainutissaa VoigtM. puaila v. papuarua Chol. Navicula BoryN. aaaophila Grun.
39,060 0.4
70,66547,11023,55523,55570,665
N. anglica v. «ub«al«a (Grun.)Cl.N. eapitata Ehr.N. cyrptocephala Kutz.N. foraenterae Cl.H. gregaria Donk.H. Yuami Must.N. ilopangoensis Bust.N. lanceolata (Ag.)Kutz.N. litoricola Grev.N. lyra Ehr.N. marina RalfsN. enisculus Schum.H. aicrocephala Grun.N. ainima Grun.N. inmcula Grun.H. urali« Grun.N. autica Kutz.N. autica v. cohnii (Hilse)Grun.H. autica f. undulata (Hilse)Grun.N. notha Wall.N. pelliculosa HilaeN. pupula v. autata (Krasske)Hust.H. pygaaea Kutz.N. radiosa v. tenella (Breb.)Cl.N. scopulorum Breb.
39,060 .4
39,060 .4
39,060 .4
23,55523,555
117,775
117,775
39,060 .4
47,110
70,66570,665
47,110
0.9 .6 .3 .3 .9
62,02982,705
41,353
.3 41,353
.3 20,676
1.5 62,029
1.5 103,381
41,353
144,734
1.0 1.3
.6
.6
.3
1.0
1.6
.6
2.2
20,676
41,353
.3
.6
31,681
6,336
6,33612,673
6,336
19,009
12,673
44,354
12,673
1.6
.3
.3
.6
.3
63,363 3.2
12,673 .66,336 .3
.9
.6
2.2
.6
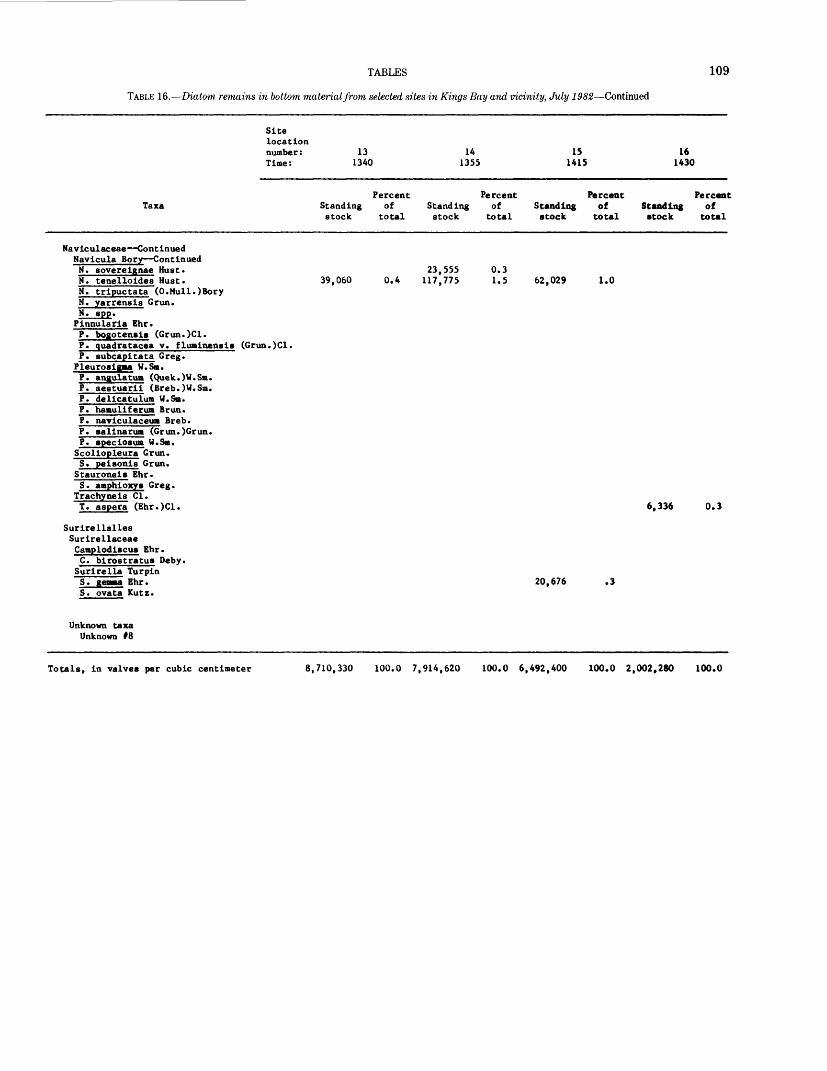
TABLES 109
TABLE 16. Diatom remains in bottom material from selected sites in Kings Bay and vicinity, July 1982 Continued
Sicelocationnumber: 13 14 15 16Time: 1340 1355 1415 1430
Percent Percent Percent PercentTaxa Standing of Standing of Standing of Standing of
stock total stock total stock total stock total
Naviculaceae Continued Navicula Bory ContinuedN. govereignae Hust. 23,555 0.3N. tenelloides Must. 39,060 0.4 117,775 1.5 62,029 1.0 N. tripuctata (O.Mull.)Bory N. yarrensis Grun.
Pinnularia Ehr.
P eurosigna W.Sm.
bogoten»i» (Grun.)Cl.quadratacea v. fluminensis (Grun.)Cl.gubcapitata Greg.
angulatum (Quek.)W.Sm.aestuarii (Breb.)W.Sm.delicatulum W.Sm.hamuliferun Brun.naviculaceun Breb.salinarun (Grun.)Grun.speciosua W.Sm.
Scoliopleura Grun.S. peisonis Grun. Stauroneis Ehr.S. amphioxys Greg.
Trachyneis Cl.T. aspera (Ehr.)Cl. 6,336 0.3
Surirellalles Surirellaceae Camplodi»cu» Ehr.C. birostratm Deby. Surirella TurpinS. gemaa Ehr. 20,676 .3 S. ovata Kutz.
Unknown taxa Unknown f8
Totals, in valves per cubic centimeter 8,710,330 100.0 7,914,620 100.0 6,492,400 100.0 2,002.280 100.0
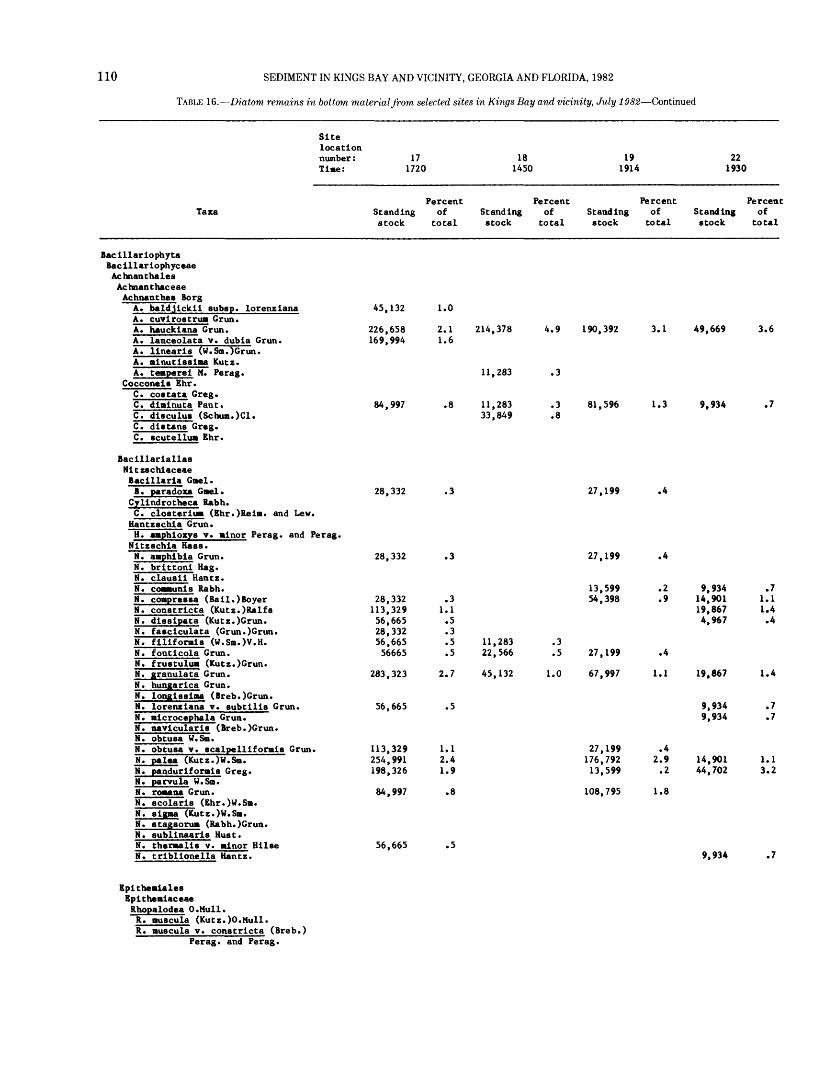
110 SEDIMENT IN KINGS BAY AND VICINITY, GEORGIA AND FLORIDA, 1982
TABLE 16. Diatom remains in bottom material from selected sites in Kings Bay and vicinity, July 1982 Continued
Site location number: 17 18 19 Time: 1720 1450 1914
Percent Percent Percent Taxa Standing of Standing of Standing of
stock total stock total stock total
Bacillariophyta Bac lllariophyceae Achnanthales Achnanthaceae Achnanthes Borg
A. baldjickii subs p. lorenziana 45,132 1.0A. cuviroBtrum Grun.A. hauckiana Grun. 226,658 2.1 214,378 4.9 190,392 3.1A. lanceolate v. dubia Grun. 169.994 1.6A. linearis (w.Sm.)Grun.A. minutissina Kutz.A. temperei M. Perag. 11,283 .3
Cocconeis Ehr.C. costata Greg.C. dlmlnuta Pant. 84,997 .8 11,283 .3 81,596 1.3C. di'sculus (Schum.)Cl. 33,849 .8C. distans Greg.C. scute Hum Ehr.
Bacillariallas Nitzschiaceae Bacillaria Gael.B. paradoxa Gael. 28,332 .3 27,199 .4
Cylindrotheca Rabh. C. closterium (Ehr.)Reim. and Lew.
Uantzschia Grun.H. amphioxys v. minor Perag. and Perag.Nitzschia Uass.N. amphibia Grun. 28,332 .3 27,199 .4N. brittoni Hag.N. clausii Hantz.N. communis Rabh. 13,599 .2N. compressa (Bail.)Boyer 28,332 .3 54,398 .9N. constricta (Kutz.)Ralfs 113,329 1.1N. dissipata (Kutz.)Grun. 56,665 .5N. fasciculate (Grun.)Grun. 28,332 .3M. f'iliformis (W.Sm.)V.H. 56,665 .5 11,283 .3N. fonticola Grun. 56665 .5 22,566 .5 27,199 .4N. frustuium (Kutz.) Grun.N. granulata Grun. 283.323 2.7 45,132 1.0 67,997 1.1N. hungarica Grun.N. longissima (Breb.)Grun.N. lorenziana v. subtilis Grun. 56,665 .5N. microcephala Grun.N. navicularis (Breb.)Grun.M. obtusa W.Sm.N. obtusa v. scalpelliformis Grun. 113,329 1.1 27,199 .4N. palea (Kutz.)W.Sm. 254,991 2.4 176,792 2.9 N. panduriformis Greg. 198,326 1.9 13,599 .2N. parvula W.Sm.N. romana Grun. 84.997 .8 108,795 1.8N. scolaris (Ehr.)W.Sm.N. s'i'gma (Kutz.)W.Sm. N. stagsorum (Rabh.)Grun.M. sublinaaris Bust.N. thermalis v. minor Hilse 56,665 .5N. triblionella Hantz.
Epithemiales Eplthemiaceae Rhopalodea O.Mull. R. muscula (Kutz. )0. Mull.R. muscula v. constricta (Breb.)
Perag. and Perag.
22 1930
Percent Standing of stock total
49,669 3.6
9,934 .7
9,934 .7 14,901 1.1 19,867 1.4 4,967 .4
19,867 1.4
9,934 .7 9,934 .7
14,901 1.1 44,702 3.2
9,934 .7

TABLES
TABLE 16. Diatom remains in bottom material from selected sites in Kings Bay and vicinity, July 1982 Continued
111
Site location number: 17 18 19 Time: 1720 1450 1914
Percent Percent Percent Taxa Standing of Standing of Standing of
stock total stock total stock total
Eupodiscales Biddulphiaceae Biddulphia Gray B. aurita (Lyng.)Breb. and GodeyB. granulata RoperB. pulchella Gray
Eucampla Ehr.
Eunotograana WeisseE. laeva Grun. 113,329 1.1 135,396 3.1 27,199 .4E. aarinua (W.Sm.)Perag. 28,332 .3 67,997 1.1Streptotheca Shrub. S. thaaensis Shrub.
Terpsinoe Ehr. T. ausica Ehr.
Trlceratiua Ehr.T. alternans Ball.T. favus Ehr.T. reticulua Ehr.
Coscinodiscaceae Actinoptychus Ehr. and V.H. A. undulatus (Ball.)Ralfs 56,665 .5 33,849 .8
Actinocyclus Ehr. A. ehrenbergll v. tenella (Breb.)Hust.A. sp. flChaetoceros Ehr.C. sp. H
Cosclnodiscus Ehr.C. cent rait s Ehr.C. curvatulus Grun. 28,332 .3 11,283 .3C. excentricus Ehr. 84,997 .8 11.283 .3 190.392 3.1C. llneatus Ehr. 84,997 .8 33.849 .8 67,997 1.1C. aarglnatus Ehr. 84,997 .8 22,566 .5C. nitidus Greg. 169,994 1.6 112,830 2.6 95,196 1.6C. radiatus Ehr. 198,326 1.9 90,264 2.1 40,798 .7Cyclotella Kutz. C. atoaus Bust. 84,997 .8C. aeneghiniana Kutz. 28.332 .3 33,849 .8 190,392 3.1C. strlata (Kutz.)Grun. 311,655 2.9 45,132 1.0 67,997 1.1Cylindropyxis Hendey C. treaulas Hendey 113,329 1.1 45,132 1.0
Henidiscus Wall.H. veissflogi (Grun.)Hust.
Meloslra Ag.M. granulata (Ehr.)RalfsH. nuaauloldes (Dillw.)Ag.M. sulcata (Ehr.)Kutz. 226,658 2.1 112,830 2.6 217.591 3.6Podoslra Ehr.P. stelliger (Bail.)Mann 28,332 .3
Skeletonema Grev.S. costatua (Grev.)Cl.
S tephanopyxis (Ehr.) S. turrls (Grev.)Ralfs
Thalassioslra Cl.T. deciplens (Grun.)Jorg.T. fluvlatilis Bust.
22 1930
Percent Standing of stock total
69,536 5.1
14,901 1.1
4,967 .4 14,901 1.1 24,834 1.8
64,569 4.7 24,834 1.8
39,735 2.94,967 .4
24,834 1.8
Eupodiscaceae Auliscus Ehr.A. caelatus Bail. Eupodiscus Ehr.E. radiatus Ball.

112 SEDIMENT IN KINGS BAY AND VICINITY, GEORGIA AND FLORIDA, 1982
TABLE 16. Diatom remains in bottom material from selected sites in Kings Bay and vicinity, July 1982 Continued
Sitelocationnumber: 17 18 19 22Time: 1720 1450 1914 1930
Percent Percent Percent PercentTaxa Standing of Standing of Standing of Standing of
stock total stock total stock total stock total
Rhlzosolenlaceae Rhlzosolenla Bright. R. dellcatula Cl. R. fragilissima Berg. R. aetlgera Bright R. stolterfothll H. Perag. R. sp. fl'
Fragilariales Fragllarlaceae Asterionella Hass.A. japonica Cl. Camplosira Grun.C. cymbelllformle (A.S.)Grun. Cymatosira Grun.C. belglca Grun. 4,986,480 47.2 2,042,230 46.9 2,760,680 45.3 526,486 38.3C. lorenslana Grun. 84,997 .8 33,849 .8 108,795 1.8 9,934 .7
Dimeregramma RalfsD. aaculaturn (Cl.)Freng. 4,967 .4
Eunotia Ehr.E. suecica Cl. Fragilaria Lyng.F. construens v. venter (Ehr.)Grun. 28,332 .3 27,199 .4 14,901 1.1F. lapponlca Grun.
Glyphodesnla Grev.G. distans (Greg.)Grun.
Opepfaora Petit0. aartyi Herlb.0. pacifica (Grun.)Petlt 361,057 8.3 81,596 1.3 44,702 3.20. swartzii (Grun.)Petlt 11,283 .3 Plagiograama Grev.P. pulchellum v. pygaaea (Grev.)
Perag. and Perag.P. staurophorum (Greg.)Helb.P. vanheurckil Grun.P. wallichianum Grev.
Rhaphoneis Ehr.R. amphiceros (Ehr.)Ehr. 198,326 1.9 27,199 .4 4,967 .4R. grossenpunctata Hust.R. surirella (Ehr.)Grun. 113,329 1.1 157,962 3.6 95,196 1.6 19,867 1.4R. surirella v. australis PetitR. ep. fl'
Synedra Ehr.S. amphicsphala v. austrlaca (Grun.)Hust.S. fastculata v. truncata (Grev.)Patr.
Tabellarta Ehr.T. fenestrata (Lyng.)Kutz. Thallaslothrix Cl. and Grun.T. frauenfeldll (Grun.)Grun.T. longissinta Cl. and Grun.
Trachyephenia PetitT. acuminata Perag. 101,547 2.3
Naviculales Cynbellaceae Amphora Ehr.A. angusta v. ventrlcosa (Greg.)Cl. 28,332 .3 13,599 .2A. calumetlca (Thorn, and Wolle)M.Perag. 28,332 .3A. acutiuscula Kutz. 33,849 .8 95,196 1.6 14,901 1.1A. ovalis (Kutz.)Kutz. 90,264 2.1 9,934 .7A. perpus11la Grun. 11,283 .3A. proteoldas Hust. Cymbella Ag.C. affinis Kutz.
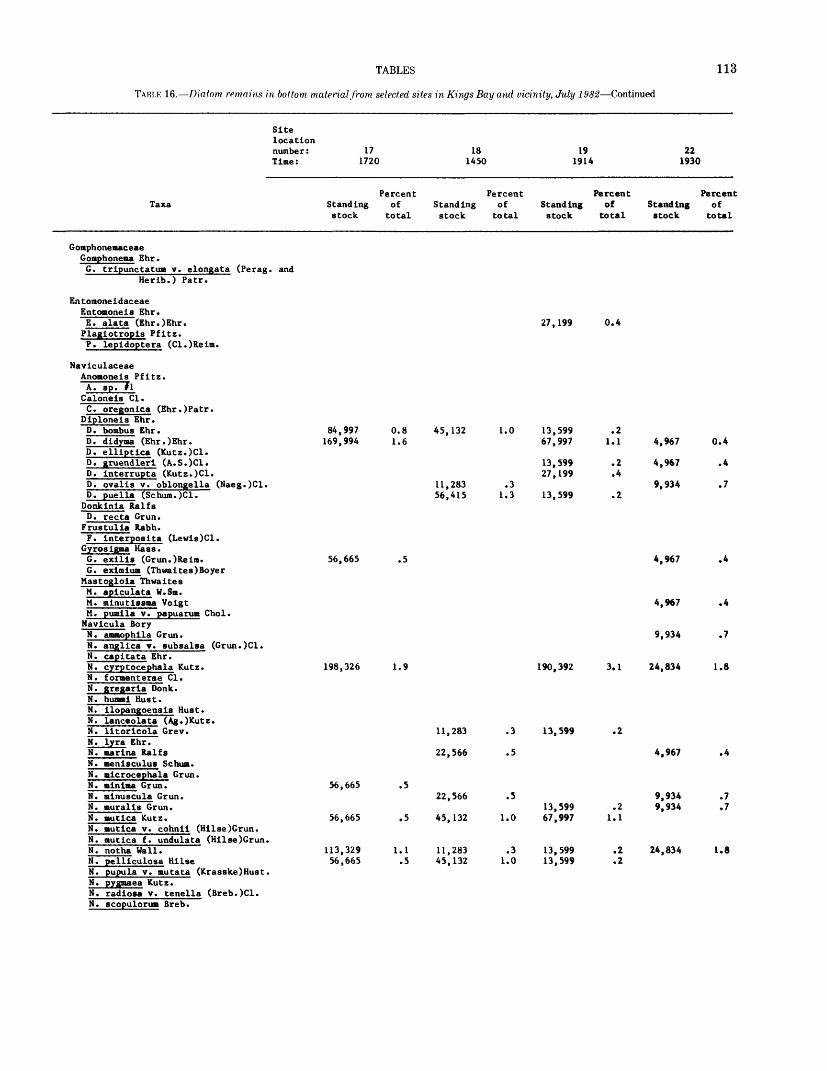
TABLES
TABLE 16. Diatom remains in bottom material from selected sites in Kings Bay and vicinity, July 1982 Continued
113
Sitelocation number: Time:
171720
181450
191914
221930
TaxaPercent
Standing of stock total
PercentStanding of stock total
Percent Standing of stock total
PercentStanding of stock total
Gomphonemaceae Gomphonema Ehr. G. tripunctatum v. elongata (Perag. and
Herib.) Patr.
Entomoneidaceae Entomoneis Ehr.E. alata (Ehr.)Ehr.
Plagiotropis Pfitz.P. lepidoptera (Cl.)Reim.
NaviculaceaeAnomoneis Pfitz.
A. spT?l Caloneis Cl.
C. oregoniea (Ehr.)Patr. Diploneis Ehr.
D. bombus Ehr.D. didyma (Ehr.)Ehr.D. elliptica (Kutz.)Cl.D. gruendleri (A.S.)Cl.D. interrupta (Kutz.)Cl.D. ovalis v. oblongella (Naeg.)Cl.D. paella (Schum.)Cl.
Donkinia RalfsD. recta Grun.
Frustulia Rabh.F. interposita (Lewis)Cl.
Gyros igma Haas.G. exilis (Grun.)Reim.G. eximium (Thwaites)Boyer
Mastogloia ThwaitesM. apiculata W.Sm.M. minutissma VoigtM. pumila v. papuarum Chol. Navicula BoryN. ammophila Grun.N. anglica v. subsalsa (Grun.)Cl.N. capita ta Ehr.N. cyrptocephala Kutz.N. formenterae Cl.N . gregaria Oonk.N. humai Hust.N. ilopangoensis Hust.N. lanceolata (Ag.)Kutz.N. litorieola Grev.N. lyra Ehr.N. marina RalfsN. neniseulus Sebum.N. mierocephala Grun.N. minima Grun.H. minuseula Grun.N. auralis Grun.N. autica Kutz.N. autica v. cohnii (Hilse)Grun.N. mutica f. undulata (Hilse)Grun.N. notha Wall.N. pelliculosa HilseN. pupula v. autata (Krasske)Hust.N. pygmaea Kutz.N. radiosa v. tenella (Breb.)Cl.N. scopulorum Breb.
84,997169,994
0.8 1.6
56,665 .5
198,326 1.9
56,665
56,665
.5
.5
113,329 1.156,665 .5
45,132
11,28356,415
1.0
.3 1.3
11,283
22,566
22,566
45,132
11,28345,132
.3
.5
.5
1.0
.3 1.0
27,199
13,59967,997
13,59927,199
13,599
190,392
13,599
13,59967,997
13,59913,599
0.4
.21.1
.2
.4
.2
.2
.2 1.1
.2
.2
4,967 0.4
4,967 .4
9,934 .7
4,967 .4
4,967 .4
9,934 .7
3.1 24,834 1.8
4,967 .4
9,9349,934
24,834
.7
.7
1.8
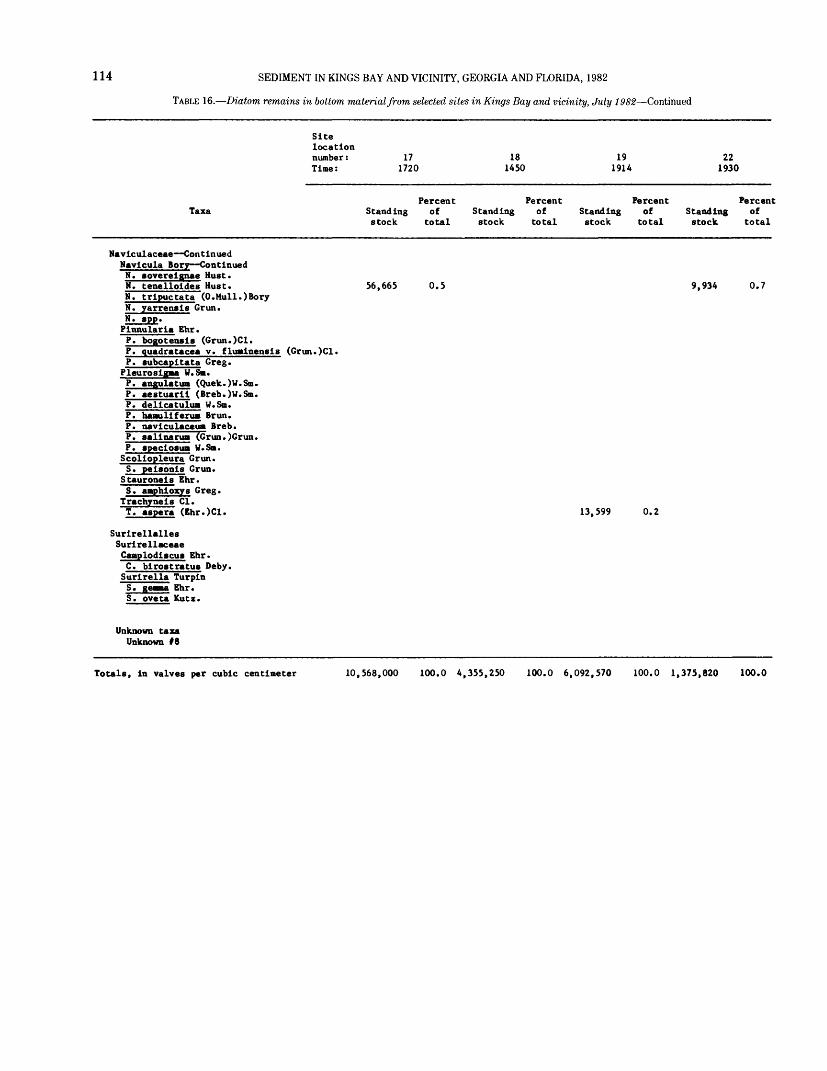
114 SEDIMENT IN KINGS BAY AND VICINITY, GEORGIA AND FLORIDA, 1982
TABLE 16. Diatom remains in bottom material from selected sites in Kings Bay and vicinity, July 1982 Continued
Site location number: Time:
171720
181450
191914
221930
TaxaPercent
Stand ing of stock total
PercentStanding of stock total
Percent Standing of stock total
Percent Standing of stock total
Naviculaceae Continued Navicula Bory ContinuedN. sovereignae Must.N. tenelloides Must.N. tripuctata (O.Mull.)BoryN. yarrensis Grun.N. »pp. Pinnularia Ehr.P. bogoteasis (Grun.)Cl.P. quadratacea v. fluminensis (Grun.)Cl.P. subcapitata Greg.
Pleurosigaa W.S».P. angulatua (Quek.)W.Sa.P. aestuarii (Breb.)W.Sa.P. delicatulua W.S».P. haauliferua Brun.P. naviculaceua Breb.P. alinaruat (Grun.)Grun.P. pecio»u« W.Sa. Seoliopleura Grun.S. peisonis Grun.
Stauroneis Ehr.S. aaphioxys Greg.
Trachyneis Cl.T. agpera (Ehr.)Cl.
Surirellalles Surirellaceae Caaplodi»cu« Ebr. C. biro«tratu» Deby. Surirella Turpin
S. oveta Kutz.
56,665 0.5 9,934 0.7
13,599 0.2
Unknown taxa Unknown 18
Totals, in valves per cubic centimeter 10,568,000 100.0 4,355,250 100.0 6,092,570 100.0 1,375,820 100.0
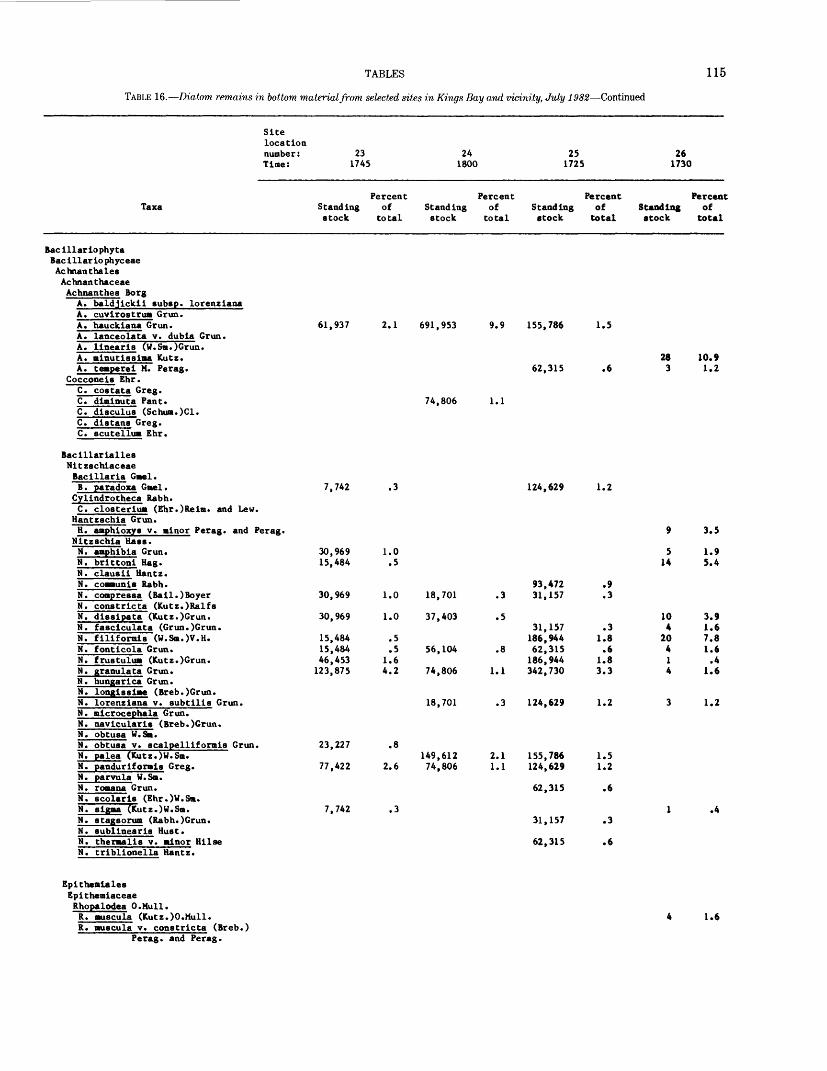
TABLES
TABLE 16. Diatom remains in bottom material from selected sites in Kings Bay and vicinity, July 1982 Continued
115
Site location number: 23 24 25 Time: 1745 1800 1725
Percent Percent Percent Taxa Standing of Standing of Standing of
stock total stock total stock total
Bac ill ar lo phy ta Bacillariophyceae Ac hnant hales Achnanthaceae Achnanthes Borg
A. baldjick.il subsp. lorenzianaA. cuvirostrum Grun.A. hauckiana Grun. 61,937 2.1 691,953 9.9 155,786 1.5A. lanceolata v. dubia Grun.A. linearis (V.Sm.)Grun.A. minutissima Kutz.A. temperei M. Perag. 62,315 .6
Cocconeis Ehr.C. costata Greg.C. diminuta Pant. 74,806 1.1C. disculus (Schua.)Cl.C. distans Greg.C. scutellum Ehr.
Bacillarialles Nitzschiaceae Bacillaria Gael.B. paradoxa Gael. 7,742 .3 124.629 1.2
Cylindrotheca Rabh. C. closterium (Ehr.)Reim. and Lew.
Hantzschia Grun.H. amphioxys v. minor Perag. and Perag.
Nitzschia Mass.N. amphibia Grun. 30,969 1.0N. brittoni Hag. 15.484 .5N. clausii Hantz.N. communis Rabh. 93,472 .9N. compressa (Bail.)Boyer 30,969 1.0 18.701 .3 31.157 .3N. constricta (Kutz.)RalfsN. dissipata (Kutz.)Grun. 30,969 1.0 37,403 .5N. fasciculata (Grun.)Grun. 31,157 .3N. filiformis (W.Sm.)V.H. 15,484 .5 186,944 1.8N. fonticola Grun. 15,484 .5 56,104 .8 62.315 .6N. frustulum (Kutz.)Grun. 46.453 1.6 186.944 1.8N. granulata Grun. 123,875 4.2 74,806 1.1 342,730 3.3N. hungarica Grun.N. longissiaa (Breb.)Grun.N. lorenziana v. subtilis Grun. 18,701 .3 124,629 1.2N. microcephala Grun.N. navicularis (Breb.)Grun.N. obtusa W.Sm.N. obtusa v. scalpelliformis Grun. 23,227 .8N. palea (Kutz.)W.Sm. 149,612 2.1 155,786 1.5 N. panduriformis Greg. 77.422 2.6 74.806 1.1 124.629 1.2N. parvula W.Sm.N. romana Grun. 62.315 .6N. scolaris (Ehr.)W.Sm.N. sigma (Kutz.)W.Sm. 7,742 .3 N. stagsorum (Rabh.)Grun. 31,157 .3N. sublinearis Must.N. thermalis v. minor Hilse 62.315 .6N. triblionella Hantz.
Epithemiales Epithemiaceae Rhopalodea O.Mull. R. muscula (Kutz. )0. Mull.R. muscula v. constricta (Breb.)
Perag. and Perag.
26 1730
Percent Standing of stock total
28 10.9 3 1.2
9 3.5
5 1.9 14 5.4
10 3.9 4 1.6
20 7.8 4 1.6 1 .4 4 1.6
3 1.2
1 .4
4 1.6
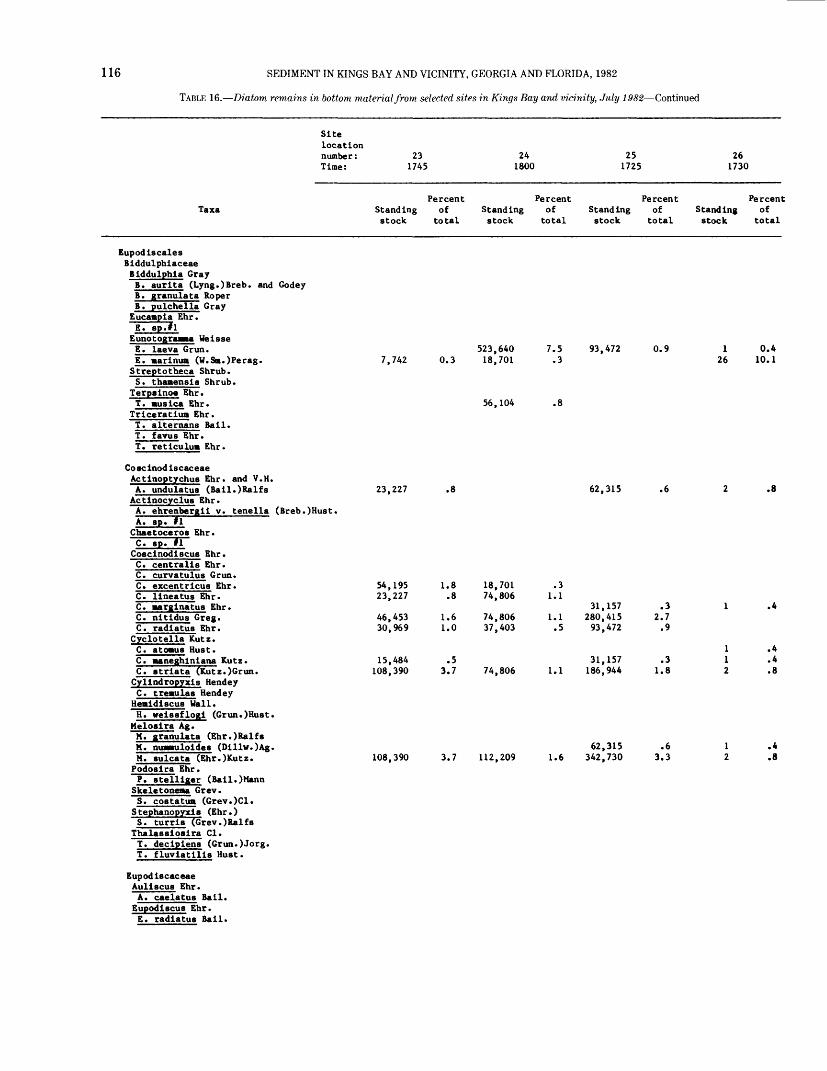
116 SEDIMENT IN KINGS BAY AND VICINITY, GEORGIA AND FLORIDA, 1982
TABLE 16. Diatom remains in bottom material from selected sites in Kings Bay and vicinity, July 1982 Continued
Sitelocation number: Time:
231745
241800
251725
261730
TaxaPercent
Standing of stock total
PercentStanding of stock total
PercentStandIng of stock total
Percent Standing of stock total
Eupodiscales Biddulphiaceae Biddulphia GrayB. aurita (Lyng.)Breb. and Godey B. granulata Roper B. pulchella Gray
Eucaapia Ehr.
Eunotograaaa WeisseE. laeva Grun.E. aarinua (W.Sa.)Perag. Streptotheca Shrub.S. thanensiB Shrub.
Terpainoe Ehr.T. ausica Ehr.
Triceration Ehr.T. alternans Bail.T. favus Ehr.T. reticulua Ehr.
Cosclnodiscaceae ActinoptychuB Ehr. and V.H.A. undulatuB (Bail.)Ralfs ActinocycluB Ehr.A. ehrenbergii v. tenella (Breb.)Hust.A. up. II Chaetoceros Ehr.C. BP. fl CoBcinodiBCUB Ehr.C. centra11B Ehr.C. curvatulus Grun.C. excentricuB Ehr.C. llneatus Ehr.C. aarglnatuB Ehr.C. nitidus Greg.C. radiatuB Ehr.
Cyclotella Kutz.C. atoauB Hust.C. aaneghiniana Kutz.C. atriata (Kutz.)Grun. Cyllndropyxis HendeyC. treaulas Hendey
HealdlBcuB Wall.H. welBBflogl (Grun.)Hust.
Meloaira Ag.M. granulata (Ehr.)RalfsM. nuaauloldea (Dillw.)Ag.M. Bulcata (Ehr.)Kutz. Podosira Ehr.P. Btelllger (Bail.)Mann
Skeletoneaa Grev.S. coBtatua (Grev.)Cl.
S tephanopyxia (Ehr.)S. turriB (Grev.)RalfB
ThalasBioaira Cl.T. decipiens (Grun.)Jorg.T. fluviatiliB Hunt.
7,742
23,227
54,19523,227
46,45330,969
15,484108,390
0.3
.5 3.7
108,390
523,64018,701
56,104
18,70174,806
74,80637,403
74,806
7.5 .3
.8
93,472
62,315
.3 1.1
1.1 .5
1.1
3.7 112,209 1.6
31,157280,41593,472
31,157186,944
62,315342,730
0.9 126
0.4 10.1
.6
.32.7 .9
.31.8
.6 3.3
Eupodiscaceae AulJBCUB Ehr.A. caelatus Bail. EupodiBcuB Ehr.E. radiatuB Bail.
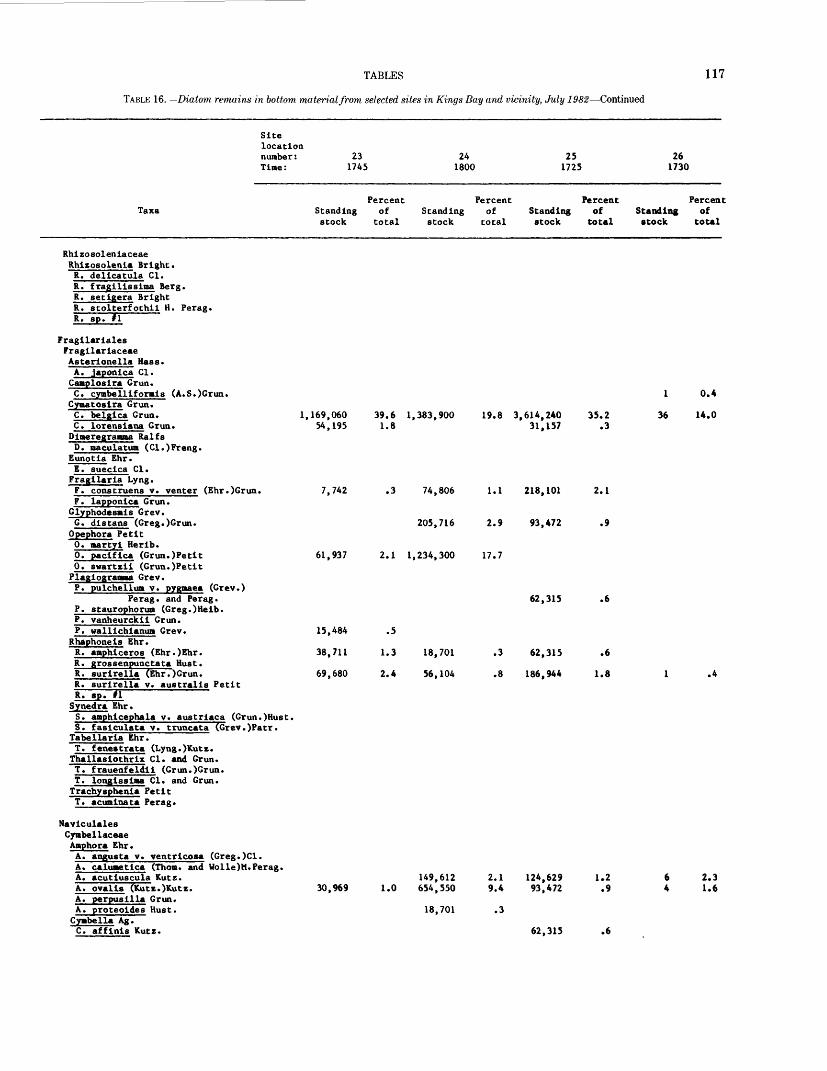
TABLES 117
TABLE 16. Diatom remains in bottom material from selected sites in Kings Bay and vicinity, July 1982 Continued
Sitelocationnumber: 23 24 25 26Time: 1745 1800 1725 1730
Percent Percent Percent PercentTaxa Standing of Standing of Standing of Standing of
stock total stock total stock total stock total
Rhlzosolenlaceae Rhtzosolenla Bright. R. delicatula Cl. R. fragllisslma Berg. R. setlgera Bright R. stolterfothll H. Perag. R. sp. tl
Fragilarlales Fragllarlaceae Asterlonella Mass.A. japonlca Cl. Camploslra Grun.C. cymbelliforals (A.S.)Grun. 1 0.4
Cymatostra Grun.C. belgica Grun. 1,169,060 39.6 1,383,900 19.8 3,614,240 35.2 36 14.0C. lorensiana Grun. 54,195 1.8 31,157 .3 Dlmeregramma RalfsD. maculatum (Cl.)Freng.
Eunotla Ehr.E. sueclca Cl. Fragilarla Lyng.F. construens v. venter (Ehr.)Grun. 7,742 .3 74,806 1.1 218,101 2.1F. lapponica Grun.
Glyphodesals Grev.G. dlstans (Greg.)Grun. 205,716 2.9 93,472 .9
Opephora Petit0. martyl Herlb.0. pactftca (Grun.)Petlt 61,937 2.1 1,234,300 17.70. swartzlt (Grun.)Petlt Plaglogranaa Grev.P. pulchellum v. pygmaea (Grev.)
Perag. and Perag. 62,315 .6P. staurophorum (Greg.)Heib.P. vanheurckii Grun.P. walllchlanun Grev. 15,484 .5
Rhaphoneis Ehr.R. aaphiceros (Ehr.)Ehr. 38,711 1.3 18,701 .3 62,315 .6R. grossenpunctata Must.R. surirella (Ehr.)Grun. 69,680 2.4 56,104 .8 186,944 1.8 1 .4R. surirella v. australls PetitR. sp. fl'
Synedra Ehr.S. aaphicephala v. austrlaca (Grun.)Hust.S. faslculata v. truncata (Grev.)Patr.
Tabellaria Ehr.T. fenestrata (Lyng.)Kutz. Thallasiothrlx Cl. and Grun.T. frauenfeldit (Grun.)Grun.T. longissiaa Cl. and Grun. Trachysphenia PetitT. acumtnata Perag.
Navlculales Cymbellaceae Amphora Ehr.A. angusta v. ventricosa (Greg.)Cl.A. caluaetica (Thorn, and Wolle)M.Perag.A. acutiuscula Kutz. 149,612 2.1 124,629 1.2 6 2.3A. ovalis (Kutz.)Kutz. 30,969 1.0 654,550 9.4 93,472 .9 4 1.6A. perpusllla Grun,A. proteoides Hust. 18,701 .3 Cyabella Ag.C. affinis Kutz. 62,315 .6
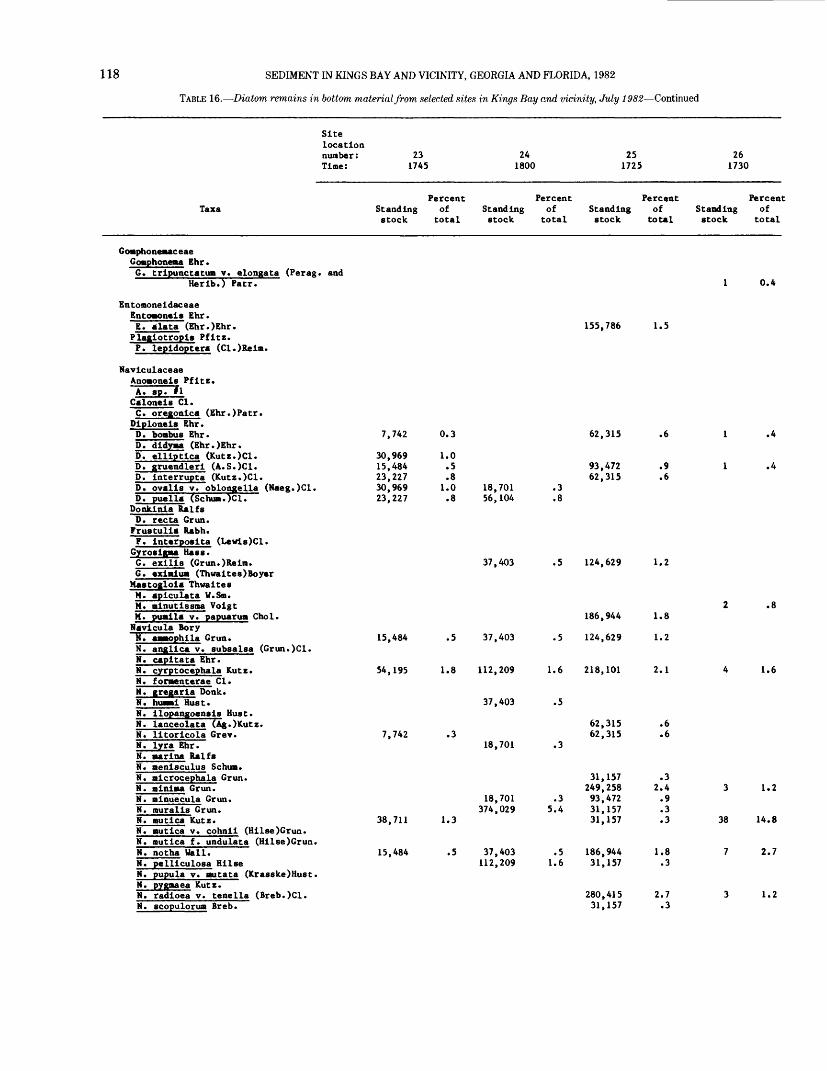
118 SEDIMENT IN KINGS BAY AND VICINITY, GEORGIA AND FLORIDA, 1982
TABLE 16. Diatom remains in bottom material from selected sites in Kings Bay and vicinity, July 1982 Continued
Sitelocation number: Time:
231745
241800
251725
261730
TaxaPercent
Standing of stock total
Percent Percent PercentStanding of Standing of Standing ofstock total stock total stock total
Gomphonemaceae Gomphonema Ehr. G. trlpunctatum v.
Berlb.) Patr.
Entomoneldaceae Entomonel* Ehr.E. alata (Ehr.)Ehr.
Plaglotropl« Pfltz.P. lepldoptera (Cl.)Relm.
NavlculaceaeAnomonels Pfltz.
elongata (Perag. and
Calonels Cl.C. oregonlca (Ehr.)Patr. Dlplonel* Ehr.D. boabus Ehr.D. dldyma (Ehr.)Ehr.D. elllptlca (Kutz.)Cl.D. gruendlerl (A.S.)Cl.D. Interrupta (Kutz.)Cl.D. ovalIs v. oblongella (Naeg.)Cl.D. puella (Schum.TciT
Donklnia RalfsD. recta Grun. Fru«tulla Rabh.P. lnterpo«lta (Lewls)Cl.
Gyro«lgma Hass.G. exilis (Grun.)Relm.G. exlmlua (Thwaltes)Boyer
Ma«toglola ThwaltesM. aplculata W.Sm.M. mlnutlssma VolgtM. pumila v. papuarum Chol. Navlcula BoryN. ammophlla Grun.N. angllca v. subsalsa (Grun.)Cl.N. capitata Ehr.N. cyrptocephala Kutz.H. formenterae Cl.N. gregarla Donk.H. humml Bust.H. llopangoen«ls Bust.N. lanceolata (Ag.)Kutz.N. lltorlcola Grev.N. lyra Ehr.N. marina RalfcH. menlsculus Schum.H. mlcrocephala Grun.H. minima Grun.N. mlnuecula Grun.N. muralls Grun.
7,742
30,96915,48423,22730,96923,227
N. mutlca Kutz.cohnll (Bllse)Grun.N. mutlca
N. mutlca f. undulata (Bllse)Grun.H. notha Wall.N. pelllculosa BllseH. pupula v. mutata (Krasske)Hust.H. pygmaea Kutz.H. radloea v. tenella (Breb.)Cl.H. scopulorum Breb.
0.3
1.0 .5 .8
1.0 .8
15,484 .5
54,195 1.8
7,742 .3
38,711 1.3
15,484 .5
155,786
18,70156,104
37,403
62,315
93,47262,315
112,209
37,403
18,701
18,701374,029
37,403112,209
1.6 218,101
.5
.3
.35.4
62,31562,315
31,157249,25893,47231,15731,157
.5 186,9441.6 31,157
280,41531,157
1.5
.6
.9
.6
.5 124,629 1.2
186,944 1.8
37,403 .5 124,629 1.2
2.1
.6
.6
.3 2.4 .9 .3 .3
1.8 .3
2.7 .3
0.4
.4
.4
.8
1.6
3
38
7
1.2
14.8
2.7
1.2
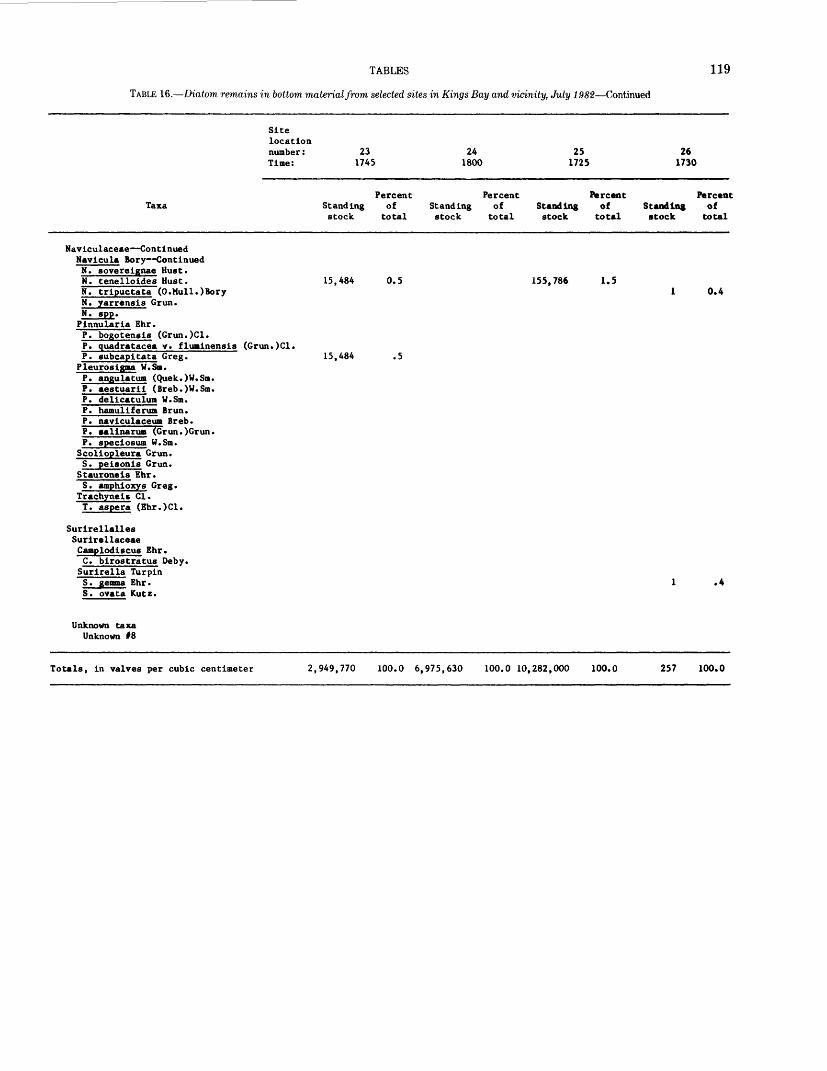
TABLES
TABLE 16. Diatom remains in bottom material from selected sites in Kings Bay and vicinity, July 1982 Continued
119
Sitelocation number: Time:
231745
241800
251725
261730
TaxaPercent
Standing of stock total
PercentStanding of stock total
PercentStanding of stock total
PercentStanding of stock total
Naviculaceae Continued Navicula Bory ContinuedN. soverelgnae Bust.N. tenelloldes Bust.N. trlpuctata (O.Mull.)BoryN. yarrensls Grun.M. spp. Pinnularia Ehr.P. bogotensis (Grun.)Cl.P. quadratacea v. fluminensls (Grun.)Cl.P. subcapltata Greg.
Pleuroslgma W.Sra.P. angulatum (Quek.)W.Sm.P. aestuarli (Breb.)W.Sm.P. dellcatulum W.Sm.P. hamuliferum Brun.P. naviculaceum Breb.P. alinarum TCrun.)Grun.P. speciosum W.Sm.
Scoliopleura Grun.S. pelsonis Grun.
Stauroneis Ehr.S. amphioxys Greg.
Trachyneis Cl.T. aspera (Ehr.)Cl.
Surirellalles Surirellaceae Camplodlscus Ehr.C. birostratus Deby. Surirella Turpin S. gemma Ehr. S. ovata Kutz.
15,484
15,484
0.5 155,786 1.50.4
.5
.4
Unknown taxa Unknown #8
Totals, in valves per cubic centimeter 2,949,770 100.0 6,975,630 100.0 10,282,000 100.0 257 100.0
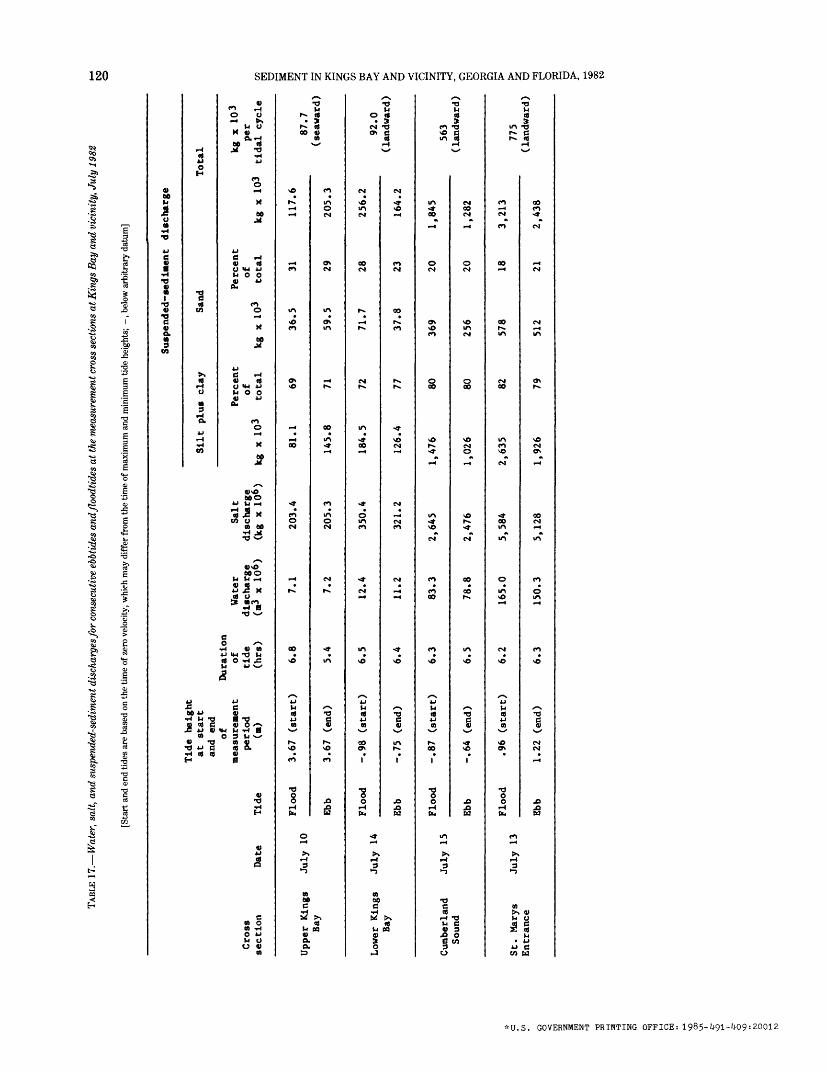
TABL
E 1
7.
Wat
er,
salt
, an
d su
spen
ded-
sedi
men
t dis
char
ges f
or
cons
ecut
ive
ebbt
ides
and
floo
dtid
es a
t th
e m
easu
rem
ent c
ross
sec
tion
s at
Kin
gs B
ay a
nd v
icin
ity,
Ju
ly 1
982
[Sta
rt a
nd e
nd ti
des
are
base
d on
the
time
of z
ero
velo
city
, whi
ch m
ay d
iffer
from
the
time
of m
axim
um a
nd m
inim
um ti
de h
eigh
ts; ,
bel
ow a
rbitr
ary
datu
m]
tc O
Suspended-sediment discharge
Cros
s section
Date
Tide
Flood
Uppe
r Ki
ngs
July
10
Bay
Ebb
Floo
d Lower
King
s Ju
ly 14
Bay
Ebb
Floo
d Cumberland
July 15
Sound
Ebb
Flood
St.
Marys
July
13
Entrance
Ebb
Tide height
at star
t an
d end
of
meas
urem
ent
peri
od
(m)
3.67
(s
tart
)
3.67 (end)
-.98 (s
tart
)
-.75 (end
)
-.87 (s
tart
)
-.64 (end
)
.96
(sta
rt)
1.22
(end
)
Dura
tion
of
tide
(h
rs)
6.8
5.4
6.5
6.4
6.3
6.5
6.2
6.3
Silt plus clay
Sand
Water
Salt
Perc
ent
Perc
ent
disc
harg
e di
scha
rge
of
of
(m3
x 10
6)
(kg
x 10
6)
kg x
103
tota
l kg
x
103
tota
l
7.1
203.
4 81.1
69
36.5
31
7.2
205.
3 14
5.8
71
59.5
29
12.4
350.
4 18
4.5
72
71.7
28
11.2
321.2
126.
4 77
37.8
23
83.3
2,645
1,476
80
369
20
78.8
2,47
6 1,
026
80
256
20
165.
0 5,584
2,63
5 82
578
18
150.3
5,128
1,92
6 79
512
21
Total kg
x
103
per
kg x
103
tida
l cy
cle
117.6
87.7
(sea
ward
) 205.3
256.2
92.0
(landward)
164.2
1,84
5 56
3(landward)
1,282
3,21
3 77
5(landward)
2,438
SEDIMENT IN
KINGS
BAY
AND
VICINITY, GEORG
IA AND
FLORID
A