Embed Size (px)
Citation preview
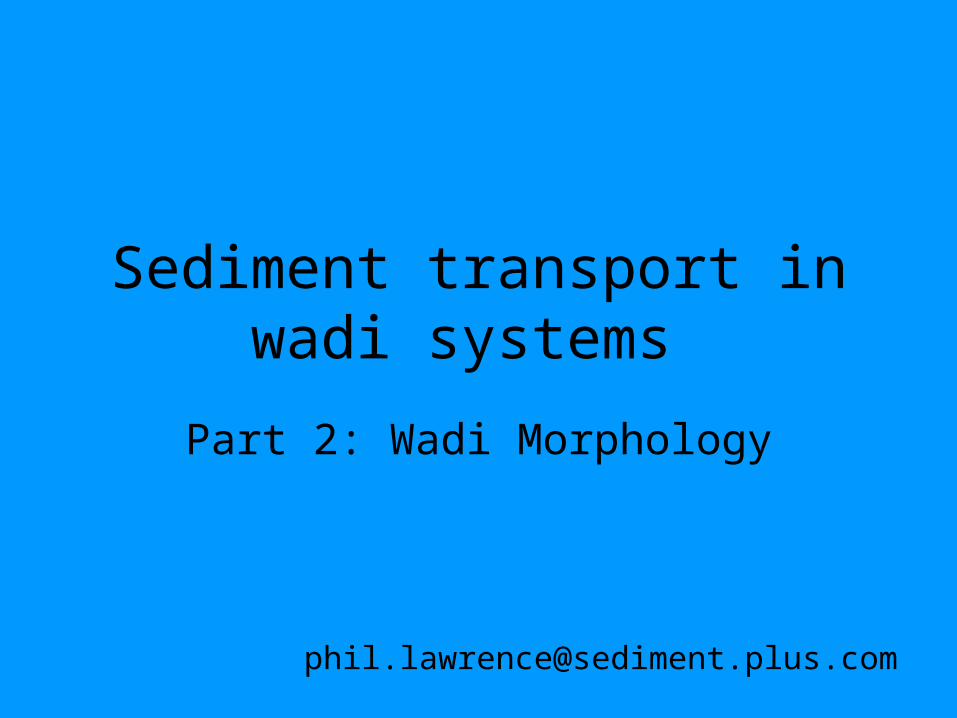
Mountain front and alluvial plain
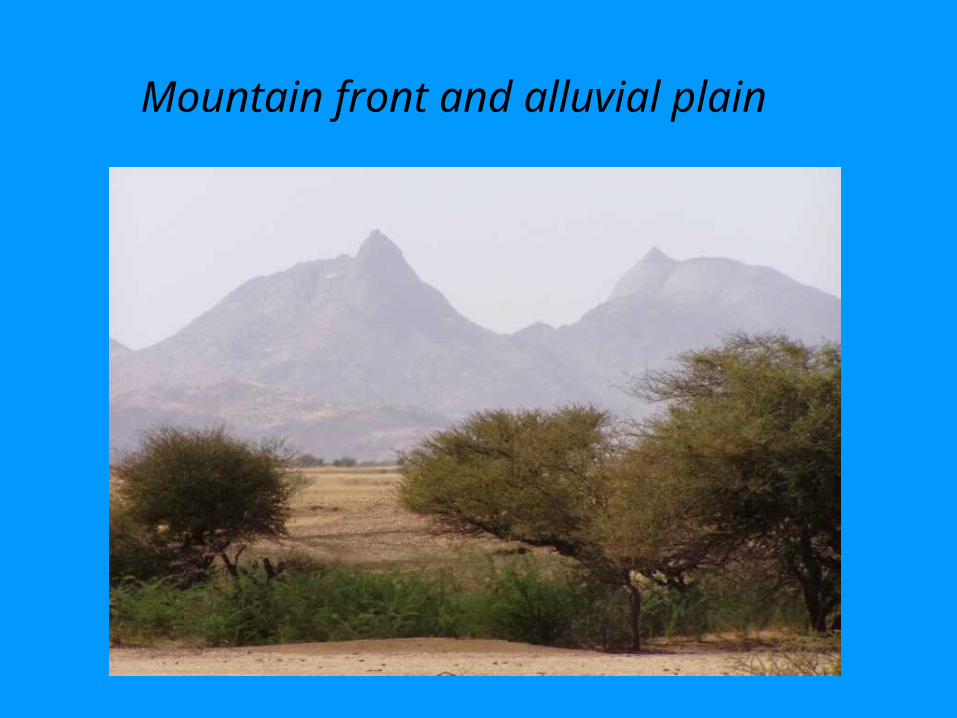
Steep upper catchment
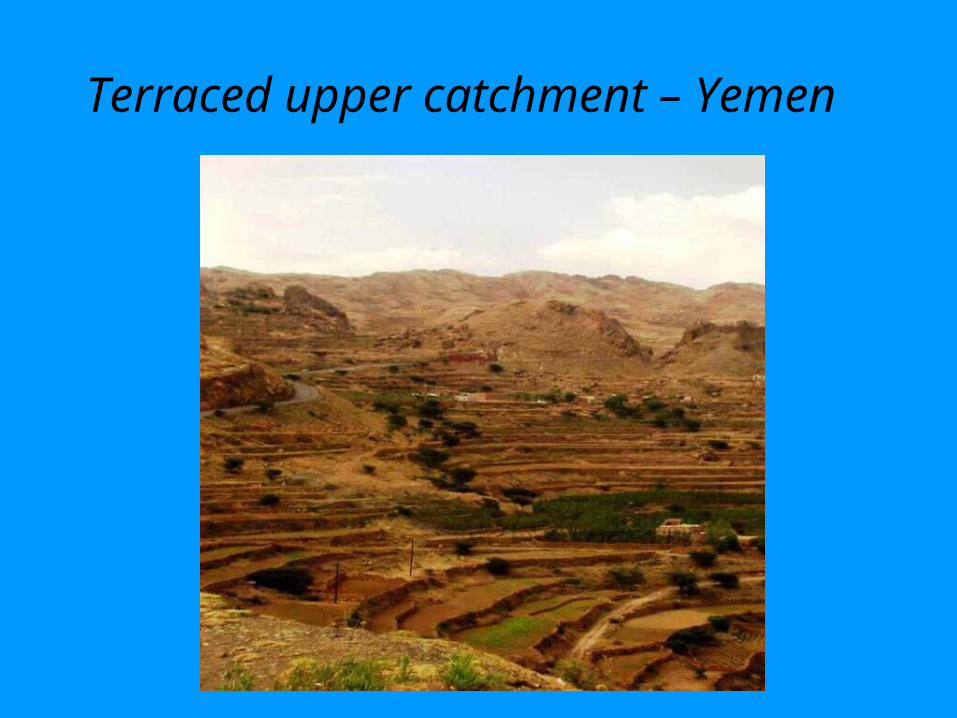
Terraced upper catchment – Yemen
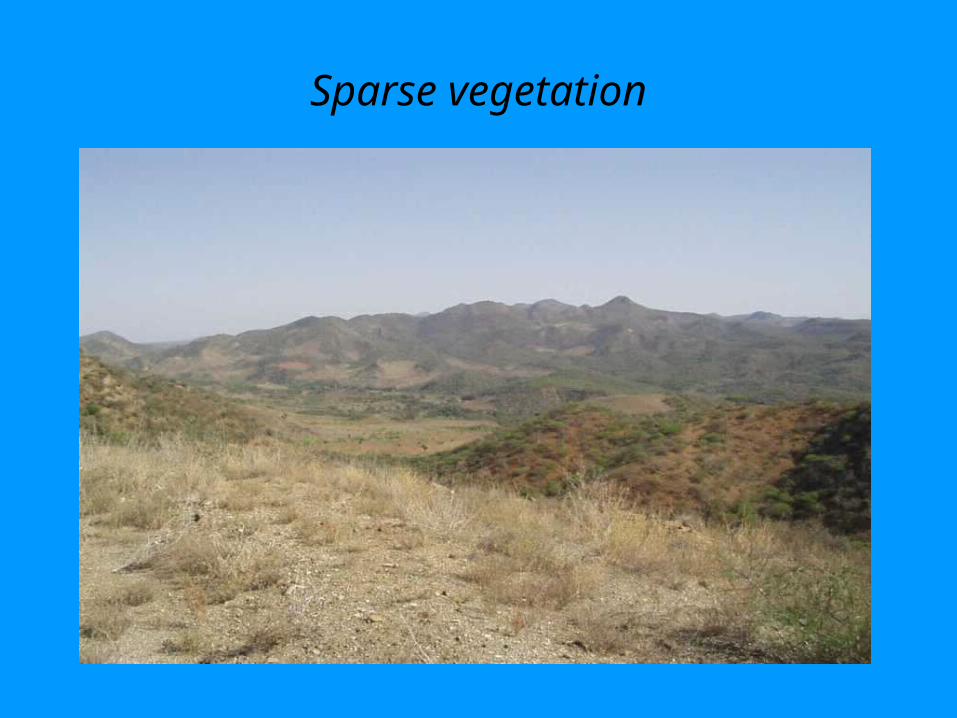
Sparse vegetation

Mid catchment wadi channel
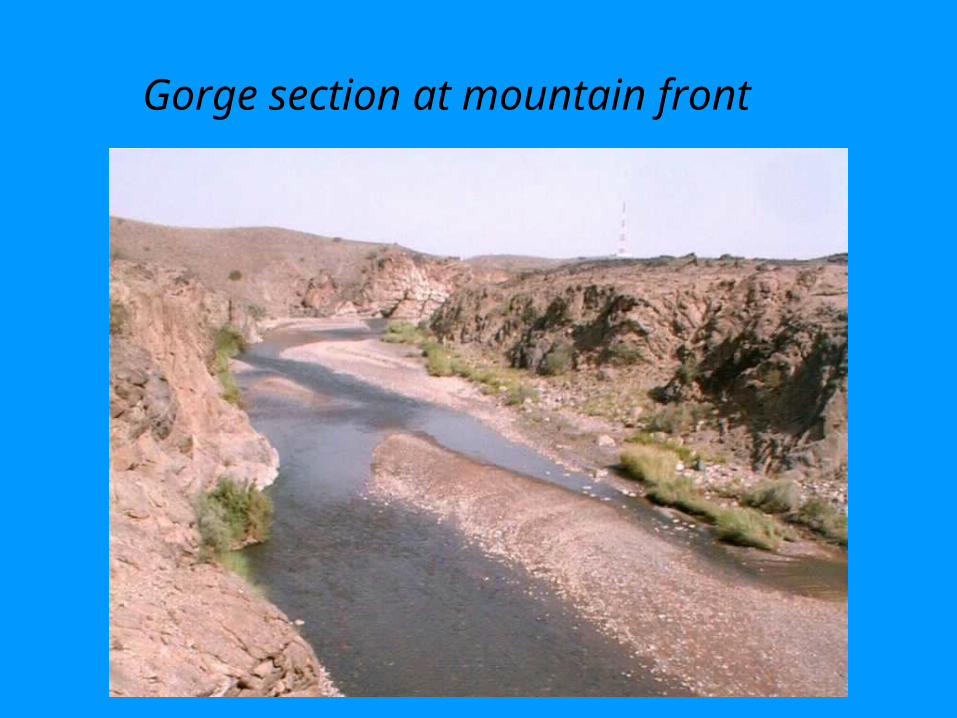
Gorge section at mountain front
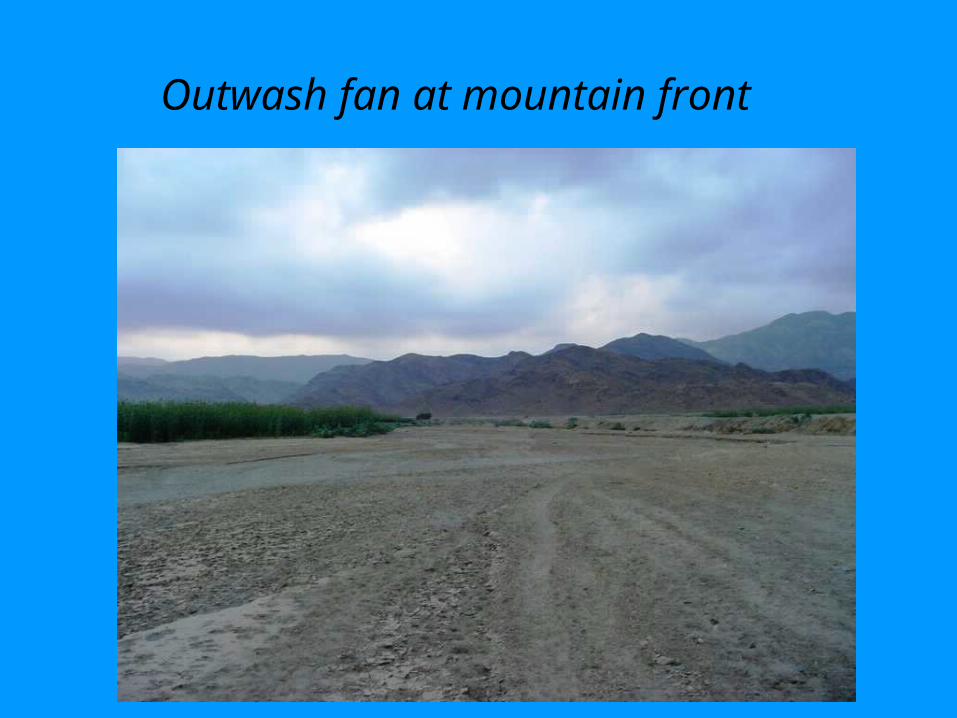
Outwash fan at mountain front
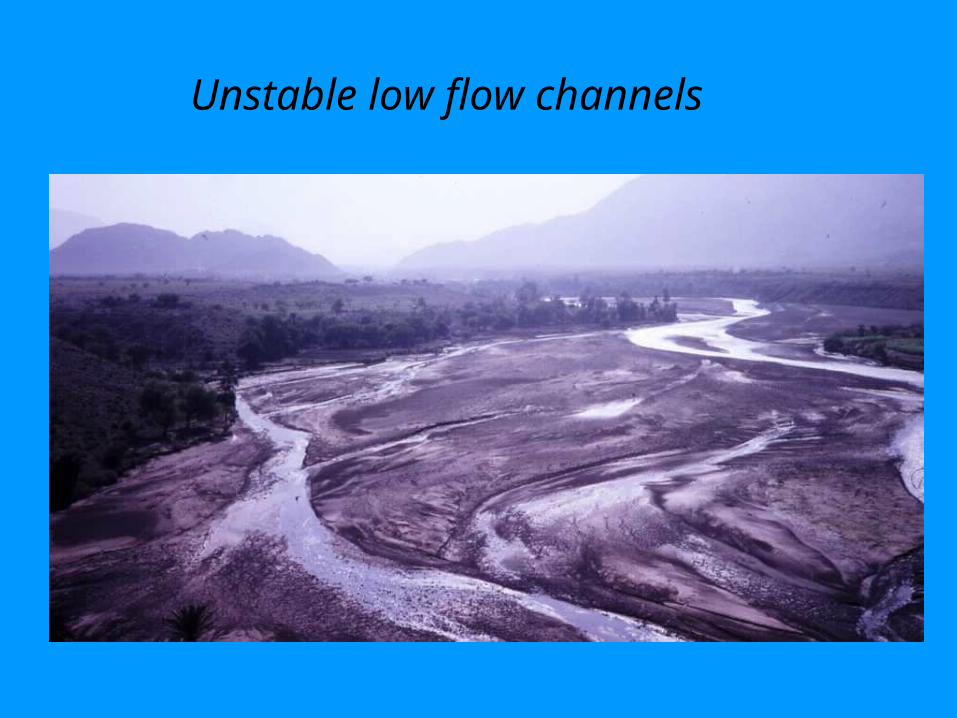
Unstable low flow channels
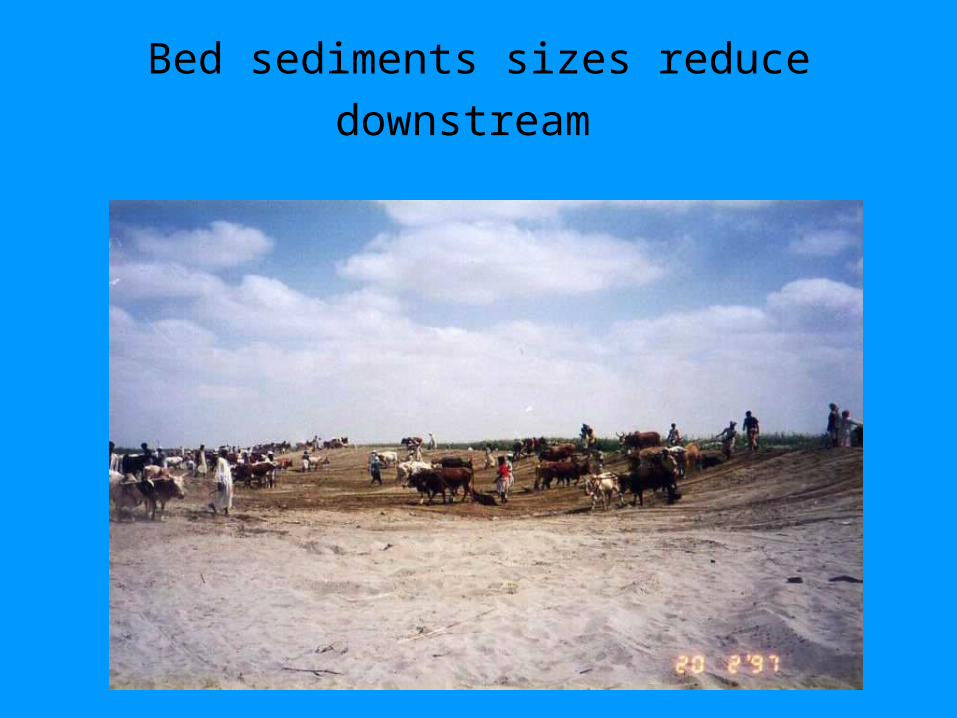
Bed sediments sizes reduce downstream

Sediment transport in wadi systems
Quantifying concentrations and size range of transported
sediments

Sediment supply
• Very little data is available on the sediment loads transported in wadis.
• Some information may be obtained through comparison with neighbouring catchments where data is available, or from regional sediment yield data.
• Measurement programmes are sometimes included in the design of major projects. A short focussed measurement programme can provide the essential data needed for the design of sediment control structures.
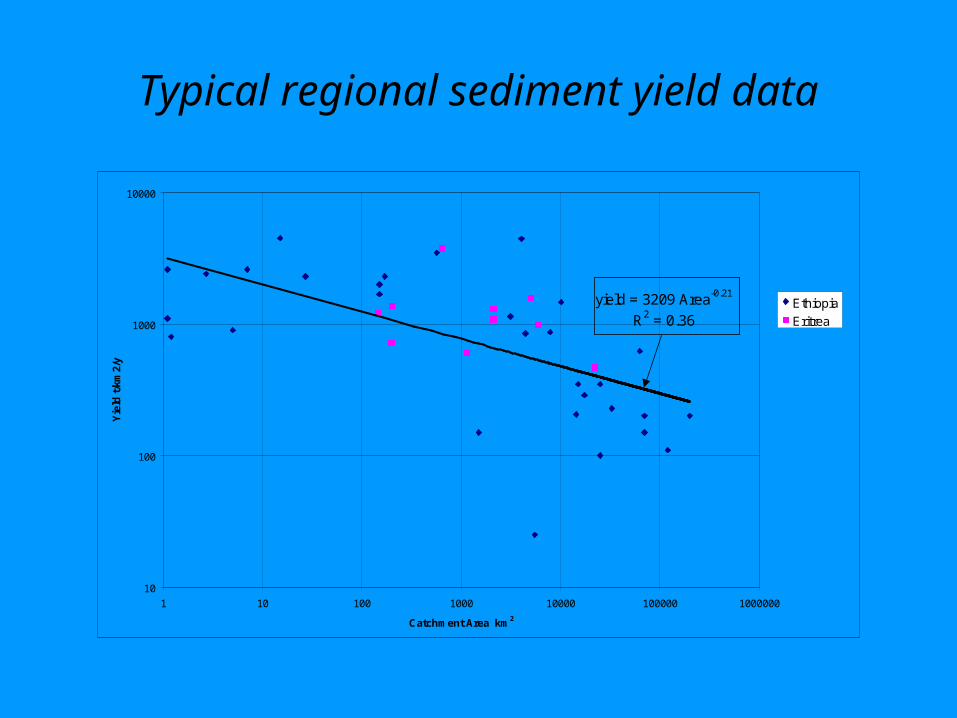
Typical regional sediment yield data
yield = 3209 Area-0.21
R2 = 0.36
10
100
1000
10000
1 10 100 1000 10000 100000 1000000
Catchment Area km2
Yie
ld t
/km
2/y
Ethiopia
Eritrea
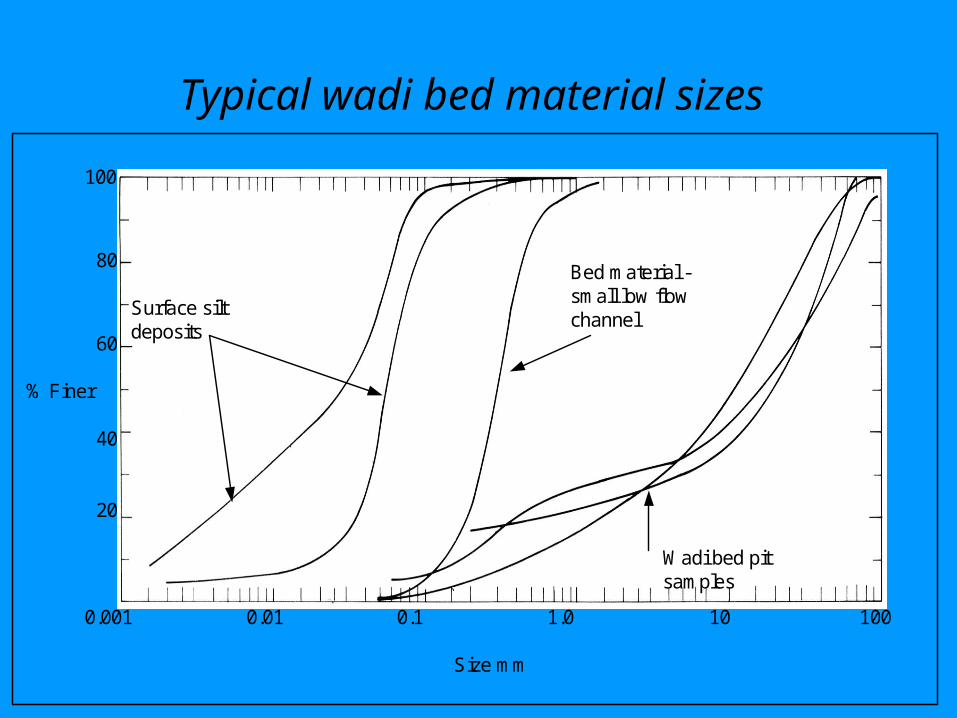
Typical wadi bed material sizes
Surface siltdeposits
Bed material -small low flowchannel
100101.00.10.010.001
Size mm
Wadi bed pitsamples
% Finer
100
80
60
40
20
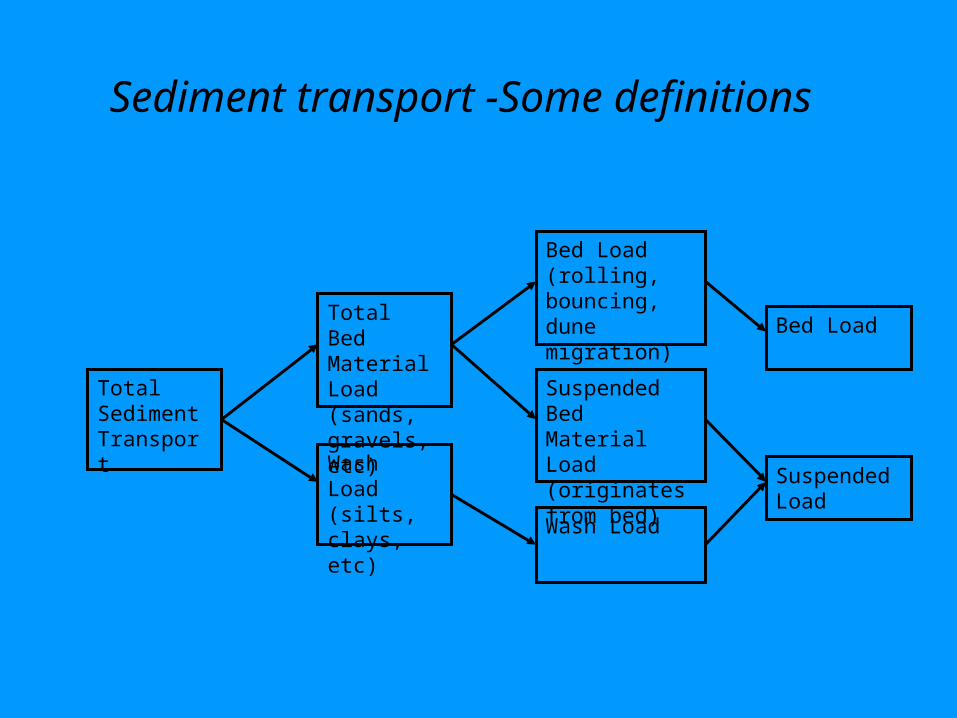
Sediment transport -Some definitions
TotalSedimentTransport
Total Bed Material Load (sands, gravels, etc)
WashLoad (silts, clays, etc)
Bed Load (rolling, bouncing, dune migration)
Suspended Bed Material Load (originates from bed)
Wash Load
Bed Load
Suspended Load
The components of a wadi sediment load
• Wash load. Transporting capacity in a wadi virtually unlimited, concentrations are supply controlled, wash load concentrations thus have to be measured.
• Suspended bed material load, sand sizes carried in suspension, sediment sizes and concentrations are related to local hydraulic conditions. Can be measured or approximately predicted using sediment transport equations.
• Bed load large sediments moving by sliding and bouncing close to the wadi bed. Very difficult to measure, usually predicted using bed load equations.
Sediment measurements
• Carried out at gauging sites at the same time as discharge measurements.
• Conventional sediment sampling methods not suitable for flood flows in wadis – very high flow velocities and large quantities of trash make it impossible to suspend samplers in the flow.
• Valuable data on wash load concentrations can be obtained without too many difficulties from surface dip samples.
• Information on suspended sand load, needed to aid the design of sediment control structures, can be obtained by pumping from fixed nozzles.
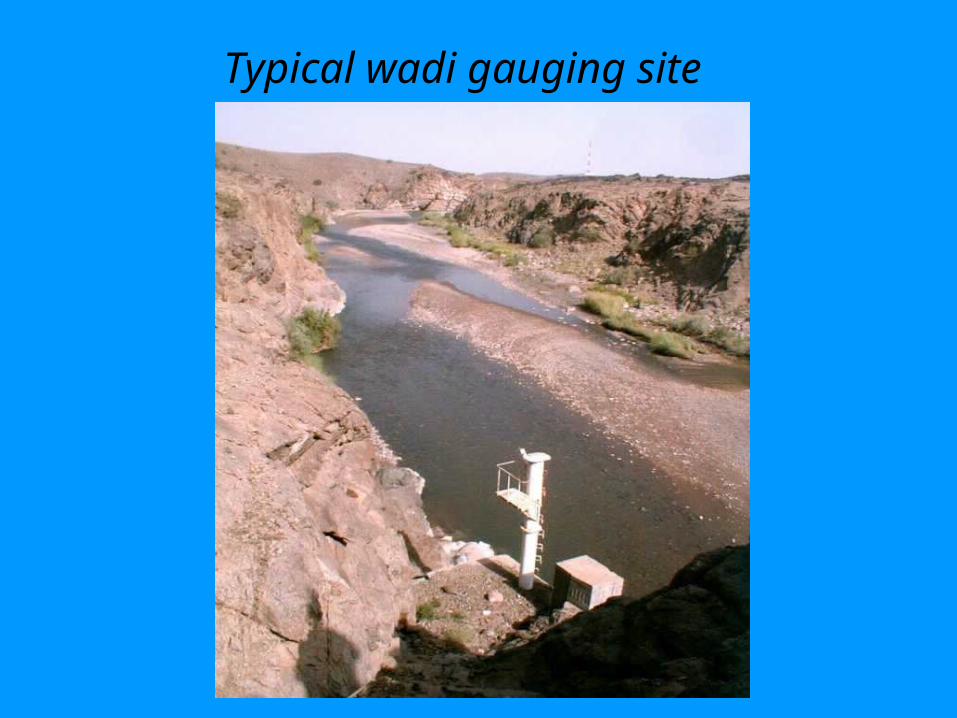
Typical wadi gauging site
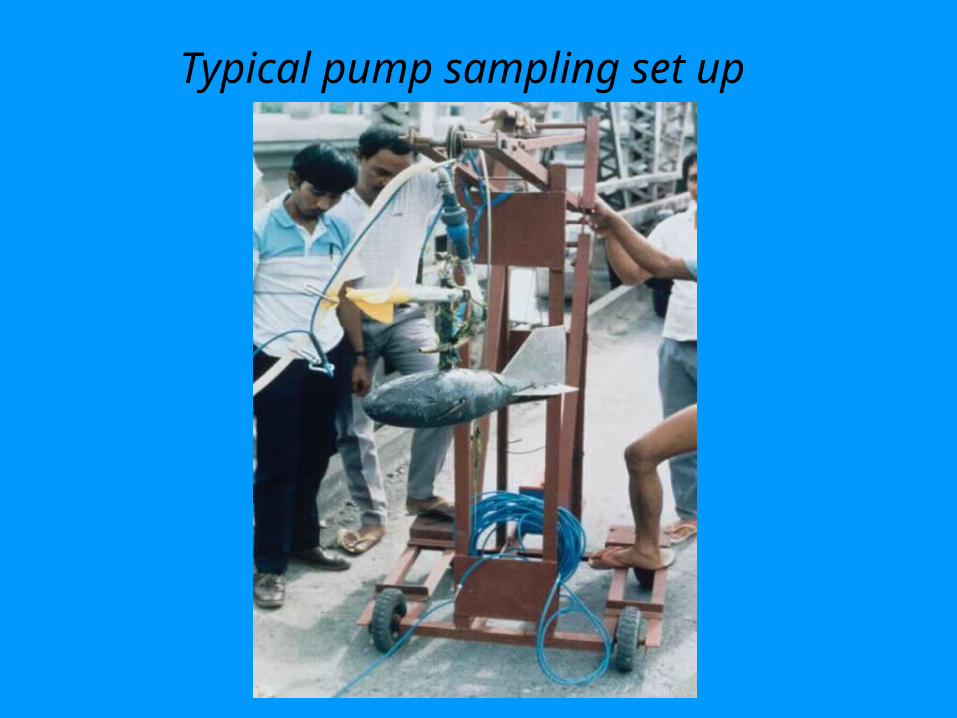
Typical pump sampling set up
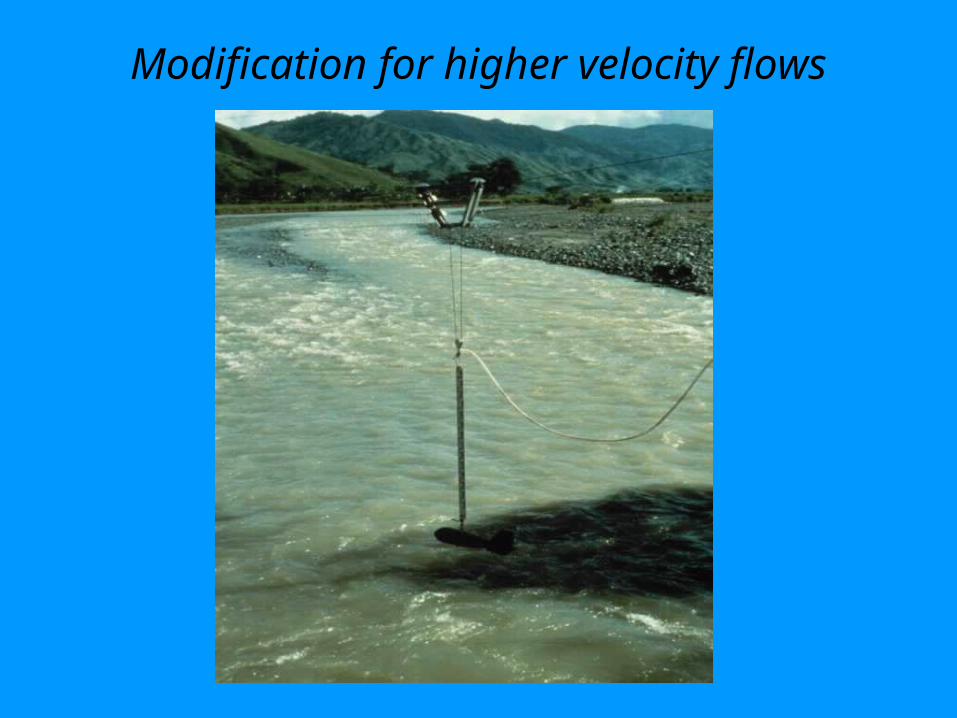
Modification for higher velocity flows
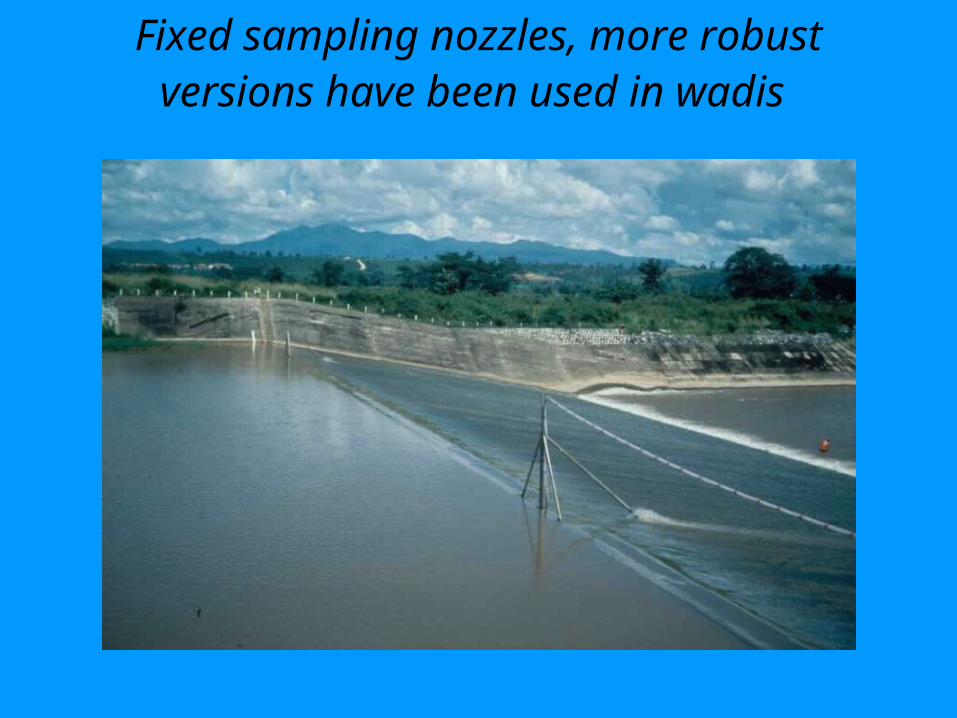
Fixed sampling nozzles, more robust versions have been used in wadis
Sediment rating relationships
• Unless automatic sampling equipment is used a gauging team has to camp at the gauging site over the “flood” season to ensure that samples are collected during significant flood events.
• Sediment concentration data is then used to develop correlations with wadi discharge.
• Separate relationships are developed for wash load and suspended bed material load.
• Bed load equations are used with site data describing the sediment sizes and hydraulic conditions to estimate bed load.
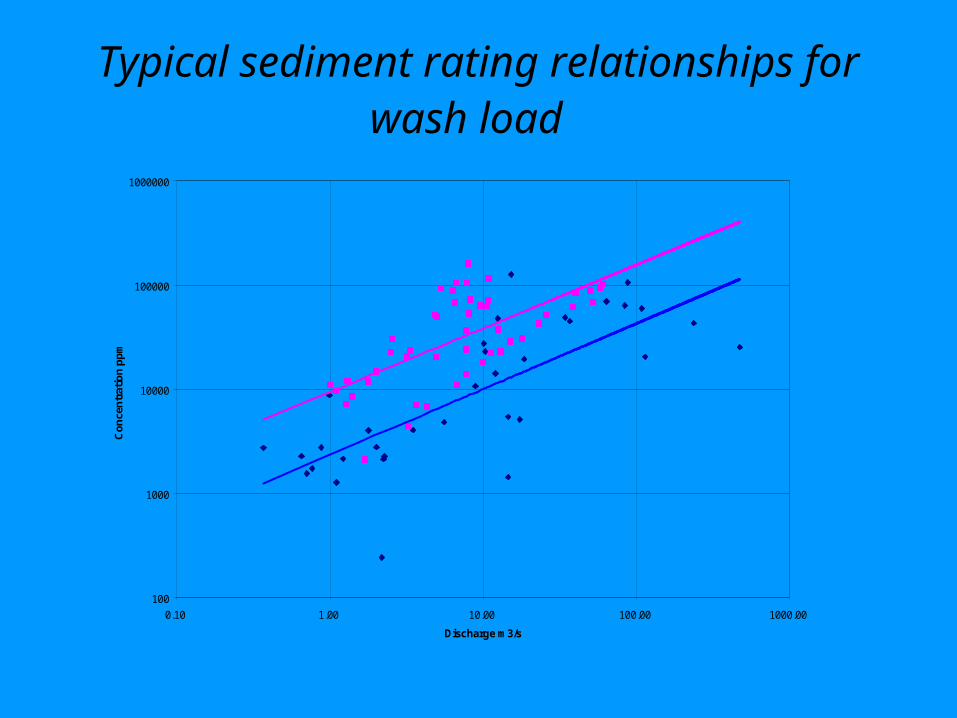
Typical sediment rating relationships for wash load
100
1000
10000
100000
1000000
0.10 1.00 10.00 100.00 1000.00
Discharge m3/s
Co
nce
ntr
atio
n p
pm
Examples of simple sediment rating
relationships for a Wadi
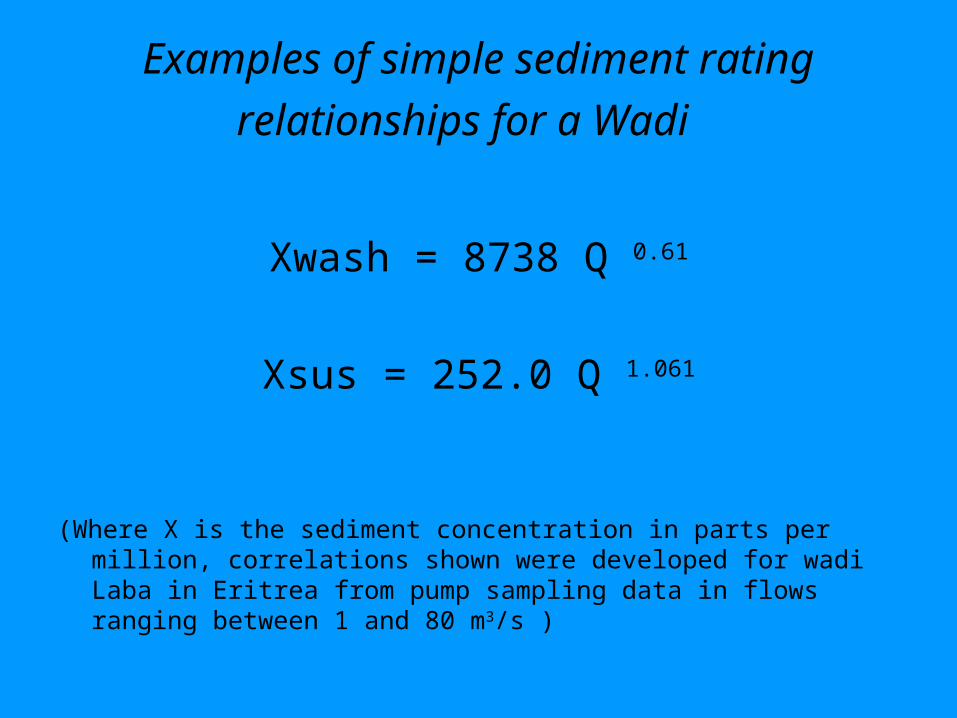
Xwash = 8738 Q 0.61
Xsus = 252.0 Q 1.061
(Where X is the sediment concentration in parts per million, correlations shown were developed for wadi Laba in Eritrea from pump sampling data in flows ranging between 1 and 80 m3/s )
Sediment sizes in transport
• Bed material load sediment sizes are needed to assist the design of sediment control structures.
• The sediment sizes moving as bed load and suspended bed material load can be estimated using a bed material size grading curve and sediment transport relationships.
• Suspended bed material sizes can also be derived from sediment samples if measurements have been made.
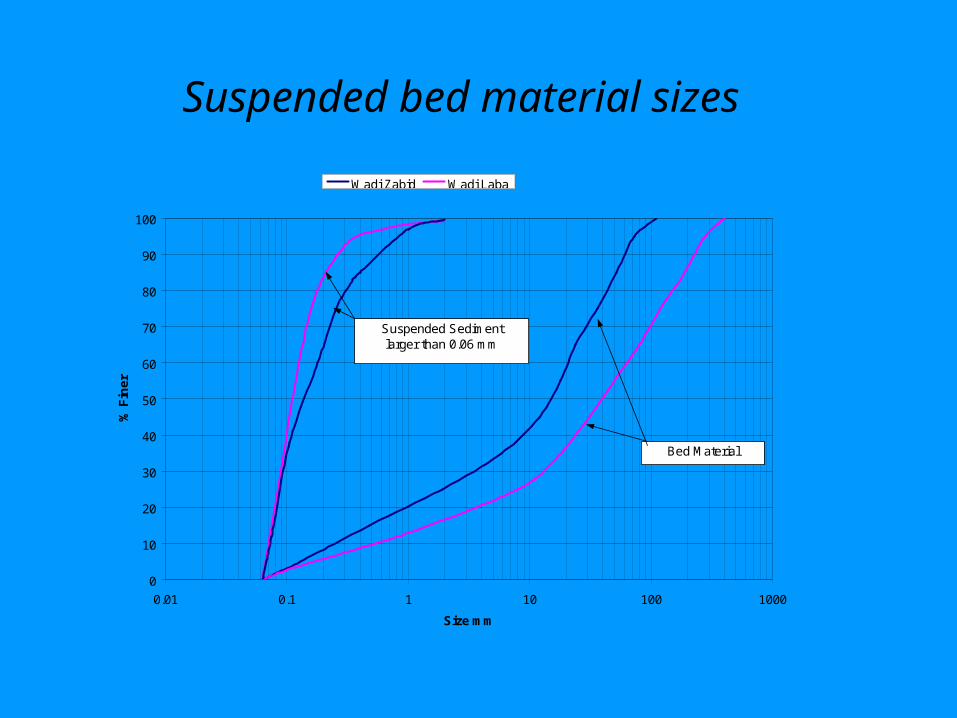
Suspended bed material sizes
0
10
20
30
40
50
60
70
80
90
100
0.01 0.1 1 10 100 1000
Size mm
% F
iner
Wadi Zabid Wadi LabaWadi Zabid Wadi Laba
Bed Material
Suspended Sediment larger than 0.06 mm
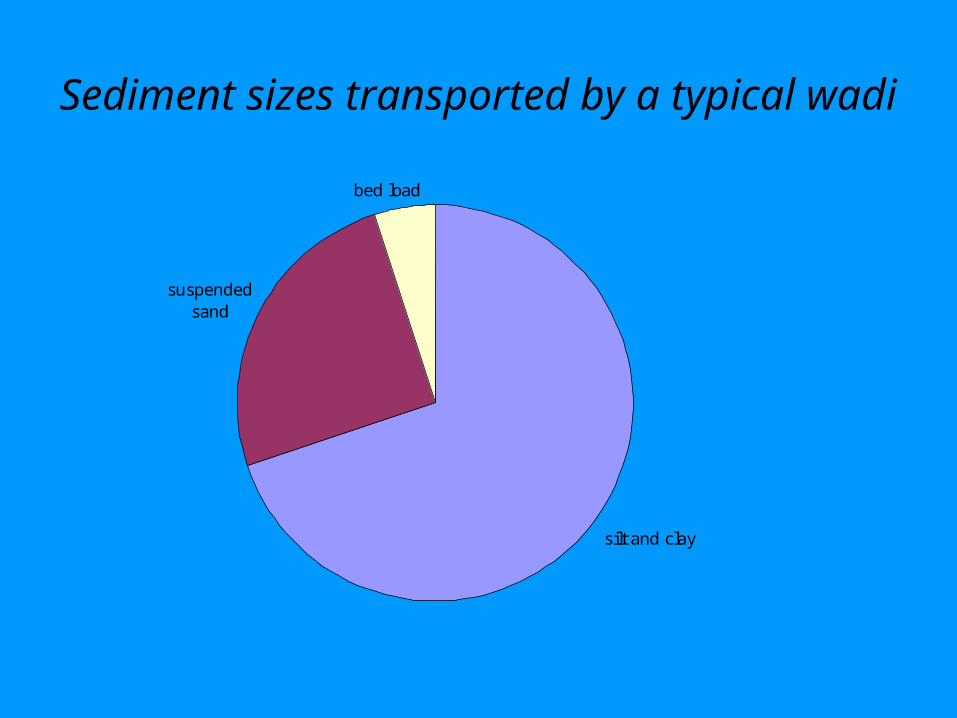
Sediment sizes transported by a typical wadi
silt and clay
suspended sand
bed load
Sediment transport in wadi systems
Sediment transport predictors
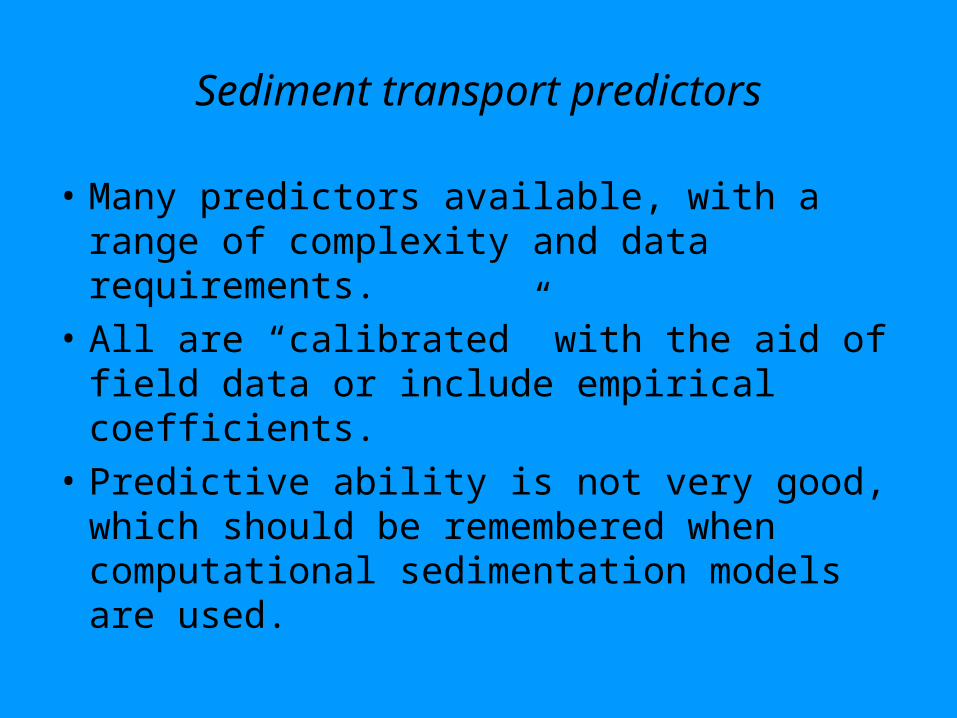
Sediment transport predictors
• Many predictors available, with a range of complexity and data requirements.
• All are “calibrated” with the aid of field data or include empirical coefficients.
• Predictive ability is not very good, which should be remembered when computational sedimentation models are used.
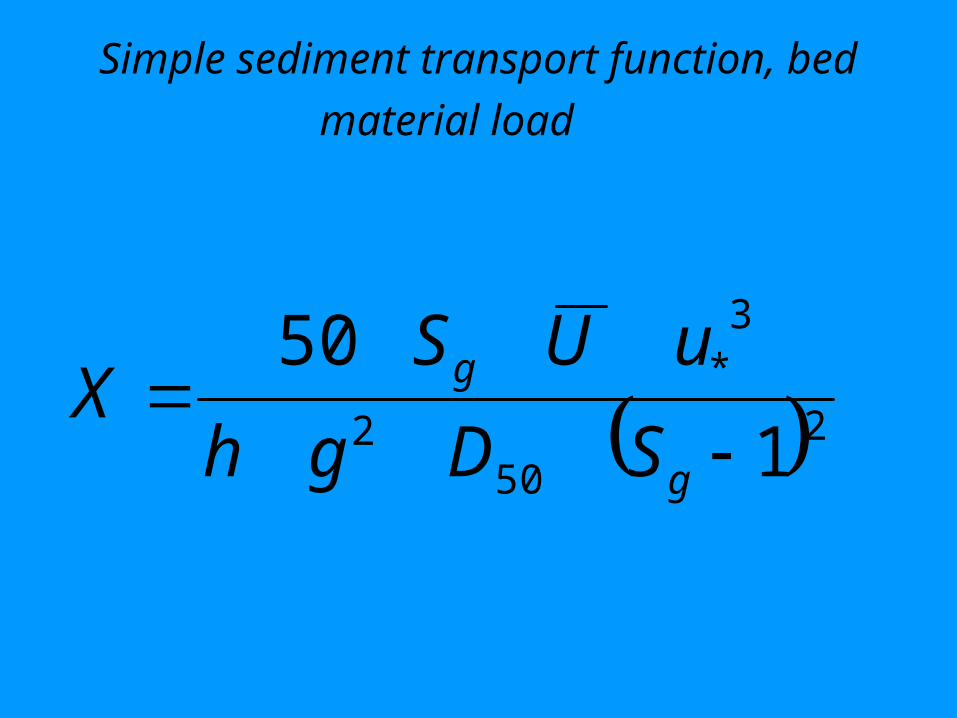
Simple sediment transport function, bed
material load
2502
3*
1
50
g
g
SDgh
uUSX
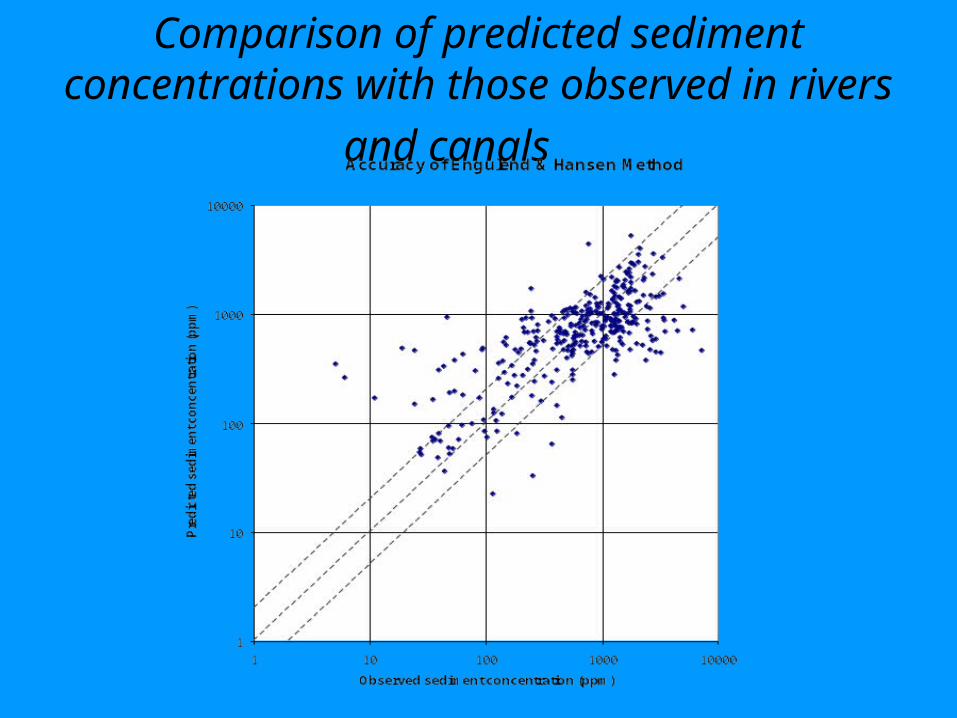
Comparison of predicted sediment concentrations with those observed in rivers
and canals
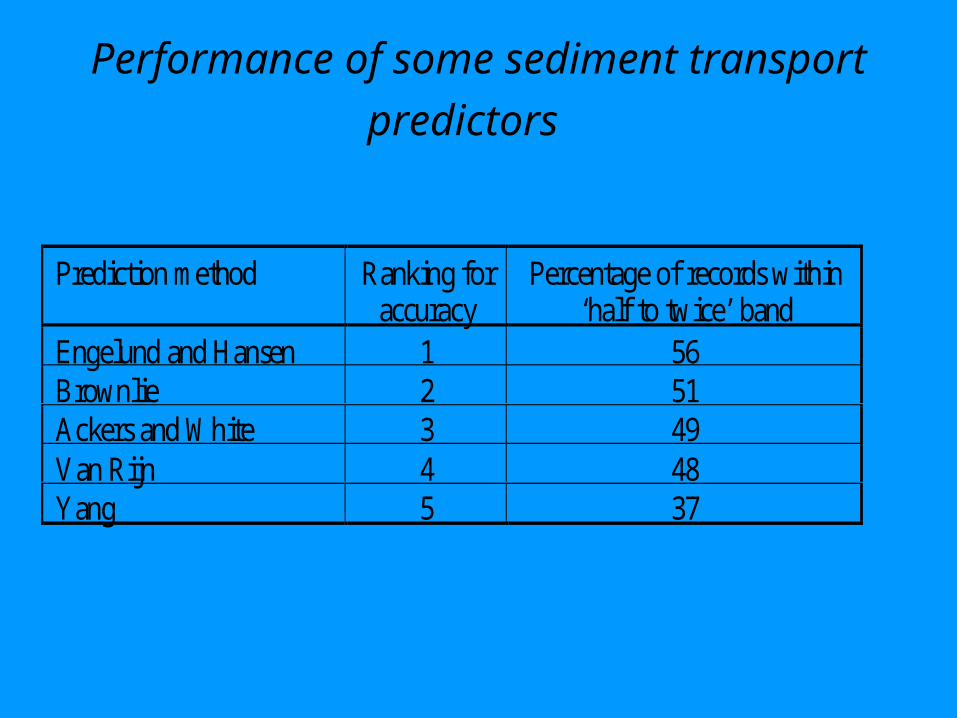
Performance of some sediment transport
predictors
Prediction method Ranking foraccuracy
Percentage of records within‘half to twice’ band
Engelund and Hansen 1 56Brownlie 2 51Ackers and White 3 49Van Rijn 4 48Yang 5 37