Embed Size (px)
Citation preview
This work is licensed under the Creative Commons Attribution 4.0 International License.
J Genet Resour2020;6(2): 95-105 Homepage: http://sc.journals.umz.ac.ir/
RESEARCH ARTICLE DOI: 10.22080/jgr.2020.18610.1181
Selection of Dwarf Stature Yield Potential Lines from F3 Populations
of White Maize (Zea mays L.)
Bodrun Nessa Shompa1, Kaniz Fatima2, Mohammad Jony1, Salma Sarker3, Md. Jafar Ullah2,
Abul Kashem Chowdhury4 and Jamilur Rahman1*
1 Department of Genetics and Plant Breeding, Sher-e-Bangla Agricultural University, Bangladesh 2 Department of Agronomy, Sher-e-Bangla Agricultural University, Bangladesh 3 Department of Plant Pathology, Sher-e-Bangla Agricultural University, Bangladesh 4 Department of Genetics and Plant Breeding, Patuakhali Science and Technology University,
Bangladesh
A R T I C L E I N F O A B S T R A C T Article history: Received 01 April 2020
Accepted 05 June 2020
Available online 14 June 2020
‘Dwarf stature’ maize variety offers promises to withstand unfavorable growth
environments of Kharif season. But, for developing such variety, dwarf stature
inbred lines must be available. Here, twenty-four F3 populations of white maize
were evaluated though assessment of their genetic variability, heritability, and
character association for selection of dwarf stature promising lines based on
yield and growth parameters. The populations were developed from F1 hybrids
following the pedigree breeding method. Analysis of genetic variability showed
that significant variations existed among the populations and the growth
characters viz., plant height, cob height, number of grains row-1, and yield plant-
1 showed the highest heritability and genetic advance. The correlation revealed
that yield plant-1 was positively and significantly associated with plant height,
cob length, cob diameter, and grains row-1. The path coefficient analysis
indicated that plant height, cob length, cob diameter, rows cob-1, grains row-1
and 100-grain weight had positive and direct contributions towards yield
indicating that these yield attributes might be considered for selection. Finally,
based upon the criteria viz., plant height, maturity, base diameter, cob height,
and yield potential, the lines G14 and G4 may be selected for high grain yield,
while the lines G10, G11, G12, G1, G3, and G16 might be selected as
promising dwarf stature lines for developing inbred lines.
2020 UMZ. All rights reserved.
Keywords: Heritability
Genetic advance
Correlation
Path coefficient
White maize
*Corresponding authors:
J. Rahman
p-ISSN 2423-4257
e-ISSN 2588-2589
Please cite this paper as: Shompa BN, Fatima K, Jony M, Sarker S, Ullah MJ, Chowdhury AK, Rahman J. 2020. Selection of dwarf
stature yield potential lines from F3 populations of white maize (Zea mays L.). J Genet Resour 6(2): 95-105. doi:
10.22080/jgr.2020.18610.1181
Introduction
Sustainable crop production is a major challenge
posed by global climate changes coupled with
ever-rising population pressure. Plant breeding is
one of the means to cope with this challenge
through the generation of new crop varieties
manipulating genetic make-up to have a
tolerance to unfavorable growth environments
(Ceccarelli et al., 2010). Being a C4 plant and
due to its higher adaptive ability at the
unfavorable growth conditions, maize is
considered to be a grain crop having higher yield
productivity compared to other cereals e.g. rice
and wheat (Ullah et al., 2019). Rising global
temperature, harsh light intensity, poor soil-
fertility, trending pest, and disease infestations,
lowering soil moisture layer and occurrence of
drought are the major environmental constraints
that hinder crop production to which maize has
been proved to perform better than other grain-
producing crops especially than rice and wheat
(Kumar et al., 2012). To mitigate the ongoing
climate change challenges and sustain generating
climate-resilient crops through breeding efforts
incorporating novel key features viz., early

Shompa et al., J Genet Resour, 2020; 6(2): 95-105
96
maturity, dwarf stature, drought, salinity
tolerance, etc. is the only option to grow crops
under such harsh unfavorable growth
environments.
Maize holds the third position among the cereal
crops after wheat and rice in the world
concerning acreage and production (Beulah et
al., 2018). In Bangladesh, maize is
comparatively a new crop, but the crop has
gained rapid popularity since the 2000s (Ullah et
al., 2017). The cultivated area of maize in
Bangladesh has significantly increased to 990
thousand acres and recently the crop ranks in 2nd
position in terms of both cultivated areas and
production after rice (BBS, 2018). In Bangladesh
maize is cultivated in Rabi and Kharif seasons.
The yield is comparatively lower in Kharif
(summer and rainy) than that of the Rabi
(winter) season. Lower yield production in
Kharif season is due to unfavorable climatic
conditions of the season such as strong wind,
heavy rainfall, interrupted sunshine due to cloud
cover, thunderstorm as well as few spells of
drought in the growth period. Nevertheless,
Kharif season has more opportunity for further
horizontal expansion of maize cultivation in
Bangladesh, because in this season the crop
undergoes lesser crop-competition than that in
rabi season. Hence, there is an ample opportunity
for expanding maize cultivation in Bangladesh in
Kharif season provided the appropriate maize
variety developed for cultivation in this season.
As many crops have to be grown only in Rabi
season, the scope lies for the farmers to grow
maize in the late Rabi in February or at the early
part of Kharif season in March to May in the
Kharif season. In this season crop production in
Bangladesh is posed to occasional moderately to
heavy storm (Kalboishakhi) which causes either
breaking or lodging of the standing maize crop.
To overcome this constraint and grow maize in
the Kharif season, developing ‘dwarf stature’
maize varieties is an urgent issue which could be
tolerant to such turbulent stormy, windy, drought
conditions that prevail generally in the season.
The key breeding features of dwarf stature maize
include having a higher base diameter, dwarf
plant stature, lower cob position on the plant (at
the middle height of the plant), erect leaves with
lower angle orientation, early maturity and
higher yield productivity. Unfortunately, most of
the available commercial maize varieties found
in Bangladesh are tall-type (e.g. plant height
>200cm), long duration (e.g. mature at >130-140
days), etc. (BARI, 2018) and hence, the varieties
are not appropriate for cultivation in Kharif
season. If a dwarf stature maize variety could be
developed through incorporating the above-
mentioned plant breeding features, the new
breeds would complete the life cycle within a
shorter period escaping the harsh environmental
hazards at the pre- or post-tasseling stage. The
literature review manifests that till to date very
little or sporadic attempts were taken to develop
such dwarf stature, early maturity and yield
potential appropriate varieties of maize for
cultivation in Kharif season in Bangladesh
(Amiruzzaman et al., 2013; Khan et al., 2013;
Matin et al., 2016; Karim et al., 2018).
The availability of appropriate maize inbred
lines is a prerequisite for developing promising
maize variety. Developing potential inbred lines
is a fundamental research approach in maize
breeding programs; the success of this depends
mainly on the selection of desirable lines from
the early segregating generations. In the
subsequent generations, the lines are further
advanced through self-fertilization to reach the
homozygosity of the lines which are used as
parental inbred lines in the hybrid breeding
program (Kumar et al., 2013). Usually, desirable
breeding lines are selected through assessment of
their genetic variability, heritability, genetic
advance, etc. (Mishra et al., 2015). Also,
correlation and path coefficient analyses are
applied for the selection of yield contributing
traits and thus these techniques help in the
understanding of effective selection criteria for
yield improvement (Hossain et al., 2015).
This study aimed to develop promising dwarf
stature promising inbred lines of white maize to
use them further as parental lines for developing
dwarf stature hybrid maize varieties. In this
study, we investigated twenty-four F3
populations of white maize to screen out the
promising short stature, early maturity, and yield
potential lines by studying their genetic
variability, heritability, genetic advance,
correlation, and path analyses. The selected lines
are subject to be further advanced to the F5 stage
through self-fertilization to develop stable
homozygous inbred lines.

Shompa et al., J Genet Resour, 2020; 6(2): 95-105
97
Materials and Methods
Plant materials and growth conditions
Twenty-four (24) F3 populations of white maize
were used in the present investigation (Table 1).
These F3 populations were generated from
successive three generations obtained through
self-fertilization of eight selected F1 hybrids
following the principles of the pedigree breeding
method at the Department of Genetics and Plant
Breeding, Sher-e-Bangla Agricultural University
(SAU), Dhaka-1207 during 2015 to 2018.
Table 1. List of twenty-four F3 populations of white
maize used in the experiment Line Pedigree Line Pedigree
G1 Plough- 201- F3- S1 G13 PSC-121- F3- S1
G2 Plough-201- F3- S2 G14 PSC-121- F3- S2
G3 Plough-201- F3- S3 G15 PSC-121- F3- S3
G4 KS-510- F3- S1 G16 Q-Xiangnuo-1- F3- S1
G5 KS-510- F3- S2 G17 Q-Xiangnuo-1- F3- S2
G6 KS-510- F3- S3 G18 Q-Xiangnuo-1- F3- S3
G7 Changnuo-6- F3- S1 G19 Youngnuo-3000- F3- S1
G8 Changnuo-6- F3- S2 G20 Youngnuo-3000- F3- S2
G9 Changnuo-6- F3- S3 G21 Youngnuo-3000- F3- S3
G10 Youngnuo-7- F3-S1 G22 Changnuo-1-F3- S1
G11 Youngnuo-7- F3-S2 G23 Changnuo-1-F3- S2
G12 Youngnuo-7- F3-S3 G24 Changnuo-1-F3- S3
This experiment was conducted using a
randomized complete block design (RCBD) with
three replications for each twenty-four F3
population. Seeds of the F3 population were
sown using the line-sowing method maintaining
the spacing of 60cm×25cm in a separate block
(3×3m2) for every twenty-four populations. For
raising good and healthy seedlings, seeds were
treated with Sevin @ 2.0 g/kg of seed before
sowing the seeds. All the recommended
agronomic package of practices such as thinning,
earthen up, fertilizer application, irrigation,
weeding, insecticides spraying, etc. was
performed as recommended for commercial
maize production according to BARI annual
report 2017-18 (BARI, 2018).
Plant parameters recorded
Sixteen parameters related to growth and yield
contributing traits were measured in different
growing periods of the crop. Five plants for each
population were randomly selected to measure
sixteen parameters viz. plant height (cm), days to
6th leaf stage, days to 50% tasseling, days to 50%
silking, cob position (height) above the soil
surface (cm), days to maturity, base diameter of
the stem above the soil surface (cm), number of
leaves plant-1, number of branches tassel-1,
number cob bearing nodes from the soil surface,
cob length (cm), cob circumference (cm),
number of rows cob-1, number of grains row-1,
100-grain weight (g) and yield plant-1 (g).
Estimations and analysis
The genetic variability was estimated for all
genotypes according to the formula given by
Cochran and Cox (1957). The estimation of
heritability, genetic advance and genetic advance
mean’s percentage was calculated according to
Comstock and Robinson (1952). The genotypic
and phenotypic correlation coefficient and path
co-efficient were measured according to Dewey
and Lu (1959). Statistical software Statistix10
and Genstat v.2017 which were used by subject
to the analysis of variance for different
characters was carried out using mean data of
three replications to assess the genetic variability
among genotypes. The level of significance was
tested both at 5% and 1% using the F test.
Results
Growth and yield-related traits
Twenty-four F3 populations of white maize were
characterized by evaluating sixteen growth and
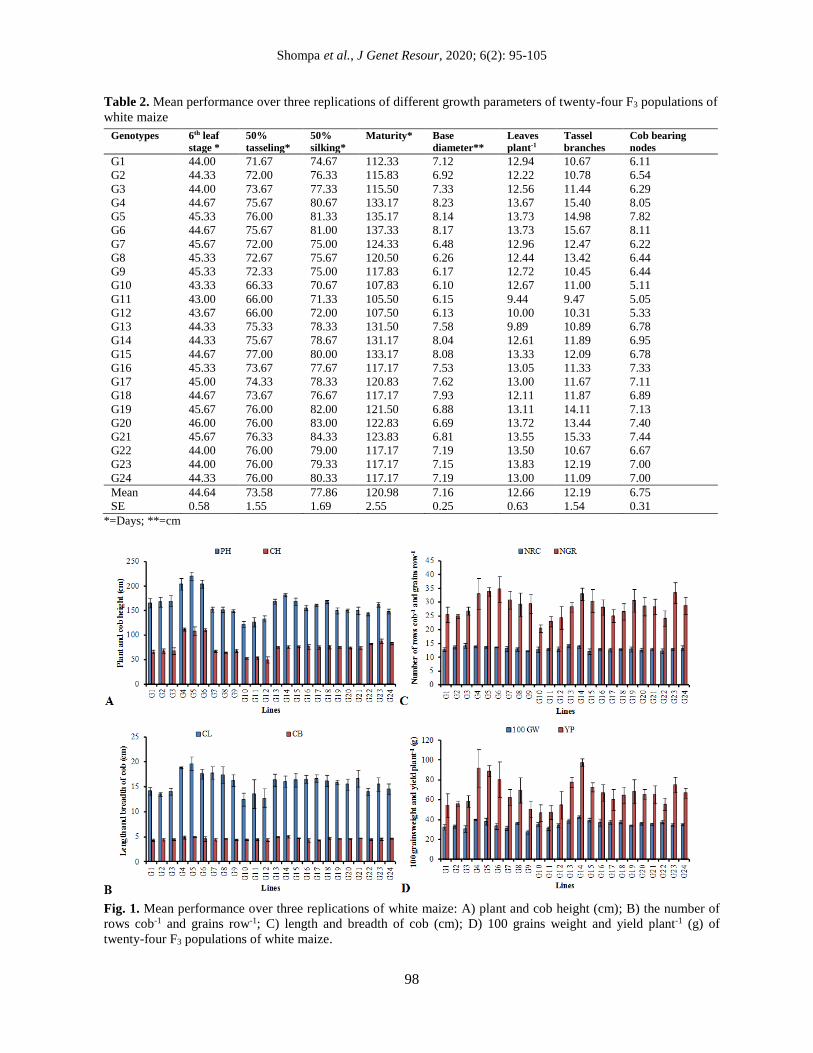
yield parameters (Table 2 and Fig. 1). The
average days to 6th leaf stage was recorded to be
44.64 with a range from 43.00 (G11) to 46.00
(G20), while the average days of 50% tasseling
were recorded to be 73.58 with a range from
66.00 to 77.00 and among the observed lines,
G11 and G12 were the earliest male flowering
lines (Table 2). The average days to 50% silking
was recorded 77.86 days with a range from
70.67 to 84.33, where minimum duration (70.67
days) of 50% silking was observed in the G10
line followed by G11 (71.33 days) and G12
(72.00 days). The minimum time (105.50 day) of
maturity was found in the line G11 followed by
G12 (107.50 days) and G10 (107.83 days) (Table
2). The highest plant height (220.61 cm) and cob
height (111.33 cm) were observed in G5 and G4
lines, respectively; while the lowest values
(122.33, 49.72 cm) were recorded in G10 and
G12 lines, respectively (Fig. 1A).
Shompa et al., J Genet Resour, 2020; 6(2): 95-105
98
Table 2. Mean performance over three replications of different growth parameters of twenty-four F3 populations of
white maize
Genotypes 6th leaf
stage *
50%
tasseling*
50%
silking*
Maturity* Base
diameter**
Leaves
plant-1
Tassel
branches
Cob bearing
nodes
G1 44.00 71.67 74.67 112.33 7.12 12.94 10.67 6.11
G2 44.33 72.00 76.33 115.83 6.92 12.22 10.78 6.54
G3 44.00 73.67 77.33 115.50 7.33 12.56 11.44 6.29
G4 44.67 75.67 80.67 133.17 8.23 13.67 15.40 8.05
G5 45.33 76.00 81.33 135.17 8.14 13.73 14.98 7.82
G6 44.67 75.67 81.00 137.33 8.17 13.73 15.67 8.11
G7 45.67 72.00 75.00 124.33 6.48 12.96 12.47 6.22
G8 45.33 72.67 75.67 120.50 6.26 12.44 13.42 6.44
G9 45.33 72.33 75.00 117.83 6.17 12.72 10.45 6.44
G10 43.33 66.33 70.67 107.83 6.10 12.67 11.00 5.11
G11 43.00 66.00 71.33 105.50 6.15 9.44 9.47 5.05
G12 43.67 66.00 72.00 107.50 6.13 10.00 10.31 5.33
G13 44.33 75.33 78.33 131.50 7.58 9.89 10.89 6.78
G14 44.33 75.67 78.67 131.17 8.04 12.61 11.89 6.95
G15 44.67 77.00 80.00 133.17 8.08 13.33 12.09 6.78
G16 45.33 73.67 77.67 117.17 7.53 13.05 11.33 7.33
G17 45.00 74.33 78.33 120.83 7.62 13.00 11.67 7.11
G18 44.67 73.67 76.67 117.17 7.93 12.11 11.87 6.89
G19 45.67 76.00 82.00 121.50 6.88 13.11 14.11 7.13
G20 46.00 76.00 83.00 122.83 6.69 13.72 13.44 7.40
G21 45.67 76.33 84.33 123.83 6.81 13.55 15.33 7.44
G22 44.00 76.00 79.00 117.17 7.19 13.50 10.67 6.67
G23 44.00 76.00 79.33 117.17 7.15 13.83 12.19 7.00
G24 44.33 76.00 80.33 117.17 7.19 13.00 11.09 7.00
Mean 44.64 73.58 77.86 120.98 7.16 12.66 12.19 6.75
SE 0.58 1.55 1.69 2.55 0.25 0.63 1.54 0.31
*=Days; **=cm
Fig. 1. Mean performance over three replications of white maize: A) plant and cob height (cm); B) the number of
rows cob-1 and grains row-1; C) length and breadth of cob (cm); D) 100 grains weight and yield plant-1 (g) of
twenty-four F3 populations of white maize.
Shompa et al., J Genet Resour, 2020; 6(2): 95-105
99
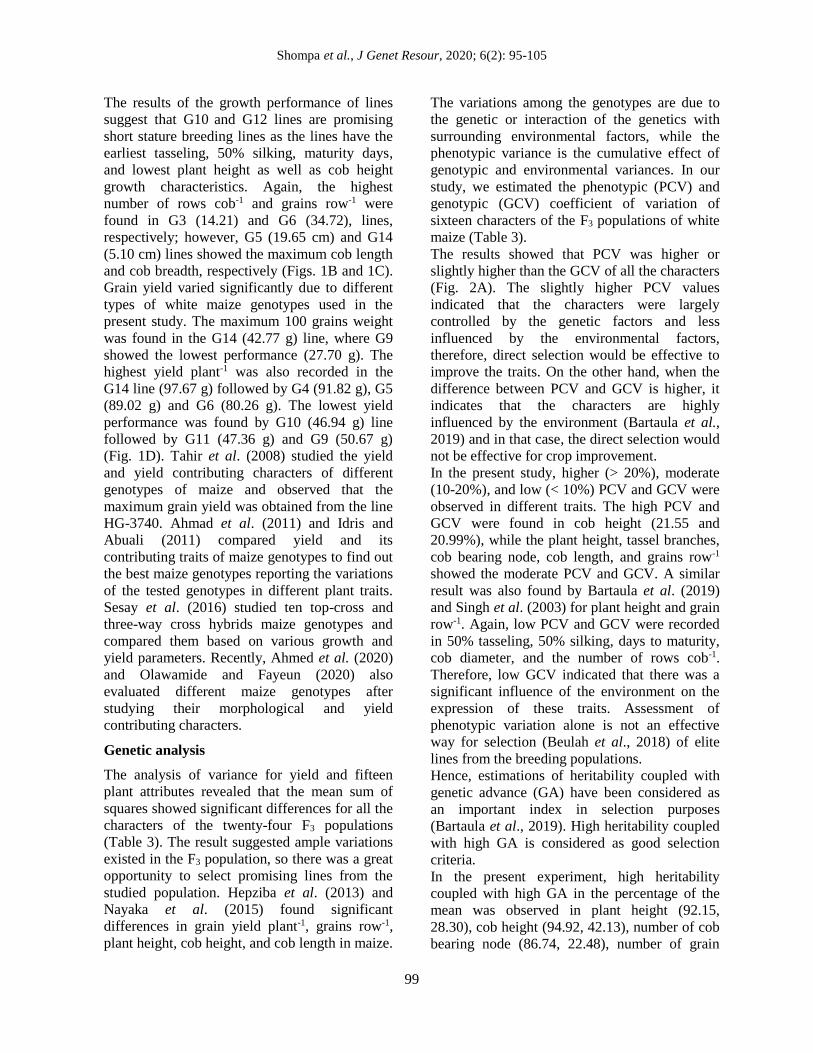
The results of the growth performance of lines
suggest that G10 and G12 lines are promising
short stature breeding lines as the lines have the
earliest tasseling, 50% silking, maturity days,
and lowest plant height as well as cob height
growth characteristics. Again, the highest
number of rows cob-1 and grains row-1 were
found in G3 (14.21) and G6 (34.72), lines,
respectively; however, G5 (19.65 cm) and G14
(5.10 cm) lines showed the maximum cob length
and cob breadth, respectively (Figs. 1B and 1C).
Grain yield varied significantly due to different
types of white maize genotypes used in the
present study. The maximum 100 grains weight
was found in the G14 (42.77 g) line, where G9
showed the lowest performance (27.70 g). The
highest yield plant-1 was also recorded in the
G14 line (97.67 g) followed by G4 (91.82 g), G5
(89.02 g) and G6 (80.26 g). The lowest yield
performance was found by G10 (46.94 g) line
followed by G11 (47.36 g) and G9 (50.67 g)
(Fig. 1D). Tahir et al. (2008) studied the yield
and yield contributing characters of different
genotypes of maize and observed that the
maximum grain yield was obtained from the line
HG-3740. Ahmad et al. (2011) and Idris and
Abuali (2011) compared yield and its
contributing traits of maize genotypes to find out
the best maize genotypes reporting the variations
of the tested genotypes in different plant traits.
Sesay et al. (2016) studied ten top-cross and
three-way cross hybrids maize genotypes and
compared them based on various growth and
yield parameters. Recently, Ahmed et al. (2020)
and Olawamide and Fayeun (2020) also
evaluated different maize genotypes after
studying their morphological and yield
contributing characters.
Genetic analysis
The analysis of variance for yield and fifteen
plant attributes revealed that the mean sum of
squares showed significant differences for all the
characters of the twenty-four F3 populations
(Table 3). The result suggested ample variations
existed in the F3 population, so there was a great
opportunity to select promising lines from the
studied population. Hepziba et al. (2013) and
Nayaka et al. (2015) found significant
differences in grain yield plant-1, grains row-1,
plant height, cob height, and cob length in maize.
The variations among the genotypes are due to
the genetic or interaction of the genetics with
surrounding environmental factors, while the
phenotypic variance is the cumulative effect of
genotypic and environmental variances. In our
study, we estimated the phenotypic (PCV) and
genotypic (GCV) coefficient of variation of
sixteen characters of the F3 populations of white
maize (Table 3).
The results showed that PCV was higher or
slightly higher than the GCV of all the characters
(Fig. 2A). The slightly higher PCV values
indicated that the characters were largely
controlled by the genetic factors and less
influenced by the environmental factors,
therefore, direct selection would be effective to
improve the traits. On the other hand, when the
difference between PCV and GCV is higher, it
indicates that the characters are highly
influenced by the environment (Bartaula et al.,
2019) and in that case, the direct selection would
not be effective for crop improvement.
In the present study, higher (> 20%), moderate
(10-20%), and low (< 10%) PCV and GCV were
observed in different traits. The high PCV and
GCV were found in cob height (21.55 and
20.99%), while the plant height, tassel branches,
cob bearing node, cob length, and grains row-1
showed the moderate PCV and GCV. A similar
result was also found by Bartaula et al. (2019)
and Singh et al. (2003) for plant height and grain
row-1. Again, low PCV and GCV were recorded
in 50% tasseling, 50% silking, days to maturity,
cob diameter, and the number of rows cob-1.
Therefore, low GCV indicated that there was a
significant influence of the environment on the
expression of these traits. Assessment of
phenotypic variation alone is not an effective
way for selection (Beulah et al., 2018) of elite
lines from the breeding populations.
Hence, estimations of heritability coupled with
genetic advance (GA) have been considered as
an important index in selection purposes
(Bartaula et al., 2019). High heritability coupled
with high GA is considered as good selection
criteria.
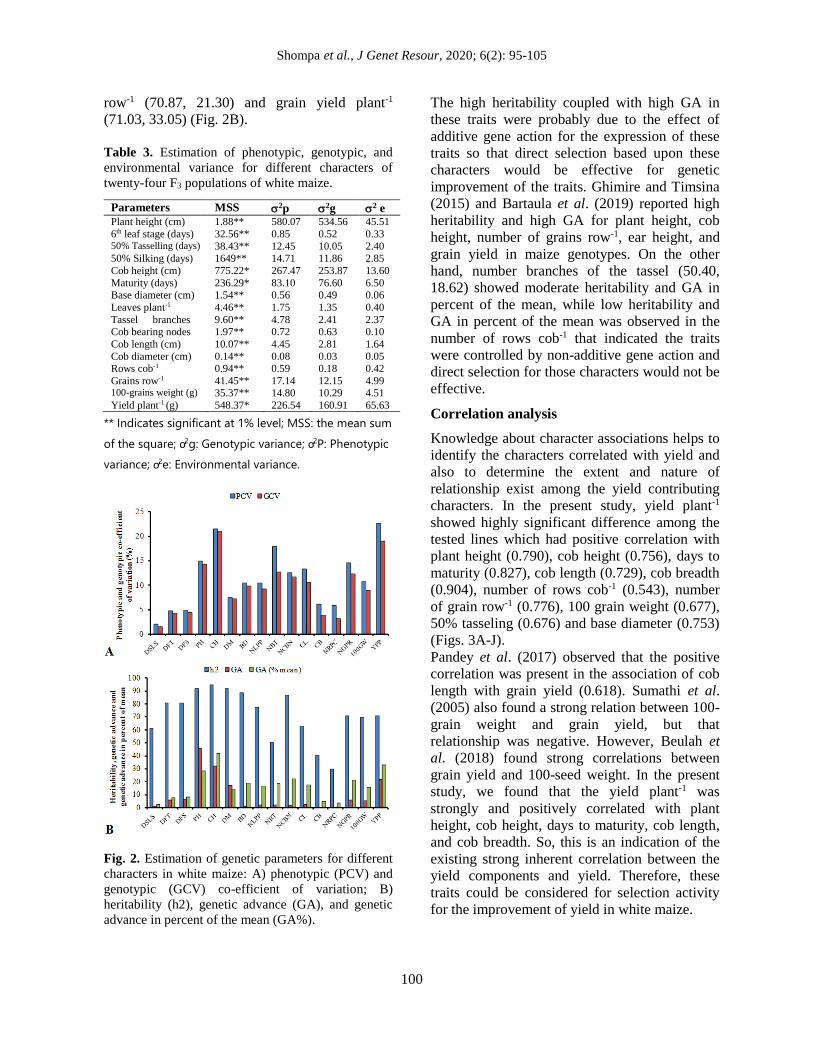
In the present experiment, high heritability
coupled with high GA in the percentage of the
mean was observed in plant height (92.15,
28.30), cob height (94.92, 42.13), number of cob
bearing node (86.74, 22.48), number of grain
Shompa et al., J Genet Resour, 2020; 6(2): 95-105
100
row-1 (70.87, 21.30) and grain yield plant-1
(71.03, 33.05) (Fig. 2B).
Table 3. Estimation of phenotypic, genotypic, and
environmental variance for different characters of
twenty-four F3 populations of white maize.
Parameters MSS 2p 2g 2 e Plant height (cm) 1.88** 580.07 534.56 45.51
6th leaf stage (days) 32.56** 0.85 0.52 0.33 50% Tasselling (days) 38.43** 12.45 10.05 2.40 50% Silking (days) 1649** 14.71 11.86 2.85
Cob height (cm) 775.22* 267.47 253.87 13.60
Maturity (days) 236.29* 83.10 76.60 6.50 Base diameter (cm) 1.54** 0.56 0.49 0.06
Leaves plant-1 4.46** 1.75 1.35 0.40
Tassel branches 9.60** 4.78 2.41 2.37 Cob bearing nodes 1.97** 0.72 0.63 0.10
Cob length (cm) 10.07** 4.45 2.81 1.64
Cob diameter (cm) 0.14** 0.08 0.03 0.05 Rows cob-1 0.94** 0.59 0.18 0.42
Grains row-1 41.45** 17.14 12.15 4.99 100-grains weight (g) 35.37** 14.80 10.29 4.51
Yield plant-1 (g) 548.37* 226.54 160.91 65.63
** Indicates significant at 1% level; MSS: the mean sum
of the square; ơ2g: Genotypic variance; ơ2P: Phenotypic
variance; ơ2e: Environmental variance.
Fig. 2. Estimation of genetic parameters for different
characters in white maize: A) phenotypic (PCV) and
genotypic (GCV) co-efficient of variation; B)
heritability (h2), genetic advance (GA), and genetic
advance in percent of the mean (GA%).
The high heritability coupled with high GA in
these traits were probably due to the effect of
additive gene action for the expression of these
traits so that direct selection based upon these
characters would be effective for genetic
improvement of the traits. Ghimire and Timsina
(2015) and Bartaula et al. (2019) reported high
heritability and high GA for plant height, cob
height, number of grains row-1, ear height, and
grain yield in maize genotypes. On the other
hand, number branches of the tassel (50.40,
18.62) showed moderate heritability and GA in
percent of the mean, while low heritability and
GA in percent of the mean was observed in the
number of rows cob-1 that indicated the traits
were controlled by non-additive gene action and
direct selection for those characters would not be
effective.
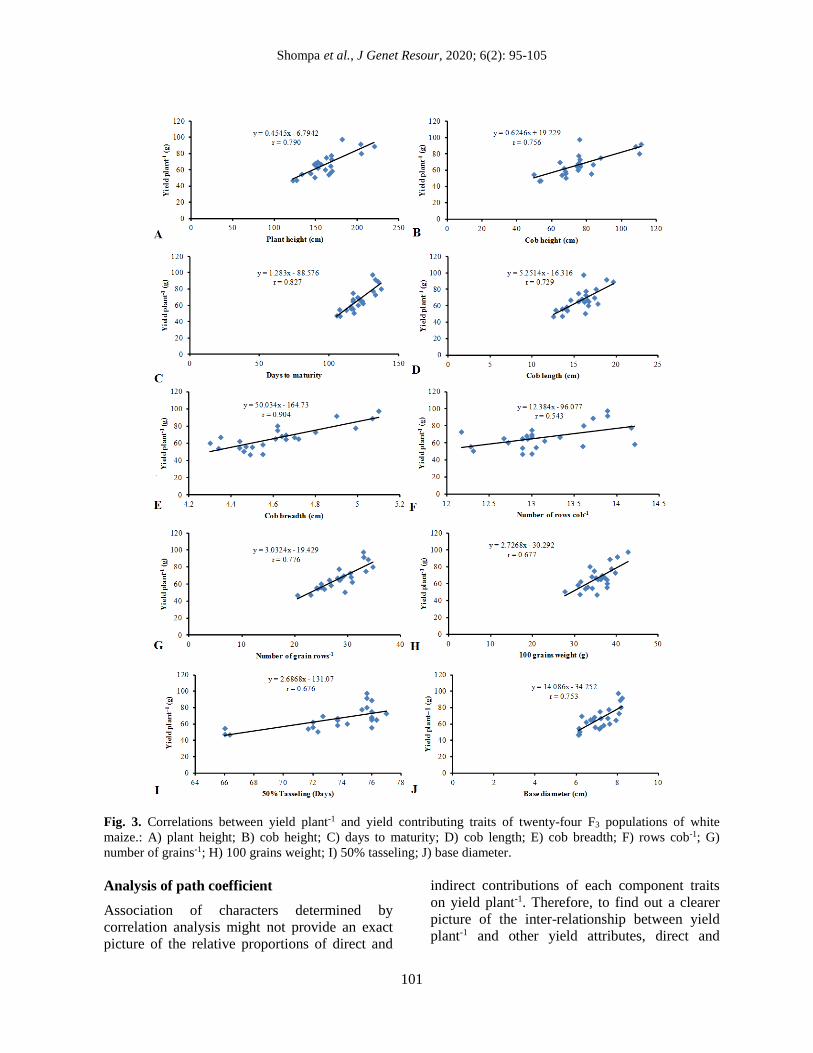
Correlation analysis
Knowledge about character associations helps to
identify the characters correlated with yield and
also to determine the extent and nature of
relationship exist among the yield contributing
characters. In the present study, yield plant-1
showed highly significant difference among the
tested lines which had positive correlation with
plant height (0.790), cob height (0.756), days to
maturity (0.827), cob length (0.729), cob breadth
(0.904), number of rows cob-1 (0.543), number
of grain row-1 (0.776), 100 grain weight (0.677),
50% tasseling (0.676) and base diameter (0.753)
(Figs. 3A-J).
Pandey et al. (2017) observed that the positive
correlation was present in the association of cob
length with grain yield (0.618). Sumathi et al.
(2005) also found a strong relation between 100-
grain weight and grain yield, but that
relationship was negative. However, Beulah et
al. (2018) found strong correlations between
grain yield and 100-seed weight. In the present
study, we found that the yield plant-1 was
strongly and positively correlated with plant
height, cob height, days to maturity, cob length,
and cob breadth. So, this is an indication of the
existing strong inherent correlation between the
yield components and yield. Therefore, these
traits could be considered for selection activity
for the improvement of yield in white maize.
Shompa et al., J Genet Resour, 2020; 6(2): 95-105
101
Fig. 3. Correlations between yield plant-1 and yield contributing traits of twenty-four F3 populations of white
maize.: A) plant height; B) cob height; C) days to maturity; D) cob length; E) cob breadth; F) rows cob-1; G)
number of grains-1; H) 100 grains weight; I) 50% tasseling; J) base diameter.
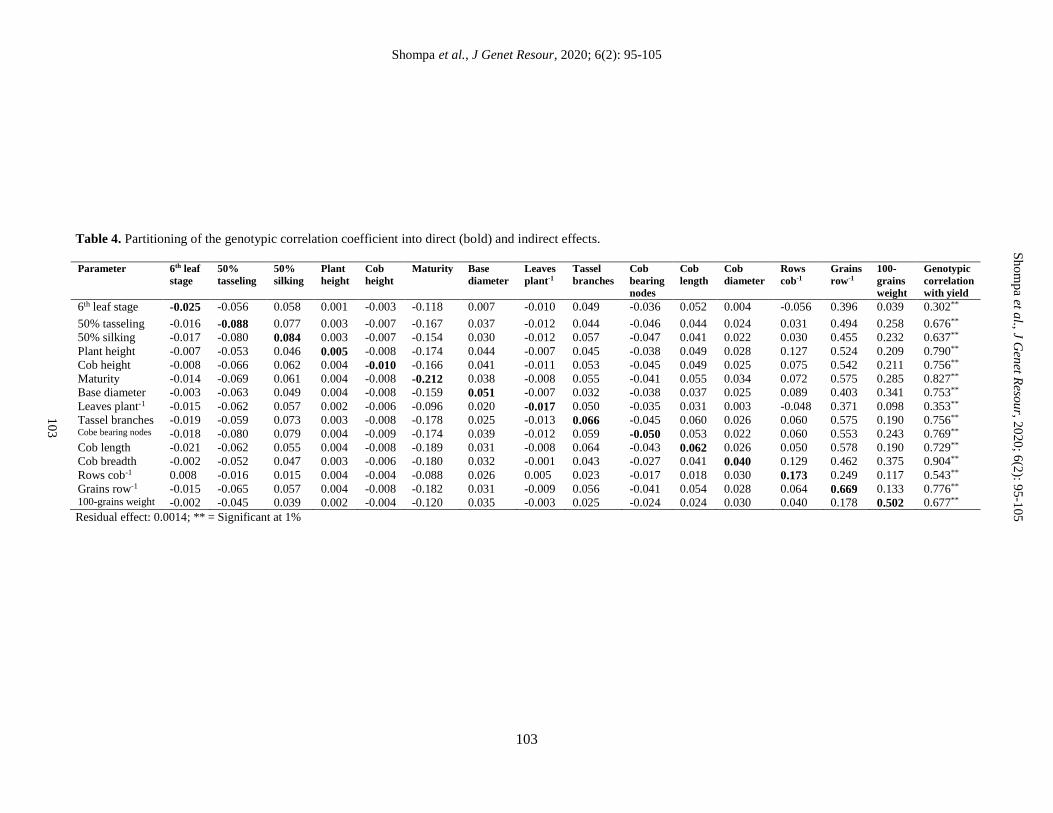
Analysis of path coefficient
Association of characters determined by
correlation analysis might not provide an exact
picture of the relative proportions of direct and
indirect contributions of each component traits
on yield plant-1. Therefore, to find out a clearer
picture of the inter-relationship between yield
plant-1 and other yield attributes, direct and

Shompa et al., J Genet Resour, 2020; 6(2): 95-105
102
indirect effects were calculated using path
analysis at the genotypic level, which also
measured the relative importance of each
component (Table 4). The results of the present
investigation on path coefficient analysis
revealed that grains row-1 (0.669), 100 grains
weight (0.502), row cob-1 (0.173), cob length
(0.062), cob diameter (0.040), days to 50%
silking (0.084) and plant height (0.005) had a
highly-positive and direct effect on yield plant-1.
Reddy and Jabeen (2016) also found the direct
effect of days to silking on grain yield plant-1
followed by the number of kernels row-1, 100-
seed weight, and ear girth. On the other hand,
direct and negative effects on yield plant-1 were
contributed through days to 6th leaf stage (-
0.025), days to 50% tasseling (-0.088), cob
height (-0.010), days to maturity (-0.212), leaves
plant-1 (-0.017) and the number of cob bearing
node (-0.050).
The results of a path analysis revealed that 100-
grain weight and grains row-1 had a very strong
relationship with yield plant-1 that means the
direct selection for these traits would be
convenient to improve the yield.
Selection of dwarf lines
From the above results that deciphered the
agronomic performance of the twenty-four F3
lines, heritability, the genetic advance of yield
attributes and their degree and nature of
associations, the traits e.g. plant height, days to
maturity, base diameter, cob bearing node, cob
breadth, number of grain row-1 and 100-grain
weight were considered as selection parameters
for identifying promising lines from the F3
population. Rafiq et al. (2010) selected the best
maize genotypes based on grains per row, 100-
grain weight, grain rows per ear, ear length and
ear diameter, while Reddy et al. (2012)
emphasized on days to 50% tasseling, 100-seed
weight, ear length, days to maturity, ear height,
number of kernels per row, ear height, number of
kernel rows per ear and plant height for selecting
the elite genotypes, hence these traits were found
to be the important direct contributors to grain
yield in maize.
In another study, ear diameter, ear length, and
kernel number/row were considered as selection
criteria for yield improvement of sweet corn
(Chozin et al., 2017). In the present study, the F3
lines - G14, G4, G5, and G6 showed the highest
grain yield plant-1 performance (80-97g),
however, these lines took maximum days for
maturity (131-133 days) and showed the
maximum plant height (181-202 cm), cob height
(108-110 cm), cob bearing nodes (7-8) (Table 2
and Fig. 1), hence, these lines were assumed not
suitable to be dwarf stature promising lines, but
might be considered as high yielding and late
maturity breeding lines. In contrast, the lines
having the minimum plant height, early maturity,
base diameter, cob height, and reasonable yield
potential were selected as dwarf stature
promising lines. Based upon this notion, the lines
G10, G11, G12, G1, G3, and G16 were
considered as the best candidates as promising
dwarf stature lines. These selected F3 lines are
dwarf stature due to their minimum plant height
(122-155 cm), cob height (49.72-67.83 cm),
number of cob bearing node (5-6), days to
maturity (105-112 days) and yield plant-1 (46.95-
58.55g) (Table 2 and Fig. 1). Therefore, it can be
assumed that having the dwarf stature nature,
these breeding lines would be less affected in the
unfavorable weather conditions that normally
prevail in the Kharif season. So considering this,
it may be said that these lines might serve as
potential genetic resources for the development
of promising dwarf stature inbred lines of white
maize. The selection of appropriate breeding
lines from early segregation generations is very
important to develop inbred lines. The genetic
analysis and agronomic performances of twenty-
four F3 populations of white maize showed that
plant height, days of maturity, base diameter,
cob height, and yield potential can serve as an
excellent index for selection criteria of ‘dwarf
stature’ breeding lines. Again, based on the
selection criteria the lines, G10, G11, G12, G1,
G3, and G16 were the dwarf stature promising
lines, which will be advanced further to the F5
stage to develop elite inbred lines of white
maize.
Acknowledgment
The authors acknowledge the University Grant
Commission of Bangladesh (UGC) for providing
the research grant for experimenting.
Conflicts of interest
The authors have no competing interests.
Shompa et al., J Genet Resour, 2020; 6(2): 95-105
103
Table 4. Partitioning of the genotypic correlation coefficient into direct (bold) and indirect effects.
Parameter 6th leaf
stage
50%
tasseling
50%
silking
Plant
height
Cob
height
Maturity Base
diameter
Leaves
plant-1
Tassel
branches
Cob
bearing
nodes
Cob
length
Cob
diameter
Rows
cob-1
Grains
row-1
100-
grains
weight
Genotypic
correlation
with yield
6th leaf stage -0.025 -0.056 0.058 0.001 -0.003 -0.118 0.007 -0.010 0.049 -0.036 0.052 0.004 -0.056 0.396 0.039 0.302**
50% tasseling -0.016 -0.088 0.077 0.003 -0.007 -0.167 0.037 -0.012 0.044 -0.046 0.044 0.024 0.031 0.494 0.258 0.676**
50% silking -0.017 -0.080 0.084 0.003 -0.007 -0.154 0.030 -0.012 0.057 -0.047 0.041 0.022 0.030 0.455 0.232 0.637**
Plant height -0.007 -0.053 0.046 0.005 -0.008 -0.174 0.044 -0.007 0.045 -0.038 0.049 0.028 0.127 0.524 0.209 0.790**
Cob height -0.008 -0.066 0.062 0.004 -0.010 -0.166 0.041 -0.011 0.053 -0.045 0.049 0.025 0.075 0.542 0.211 0.756**
Maturity -0.014 -0.069 0.061 0.004 -0.008 -0.212 0.038 -0.008 0.055 -0.041 0.055 0.034 0.072 0.575 0.285 0.827**
Base diameter -0.003 -0.063 0.049 0.004 -0.008 -0.159 0.051 -0.007 0.032 -0.038 0.037 0.025 0.089 0.403 0.341 0.753**
Leaves plant-1 -0.015 -0.062 0.057 0.002 -0.006 -0.096 0.020 -0.017 0.050 -0.035 0.031 0.003 -0.048 0.371 0.098 0.353**
Tassel branches -0.019 -0.059 0.073 0.003 -0.008 -0.178 0.025 -0.013 0.066 -0.045 0.060 0.026 0.060 0.575 0.190 0.756** Cobe bearing nodes -0.018 -0.080 0.079 0.004 -0.009 -0.174 0.039 -0.012 0.059 -0.050 0.053 0.022 0.060 0.553 0.243 0.769**
Cob length -0.021 -0.062 0.055 0.004 -0.008 -0.189 0.031 -0.008 0.064 -0.043 0.062 0.026 0.050 0.578 0.190 0.729**
Cob breadth -0.002 -0.052 0.047 0.003 -0.006 -0.180 0.032 -0.001 0.043 -0.027 0.041 0.040 0.129 0.462 0.375 0.904**
Rows cob-1 0.008 -0.016 0.015 0.004 -0.004 -0.088 0.026 0.005 0.023 -0.017 0.018 0.030 0.173 0.249 0.117 0.543**
Grains row-1 -0.015 -0.065 0.057 0.004 -0.008 -0.182 0.031 -0.009 0.056 -0.041 0.054 0.028 0.064 0.669 0.133 0.776** 100-grains weight -0.002 -0.045 0.039 0.002 -0.004 -0.120 0.035 -0.003 0.025 -0.024 0.024 0.030 0.040 0.178 0.502 0.677**
Residual effect: 0.0014; ** = Significant at 1%
Sh
om
pa et a
l., J Gen
et Reso
ur, 2
020
; 6(2
): 95-1
05
10
3

Shompa et al., J Genet Resour, 2020; 6(2): 95-105
104
References
Ahmad SQ, Khan S, Ghaffar M, Ahmad F. 2011.
Genetic diversity analysis for yield and other
parameters in maize (Zea mays L.) genotypes.
Asian J Agric Sci 3: 385- 388.
Ahmed N, Chowdhury A, Uddin MS, Rashad
MM. 2020. Genetic variability, correlation
and path analysis of exotic and local hybrid
maize (Zea mays L.) genotypes. Asian J Med
Biol Res 6 (1): 8- 15.
Amiruzzaman M, Islam MA, Hasan L, Kadir M,
Rohman MM. 2013. Heterosis and combining
ability in a diallel among elite inbred lines of
maize (Zea mays L.). Emir J Food Agric 25
(2): 132- 137.
Bangladesh Agricultural Research Institute
(BARI). 2018. Annual Report 2017-2018,
Bangladesh Agricultural Research Institute.
Gazipur, Bangladesh.
Bartaula S, Panthi U, Timilsena K, Acharya SS,
Shrestha J. 2019. Variability, heritability and
genetic advance of maize (Zea mays L.)
genotypes. Res Agric Livest Fish 6: 163-169.
Bangladesh Bureau of Statistics (BBS). 2018.
Annual Agricultural Statistics 2017-18,
Bangladesh Bureau of Statistics. Statistic
Division, Ministry of Planning, Dhaka,
Bangladesh.
Beulah G, Marker S, Rajasekhar D. 2018.
Assessment of quantitative genetic variability
and character association in maize (Zea mays
L.). J Pharmacogn Phytochem 7: 2813- 2816.
Ceccarelli S, Grando S, Maatougui M, Michael
M, Slash M, Haghparast R, Rahmanian M,
Taheri A, Al-Yassin A, Benbelkacem A,
Labdi M. 2010. Plant breeding and climate
changes. J Agricu Sci 148: 627–637.
Chozin M, Sudjatmiko S, Setyowati N,
Fahrurrozi F, Muktamar Z. 2017. Analysis of
traits association in sweet corn inbred lines as
grown under organic crop management.
SABRAO J Breed Genet 49: 361- 367.
Cochran WG, Cox GM. 1957. Experimental
design. New York. John Wiley & Sons, 546-
568.
Comstock RE, Robinson HF. 1952. Genetic
Parameters, their Estimation and
Significance, Proc Sixth International
Grassland Congress, Washington, D.C.,
USA: National Publishing Company.
Dewey DR, Lu HK. 1959. A correletion and path
coefficient analysis of components of
creasted wheat grass and seed production.
Agron J 51: 515- 518.
Ghimire B, Timsina D. 2015. Analysis of yield
and yield attributing traits of maize genotypes
in chitwan, Nepal. World J Agric Res 3: 153-
162.
Hepziba SJ, Geeta K, Ibrahim. 2013. Evalution
of genetic diversity, variability, characters
association and path analysis in divers
inbreds of maize (Zea mays L.). Electron J
Plant Breed 4: 1067– 1072.
Hossain S, Haque M, Rahman J. 2015. Genetic
variability, correlation and path coefficient
analysis of morphological traits in some
extinct local aman rice (Oryza sativa L). J
Rice Res 3: 158.
Idris AE, Abuali AI. 2011. Genetic variability
for vegetative and yield traits in maize (Zea
mays L.) genotypes. Int Res J Agric Sci Soil
Sci 1: 408- 411.
Karim ANMS, Ahmed S, Akhi AH, Talukder
MZA, Mujahidi TA. 2018. Combining ability
and heterosis study in maize (Zea mays L.)
Hybrids at different environments in
Bangladesh. Bangladesh J Agric Res 43: 125-
134.
Khan AA, Islam MR, Ahmed KU, Khaldun
ABM. 2013. Studies on genetic divergence in
maize (Zea mays) inbreds. Bangladesh J
Agric Res 38: 71-76.
Kumar S, Gupta D, Nayyar H. 2012.
Comparative response of maize and rice
genotypes to heat stress: status of oxidative
stress and antioxidants. Acta Physiol
Plant 34: 75-86.
Kumar SR, Arumugam T, Balakrishnan,
Anandakumar CR. 2013. Variability in the
segregating generation of eggplant for
earliness and yield. Pak J Biol Sci 16: 1122-
1129.
Matin MQI, Rasul MG, Islam AKMA, Mian
MK, Ivy NA, Ahmed JU. 2016. Combining
ability and heterosis in maize (Zea mays L.).
Am J Bio Sci 4: 84- 90.
Mishra PK, Ram RB, Kumar N. 2015. Genetic
variability, heritability, and genetic advance
in strawberry (Fragaria× ananassa Duch.).
Turk J Agric For 9: 451- 458.

Shompa et al., J Genet Resour, 2020; 6(2): 95-105
105
Nayaka MP, Lambani N, Sandhya, Marker S.
2015. Genetic variability and heritability
studies in the Maize genotype at Allahabad.
Int J Tropic Agric 33: 1987-1990.
Olawamide DO, Fayeun LS. 2020. Correlation
and path coefficient analysis for yield and
yield components in late maturing pro-
vitamin a synthetic maize (Zea mays L.)
breeding lines. J Exp Agric Int 42: 64-72.
Pandey Y, Vyas RP, Kumar J, Singh L, Singh
HC, Yadav PC, Vishwanath. 2017.
Heritability, correlation and path coefficient
analysis for determining interrelationships
among grain yield and related characters in
maize (Zea mays L.). Int J Pure App Biosci 5:
595-603.
Rafiq CM, Rafique M, Hussain A, Altaf M.
2010. Studies on heritability, correlation and
path analysis in maize (Zea mays L.). J Agric
Res 48: 35-38.
Ranum P, Peña‐Rosas JP, Garcia‐Casal MN.
2014. Global maize production, utilization,
and consumption. Ann N Y Acad Sci 1312:
105-112.
Reddy VR, Jabeen F. 2016. Narrow sense
heritability, correlation and path analysis in
maize (Zea mays L.). SABRAO J Breed Genet
48: 120-126.
Reddy VR, Jabeen F, Sudarshan MR, Rao AS
(2012). Studies on genetic variability,
heritability, correlation and path analysis in
maize (Zea mays L.) over locations. Int J
Appl Biol Pharm 4: 196-199.
Sesay S, Ojo D, Ariyo OJ, Meseka S. 2016.
Genetic variability, heritability and genetic
advance studies in topcross and three-way
cross maize (Zea mays L) hybrids. Maydica
61: 1-7.
Singh P, Das S, Kumar Y, Dutt Y, Sangwan O.
2003. Variability studies for grain yield and
its component traits in maize (Zea mays L.).
Ann Agri-Bio Res 8: 2-31.
Sumathi PA, Kumara N, Moharaj K. 2005.
Genetic variability and traits inter-
relationship studies in inheritability utilized
oil rich CYMMYT maize (Zea mays L.).
Madras Agric J 92: 612-617.
Tahir M, Tanveer A, Ali A, Abbas M, Wasaya
A. 2008. Comparative yield performance of
different maize (Zea mays L.) hybrids under
local conditions of Faisalabad-Pakistan. Pak J
Life Soc Sci 6: 118-120.
Ullah MJ, Islam MM, Fatima K, Mahmud MS,
Akhter S, Rahman J, Quamruzzaman M.
2017. Comparing modern varieties of white
maize with landraces in Bangladesh:
Phenotypic traits and plant characters. J Expt
Biosci 8: 27-40.
Ullah MJ, Islam MM, Fatima K, Mahmud MS,
Islam MR. 2019. Yield and yield attributes of
two exotic white maize hybrids at different
agroclimatic regions of Bangladesh under
varying fertilizer doses. Adv Agr Environ Sci
2: 65-71.


![$YGD GH &iGL] - movilidadgranada.com · f3 f3 f3 f3 f3 f3 f3 f3 f3 f3 f3 f3f3 f3 f3 f3 f3 f3 f3 f3 f3 f3 f3 f3 f3 f3 f3 f3 f3f3 f3 f3 f3 f3 f3 f3 f3 f2 f2 f2 f2 f2 f2 f2 f2 f2 f2](https://img.pdfslide.net/doc/110x75/5bb5162f09d3f2b63a8c0773/ygd-gh-igl-f3-f3-f3-f3-f3-f3-f3-f3-f3-f3-f3-f3f3-f3-f3-f3-f3-f3-f3-f3-f3.jpg)