Embed Size (px)
Citation preview
SEMI ANNUAL TECHNICAL PROGRESS REPORT FOR THE PERIOD ENDING JUNE 30, 2007
TITLE: FIELD DEMONSTRATION OF CARBON DIOXIDE MISCIBLE FLOODING IN THE LANSING-KANSAS CITY FORMATION, CENTRAL KANSAS DOE Contract No. DE-AC26-00BC15124
University of Kansas Center for Research, Inc. 2385 Irving Hill Road Contractor: Lawrence, KS 66044
Class II Revisited - Field Demonstrations
March 8, 2000
DOE Program:
Award Date:
Total Project Budget:
DOE Cost Amount:
Program Period:
$5,388,683
$1,892,094
March 8, 2000 – March 7, 2010 (BP1 03/00-2/04, BP2 2/04-12/08, BP3 1/09-03/10)
Reporting Period: DOE
Project Manager:
Contractor Contact:
January 1, 2007 – June 30, 2007
Chandra Nautiyal, NETL Tulsa, Oklahoma
G. Paul Willhite Tertiary Oil Recovery Project 1530 W. 15th Street Room 4146B Learned Hall Lawrence, Kansas 66045-7609 email: [email protected] phone: 785-864-2906
Alan Byrnes (Program Manager Budget Period 1) Principal Investigators: G. Paul Willhite (Program Manager Budget Periods 2&3) Don Green, Martin Dubois, Richard Pancake, Timothy Carr, W. Lynn Watney, John Doveton, Willard Guy, Rodney Reynolds, Dave Murfin, James Daniels, Russell Martin, William Flanders, Dave Vander Griend, Eric Mork, Paul Cantrell
DE-AC26-00BC15124 Semi Annual Technical Progress Report June 30, 2007 1
DE-AC26-00BC15124 Semi Annual Technical Progress Report June 30,2007
2
DISCLAIMER: This report was prepared as an account of work sponsored by an agency of the United States Government. Neither the United States Government nor any agency thereof, nor any of their employees, makes any warranty, express or implied, or assumes any legal liability or responsibility for the accuracy, completeness, or usefulness of any information, apparatus, product, or process disclosed, or represents that its use would not infringe privately owned rights. Reference herein to any specific commercial product, process, or service by trade name, trademark, manufacturer, or otherwise does not necessarily constitute or imply its endorsement, recommendation, or favoring by the United States Government or any agency thereof. The views and opinions of authors herein do not necessarily state or reflect those of the United States Government or any agency thereof. ABSTRACT: A pilot carbon dioxide miscible flood was initiated in the Lansing Kansas City C formation in the Hall Gurney Field, Russell County, Kansas. The reservoir zone is an oomoldic carbonate located at a depth of about 2900 feet. The pilot consists of one carbon dioxide injection well and three production wells. Continuous carbon dioxide injection began on December 2, 2003. By the end of June 2005, 16.19 MM lb of carbon dioxide was injected into the pilot area. Injection was converted to water on June 21, 2005 to reduce operating costs to a breakeven level with the expectation that sufficient carbon dioxide has been injected to displace the oil bank to the production wells by water injection. By June 30, 2007, 116,101 bbls of water were injected into CO2 I-1 and 4,862 bbl of oil were produced from the pilot. Water injection rates into CO2 I-1, CO2#10 and CO2#18 were stabilized during this period. Oil production rates averaged 5.2 B/D for the period from January 1-June 30, 2007. Production from wells to the northwest of the pilot region indicates that oil displaced from carbon dioxide injection was produced from Colliver A7, Colliver A3, Colliver A14 and Graham A4 located on adjacent leases. About 7,506 bbl of incremental oil was estimated to have been produced from these wells as of June 30, 2007. There is evidence of a directional permeability trend toward the NW through the pilot region. The majority of the injected carbon dioxide remains in the pilot region, which has been maintained at a pressure at or above the minimum miscibility pressure. Our management plan is to continue water injection maintaining oil displacement by displacing the carbon dioxide remaining in the C zone. Estimated oil recovery attributed to the CO2 flood is 12,365 bbl which is equivalent to a gross CO2 utilization of 11.2 MCF/bbl. The pilot project is not economic.
DE-AC26-00BC15124 Semi Annual Technical Progress Report June 30,2007
3
TABLE OF CONTENTS TITLE PAGE .......................................................................................................................1 DISCLAIMER .....................................................................................................................2 ABSTRACT ........................................................................................................................2 TABLE OF CONTENTS .....................................................................................................3 LIST OF TABLES ...............................................................................................................3 LIST OF FIGURES .............................................................................................................3 INTRODUCTION ...............................................................................................................5 EXECUTIVE SUMMARY ..................................................................................................5 RESULTS AND DISCUSSION …………………………………………………………… 5
TASK 5.4 - IMPLEMENT CO2 FLOOD OPERATIONS………………………………... 5 TASK 7.0 PROJECT MANAGEMENT …………………………………………………19
CONCLUSIONS ………………………………………………………………………… 19 REFERENCE……………………………………………………………………………...19
LIST OF FIGURES Figure 1: Murfin Colliver Lease in Russell County, Kansas……………………………..6 Figure 2: Injection rates and bottomhole pressures during injection into CO2 I-1...…….7 Figure 3: Injection rates and bottomhole pressures during injection into CO2#10……....8 Figure 4: Injection rates and bottomhole pressures during injection into CO2#18………8 Figure 5: Oil and water production rates from pilot area………………………………... 9 Figure 6: Average daily oil production rates from pilot area……………………………..9 Figure 7: Average daily water production rate from pilot area……….……………………10 Figure 8: Average water/oil ration for the period from July 1, 2006 to June 30, 3007…......10 Figure 9: Map showing location of wells completed in the Lansing-Kansas ‘City C zone
in the area of the CO2 pilot. The elliptical region includes wells marked with a + that appear to have produced oil displaced from the CO2 pilot area………11
Figure 10: Monthly oil production from Graham A Lease…………………………………12
Figure 11: Colliver A lease production after C zone was opened in Colliver A7, Colliver A3 and Colliver A14…………….…………………………………....13
Figure 12: Estimated pressure distribution on Colliver-Carter Leases in December 2006 Using Surfer…………………………………………………………………...18
LIST OF TABLES
Table 1: Estimated Incremental Oil from CO2 Injection into LKC C…………………..13 Table 2: Estimate Oil Rates from Colliver A Wells when the LKC C zone was SI
at the End of the Colliver-Carter Waterflood…………………………………..15 Table 3: Summary of Monthly Data-July 2006-June 2007…….……………………….20 Table 4: Summary of Daily Data-July 2006-June 2007………….……………………. 21
DE-AC26-00BC15124 Semi Annual Technical Progress Report June 30,2007
4
INTRODUCTION Objectives - The objective of this Class II Revisited project is to demonstrate the viability of carbon dioxide miscible flooding in the Lansing-Kansas City formation on the Central Kansas Uplift and to obtain data concerning reservoir properties, flood performance, operating costs and methods to aid operators in future floods. The project addresses the producibility problem that these Class II shallow-shelf carbonate reservoirs have been depleted by effective waterflooding leaving significant trapped oil reserves. The objective is to be addressed by performing a CO2 miscible flood in a 10-acre (4.05 ha) pilot in a representative oomoldic limestone reservoir in the Hall-Gurney Field, Russell County, Kansas. At the demonstration site, the Kansas team will characterize the reservoir geologic and engineering properties, model the flood using reservoir simulation, design and construct facilities and remediate existing wells, implement the planned flood, and monitor the flood process. The results of this project will be disseminated through various technology transfer activities.
Project Task Overview - Activities in Budget Period 1 (03/00-2/04) involved reservoir characterization, modeling, and assessment:
• Task 1.1- Acquisition and consolidation of data into a web-based accessible database • Task 1.2 - Geologic, petrophysical, and engineering reservoir characterization at the proposed
demonstration site to understand the reservoir system • Task 1.3 - Develop descriptive and numerical models of the reservoir • Task 1.4 - Multiphase numerical flow simulation of oil recovery and prediction of the optimum
location for a new injector well based on the numerical reservoir model • Task 2.1 - Drilling, sponge coring, logging and testing a new CO2 injection well to obtain better
reservoir data • Task 2.2 - Measurement of residual oil and advanced rock properties for improved reservoir
characterization and to address decisions concerning the resource base • Task 2.3 – Remediate and test wells and patterns, re-pressure pilot area by water injection and
evaluate inter-well properties, perform initial CO2 injection to test for premature breakthrough • Task 3.1 - Advanced flow simulation based on the data provided by the improved
characterization • Task 3.2 - Assessment of the condition of existing wellbores, and evaluation of the economics of carbon
dioxide flooding based on the improved reservoir characterization, advanced flow simulation, and engineering analyses
• Task 4.1 – Review of Budget Period 1 activities and assessment of flood implementation
Activities in Budget Period 2 (2/04-12/08) involve implementation and monitoring of the flood: • Task 5.4 - Implement CO2 flood operations • Task 5.5 - Analyze CO2 flooding progress - carbon dioxide injection will be terminated at the end
of Budget Period 2 and the project will be converted to continuous water injection.
Activities in Budget Period 3 (1/09-03/10) will involve post-CO2 flood monitoring: • Task 6.1 – Collection and analysis of post-CO2 production and injection data
Activities that occur over all budget periods include: • Task 7.0 – Management of geologic, engineering, and operations activities • Task 8.0 – Technology transfer and fulfillment of reporting requirements
DE-AC26-00BC15124 Semi Annual Technical Progress Report June 30,2007
5
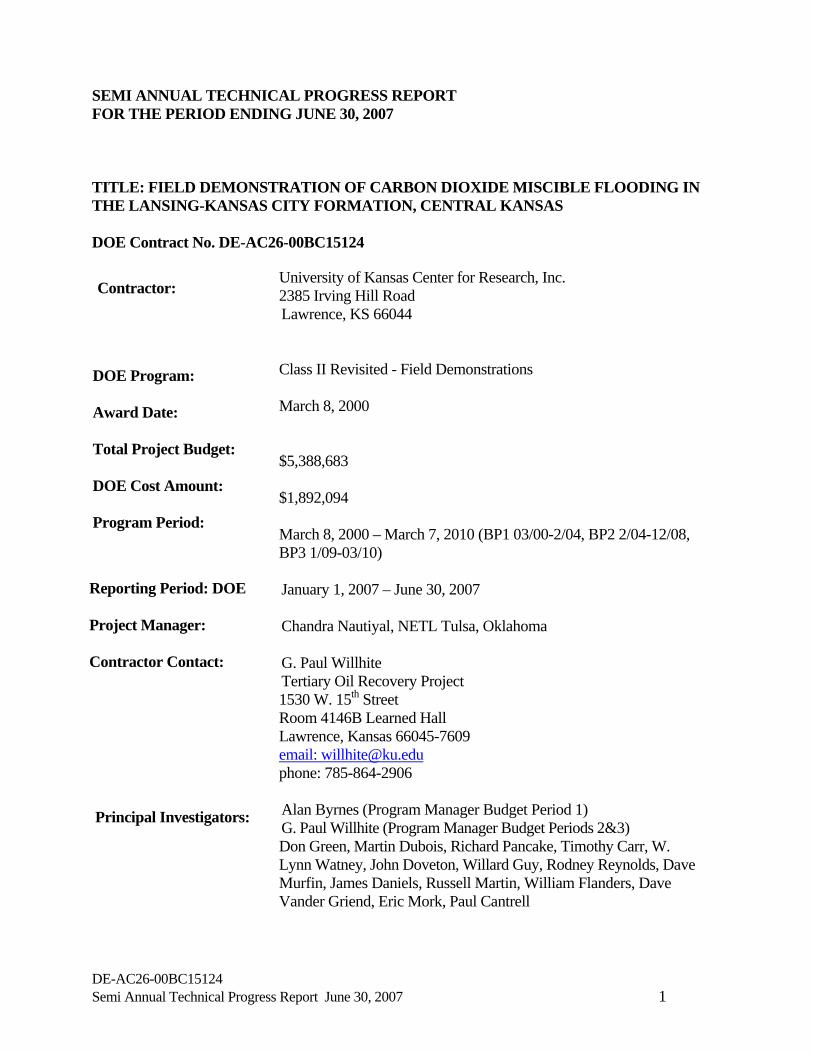
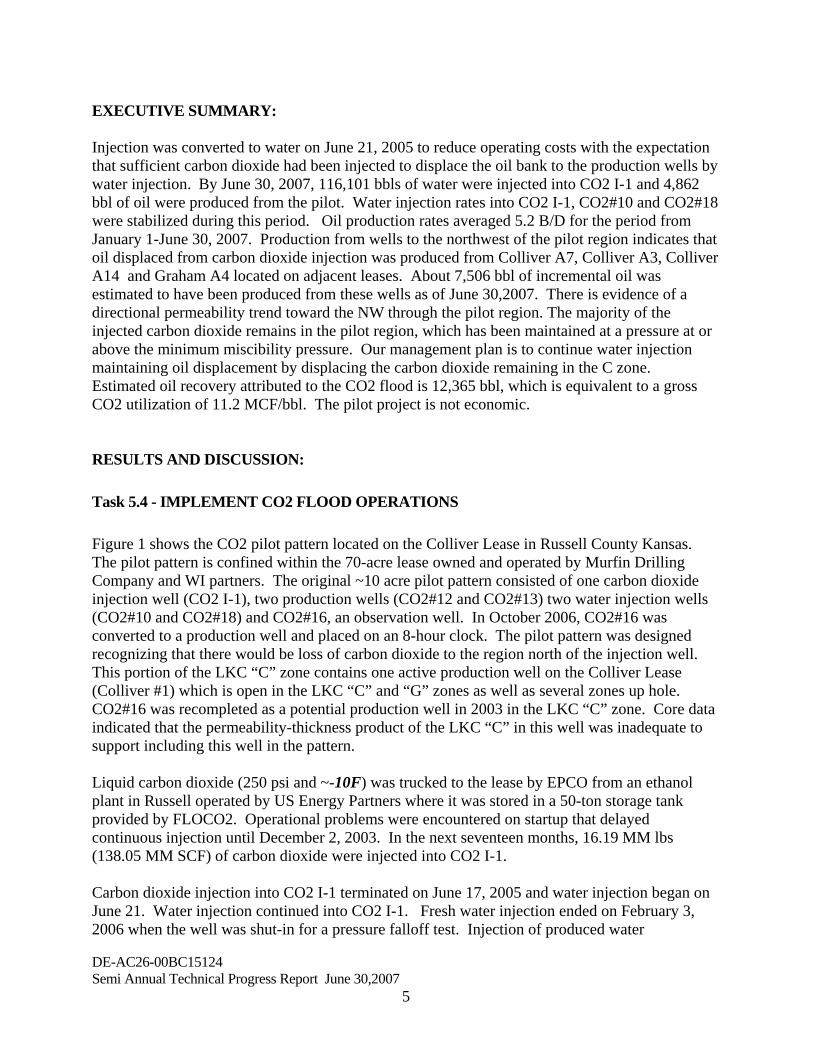
EXECUTIVE SUMMARY: Injection was converted to water on June 21, 2005 to reduce operating costs with the expectation that sufficient carbon dioxide had been injected to displace the oil bank to the production wells by water injection. By June 30, 2007, 116,101 bbls of water were injected into CO2 I-1 and 4,862 bbl of oil were produced from the pilot. Water injection rates into CO2 I-1, CO2#10 and CO2#18 were stabilized during this period. Oil production rates averaged 5.2 B/D for the period from January 1-June 30, 2007. Production from wells to the northwest of the pilot region indicates that oil displaced from carbon dioxide injection was produced from Colliver A7, Colliver A3, Colliver A14 and Graham A4 located on adjacent leases. About 7,506 bbl of incremental oil was estimated to have been produced from these wells as of June 30,2007. There is evidence of a directional permeability trend toward the NW through the pilot region. The majority of the injected carbon dioxide remains in the pilot region, which has been maintained at a pressure at or above the minimum miscibility pressure. Our management plan is to continue water injection maintaining oil displacement by displacing the carbon dioxide remaining in the C zone. Estimated oil recovery attributed to the CO2 flood is 12,365 bbl, which is equivalent to a gross CO2 utilization of 11.2 MCF/bbl. The pilot project is not economic. RESULTS AND DISCUSSION: Task 5.4 - IMPLEMENT CO2 FLOOD OPERATIONS Figure 1 shows the CO2 pilot pattern located on the Colliver Lease in Russell County Kansas. The pilot pattern is confined within the 70-acre lease owned and operated by Murfin Drilling Company and WI partners. The original ~10 acre pilot pattern consisted of one carbon dioxide injection well (CO2 I-1), two production wells (CO2#12 and CO2#13) two water injection wells (CO2#10 and CO2#18) and CO2#16, an observation well. In October 2006, CO2#16 was converted to a production well and placed on an 8-hour clock. The pilot pattern was designed recognizing that there would be loss of carbon dioxide to the region north of the injection well. This portion of the LKC “C” zone contains one active production well on the Colliver Lease (Colliver #1) which is open in the LKC “C” and “G” zones as well as several zones up hole. CO2#16 was recompleted as a potential production well in 2003 in the LKC “C” zone. Core data indicated that the permeability-thickness product of the LKC “C” in this well was inadequate to support including this well in the pattern. Liquid carbon dioxide (250 psi and ~-10F) was trucked to the lease by EPCO from an ethanol plant in Russell operated by US Energy Partners where it was stored in a 50-ton storage tank provided by FLOCO2. Operational problems were encountered on startup that delayed continuous injection until December 2, 2003. In the next seventeen months, 16.19 MM lbs (138.05 MM SCF) of carbon dioxide were injected into CO2 I-1. Carbon dioxide injection into CO2 I-1 terminated on June 17, 2005 and water injection began on June 21. Water injection continued into CO2 I-1. Fresh water injection ended on February 3, 2006 when the well was shut-in for a pressure falloff test. Injection of produced water
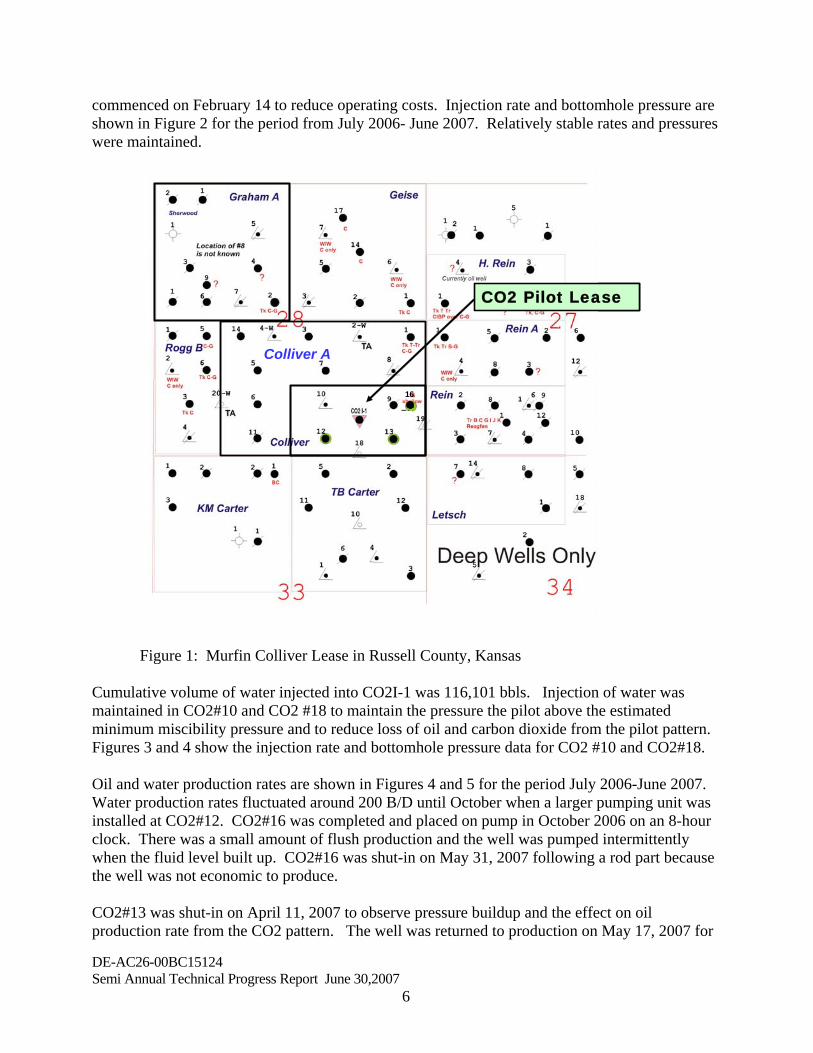
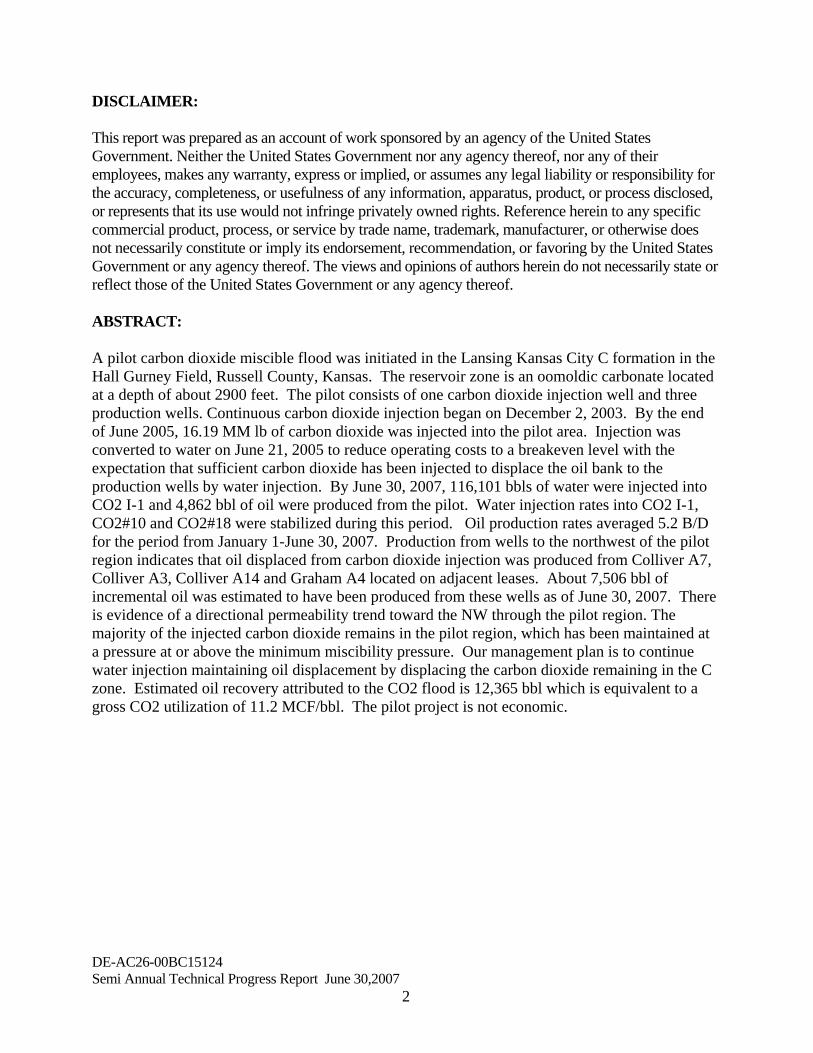
commenced on February 14 to reduce operating costs. Injection rate and bottomhole pressure are shown in Figure 2 for the period from July 2006- June 2007. Relatively stable rates and pressures were maintained.
Colliver A
16
CO2 Pilot Lease
Colliver A
16
CO2 Pilot Lease
Figure 1: Murfin Colliver Lease in Russell County, Kansas
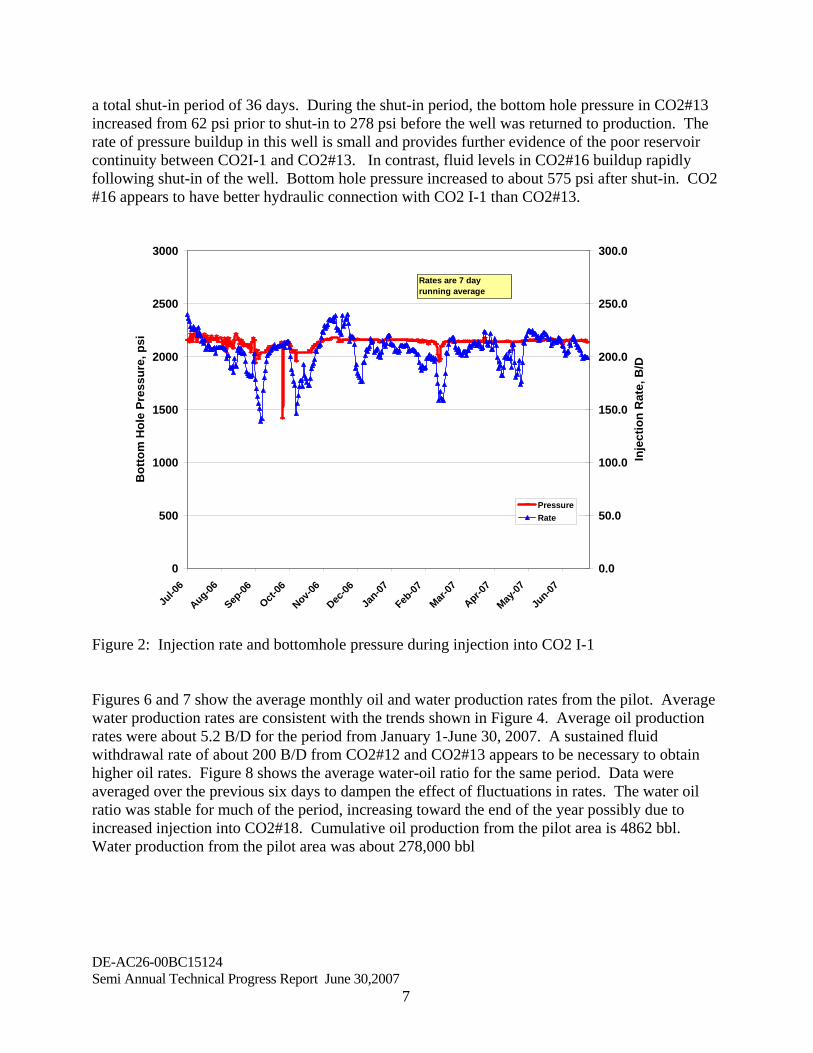
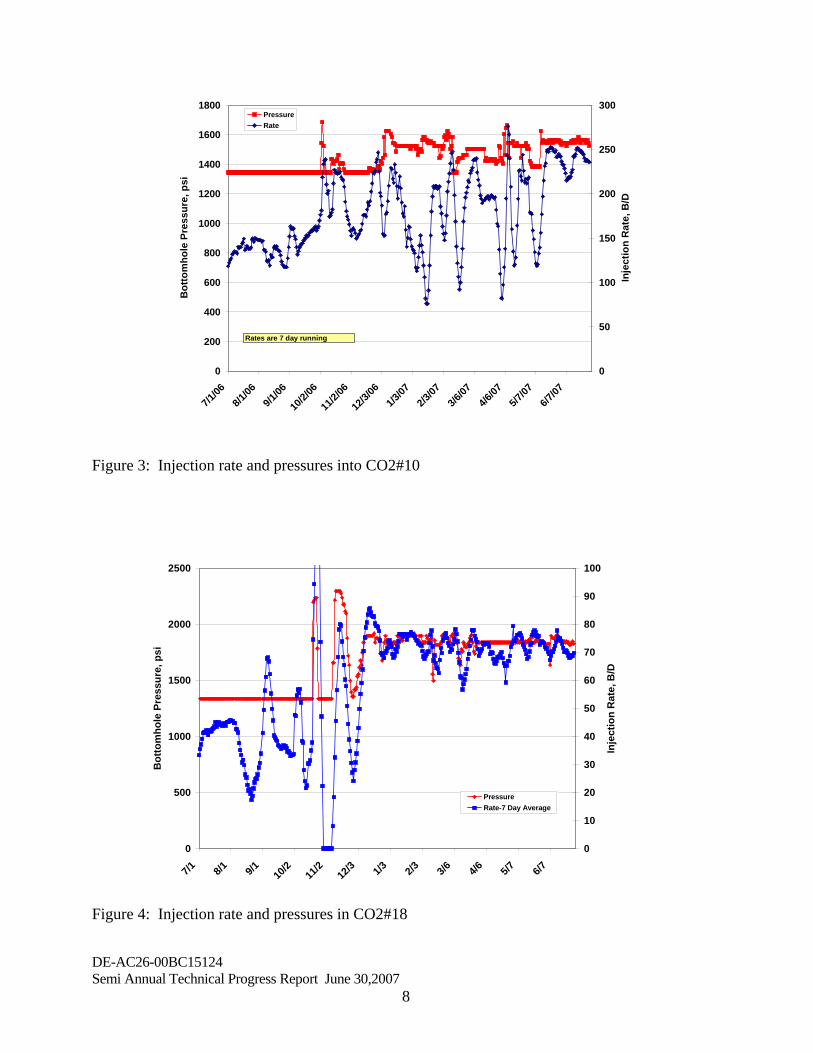
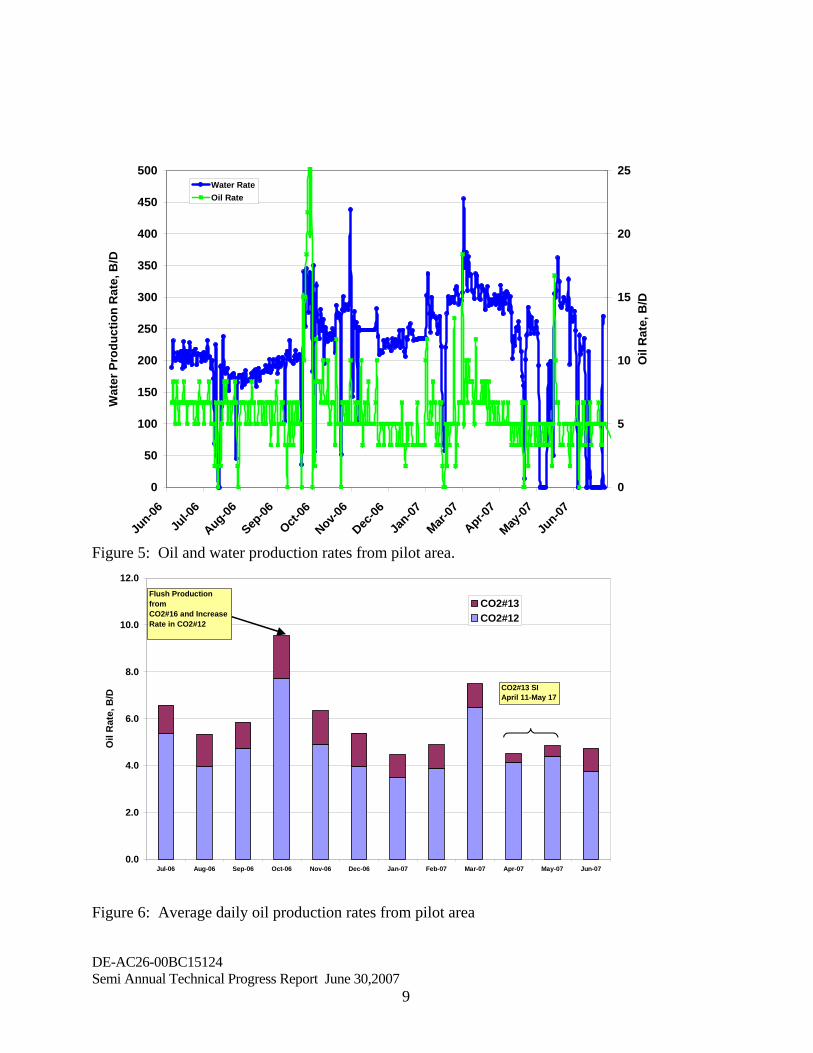
Cumulative volume of water injected into CO2I-1 was 116,101 bbls. Injection of water was maintained in CO2#10 and CO2 #18 to maintain the pressure the pilot above the estimated minimum miscibility pressure and to reduce loss of oil and carbon dioxide from the pilot pattern. Figures 3 and 4 show the injection rate and bottomhole pressure data for CO2 #10 and CO2#18. Oil and water production rates are shown in Figures 4 and 5 for the period July 2006-June 2007. Water production rates fluctuated around 200 B/D until October when a larger pumping unit was installed at CO2#12. CO2#16 was completed and placed on pump in October 2006 on an 8-hour clock. There was a small amount of flush production and the well was pumped intermittently when the fluid level built up. CO2#16 was shut-in on May 31, 2007 following a rod part because the well was not economic to produce. CO2#13 was shut-in on April 11, 2007 to observe pressure buildup and the effect on oil production rate from the CO2 pattern. The well was returned to production on May 17, 2007 for
DE-AC26-00BC15124 Semi Annual Technical Progress Report June 30,2007
6
a total shut-in period of 36 days. During the shut-in period, the bottom hole pressure in CO2#13 increased from 62 psi prior to shut-in to 278 psi before the well was returned to production. The rate of pressure buildup in this well is small and provides further evidence of the poor reservoir continuity between CO2I-1 and CO2#13. In contrast, fluid levels in CO2#16 buildup rapidly following shut-in of the well. Bottom hole pressure increased to about 575 psi after shut-in. CO2 #16 appears to have better hydraulic connection with CO2 I-1 than CO2#13.
0
500
1000
1500
2000
2500
3000
Jul-0
6
Aug-06
Sep-06
Oct-06
Nov-06
Dec-06
Jan-07
Feb-07
Mar-07
Apr-07
May-07
Jun-07
Bot
tom
Hol
e Pr
essu
re, p
si
0.0
50.0
100.0
150.0
200.0
250.0
300.0
Inje
ctio
n R
ate,
B/D
PressureRate
Rates are 7 day running average
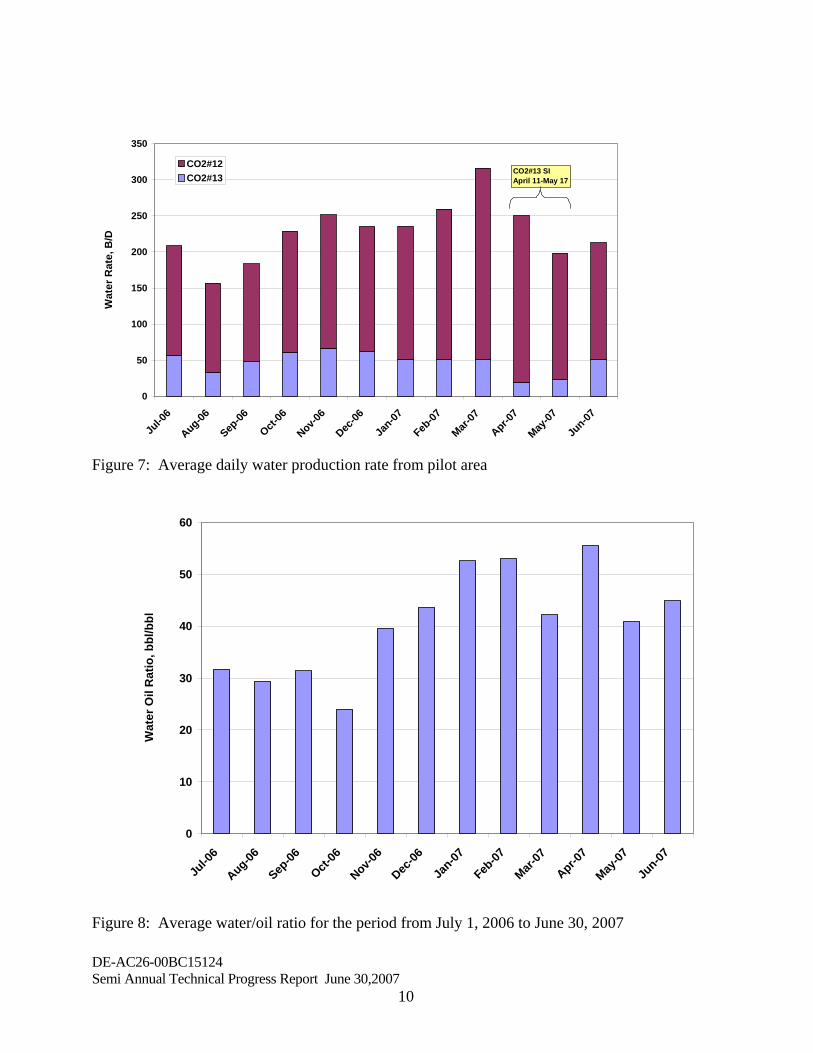
Figure 2: Injection rate and bottomhole pressure during injection into CO2 I-1 Figures 6 and 7 show the average monthly oil and water production rates from the pilot. Average water production rates are consistent with the trends shown in Figure 4. Average oil production rates were about 5.2 B/D for the period from January 1-June 30, 2007. A sustained fluid withdrawal rate of about 200 B/D from CO2#12 and CO2#13 appears to be necessary to obtain higher oil rates. Figure 8 shows the average water-oil ratio for the same period. Data were averaged over the previous six days to dampen the effect of fluctuations in rates. The water oil ratio was stable for much of the period, increasing toward the end of the year possibly due to increased injection into CO2#18. Cumulative oil production from the pilot area is 4862 bbl. Water production from the pilot area was about 278,000 bbl
DE-AC26-00BC15124 Semi Annual Technical Progress Report June 30,2007
7
0
200
400
600
800
1000
1200
1400
1600
1800
7/1/06
8/1/06
9/1/06
10/2/
06
11/2/
06
12/3/
061/3
/072/3
/073/6
/074/6
/075/7
/076/7
/07
Bot
tom
hole
Pre
ssur
e, p
si
0
50
100
150
200
250
300
Inje
ctio
n R
ate,
B/D
PressureRate
Rates are 7 day running
Figure 3: Injection rate and pressures into CO2#10
0
500
1000
1500
2000
2500
7/1 8/1 9/1 10/2
11/2
12/3 1/3 2/3 3/6 4/6 5/7 6/7
Bot
tom
hole
Pre
ssur
e, p
si
0
10
20
30
40
50
60
70
80
90
100
Inje
ctio
n R
ate,
B/D
PressureRate-7 Day Average
Figure 4: Injection rate and pressures in CO2#18
DE-AC26-00BC15124 Semi Annual Technical Progress Report June 30,2007
8
0
50
100
150
200
250
300
350
400
450
500
Jun-06
Jul-0
6
Aug-06
Sep-06
Oct-06
Nov-06
Dec-06
Jan-07
Mar-07
Apr-07
May-07
Jun-07
Wat
er P
rodu
ctio
n R
ate,
B/D
0
5
10
15
20
25
Oil
Rat
e, B
/D
Water RateOil Rate
Figure 5: Oil and water production rates from pilot area.
0.0
2.0
4.0
6.0
8.0
10.0
12.0
Jul-06 Aug-06 Sep-06 Oct-06 Nov-06 Dec-06 Jan-07 Feb-07 Mar-07 Apr-07 May-07 Jun-07
Oil
Rat
e, B
/D
CO2#13CO2#12
Flush Production from CO2#16 and Increase Rate in CO2#12
CO2#13 SIApril 11-May 17
Figure 6: Average daily oil production rates from pilot area
DE-AC26-00BC15124 Semi Annual Technical Progress Report June 30,2007
9
0
50
100
150
200
250
300
350
Jul-0
6
Aug-06
Sep-06
Oct-06
Nov-06
Dec-06
Jan-07
Feb-07
Mar-07
Apr-07
May-07
Jun-07
Wat
er R
ate,
B/D
CO2#12CO2#13
CO2#13 SIApril 11-May 17
Figure 7: Average daily water production rate from pilot area
0
10
20
30
40
50
60
Jul-0
6
Aug-06
Sep-06
Oct-06
Nov-06
Dec-06
Jan-07
Feb-07
Mar-07
Apr-07
May-07
Jun-07
Wat
er O
il R
atio
, bbl
/bbl
Figure 8: Average water/oil ratio for the period from July 1, 2006 to June 30, 2007
DE-AC26-00BC15124 Semi Annual Technical Progress Report June 30,2007
10
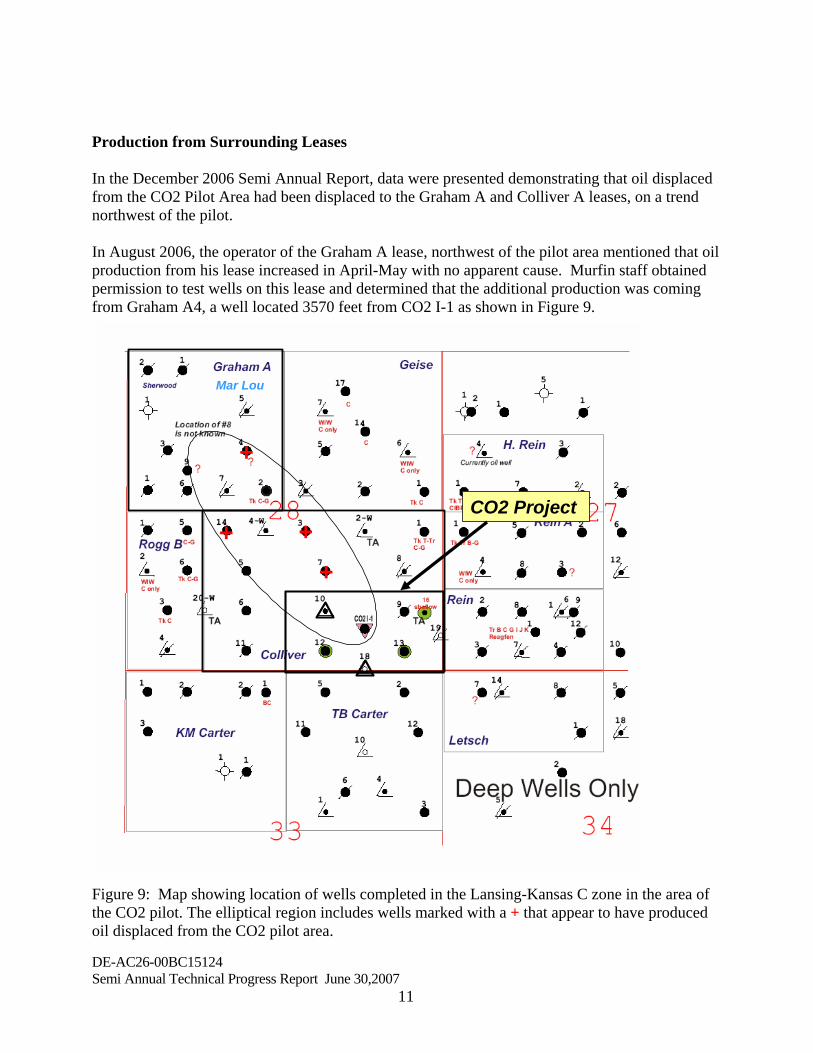
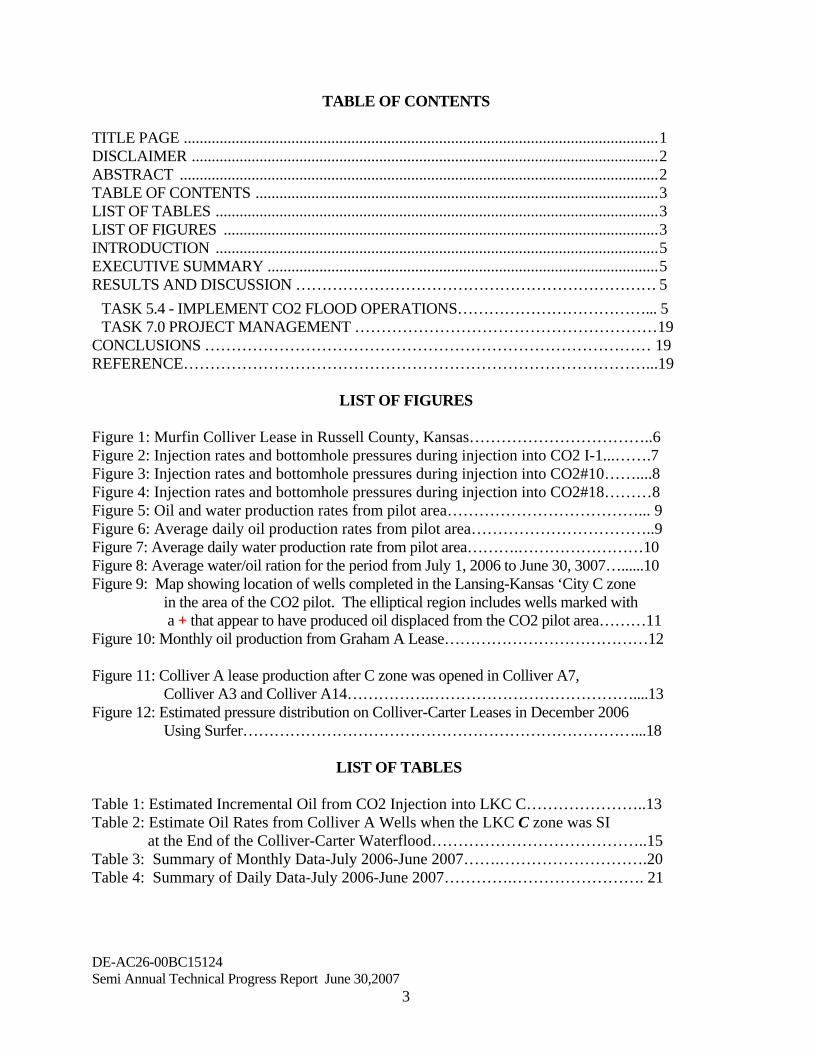
Production from Surrounding Leases In the December 2006 Semi Annual Report, data were presented demonstrating that oil displaced from the CO2 Pilot Area had been displaced to the Graham A and Colliver A leases, on a trend northwest of the pilot. In August 2006, the operator of the Graham A lease, northwest of the pilot area mentioned that oil production from his lease increased in April-May with no apparent cause. Murfin staff obtained permission to test wells on this lease and determined that the additional production was coming from Graham A4, a well located 3570 feet from CO2 I-1 as shown in Figure 9.
DE-AC26-00BC15124 Semi Annual Technical Progress Report June 30,2007
11
+
++
+
Mar Lou
CO2 Project
+
++
+
Mar Lou
CO2 Project
Figure 9: Map showing location of wells completed in the Lansing-Kansas C zone in the area of the CO2 pilot. The elliptical region includes wells marked with a + that appear to have produced oil displaced from the CO2 pilot area.
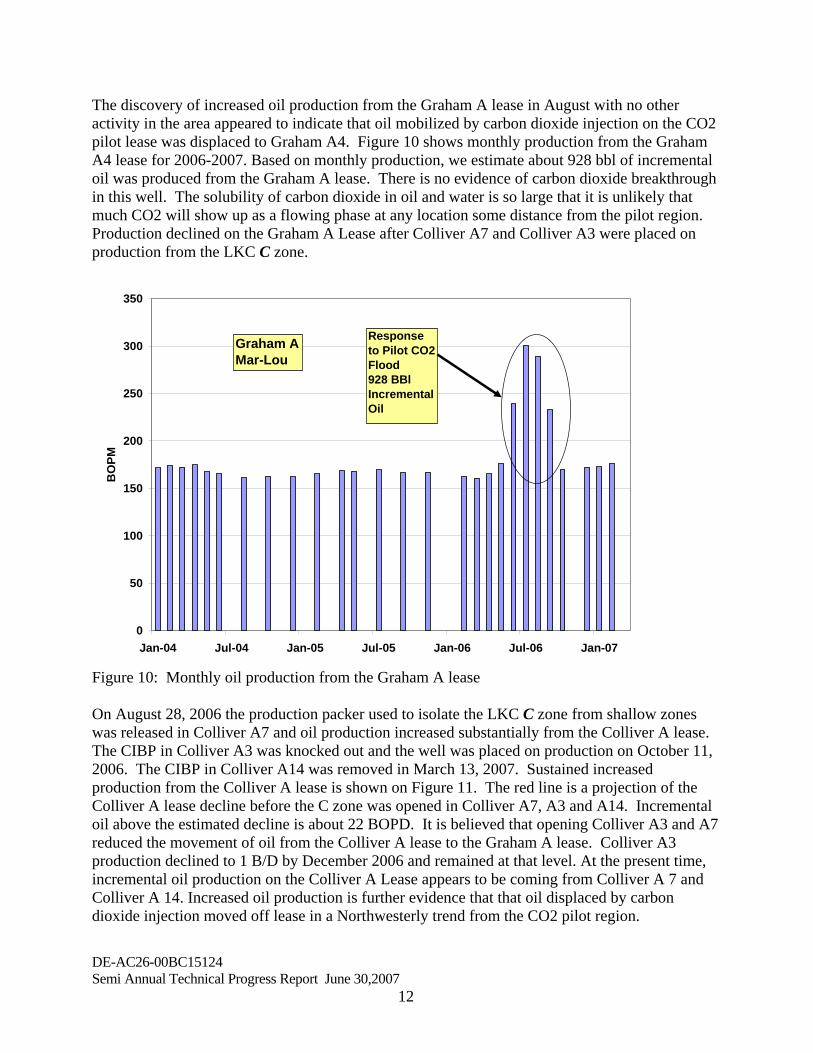
The discovery of increased oil production from the Graham A lease in August with no other activity in the area appeared to indicate that oil mobilized by carbon dioxide injection on the CO2 pilot lease was displaced to Graham A4. Figure 10 shows monthly production from the Graham A4 lease for 2006-2007. Based on monthly production, we estimate about 928 bbl of incremental oil was produced from the Graham A lease. There is no evidence of carbon dioxide breakthrough in this well. The solubility of carbon dioxide in oil and water is so large that it is unlikely that much CO2 will show up as a flowing phase at any location some distance from the pilot region. Production declined on the Graham A Lease after Colliver A7 and Colliver A3 were placed on production from the LKC C zone.
0
50
100
150
200
250
300
350
Jan-04 Jul-04 Jan-05 Jul-05 Jan-06 Jul-06 Jan-07
BO
PM
Graham AMar-Lou
Response to Pilot CO2 Flood928 BBlIncremental Oil
Figure 10: Monthly oil production from the Graham A lease On August 28, 2006 the production packer used to isolate the LKC C zone from shallow zones was released in Colliver A7 and oil production increased substantially from the Colliver A lease. The CIBP in Colliver A3 was knocked out and the well was placed on production on October 11, 2006. The CIBP in Colliver A14 was removed in March 13, 2007. Sustained increased production from the Colliver A lease is shown on Figure 11. The red line is a projection of the Colliver A lease decline before the C zone was opened in Colliver A7, A3 and A14. Incremental oil above the estimated decline is about 22 BOPD. It is believed that opening Colliver A3 and A7 reduced the movement of oil from the Colliver A lease to the Graham A lease. Colliver A3 production declined to 1 B/D by December 2006 and remained at that level. At the present time, incremental oil production on the Colliver A Lease appears to be coming from Colliver A 7 and Colliver A 14. Increased oil production is further evidence that that oil displaced by carbon dioxide injection moved off lease in a Northwesterly trend from the CO2 pilot region.
DE-AC26-00BC15124 Semi Annual Technical Progress Report June 30,2007
12
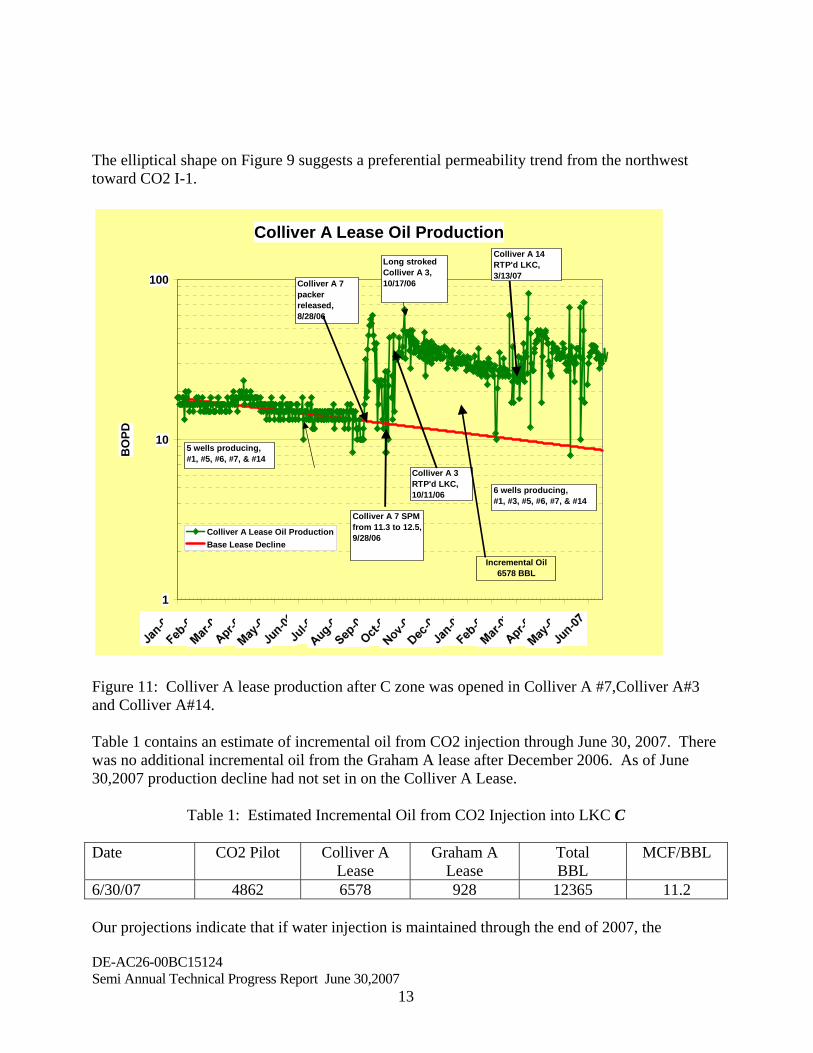
The elliptical shape on Figure 9 suggests a preferential permeability trend from the northwest toward CO2 I-1.
Colliver A Lease Oil Production
1
10
100
BO
PD
Colliver A Lease Oil ProductionBase Lease Decline
Colliver A 14 RTP'd LKC, 3/13/07
Colliver A 7 packer released, 8/28/06
Colliver A 7 SPM from 11.3 to 12.5, 9/28/06
5 wells producing, #1, #5, #6, #7, & #14
Long stroked Colliver A 3, 10/17/06
6 wells producing, #1, #3, #5, #6, #7, & #14
Colliver A 3 RTP'd LKC, 10/11/06
Incremental Oil6578 BBL
Figure 11: Colliver A lease production after C zone was opened in Colliver A #7,Colliver A#3 and Colliver A#14. Table 1 contains an estimate of incremental oil from CO2 injection through June 30, 2007. There was no additional incremental oil from the Graham A lease after December 2006. As of June 30,2007 production decline had not set in on the Colliver A Lease.
Table 1: Estimated Incremental Oil from CO2 Injection into LKC C
Date CO2 Pilot Colliver A
Lease Graham A
Lease Total BBL
MCF/BBL
6/30/07 4862 6578 928 12365 11.2 Our projections indicate that if water injection is maintained through the end of 2007, the
DE-AC26-00BC15124 Semi Annual Technical Progress Report June 30,2007
13
DE-AC26-00BC15124 Semi Annual Technical Progress Report June 30,2007
14
incremental oil attributed to carbon dioxide in the pilot region may approach what has been observed in large scale West Texas carbon dioxide floods. This would demonstrate that carbon dioxide mobilized oil in the LKC C zone, a key objective of the pilot project. Bottom hole pressures in CO2 I-1 and CO2#10 have been maintained well above the minimum miscibility pressure to enhance the capability of the remaining carbon dioxide to displace oil. Production of CO2, primarily from CO2#12 is on the order of 5-6% of the injected CO2. About 95% of the carbon dioxide remains in the reservoir. We believe that the CO2 is still mobilizing oil as it is displaced by the injected water. There is the possibility that oil mobilized by carbon dioxide injection may exceed the performance of West Texas reservoirs because little carbon dioxide has been produced. The problem is that the some of the mobilized oil is not showing up in production from the pilot lease and additional oil recovery appears likely to occur on the Colliver A lease. Determining Incremental Oil Attributed to Carbon Dioxide Injection The CO2 project was designed based on an estimate that about 30% of the CO2 would move toward the north of the EW line through CO2I-1 displacing oil from the pilot lease to the Colliver A lease. The remaining 70% of the injected CO2 was projected to remain within the pilot area south of the EW line through CO2I-1 and be effective in displacing oil toward CO2#12 and CO2#13. These projections were made from reservoir simulation of flow patterns in the pilot area using water injection into CO2#10 as a confinement well to limit fluid flow to the north of the pilot area. Production from project wells (CO2#12 and CO2#13) is less than anticipated. Response of CO2#13 has been minimal to the injection of CO2. Displacement of carbon dioxide toward CO2#13 is substantially less than estimated from the reservoir simulation. There is no indication of an oil bank generated by CO2 displacement arriving in this well other than the initial increase from no oil production to about 1 B/D. This indicates that not much carbon dioxide was displaced toward CO2#13. As of June 30, 2007, the amount of oil produced from the pilot area was 4862 bbl. Much of this oil was produced from CO2#12. All of this oil is considered incremental oil attributed to CO2 injection because there was no oil production from CO2#12 and CO2#13 during water injection while conducting reservoir continuity tests between wells and during the period when the reservoir pressure was increasing prior to conversion to carbon dioxide injection. Although half of the planned CO2 was injected, only about 5% of the injected CO2 has been produced. Consequently, 95% of the injected CO2 remains in the C zone where it is being displaced by injected water. Pressures in much of the pilot region have remained above MMP through maintaining injection pressures in CO2I-1, CO2#10 and CO2#18. Consequently, we believe that oil continues to be displaced by carbon dioxide. The discovery of increased monthly oil production volumes from the Graham A lease in May-August, NW of the Colliver A lease, was the first indication that oil displaced by CO2 injection
DE-AC26-00BC15124 Semi Annual Technical Progress Report June 30,2007
15
may have been displaced from the pilot area. The Graham A lease is shown on Figure 1. Monthly oil production from this lease, attributed to Graham A4, increased from 70 BOPM to ~350BOPM for the period from April 2006-July 2006. No other activity or change in operation was identified in the region surrounding the Graham A lease that could have caused the oil production to increase. Cumulative incremental oil on the Graham A lease is about 928 bbl. Production data from the Colliver A lease demonstrates that additional oil is being produced from the LKC “C” zone after the packer or bridge plugs were removed from Colliver A7 (8/28/06), Colliver A3 (10/17/06) and Colliver A14 (3/13/07). As of June 30, 2007, the incremental oil above the Colliver Lease decline rate is about 22B/D. The amount of incremental oil produced from the Colliver Lease is about 6578 bbl. Demonstrating that Incremental Oil is Attributable to CO2 Injection An issue that has been raised is how can we demonstrate that incremental oil from Graham A and Colliver A leases is from CO2 injection as opposed to water injection? These leases were waterflooded extensively from the mid 1960’s to 1987. The C zone in Colliver A7, Colliver A3 and Colliver A14 was isolated from the production wellbores in the 1980’s as the waterflood ended. A CIBP was installed above the LKC interval in Colliver A7 in 1989. Colliver Lease production in 1988 was 32.7 BOPD from 7 wells with 50% allocated to C zone. Table 2 summarizes the estimated or measured oil rate when the C zone was shut-in. Each of these wells had produced several hundred thousands barrels of water and was operating at high water-oil ratios when the C zone was isolated. The data in Table 2 indicate that no more than 4.52 BOPD would be produced if the C zone was opened with continued waterflooding. Production rates would decline with time and volume of water injected. It is noted that neither CO2#12 nor CO2#13 produced oil when the LKC C zone was isolated and placed on production. Table 2: Estimate Oil Rates from Colliver A Wells when the LKC C zone was SI at End of the Colliver-Carter Waterflood
Well Date Shut-in
Oil Rate when C Zone was SI, B/D
Colliver A7 September 1989 2 Colliver A3 March 1993 0.9 Colliver A14 June 1984 1.52
Timing of Oil Production Response Our current reservoir models do not predict the oil production rates corresponding to field results. We recognize that this is important for economic analysis and consideration of application of carbon dioxide flooding to the Hall Gurney Field in a commercial scale. Although the initial response to carbon dioxide injection resulted in an increase in oil production from 0 B/D to ~3 B/D, an oil bank has never arrived at CO2#13. The arrival of an oil bank at CO2#12 probably
DE-AC26-00BC15124 Semi Annual Technical Progress Report June 30,2007
16
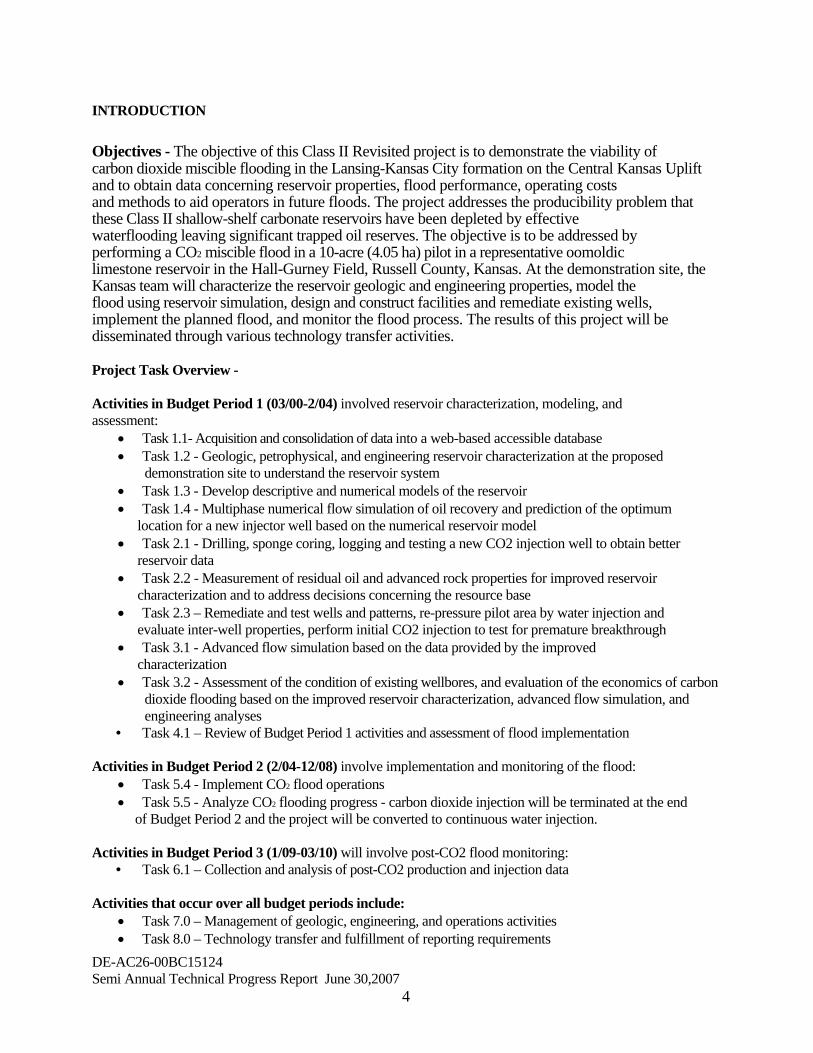
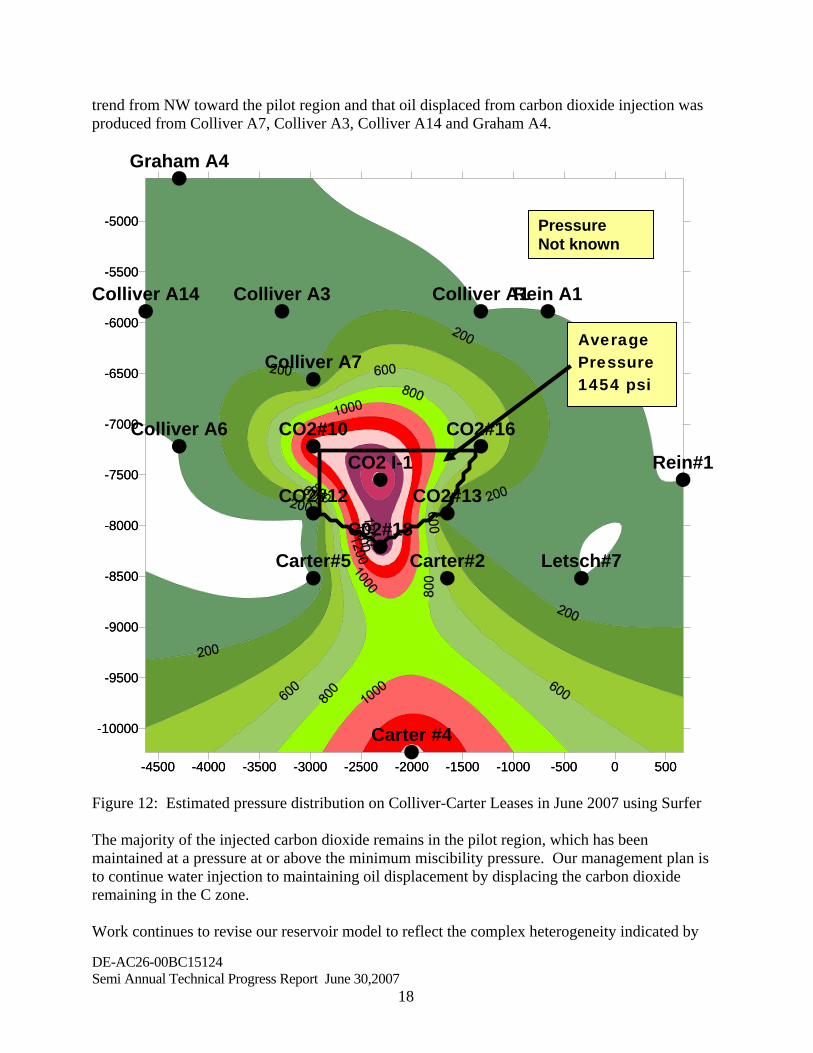
occurred in April or May 2006, coinciding with pump difficulties. Arrival may have been sooner if pump problems had not occurred. In addition, the increase in oil rate was less than predicted from our reservoir models. The increase in oil production on the Graham A lease occurred in April 2006, about 850 days after the beginning of carbon dioxide injection into CO2 I-1. The common arrival time of an increase in oil production in both the pilot and the Graham A lease is probably coincidental. However, the arrival time does help estimate the velocity of the oil bank. Well Graham A4 is located about 3570 feet from CO2 I-1. An oil bank flowing through a thin high permeability streak at the top of the LKC C would need to have an average frontal velocity of 4.2 ft/D from CO2 I-1 to reach Graham A4. Colliver A7 is about 1190 feet from CO2 I-1. At a frontal velocity of 4.2 ft/D, the oil bank that arrived at Graham A4 in April 2006 would have passed in the vicinity of Colliver A7 about 283 days after the beginning of injection or ~ September 9, 2004. It appears that the oil production response would have been substantially earlier if Colliver A7 was part of the pilot project. This well was excluded from consideration in the pilot region because of a suspected connection to the G zone (later shown to be incorrect) and the high productive capacity of this well. It is evident from the field response that reservoir heterogeneity dominates the response of the pilot pattern to CO2 injection. There is clearly a SE-NW permeability trend that is not properly described in our reservoir model. The continuity between CO2 I-1 and CO2#13 must be less than what is currently in the model. Remediation of CO2#18 has permitted maintenance of more uniform injection rates and pressures at the south end of the CO2 pilot. This was done to enhance the productivity of CO2#12. Increase in BHP in CO2#18 has caused the fluid level in Carter 2 to increase. Carter 2 was placed on production for about two months but was shut in because it was not economic to produce. The production response from Carter 2 indicates that there was no oil bank in the vicinity of the well. Disposal of produced water began in November 2006 in Carter #4. However, the increase in fluid level in Carter #2 began well before disposal of water resumed on the Carter Lease after being discontinued for several months. There has been no effect of CO2#18 on the productivity of either CO2#12 or CO2#13 as of the end of December. This is further evidence that CO2 #13 is poorly connected to the pilot region. Colliver A1 is located 2113 feet NE of CO2 I-1. There has been no production response in this well. We plan to continue to revise the reservoir model in attempt to predict rates and arrival times of oil banks as the field was operated. Pressure in Pilot Region Estimated pressure contours are shown in Figure 12 as of June 2007. The average pressure in the PPV region was estimated using Surfer, a mapping program. In developing Figure 12, fluid level or pressure measurements were available from CO2 I-1, CO2#10, CO2#12, CO2#13, CO2#16, Carter 2 and Carter 5. We assumed that all other wells that were open in the C zone were pumped off. No data are available in the white areas beyond the pilot area. Also shown on Figure 12 is the outline of the region where carbon dioxide is estimated to displace reservoir oil and water.
DE-AC26-00BC15124 Semi Annual Technical Progress Report June 30,2007
17
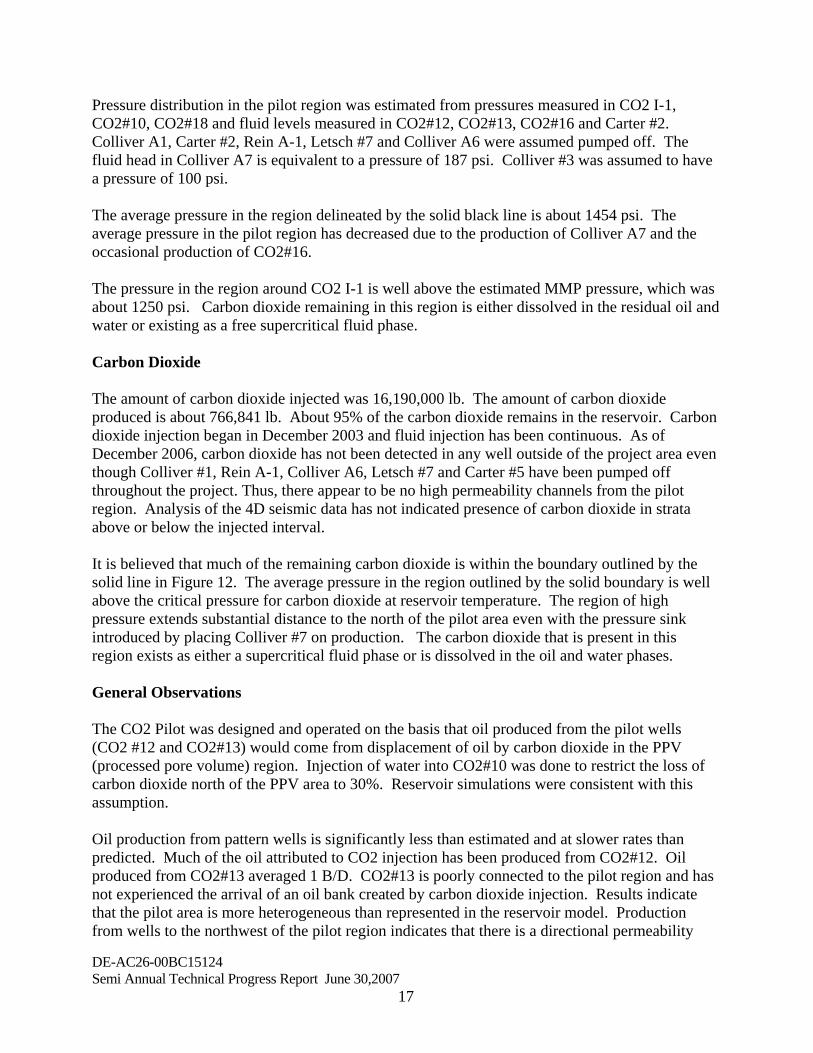
Pressure distribution in the pilot region was estimated from pressures measured in CO2 I-1, CO2#10, CO2#18 and fluid levels measured in CO2#12, CO2#13, CO2#16 and Carter #2. Colliver A1, Carter #2, Rein A-1, Letsch #7 and Colliver A6 were assumed pumped off. The fluid head in Colliver A7 is equivalent to a pressure of 187 psi. Colliver #3 was assumed to have a pressure of 100 psi. The average pressure in the region delineated by the solid black line is about 1454 psi. The average pressure in the pilot region has decreased due to the production of Colliver A7 and the occasional production of CO2#16. The pressure in the region around CO2 I-1 is well above the estimated MMP pressure, which was about 1250 psi. Carbon dioxide remaining in this region is either dissolved in the residual oil and water or existing as a free supercritical fluid phase. Carbon Dioxide The amount of carbon dioxide injected was 16,190,000 lb. The amount of carbon dioxide produced is about 766,841 lb. About 95% of the carbon dioxide remains in the reservoir. Carbon dioxide injection began in December 2003 and fluid injection has been continuous. As of December 2006, carbon dioxide has not been detected in any well outside of the project area even though Colliver #1, Rein A-1, Colliver A6, Letsch #7 and Carter #5 have been pumped off throughout the project. Thus, there appear to be no high permeability channels from the pilot region. Analysis of the 4D seismic data has not indicated presence of carbon dioxide in strata above or below the injected interval. It is believed that much of the remaining carbon dioxide is within the boundary outlined by the solid line in Figure 12. The average pressure in the region outlined by the solid boundary is well above the critical pressure for carbon dioxide at reservoir temperature. The region of high pressure extends substantial distance to the north of the pilot area even with the pressure sink introduced by placing Colliver #7 on production. The carbon dioxide that is present in this region exists as either a supercritical fluid phase or is dissolved in the oil and water phases. General Observations The CO2 Pilot was designed and operated on the basis that oil produced from the pilot wells (CO2 #12 and CO2#13) would come from displacement of oil by carbon dioxide in the PPV (processed pore volume) region. Injection of water into CO2#10 was done to restrict the loss of carbon dioxide north of the PPV area to 30%. Reservoir simulations were consistent with this assumption. Oil production from pattern wells is significantly less than estimated and at slower rates than predicted. Much of the oil attributed to CO2 injection has been produced from CO2#12. Oil produced from CO2#13 averaged 1 B/D. CO2#13 is poorly connected to the pilot region and has not experienced the arrival of an oil bank created by carbon dioxide injection. Results indicate that the pilot area is more heterogeneous than represented in the reservoir model. Production from wells to the northwest of the pilot region indicates that there is a directional permeability
trend from NW toward the pilot region and that oil displaced from carbon dioxide injection was produced from Colliver A7, Colliver A3, Colliver A14 and Graham A4.
-4500 -4000 -3500 -3000 -2500 -2000 -1500 -1000 -500 0 500
-10000
-9500
-9000
-8500
-8000
-7500
-7000
-6500
-6000
-5500
-5000
CO2 I-1
CO2#10
CO2#12 CO2#13
CO2#16Colliver A6
Colliver A7
C02#18
Colliver A1
Carter#2Carter#5
Rein A1
Letsch#7
Rein#1
Graham A4
Carter #4
Colliver A3Colliver A14
-4500 -4000 -3500 -3000 -2500 -2000 -1500 -1000 -500 0 500
-10000
-9500
-9000
-8500
-8000
-7500
-7000
-6500
-6000
-5500
-5000
Pressure Not known
Average Pressure 1454 psi
Figure 12: Estimated pressure distribution on Colliver-Carter Leases in June 2007 using Surfer The majority of the injected carbon dioxide remains in the pilot region, which has been maintained at a pressure at or above the minimum miscibility pressure. Our management plan is to continue water injection to maintaining oil displacement by displacing the carbon dioxide remaining in the C zone. Work continues to revise our reservoir model to reflect the complex heterogeneity indicated by
DE-AC26-00BC15124 Semi Annual Technical Progress Report June 30,2007
18
DE-AC26-00BC15124 Semi Annual Technical Progress Report June 30,2007
19
field performance. TASK 7.0 PROJECT MANAGEMENT A project management plan was developed consisting of a Technical Team and an Operational Team. Technical Team members include Paul Willhite, Don Green, Jyun Syung and Alan Byrnes. The Operational Team member is Richard Pancake. Changes in field operations are initiated through the Operational Team. Coordination of the activities is done between Paul Willhite (Technical Team) and Richard Pancake (Operational Team). Production and injection workbooks are updated biweekly by personnel in Murfin’s office in Russell and transmitted electronically to members of the Technical and Operational Team. These Excel workbooks are archived periodically in an FTP site accessible to members of the Technical and Operational Teams. Various members of the Kansas CO2 Team communicate primarily by email over specific technical or business issues. Conference calls are arranged when the discussion involves more than two members of a team.
CONCLUSIONS Water injection continued in CO2 I-1 to displace the oil bank generated by carbon dioxide injection to the production wells. By June 30, 2007, 116,101 bbl of water were injected into CO2 I-1 and 4,862 bbl of oil were produced from the pilot pattern. Oil production rates increased from averaged 5.2 B/D during the period from January 1-June 30. Production from wells to the northwest of the pilot region indicates that oil displaced from carbon dioxide injection was produced from Colliver A7, Colliver A3, Colliver A14 and Graham A4. The amount of incremental oil produced from adjacent leases is about 7506 bbl. Total oil production attributed to CO2 injection is 12,365 bbl. This is equivalent to a gross CO2 utilization of 11.2 MCF/bbl. There is evidence of a directional permeability trend from NW to SE through the pilot region. The majority of the injected carbon dioxide remains in the pilot region, which has been maintained at a pressure at or above the minimum miscibility pressure. Our management plan is to continue water injection to maintaining oil displacement by displacing the carbon dioxide remaining in the C zone.
REFERENCE
1. “Field Demonstration of Carbon Dioxide Miscible Flooding in the Lansing Kansas City Formation, Central Kansas”, Semi Annual Report July 1, 2004-December 31, 2004, DOE Contract No. DE-AC26-00BC15124.
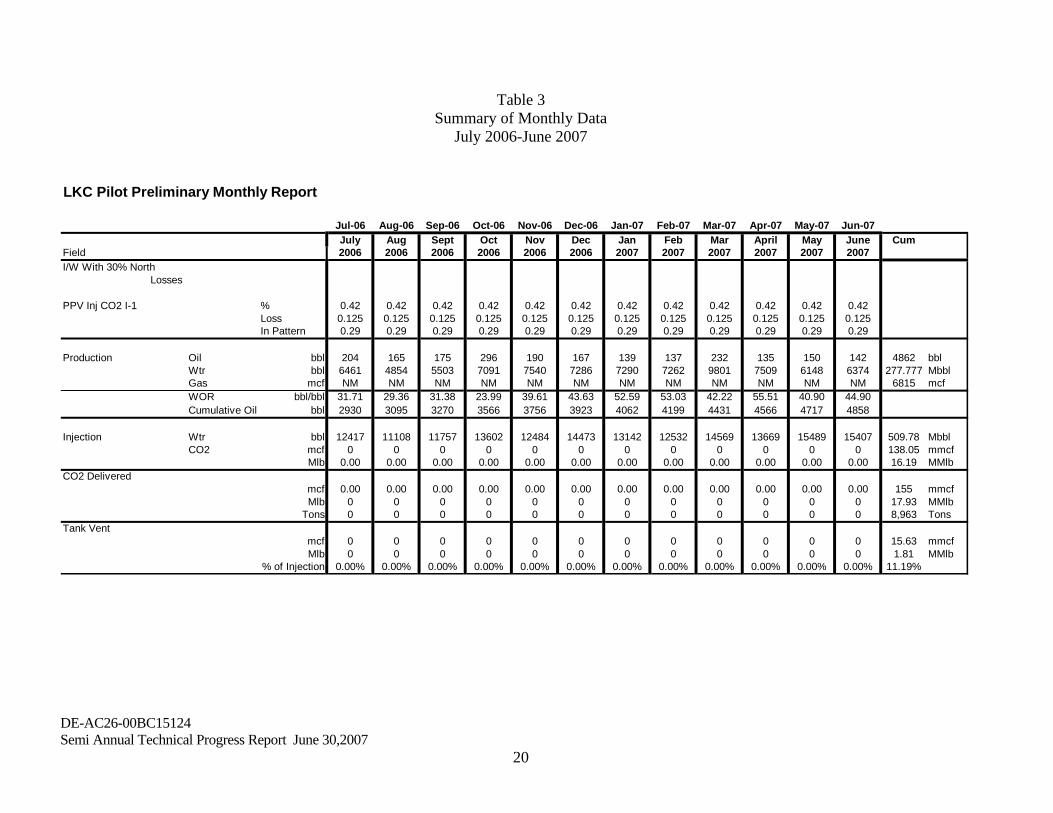
Table 3
Summary of Monthly Data July 2006-June 2007
Jul-06 Aug-06 Sep-06 Oct-06 Nov-06 Dec-06 Jan-07 Feb-07 Mar-07 Apr-07 May-07 Jun-07July Aug Sept Oct Nov Dec Jan Feb Mar April May June Cum
Field 2006 2006 2006 2006 2006 2006 2007 2007 2007 2007 2007 2007
% 0.42 0.42 0.42 0.42 0.42 0.42 0.42 0.42 0.42 0.42 0.42 0.42Loss 0.125 0.125 0.125 0.125 0.125 0.125 0.125 0.125 0.125 0.125 0.125 0.125In Pattern 0.29 0.29 0.29 0.29 0.29 0.29 0.29 0.29 0.29 0.29 0.29 0.29
Production Oil bbl 204 165 175 296 190 167 139 137 232 135 150 142 4862 bblWtr bbl 6461 4854 5503 7091 7540 7286 7290 7262 9801 7509 6148 6374 277.777 MbblGas mcf NM NM NM NM NM NM NM NM NM NM NM NM 6815 mcfWOR bbl/bbl 31.71 29.36 31.38 23.99 39.61 43.63 52.59 53.03 42.22 55.51 40.90 44.90Cumulative Oil bbl 2930 3095 3270 3566 3756 3923 4062 4199 4431 4566 4717 4858
Wtr bbl 12417 11108 11757 13602 12484 14473 13142 12532 14569 13669 15489 15407 509.78 MbblCO2 mcf 0 0 0 0 0 0 0 0 0 0 0 0 138.05 mmcf
Mlb 0.00 0.00 0.00 0.00 0.00 0.00 0.00 0.00 0.00 0.00 0.00 0.00 16.19 MMlb
mcf 0.00 0.00 0.00 0.00 0.00 0.00 0.00 0.00 0.00 0.00 0.00 0.00 155 mmcfMlb 0 0 0 0 0 0 0 0 0 0 0 0 17.93 MMlb
Tons 0 0 0 0 0 0 0 0 0 0 0 0 8,963 Tons
mcf 0 0 0 0 0 0 0 0 0 0 0 0 15.63 mmcfMlb 0 0 0 0 0 0 0 0 0 0 0 0 1.81 MMlb
% of Injection 0.00% 0.00% 0.00% 0.00% 0.00% 0.00% 0.00% 0.00% 0.00% 0.00% 0.00% 0.00% 11.19%
Injection
CO2 Delivered
Tank Vent
PPV Inj CO2 I-1
LKC Pilot Preliminary Monthly Report
I/W With 30% NorthLosses
DE-AC26-00BC15124 Semi Annual Technical Progress Report June 30,2007
20
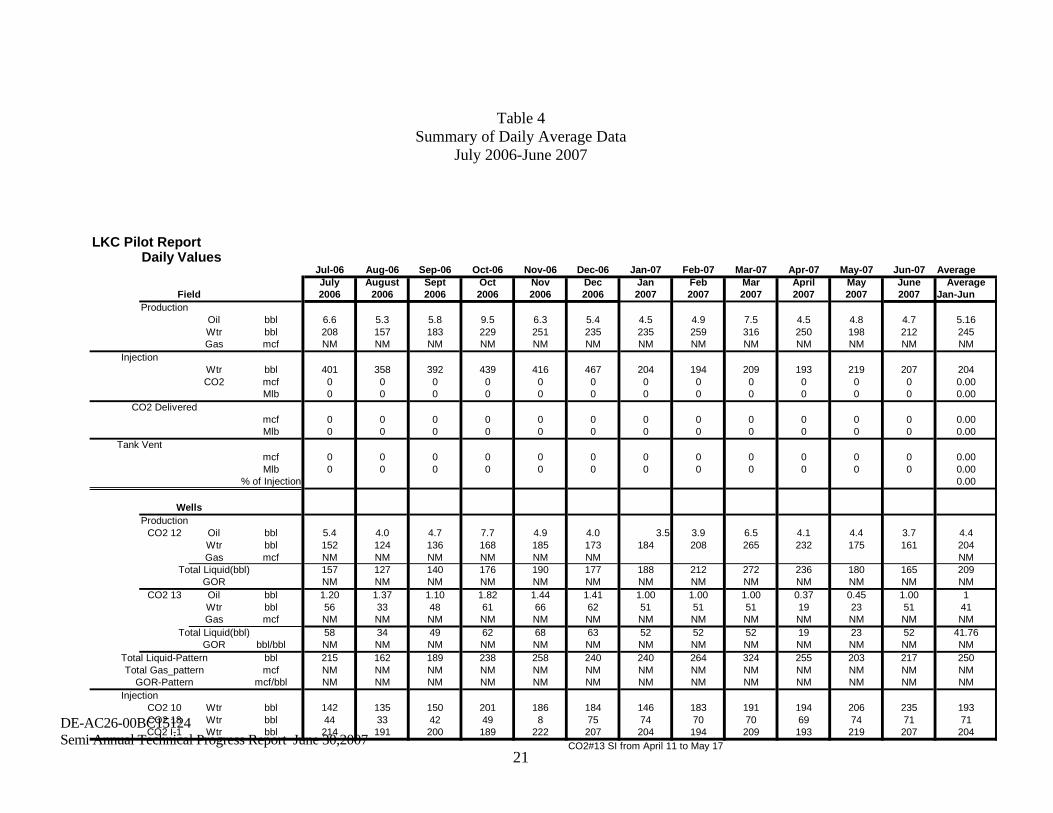
Table 4 Summary of Daily Average Data
July 2006-June 2007
DE-AC26-00BC15124 Semi Annual Technical Progress Report June 30,2007
21
Jul-06 Aug-06 Sep-06 Oct-06 Nov-06 Dec-06 Jan-07 Feb-07 Mar-07 Apr-07 May-07 Jun-07 AverageJuly August Sept Oct Nov Dec Jan Feb Mar April May June Average2006 2006 2006 2006 2006 2006 2007 2007 2007 2007 2007 2007 Jan-Jun
Oil bbl 6.6 5.3 5.8 9.5 6.3 5.4 4.5 4.9 7.5 4.5 4.8 4.7 5.16Wtr bbl 208 157 183 229 251 235 235 259 316 250 198 212 245Gas mcf NM NM NM NM NM NM NM NM NM NM NM NM NM
Wtr bbl 401 358 392 439 416 467 204 194 209 193 219 207 204CO2 mcf 0 0 0 0 0 0 0 0 0 0 0 0 0.00
Mlb 0 0 0 0 0 0 0 0 0 0 0 0 0.00
mcf 0 0 0 0 0 0 0 0 0 0 0 0 0.00Mlb 0 0 0 0 0 0 0 0 0 0 0 0 0.00
mcf 0 0 0 0 0 0 0 0 0 0 0 0 0.00Mlb 0 0 0 0 0 0 0 0 0 0 0 0 0.00
% of Injection 0.00
CO2 12 Oil bbl 5.4 4.0 4.7 7.7 4.9 4.0 3.5 3.9 6.5 4.1 4.4 3.7 4.4Wtr bbl 152 124 136 168 185 173 184 208 265 232 175 161 204Gas mcf NM NM NM NM NM NM NM
Total Liquid(bbl) 157 127 140 176 190 177 188 212 272 236 180 165 209GOR NM NM NM NM NM NM NM NM NM NM NM NM NM
CO2 13 Oil bbl 1.20 1.37 1.10 1.82 1.44 1.41 1.00 1.00 1.00 0.37 0.45 1.00 1Wtr bbl 56 33 48 61 66 62 51 51 51 19 23 51 41Gas mcf NM NM NM NM NM NM NM NM NM NM NM NM NM
Total Liquid(bbl) 58 34 49 62 68 63 52 52 52 19 23 52 41.76GOR bbl/bbl NM NM NM NM NM NM NM NM NM NM NM NM NM
Total Liquid-Pattern bbl 215 162 189 238 258 240 240 264 324 255 203 217 250Total Gas_pattern mcf NM NM NM NM NM NM NM NM NM NM NM NM NM
GOR-Pattern mcf/bbl NM NM NM NM NM NM NM NM NM NM NM NM NM
CO2 10 Wtr bbl 142 135 150 201 186 184 146 183 191 194 206 235 193CO2 18 Wtr bbl 44 33 42 49 8 75 74 70 70 69 74 71 71CO2 I-1 Wtr bbl 214 191 200 189 222 207 204 194 209 193 219 207 204
CO2#13 SI from April 11 to May 17
Injection
CO2 Delivered
Tank Vent
Wells
LKC Pilot ReportDaily Values
FieldProduction
Production
Injection


![REDD + ANNUAL COUNTRY PROGRESS REPORTING (with semi … · REDD + ANNUAL COUNTRY PROGRESS REPORTING (with semi-annual update) COUNTRY: [Sudan] PERIOD: [September 2015- August 2017]](https://img.pdfslide.net/doc/110x75/5f54a772acaeaa1f901f855c/redd-annual-country-progress-reporting-with-semi-redd-annual-country-progress.jpg)


![REDD + ANNUAL COUNTRY PROGRESS REPORTING (with semi … · PERIOD: [Agosto 2014 - Agosto 2015] Background: This country reporting framework has been developed following the structure](https://img.pdfslide.net/doc/110x75/60376e81f0c1f811d053c85a/redd-annual-country-progress-reporting-with-semi-period-agosto-2014-agosto.jpg)


![REDD ANNUAL COUNTRY PROGRESS REPORT COUNTRY: PERIOD · FCPF M&E Framework 24 Feb 2015 2 REDD + ANNUAL COUNTRY PROGRESS REPORTING (with semi‐annual update) COUNTRY: [Suriname] PERIOD:](https://img.pdfslide.net/doc/110x75/5ec900f26b6392450e612707/redd-annual-country-progress-report-country-period-fcpf-me-framework-24-feb.jpg)