Embed Size (px)
Citation preview
PLEASE TURN OVER
SENIOR CERTIFICATE EXAMINATION NOVEMBER 2005
GEOGRAPHY HIGHER GRADE: PAPER II
Time: 3 hours 300 marks PLEASE READ THE FOLLOWING INSTRUCTIONS CAREFULLY 1. This paper consists of 24 pages and an insert of four pages (i – iv). Detach the insert
from the middle of the question paper. Please check that your question paper is complete. 2. Read the questions carefully. 3. ANSWER THREE QUESTIONS AS FOLLOWS:
One from Section A One from Section B One from Section C
4. Credit will be given for:
• interpretation and explanation; and • evidence of personal observation in the field where this is appropriate to the
question. 5. You are encouraged to use sketch maps, diagrams and other explanatory drawings to
support your answers whenever relevant. 6. Number your answers exactly as the questions are numbered. 7. Please circle the number of each question answered on the back inside flap of your answer
book. 8. It is in your own interest to write legibly and to present your work neatly. 9. There is a glossary of words on the final page which will help you to understand exactly
what the words printed in bold in the questions are asking you to do.
GEOGRAPHY HIGHER GRADE: PAPER II Page 2 of 24
[SA
WB
– D
ept o
f Env
iron
men
tal A
ffair
s and
Tou
rism
]
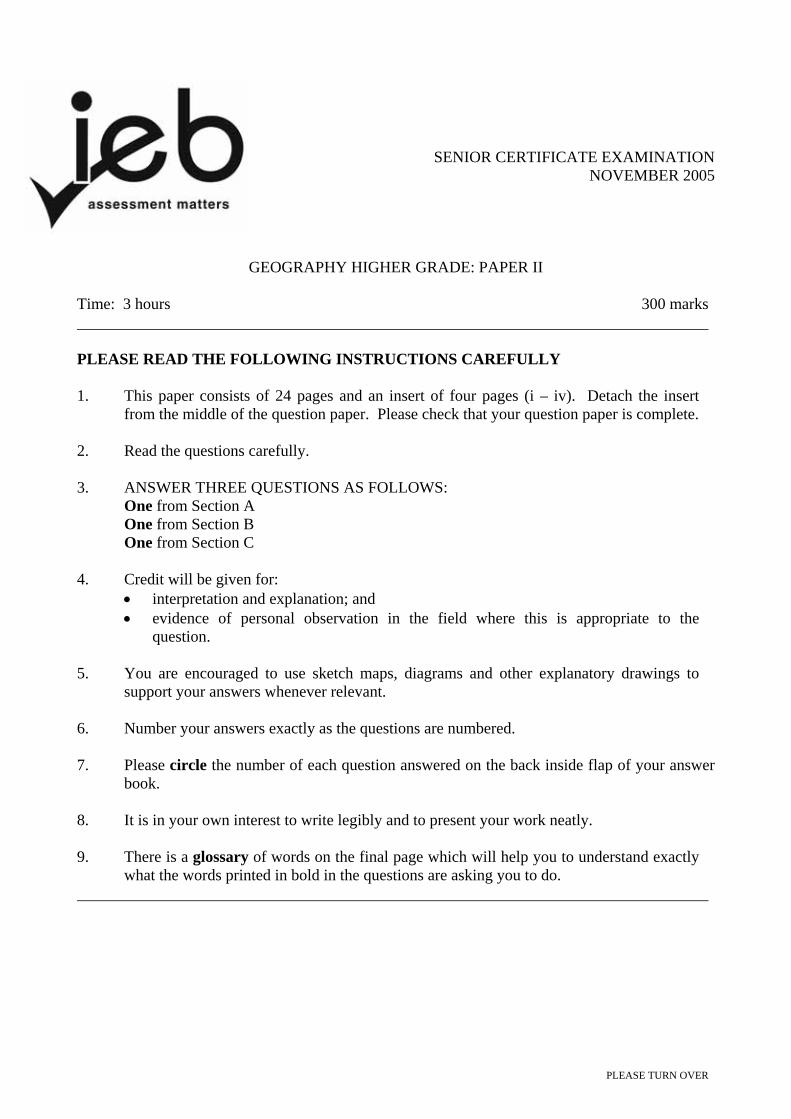
SECTION A PHYSICAL GEOGRAPHY Answer ONE question from this section, EITHER Question 1 OR Question 2. QUESTION 1 Climatology, geomorphology and ecology 1.1 South African synoptic weather map
Study Figure 1.
Figure 1: Synoptic weather map: 2004-07-23
GEOGRAPHY HIGHER GRADE: PAPER II Page 3 of 24
PLEASE TURN OVER
1.1.1 Identify the following weather systems indicated on Figure 1:
(a) A (b) B (1)
1.1.2 What is the atmospheric pressure (mb or hPa) at
(a) C (b) D on Figure 1? (1)
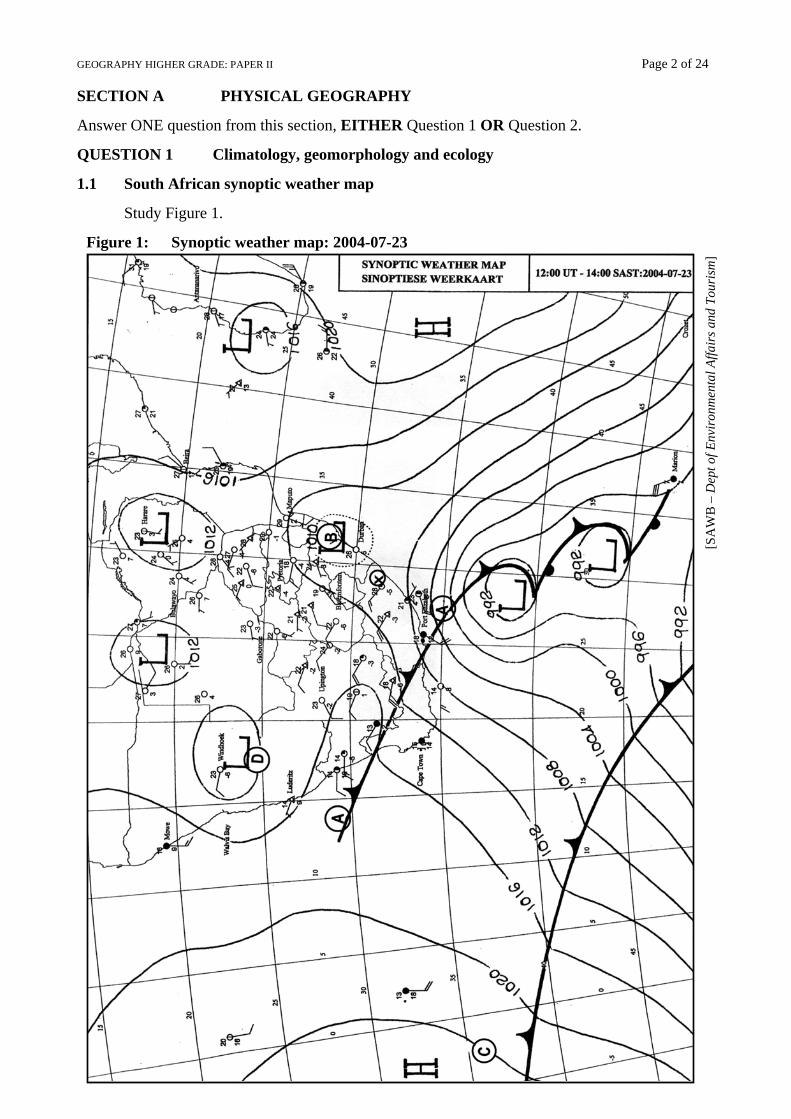
1.1.3 Describe the weather being experienced on 23 July 2004 at Port Elizabeth.
The weather station symbols for Port Elizabeth are as follows: (3)
1.1.4 Account for the weather being experienced at Port Elizabeth on this date. (2)
GEOGRAPHY HIGHER GRADE: PAPER II Page 4 of 24
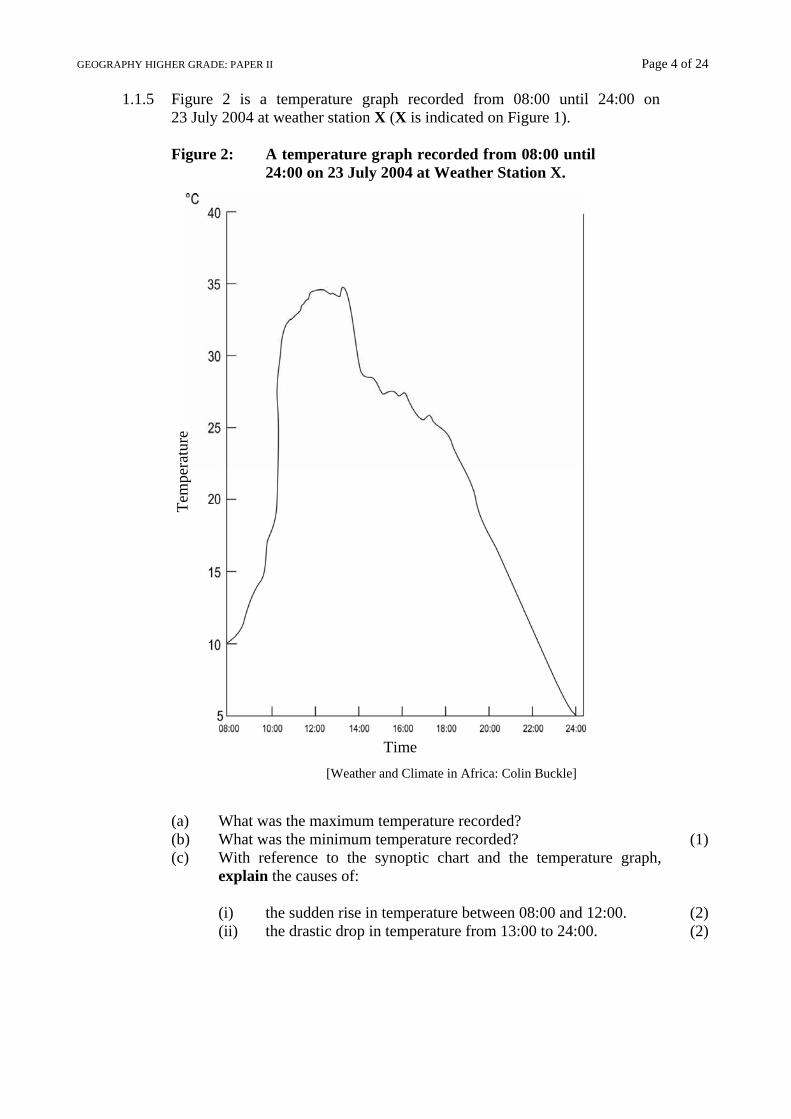
1.1.5 Figure 2 is a temperature graph recorded from 08:00 until 24:00 on 23 July 2004 at weather station X (X is indicated on Figure 1).
Figure 2: A temperature graph recorded from 08:00 until
24:00 on 23 July 2004 at Weather Station X.
[Weather and Climate in Africa: Colin Buckle]
(a) What was the maximum temperature recorded? (b) What was the minimum temperature recorded? (1) (c) With reference to the synoptic chart and the temperature graph,
explain the causes of:
(i) the sudden rise in temperature between 08:00 and 12:00. (2) (ii) the drastic drop in temperature from 13:00 to 24:00. (2)
Tem
pera
ture
Time
GEOGRAPHY HIGHER GRADE: PAPER II Page 5 of 24
PLEASE TURN OVER
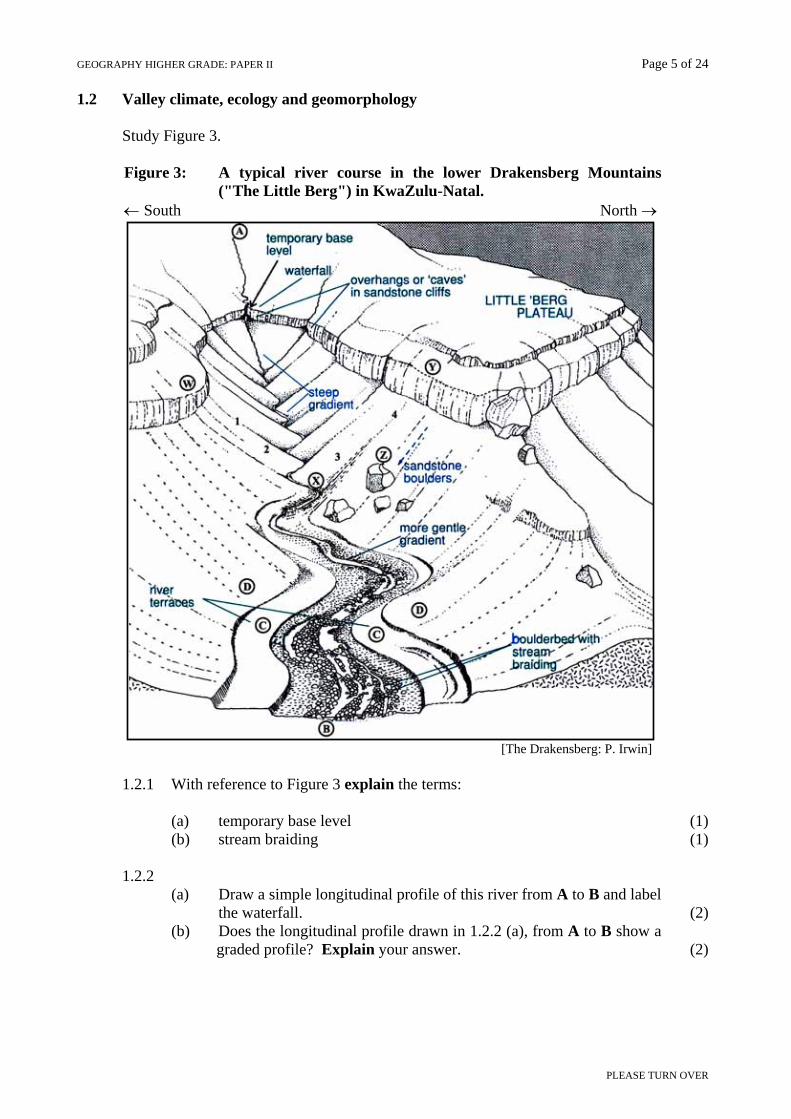
1.2 Valley climate, ecology and geomorphology
Study Figure 3.
Figure 3: A typical river course in the lower Drakensberg Mountains ("The Little Berg") in KwaZulu-Natal.
← South North →
[The Drakensberg: P. Irwin]
1.2.1 With reference to Figure 3 explain the terms:
(a) temporary base level (1) (b) stream braiding (1)
1.2.2
(a) Draw a simple longitudinal profile of this river from A to B and label the waterfall. (2)
(b) Does the longitudinal profile drawn in 1.2.2 (a), from A to B show a graded profile? Explain your answer. (2)
GEOGRAPHY HIGHER GRADE: PAPER II Page 6 of 24
1.2.3 The river terraces at C are evidence that this river has been rejuvenated.
(a) Explain the term rejuvenation. (1) (b) Using an annotated sketch, describe how the process of rejuvenation
led to the formation of these river terraces. (3)
1.2.4 A developer builds a large holiday resort on both sides of the river at D. The resort has paved roads, parking areas and footpaths. Draw two storm hydrographs to show the discharge of the river, below D
(a) before the development. (1) (b) after the development. (1) Label each hydrograph clearly.
1.2.5 Explain the hydrographs you have drawn in 1.2.4 above. (2) 1.2.6 The data in Table 1 was recorded by an environmentalist along a cross-
profile W – Y (Figure 3) at 08:00 on a winter's morning. Data was recorded at 4 points (1, 2, 3 and 4).
Table 1 Temperature, precipitation and vegetation at points 1, 2, 3 and 4
(over 24 hours)
Point 1 2 3 4
Temperature 10 °C 2 °C 3 °C 5 °C
Precipitation 10 mm 5 mm 15 mm 20 mm
Vegetation Grassland and
protea savannah
Short grass and bush
Tall evergreen forest
(a) Explain why it is warmer at point 1 than at point 3. (2) (b) Draw and label two soil profiles that you would expect to find at
points 2 and 4. (4) (c) Explain each of the profiles you have drawn in (b) above. (2)
1.2.7 If the evergreen forest was removed, predict the effects on the natural
ecosystems in this valley. (4) 1.2.8
(a) Draw a cross section from X to Y and label the elements of slope which are evident. (3)
(b) Name the mass wasting which has occurred at Z. (1)
GEOGRAPHY HIGHER GRADE: PAPER II Page 7 of 24
PLEASE TURN OVER
1.3 Structural landscapes
Study Photograph 1 (page (i) in the Insert Booklet), which shows inclinded rock strata. 1.3.1 Name landform A. (1) 1.3.2 Draw a field sketch of landform A and label the
• scarp slope • dip slope • resistant rock layers (3)
1.3.3 Using an annotated sketch, explain how landform A developed. (4)
50 x 2 = 100 marks
GEOGRAPHY HIGHER GRADE: PAPER II Page 8 of 24 QUESTION 2 Climatology, geomorphology and ecology 2.1 Tropical cyclones
Study Photograph 2 (page (i) in the Insert Booklet), which shows a satellite photograph of Hurricane Ivan. 2.1.1 Draw a simple synoptic sketch map to show Hurricane Ivan on this date.
Clearly show the following on your synoptic sketch map: • the general pattern of isobars and pressure • the eye of the hurricane using the correct symbol • the direction of the winds blowing around the eye (3)
2.1.2 List and explain THREE requirements which are necessary for the development of a mature tropical cyclone such as Ivan. (6)
2.1.3 Describe the weather conditions which were experienced in the eye of
Hurricane Ivan on this date. (1)
2.1.4 Hurricane Ivan caused devastation in the less developed countries of Haiti and Dominican Republic. As a representative of an international aid agency, write a report of 1 to 2 pages to the United Nations in which you: • describe the environmental and infrastructural damage caused by
Hurricane Ivan • explain what relief aid will be needed to normalise life in both countries • suggest what measures need to be taken to try to reduce the effects of
possible future hurricanes on these two countries. (15) 2.2 Structural landscapes
Study Photograph 3 (page (ii) in the Insert Booklet) which shows a tor. 2.2.1 Name the rock type at A. (1)
2.2.2 Using diagrams explain the formation of this feature. Label the corestones
and joints on your diagram. (4)
2.2.3 Describe the economic importance of landforms such as these. (2)
GEOGRAPHY HIGHER GRADE: PAPER II Page 9 of 24
PLEASE TURN OVER
2.3 Rivers and ecology
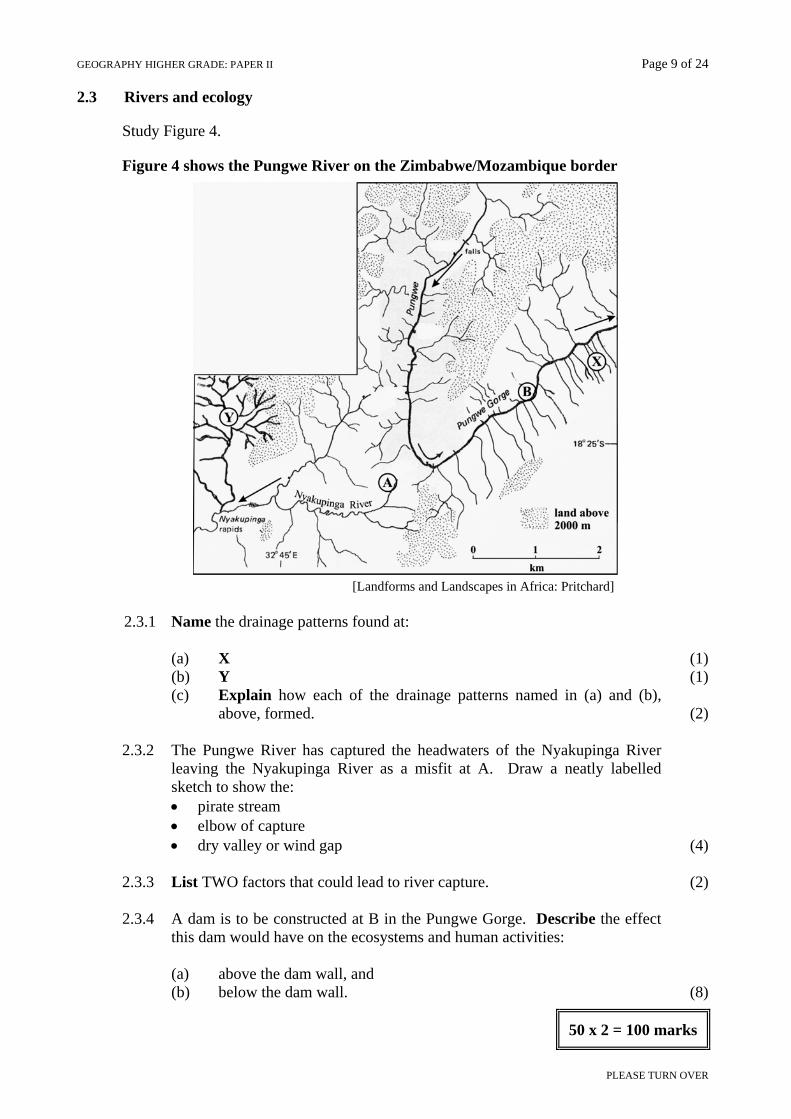
Study Figure 4. Figure 4 shows the Pungwe River on the Zimbabwe/Mozambique border
[Landforms and Landscapes in Africa: Pritchard] 2.3.1 Name the drainage patterns found at:
(a) X (1) (b) Y (1) (c) Explain how each of the drainage patterns named in (a) and (b),
above, formed. (2)
2.3.2 The Pungwe River has captured the headwaters of the Nyakupinga River leaving the Nyakupinga River as a misfit at A. Draw a neatly labelled sketch to show the: • pirate stream • elbow of capture • dry valley or wind gap (4)
2.3.3 List TWO factors that could lead to river capture. (2) 2.3.4 A dam is to be constructed at B in the Pungwe Gorge. Describe the effect
this dam would have on the ecosystems and human activities:
(a) above the dam wall, and (b) below the dam wall. (8)
50 x 2 = 100 marks
GEOGRAPHY HIGHER GRADE: PAPER II Page 10 of 24 SECTION B SETTLEMENT GEOGRAPHY Answer ONE question from this section, EITHER Question 3 OR Question 4. QUESTION 3 Urban and rural settlement 3.1 Informal settlements
Study Photograph 4 (page (ii) in the Insert Booklet), which shows an informal settlement on the edge of a major city in South Africa.
3.1.1 Describe the main features of the settlement shown in the photograph. (2) 3.1.2 Explain why settlements like the one in photograph 4 originate. (2) 3.1.3 (a) List TWO ways in which this settlement and its inhabitants impact
negatively on the environment. (2) (b) Suggest solutions to the two examples outlined above. (2)
3.1.4 State your views on the advantages and disadvantages of creating planned
housing settlements for the inhabitants of informal settlements. Refer to local examples where possible. (4)
3.2 Urban renewal
In many South African cities, old areas close to the CBD have undergone urban renewal and are attracting people to live close to and in the city centre.
Study Photograph 5 (page (iii) in the Insert Booklet), which shows Bokaap, de Waterkant, an area on the edge of Cape Town=s CBD.
3.2.1 Describe the urban renewal evident in Photograph 5. (2) 3.2.2 Design a newspaper advertisement aimed at attracting people to live in the
CBD of a South African city. (3) 3.2.3 Cities in South Africa have implemented various strategies to attract
residents back to the city centre. Discuss TWO strategies, giving examples of this trend. (4)
3.2.4 Predict the impact the growing number of people living in a city centre will
have:
(a) on the CBD; and (2) (b) on the outlying business and residential suburbs. (2)
GEOGRAPHY HIGHER GRADE: PAPER II Page 11 of 24
PLEASE TURN OVER
3.3 Study Photograph 6 (page (iv) in the Insert Booklet), which shows a rural settlement in KwaZulu-Natal.
3.3.1 Describe the type of settlement shown in Photograph 6. (1) 3.3.2 State the type of economic activity people living in this settlement are
involved in. (1) 3.3.3 Comment on the site of the settlement. (3) 3.3.4 Most of the older inhabitants of this settlement are women.
(a) Explain why there are so few economically active men living in this
settlement. (1) (b) Describe TWO problems facing the women living in this settlement. (4)
3.3.5 Suggest ways in which the quality of life of people living in this settlement
could be improved. (3) 3.4 Residential estates
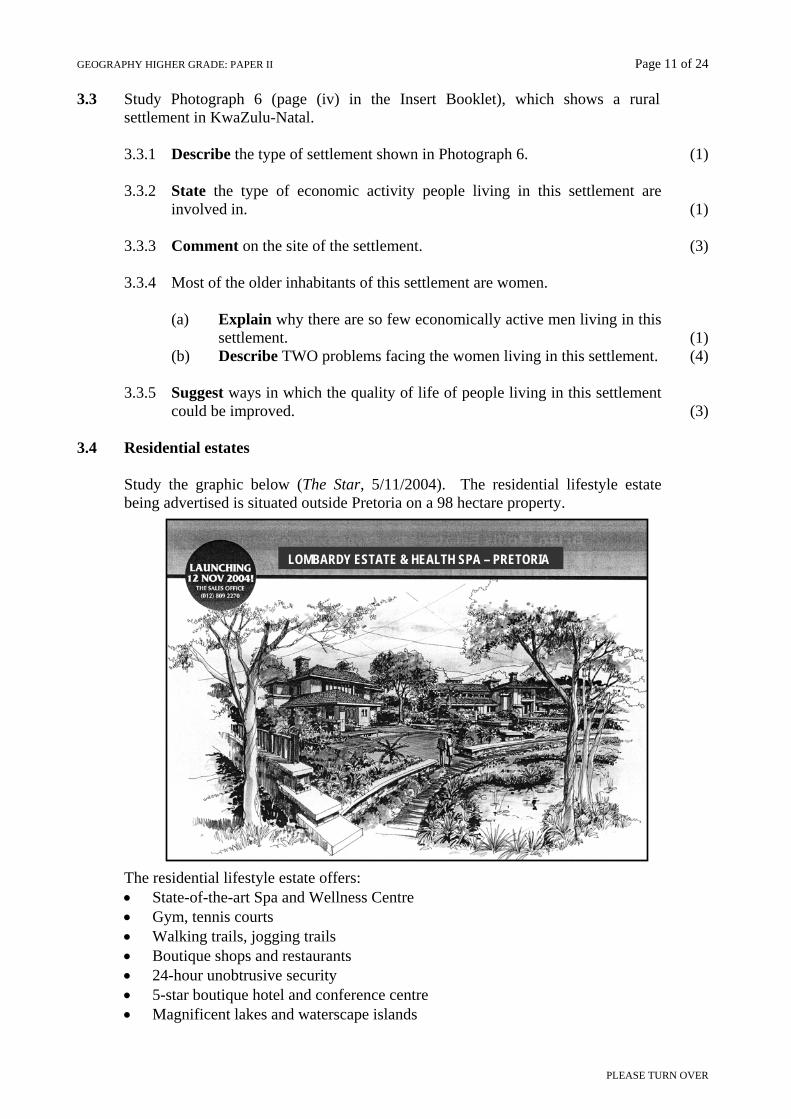
Study the graphic below (The Star, 5/11/2004). The residential lifestyle estate being advertised is situated outside Pretoria on a 98 hectare property.
The residential lifestyle estate offers: • State-of-the-art Spa and Wellness Centre • Gym, tennis courts • Walking trails, jogging trails • Boutique shops and restaurants • 24-hour unobtrusive security • 5-star boutique hotel and conference centre • Magnificent lakes and waterscape islands
LOMBARDY ESTATE & HEALTH SPA – PRETORIA
GEOGRAPHY HIGHER GRADE: PAPER II Page 12 of 24
Write an essay of ONE to TWO pages in which you evaluate the trend of establishing >Lifestyle Residential Estates=, using the following headings:
• location of these estates • impact on the environment • advantages and disadvantages of living on such an estate. (12)
50 x 2 = 100 marks
GEOGRAPHY HIGHER GRADE: PAPER II Page 13 of 24
PLEASE TURN OVER
QUESTION 4 Urban and rural settlement 4.1 Urban features and concepts
Study Photograph 7 (page (iv) in the Insert Booklet), which shows a scenic view of Johannesburg.
4.1.1 Name the land use zones labelled A and B. (1)
4.1.2 (a) Name TWO high order and TWO low order functions/services
found in land use zone A. (4) (b) List THREE characteristics associated with land use zone A. (3) (c) Discuss TWO problems that people could experience in land use
zone A. (4)
4.1.3 Urban renewal is taking place in Area B. Developments here include: inner city housing, entertainment facilities, restaurants and retail outlets. (a) Define urban renewal. (2) (b) Explain why urban renewal projects are necessary. (2) (c) Suggest TWO factors that might cause this urban renewal project to
fail. (2)
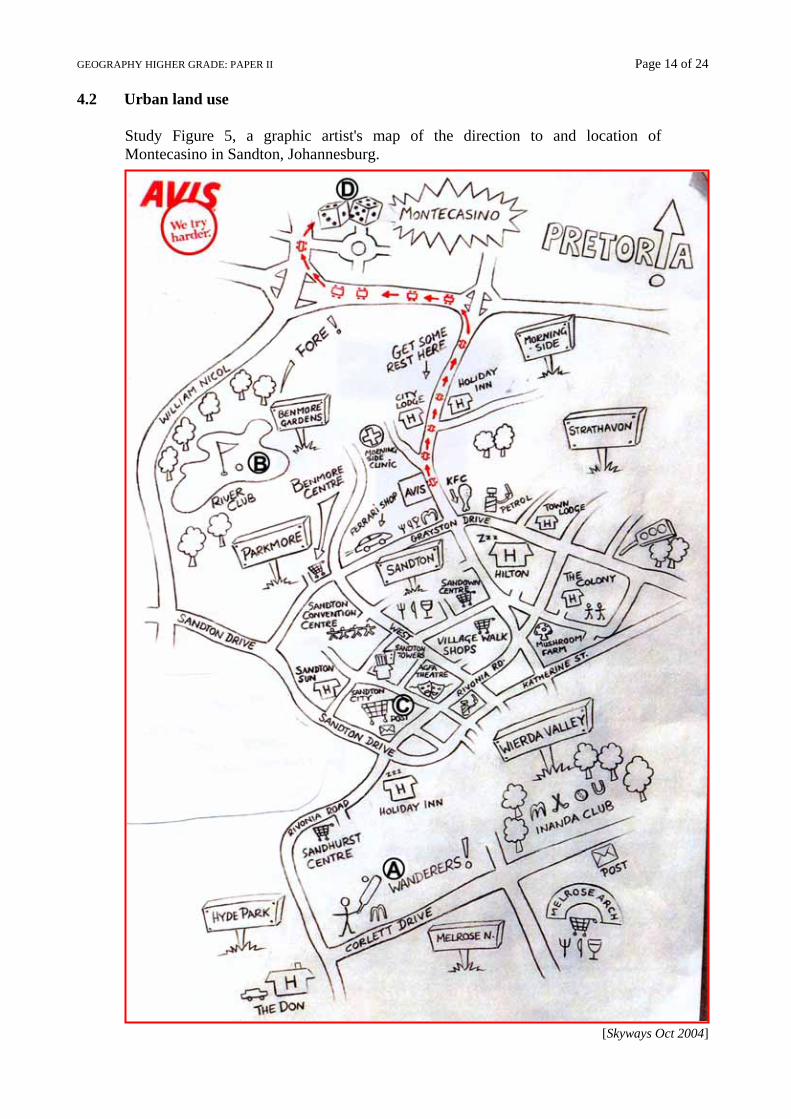
GEOGRAPHY HIGHER GRADE: PAPER II Page 14 of 24 4.2 Urban land use
Study Figure 5, a graphic artist's map of the direction to and location of Montecasino in Sandton, Johannesburg.
[Skyways Oct 2004]
GEOGRAPHY HIGHER GRADE: PAPER II Page 15 of 24
PLEASE TURN OVER
4.2.1 (a) Identify the land uses at A and B on the map. (1) (b) Outline the importance of these land uses to the community and the
micro-climate of the urban area. (4)
4.2.2 (a) Classify the shopping centre at C. (1) (b) Explore the possible disadvantages of a large shopping centre to
• customers; and (2) • shop owners. (2)
4.2.3 (a) Describe the land use at D. (1)
(b) Comment on the location of the land use at D. (2)
4.2.4 With reference to the type of land use at D, explain the meaning of the central place concepts: (a) sphere of influence (2) (b) threshold population (2)
4.3 Rural development strategy
Read the extract from The Star, June 2004, and the Fact File below.
Rebirth of a town called Alicedale Once a crumbling ghost town with a 98% unemployment rate, this small Eastern Cape town is at the heart of a visionary business initiative that intends to reveal a tourism diamond under all that dust.
(Winnie Graham)
Fact File ∃ Town established on the railway line to Kimberley in 1877. ∃ 12 hour rail journey to Grahamstown. ∃ Station closed in 1996. ∃ Near Shamwari Game Reserve. ∃ Partnership created between government, private sector and community. ∃ Proposed Sunnesson Golf Academy. ∃ Proposed Mantis hotel school. ∃ Cultural village to be built. ∃ Proposed Bushman Sands Game Reserve, driven by Ian Player.
In an essay of ONE to TWO pages: (a) Discuss the factors that would have influenced the initial development of
any rural settlement like Alicedale in the Eastern Cape. (b) Explain why a town like Alicedale can become a 'crumbling ghost town'. (c) Suggest how development strategies like this 'visionary business initiative'
can revive settlements like Alicedale and improve the quality of life of the local rural people. (15)
50 x 2 = 100 marks
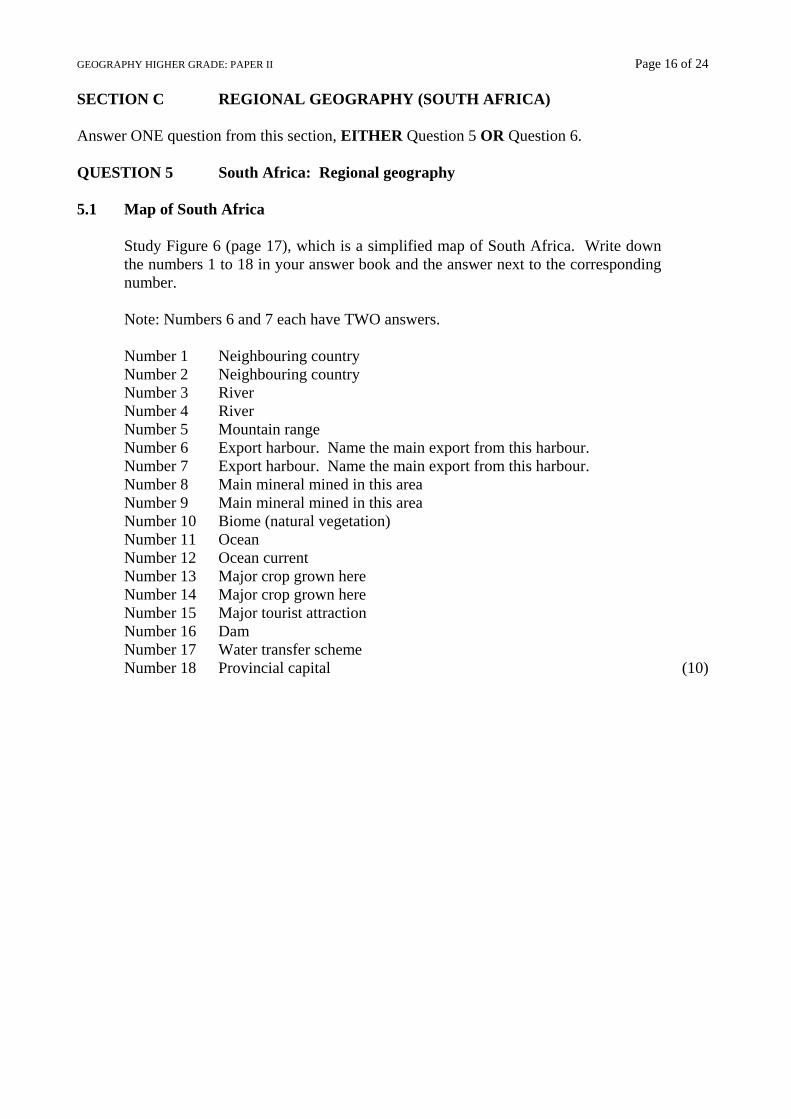
GEOGRAPHY HIGHER GRADE: PAPER II Page 16 of 24 SECTION C REGIONAL GEOGRAPHY (SOUTH AFRICA) Answer ONE question from this section, EITHER Question 5 OR Question 6. QUESTION 5 South Africa: Regional geography 5.1 Map of South Africa
Study Figure 6 (page 17), which is a simplified map of South Africa. Write down the numbers 1 to 18 in your answer book and the answer next to the corresponding number. Note: Numbers 6 and 7 each have TWO answers. Number 1 Neighbouring country Number 2 Neighbouring country Number 3 River Number 4 River Number 5 Mountain range Number 6 Export harbour. Name the main export from this harbour. Number 7 Export harbour. Name the main export from this harbour. Number 8 Main mineral mined in this area Number 9 Main mineral mined in this area Number 10 Biome (natural vegetation) Number 11 Ocean Number 12 Ocean current Number 13 Major crop grown here Number 14 Major crop grown here Number 15 Major tourist attraction Number 16 Dam Number 17 Water transfer scheme Number 18 Provincial capital (10)
GEOGRAPHY HIGHER GRADE: PAPER II Page 17 of 24
PLEASE TURN OVER
Scale: 1 cm represents 90 kms
Figure 6
GEOGRAPHY HIGHER GRADE: PAPER II Page 18 of 24
5.2 Environmental problems
Study Figure 7.
Figure 7 shows the month-by-month precipitation on South Africa. Shaded areas receive more than 50 mm of rain in a month.
[The Atmosphere, Weather and Climate of South Africa Preston Whyte and Tyson]
5.2.1 Draw a sketch of South Africa and, using the letters below, indicate the
following on your sketch map:
A an area which receives only summer rainfall B an area which receives only winter rainfall C an area which receives rainfall all year D an area which receives less than 50 mm of rainfall, in a month,
throughout the year. (4) 5.2.2 "South Africa is a predominantly dry region with highly erratic rainfall.
This variability has important consequences in terms of extreme events such as floods and droughts." (Vogel, C – The Geography of South Africa in a Changing World) (a) Describe the factors which influence South Africa's rainfall
pattern and distribution. (4) (b) As a concerned young South African write a report of 1 to 2
pages in which you highlight: • the increasing impact of human activities on the effects of
flooding and droughts • the effects of floods and droughts on the South African
economy • suggest solutions to these problems. (10)
GEOGRAPHY HIGHER GRADE: PAPER II Page 19 of 24
PLEASE TURN OVER
1000
5000
9000
13000
17000
21000
25000
29000
33000
37000
41000
45000
49000
Free Stat
e Gold
fields
Port Eliz
abeth
Durban
Cape T
own
Nelspru
it
Polokwan
e
Joha
nnesb
urg
Per C
apita
Inco
me
in R
ands
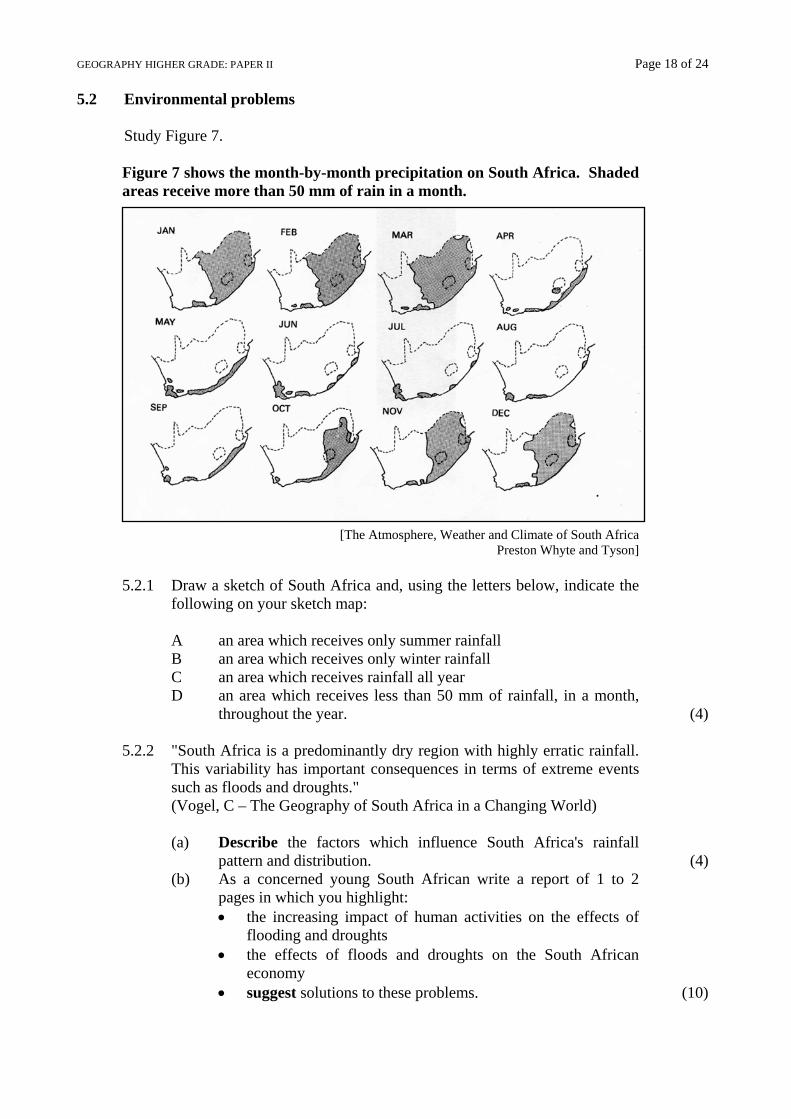
5.3 Economy
Study Figure 8.
Figure 8 shows the per capita income in 7 major urban centres in South Africa in 2004.
[SAIRR: Fast Facts]
5.3.1 Define 'per capita income'. (1)
5.3.2 Give TWO reasons for the low per capita income of the Free State Goldfields. (1)
5.3.3 Explain the reasons for the relatively high per capita incomes of
Nelspruit and Polokwane. (2) 5.3.4
(a) The four main industrial areas of South Africa are situated around Johannesburg, Durban, Cape Town and Port Elizabeth. Choose one of these areas. Name the one you have chosen and list FOUR reasons for the development of industry in the area. (4)
(b) Describe the impact this development has had on the environment and suggest possible solutions to the problems caused. (4)
GEOGRAPHY HIGHER GRADE: PAPER II Page 20 of 24
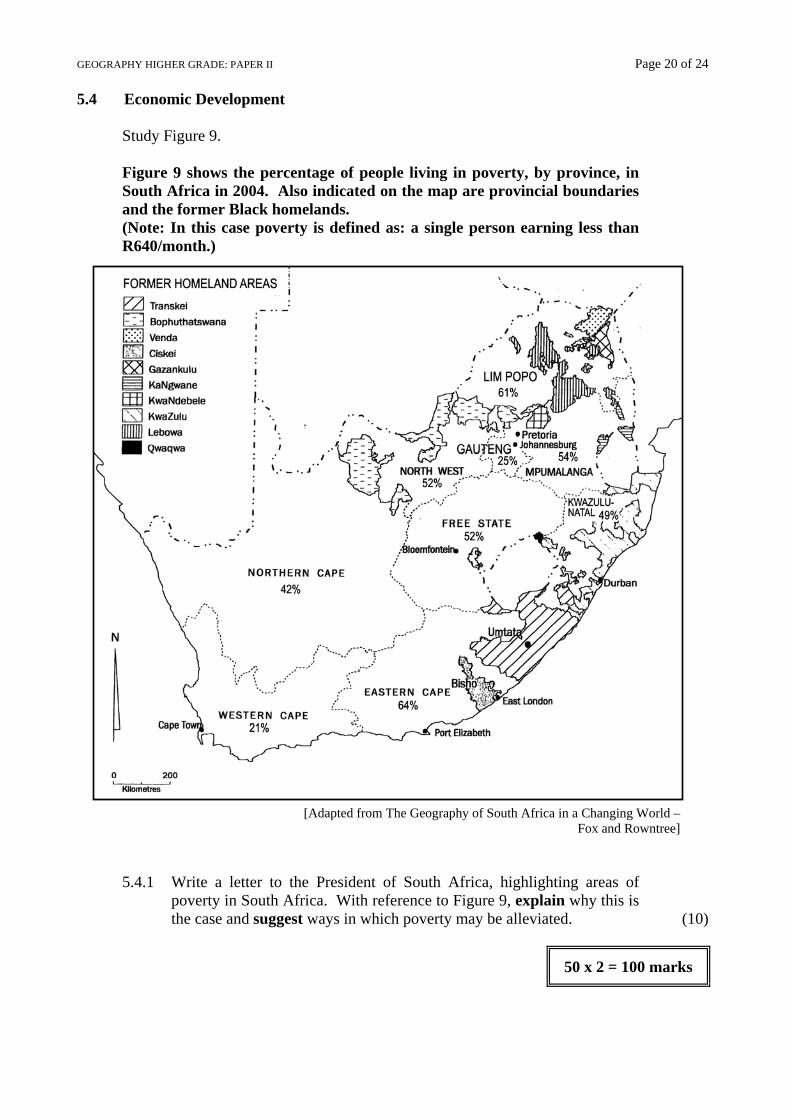
5.4 Economic Development Study Figure 9. Figure 9 shows the percentage of people living in poverty, by province, in South Africa in 2004. Also indicated on the map are provincial boundaries and the former Black homelands. (Note: In this case poverty is defined as: a single person earning less than R640/month.)
[Adapted from The Geography of South Africa in a Changing World – Fox and Rowntree]
5.4.1 Write a letter to the President of South Africa, highlighting areas of
poverty in South Africa. With reference to Figure 9, explain why this is the case and suggest ways in which poverty may be alleviated. (10)
50 x 2 = 100 marks
GEOGRAPHY HIGHER GRADE: PAPER II Page 21 of 24
PLEASE TURN OVER
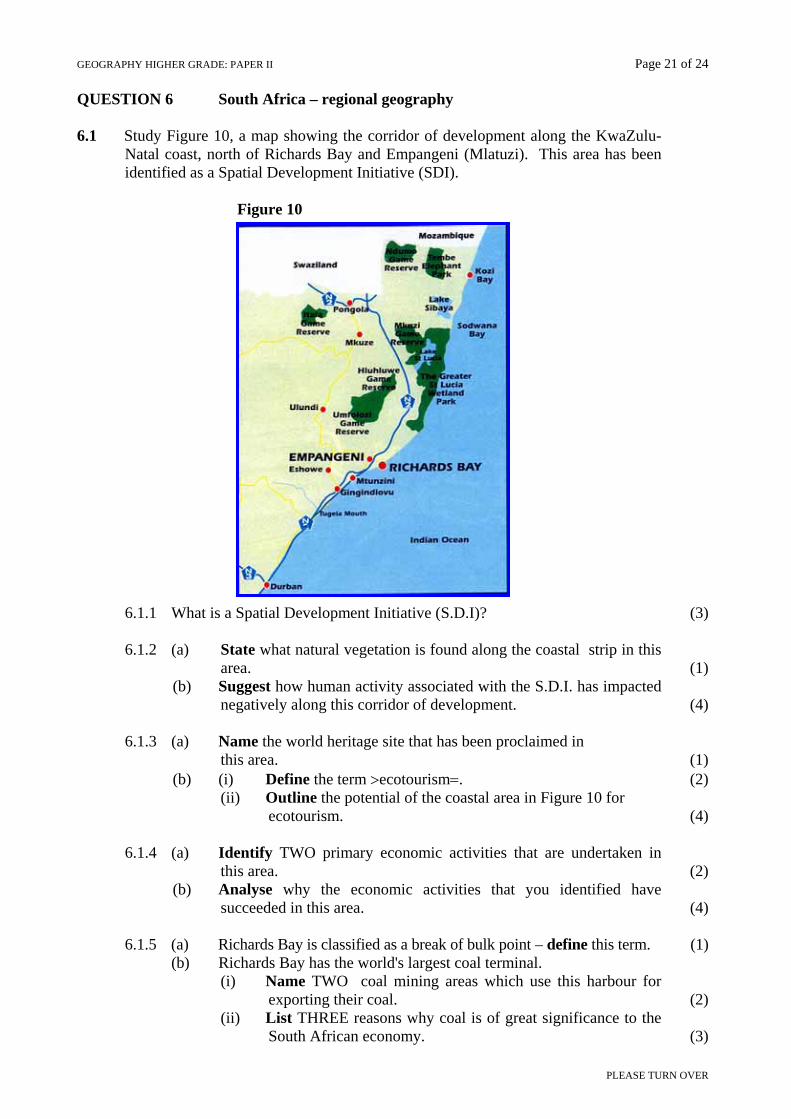
QUESTION 6 South Africa – regional geography 6.1 Study Figure 10, a map showing the corridor of development along the KwaZulu-
Natal coast, north of Richards Bay and Empangeni (Mlatuzi). This area has been identified as a Spatial Development Initiative (SDI).
Figure 10
6.1.1 What is a Spatial Development Initiative (S.D.I)? (3)
6.1.2 (a) State what natural vegetation is found along the coastal strip in this area. (1)
(b) Suggest how human activity associated with the S.D.I. has impacted negatively along this corridor of development. (4)
6.1.3 (a) Name the world heritage site that has been proclaimed in
this area. (1) (b) (i) Define the term >ecotourism=. (2)
(ii) Outline the potential of the coastal area in Figure 10 for ecotourism. (4)
6.1.4 (a) Identify TWO primary economic activities that are undertaken in this area. (2)
(b) Analyse why the economic activities that you identified have succeeded in this area. (4)
6.1.5 (a) Richards Bay is classified as a break of bulk point – define this term. (1) (b) Richards Bay has the world's largest coal terminal.
(i) Name TWO coal mining areas which use this harbour for exporting their coal. (2)
(ii) List THREE reasons why coal is of great significance to the South African economy. (3)
GEOGRAPHY HIGHER GRADE: PAPER II Page 22 of 24
6.2 Transport
Read the extract below from The Star, 2 November 2004.
You can never build roads large enough to achieve world-class status in South African cities if people are going to continue to use cars. At the moment only 1% of South Africa's more affluent sector of society use public transport, while in the U.K. and U.S.A. the statistic is 20%.
[Trevor Pengelly]
6.2.1 Evaluate how the use of cars has impacted on South African urban
environments. (4)
6.2.2 Outline your vision of an efficient public transport system in any South African city. (4)
6.3 Mining
Study Photograph 8 (page (iv) in the Insert Booklet), which shows evidence of gold mining on the Witwatersrand (Gauteng). Write an essay of ONE to TWO pages in which you discuss gold mining, using these sub-headings:
(a) The significance of gold mining to the South African economy, past and
present. (b) The negative impact gold mining has had on the people and the
environment on the Witwatersrand. (15)
50 x 2 = 100 marks
Total: 300 marks

GEOGRAPHY HIGHER GRADE: PAPER II Page 23 of 24
PLEASE TURN OVER – GLOSSARY ON PAGE 24
GEOGRAPHY HIGHER GRADE: PAPER II Page 24 of 24
GLOSSARY
WORD MEANING
Account for To answer for or explain the cause of, so as to explain why Analyse To separate into parts or elements and to describe or examine each in detail Annotate To add explanatory notes to a sketch, map or drawing
Compare and contrast
Compare: To point out or show both similarities and differences Contrast: To stress the differences, dissimilarities or unlikeness of things
Classify To divide into groups or types so that things with similar characteristics are in the same group
Comment To give your opinion or to make a statement about something; to write generally about
Define To give the precise meaning of …
Demonstrate To make it clear; to show; to illustrate and explain [Examples can be given.]
Describe To list the main characteristics of something; to give an account of [Note: a diagram or map may be part of a description.]
Determine To discover as a result of investigation Discuss To examine or to investigate by argument the various aspects of a statementDistinguish To see or to understand the difference between one thing and another
Elaborate To write about something in depth, with much attention to the detail of the different parts making up the whole
Evaluate To make an appraisal or express an opinion concerning the value Examine To analyse and to discuss; to look at something carefully
Explain To make clear or plain or to make sure that the reader understands what is being said
Explore To comment on something in detail Identify To give the essential characteristics of … Justify To prove or give reasons or conclusions using logical argument List To present a list of names, facts, aspects or items Name To state something; to list; to give; to identify; to mention Outline To give the main features or general principles of a subject Predict To say what is expected to happen; to foretell; to say in advance
Prove To test by means of argument or evidence so that something guessed at can be shown to be true and correct
Review To make a survey of, examining the subject critically
State To present information or details plainly, directly and simply, without discussion
Suggest To propose an explanation or a solution by way of a plan or a suggestion