Embed Size (px)
Citation preview
Senior Management
John H. SchnatterFounder, Chairman, Chief Executive Officer and President
Robert WadellPresident of PJ Food Service, Inc. and Chief Operating Officer
Julie LarnerSenior Vice President andChief Administrative Officer
Mary Ann PalmerSenior Vice President and Chief Resource Officer
Charles W. SchnatterSenior Vice President,Chief Development Officer,Secretary and General Counsel
Mike CortinoSenior Vice President of Corporate Operations
Tim O' HernVice President of Global Development
David FlaneryVice President of Finance and Corporate Controller
2002 Papa John’s Blvd. • Louisville, KY 40299 • 502-261-7272 • www.papajohns.com

wouldn’t change and what Papa John’s is all about
focus on our commitment to quality ingredients
Our focus won’t change. We’ll continue to keep the
Main Thing the Main Thing – make a superior
quality traditional pizza. The great thing about a
challenge is it makes us stronger as a team. Focus
on being the number one pizza brand in the world.

his past year brought a few accomplishments worth noting for Team Papa John’s:▲ 369 restaurant openings (we ended the year with 2,817 restaurants in 49 states and
10 international markets, including 205 Perfect Pizza restaurants in the United Kingdom);▲ 2.3% positive comp sales (against an industry leading per store average);▲ 17% revenue growth; ▲ We successfully defended our “Better Ingredients. Better Pizza.” slogan
(challenged by our largest rival) all the way to the United States Supreme Court; and▲ We officially passed Little Caesar’s to become the third largest pizza company in the world.
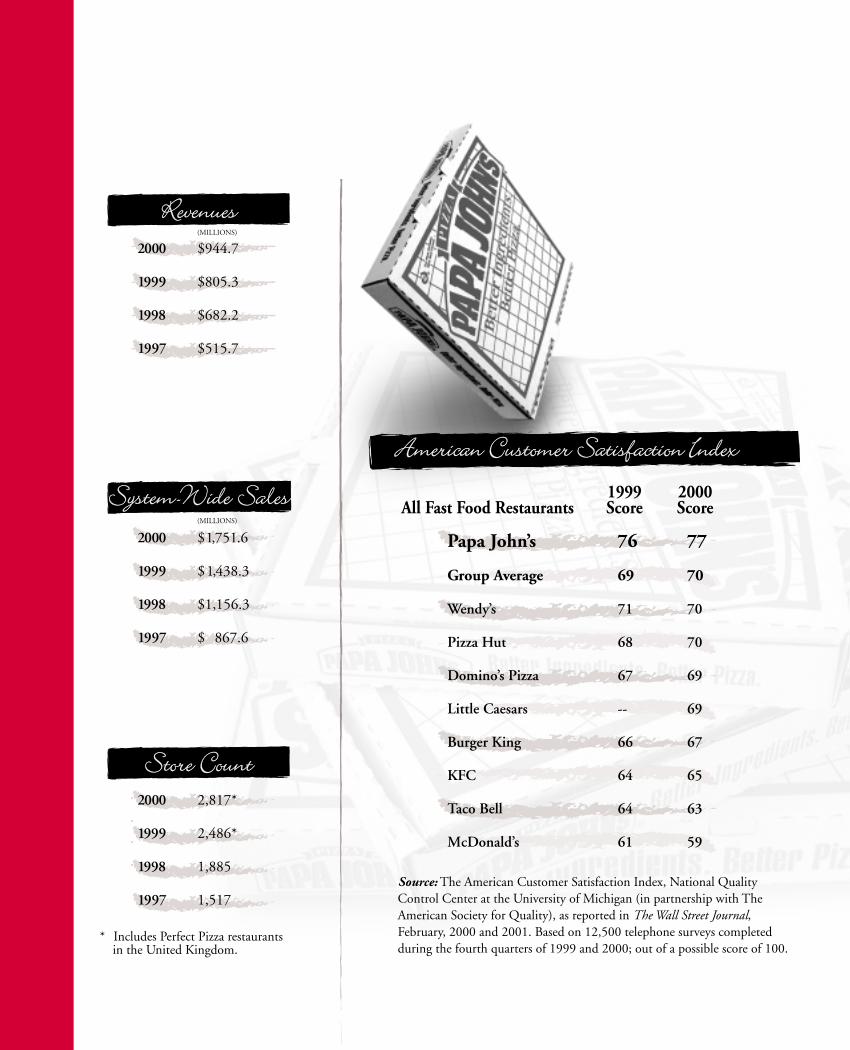
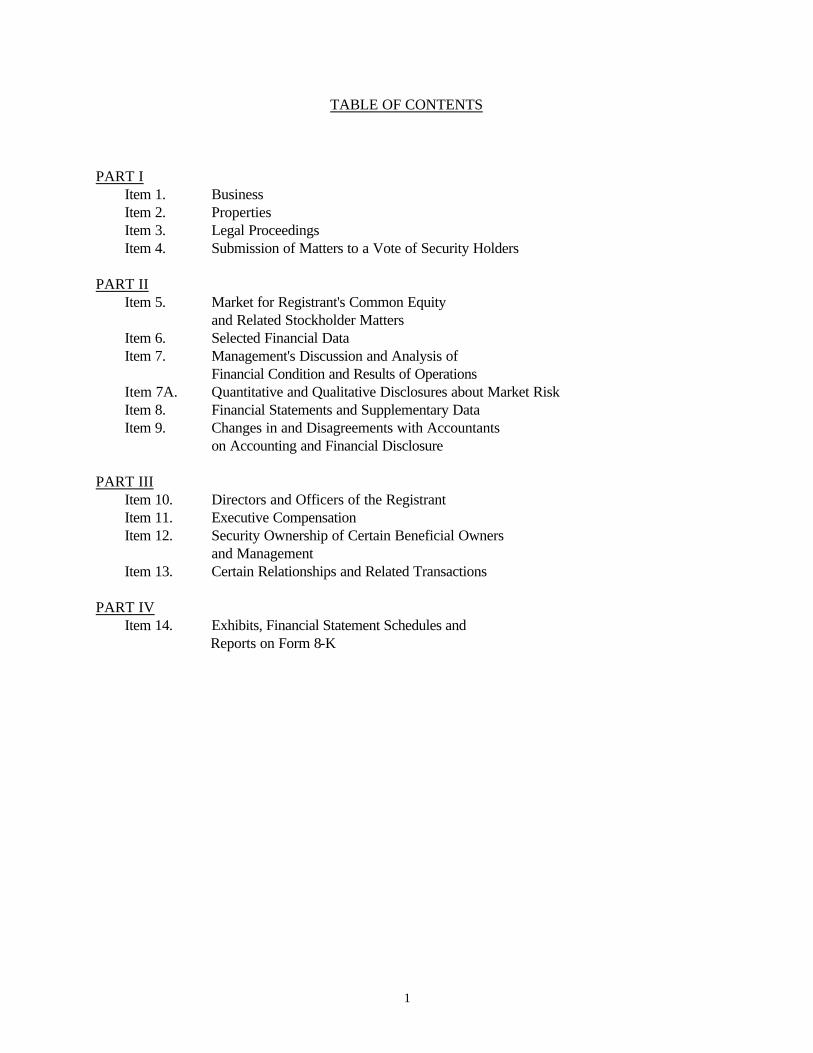
Most importantly, pizza eaters across the country continued to reward our commitment to “Better Ingredients. Better Pizza.”As reported in The Wall Street Journal in February 2001, Papa John’s (for the second straight year) has been rated number one incustomer satisfaction among all national fast food restaurants in the American Customer Satisfaction Index. Not only did we finishwell above the average for all national fast food chains, we finished seven percentage points higher than our closest pizzacompetitor! I’m proud of our team for continuing to win where winning matters most – in product quality and taste.
The pizza business is extremely competitive right now. In fact, I can’t remember a time when its been more competitive sincewe started Papa John’s out of the back of my dad’s tavern 16 years ago. Price discounting, a tight labor market and some slowing inthe pizza category have all combined over the last 18 months or so to make it real competitive out there. The fact that we’re gainingsignificant market share in this difficult environment is testimony to the strength of the Papa John’s concept and our people.
Greetings to our Shareholders, Team Members and Franchise Family
Moving forward, I think we can do a better job running our company. In 2000, our capital spending and general andadministrative (“G&A”) costs were higher than they needed to be. We got a little off focus. As big companies have a tendency to do, we may have gotten a little complacent, i.e., our success made us “fat and happy.” There’s no room for that mindset in this business. We have to stay lean and mean and work our business every day, 364 days a year (we’re closed on Christmas). Led by a new senior management team, I believe our system is now focused more than ever on doing what we do best: making the best-tasting, highest-quality pizza in the business, while providing great value to the customer.
To help our restaurant-level folks stay focused on running great restaurants, our senior management team has established three main priorities for 2001:
▲ Improve our unit economics/restaurant profitability; ▲ Reduce our G&A/corporate spending; and▲ Drive sales and increase market share (through operational excellence, ongoing quality improvements and effective
marketing initiatives).
The concept is a horse. It’s our job at corporate not to slow the horse down with excess weight. We have to always make sure she’sin the best condition to run her top race.
No one can predict the future. There will always be uncertainties and opportunities to overcome along the way. What makesPapa John’s unique is our culture of excellence that allows us to face adversity head-on. Our team-oriented, quality-focused culturecharacterizes who we are as a company and serves to guide each individual within the company. Our team members and franchisefamily are proud of the fact that they work for a company where quality matters. They know that their individual efforts can turnlegendary customer service and superior-quality products from vision to reality. It is this commitment to excellence that producesboth a unified and focused organization and gives us a strategic advantage over the competition.
Remember, it took us 16 years to become the #3 pizza chain in the world; it could very well take us another 16 to become #1.As we move forward, you have my commitment to keep Papa John’s on strategy: as long as my name is on the box, we won’t waiveron our commitment to quality. We will continue to build upon our foundation of excellence, no matter how long it takes, untilPapa John’s is the number one pizza brand in the world. We’re in this game for the long haul. We hope you are too!
Sincerely,
John H. SchnatterFounder, Chairman and Chief Executive Officer
1999 2000All Fast Food Restaurants Score Score
American Customer Satisfaction IndexAmerican Customer Satisfaction Index
Papa John’s 76 77
Group Average 69 70
Wendy’s 71 70
Pizza Hut 68 70
Domino’s Pizza 67 69
Little Caesars -- 69
Burger King 66 67
KFC 64 65
Taco Bell 64 63
McDonald’s 61 59
Source: The American Customer Satisfaction Index, National QualityControl Center at the University of Michigan (in partnership with TheAmerican Society for Quality), as reported in The Wall Street Journal, February, 2000 and 2001. Based on 12,500 telephone surveys completed during the fourth quarters of 1999 and 2000; out of a possible score of 100.
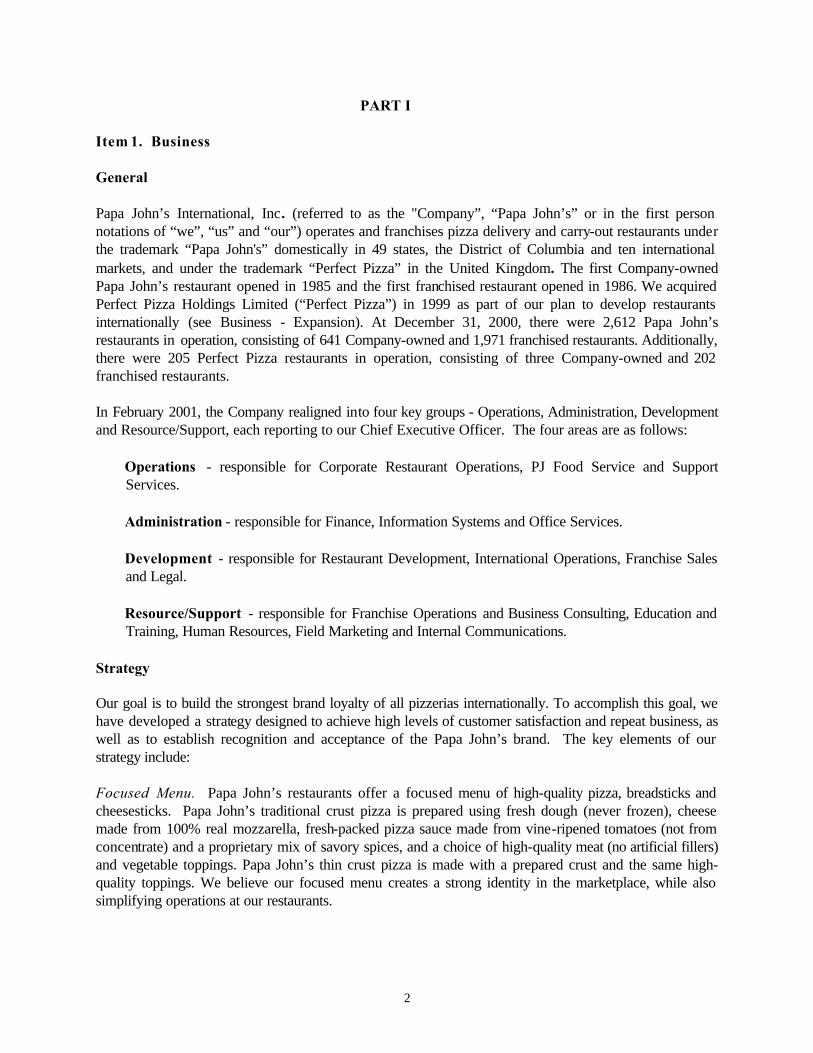
RevenuesRevenues
2000 $944.7
1999 $805.3
1998 $682.2
1997 $515.7
(MILLIONS)
System-Wide SalesSystem-Wide Sales
2000 $1,751.6
1999 $1,438.3
1998 $1,156.3
1997 $ 867.6
(MILLIONS)
Store CountStore Count
2000 2,817*
1999 2,486*
1998 1,885
1997 1,517
* Includes Perfect Pizza restaurants in the United Kingdom.
his past year brought a few accomplishments worth noting for Team Papa John’s:▲ 369 restaurant openings (we ended the year with 2,817 restaurants in 49 states and
10 international markets, including 205 Perfect Pizza restaurants in the United Kingdom);▲ 2.3% positive comp sales (against an industry leading per store average);▲ 17% revenue growth; ▲ We successfully defended our “Better Ingredients. Better Pizza.” slogan
(challenged by our largest rival) all the way to the United States Supreme Court; and▲ We officially passed Little Caesar’s to become the third largest pizza company in the world.
Most importantly, pizza eaters across the country continued to reward our commitment to “Better Ingredients. Better Pizza.”As reported in The Wall Street Journal in February 2001, Papa John’s (for the second straight year) has been rated number one incustomer satisfaction among all national fast food restaurants in the American Customer Satisfaction Index. Not only did we finishwell above the average for all national fast food chains, we finished seven percentage points higher than our closest pizzacompetitor! I’m proud of our team for continuing to win where winning matters most – in product quality and taste.
The pizza business is extremely competitive right now. In fact, I can’t remember a time when its been more competitive sincewe started Papa John’s out of the back of my dad’s tavern 16 years ago. Price discounting, a tight labor market and some slowing inthe pizza category have all combined over the last 18 months or so to make it real competitive out there. The fact that we’re gainingsignificant market share in this difficult environment is testimony to the strength of the Papa John’s concept and our people.
Greetings to our Shareholders, Team Members and Franchise Family
Moving forward, I think we can do a better job running our company. In 2000, our capital spending and general andadministrative (“G&A”) costs were higher than they needed to be. We got a little off focus. As big companies have a tendency to do, we may have gotten a little complacent, i.e., our success made us “fat and happy.” There’s no room for that mindset in this business. We have to stay lean and mean and work our business every day, 364 days a year (we’re closed on Christmas). Led by a new senior management team, I believe our system is now focused more than ever on doing what we do best: making the best-tasting, highest-quality pizza in the business, while providing great value to the customer.
To help our restaurant-level folks stay focused on running great restaurants, our senior management team has established three main priorities for 2001:
▲ Improve our unit economics/restaurant profitability; ▲ Reduce our G&A/corporate spending; and▲ Drive sales and increase market share (through operational excellence, ongoing quality improvements and effective
marketing initiatives).
The concept is a horse. It’s our job at corporate not to slow the horse down with excess weight. We have to always make sure she’sin the best condition to run her top race.
No one can predict the future. There will always be uncertainties and opportunities to overcome along the way. What makesPapa John’s unique is our culture of excellence that allows us to face adversity head-on. Our team-oriented, quality-focused culturecharacterizes who we are as a company and serves to guide each individual within the company. Our team members and franchisefamily are proud of the fact that they work for a company where quality matters. They know that their individual efforts can turnlegendary customer service and superior-quality products from vision to reality. It is this commitment to excellence that producesboth a unified and focused organization and gives us a strategic advantage over the competition.
Remember, it took us 16 years to become the #3 pizza chain in the world; it could very well take us another 16 to become #1.As we move forward, you have my commitment to keep Papa John’s on strategy: as long as my name is on the box, we won’t waiveron our commitment to quality. We will continue to build upon our foundation of excellence, no matter how long it takes, untilPapa John’s is the number one pizza brand in the world. We’re in this game for the long haul. We hope you are too!
Sincerely,
John H. SchnatterFounder, Chairman and Chief Executive Officer
1999 2000All Fast Food Restaurants Score Score
American Customer Satisfaction IndexAmerican Customer Satisfaction Index
Papa John’s 76 77
Group Average 69 70
Wendy’s 71 70
Pizza Hut 68 70
Domino’s Pizza 67 69
Little Caesars -- 69
Burger King 66 67
KFC 64 65
Taco Bell 64 63
McDonald’s 61 59
Source: The American Customer Satisfaction Index, National QualityControl Center at the University of Michigan (in partnership with TheAmerican Society for Quality), as reported in The Wall Street Journal, February, 2000 and 2001. Based on 12,500 telephone surveys completed during the fourth quarters of 1999 and 2000; out of a possible score of 100.
RevenuesRevenues
2000 $944.7
1999 $805.3
1998 $682.2
1997 $515.7
(MILLIONS)
System-Wide SalesSystem-Wide Sales
2000 $1,751.6
1999 $1,438.3
1998 $1,156.3
1997 $ 867.6
(MILLIONS)
Store CountStore Count2000 2,817*
1999 2,486*
1998 1,885
1997 1,517
* Includes Perfect Pizza restaurants in the United Kingdom.
SECURITIES AND EXCHANGE COMMISSION
Washington, D.C. 20549
FORM 10-K (Mark One) [X] Annual report pursuant to Section 13 or 15(d) of the Securities Exchange Act of 1934 For the fiscal year ended December 31, 2000
OR [ ] Transition report pursuant to Section 13 or 15(d) of the Securities Exchange Act of 1934
Commission File Number: 0-21660
PAPA JOHN'S INTERNATIONAL, INC. (Exact name of registrant as specified in its charter)
Delaware 61-1203323 (State or other jurisdiction of (I.R.S. Employer incorporation or organization) Identification Number)
2002 Papa John’s Boulevard Louisville, Kentucky 40299-2334
(Address of principal executive offices)
(502) 261-7272 (Registrant's telephone number, including area code)
Securities registered pursuant to Section 12(b) of the Act: (Name of each exchange (Title of Each Class) on which registered)
None None
Securities registered pursuant to Section 12(g) of the Act: Common Stock, $.01 par value The NASDAQ Stock Market
Indicate by check mark whether the Registrant (1) has filed all reports required to be filed by Section 13 or 15(d) of the Securities Exchange Act of 1934 during the preceding 12 months (or for such shorter period that the registrant was required to file such reports), and (2) has been subject to such filing requirements for the past 90 days: Yes X No
Indicate by check mark if disclosure of delinquent filers pursuant to Item 405 of Regulation S-K is not contained herein, and will not be contained, to the best of Registrant's knowledge, in definitive proxy or information statements incorporated by reference in Part III of this Form 10-K or any amendment to this Form 10-K. [ ]
As of March 12, 2001 there were 22,741,582 shares of the Registrant's Common Stock outstanding. The aggregate market value of the shares of Registrant's Common Stock held by non-affiliates of the Registrant at such date was $327,300,663 based on the last sale price of the Common Stock on March 12, 2001 as reported by The NASDAQ Stock Market. For purposes of the foregoing calculation only, all directors and executive officers of the Registrant have been deemed affiliates.
DOCUMENTS INCORPORATED BY REFERENCE
Portions of Part III are incorporated by reference to the Registrant's Proxy Statement for the Annual Meeting of Stockholders to be held May 17, 2001.
1
TABLE OF CONTENTS PART I Item 1. Business Item 2. Properties Item 3. Legal Proceedings Item 4. Submission of Matters to a Vote of Security Holders PART II Item 5. Market for Registrant's Common Equity and Related Stockholder Matters Item 6. Selected Financial Data Item 7. Management's Discussion and Analysis of Financial Condition and Results of Operations Item 7A. Quantitative and Qualitative Disclosures about Market Risk Item 8. Financial Statements and Supplementary Data Item 9. Changes in and Disagreements with Accountants
on Accounting and Financial Disclosure PART III Item 10. Directors and Officers of the Registrant Item 11. Executive Compensation Item 12. Security Ownership of Certain Beneficial Owners and Management Item 13. Certain Relationships and Related Transactions PART IV Item 14. Exhibits, Financial Statement Schedules and
Reports on Form 8-K
2
PART I Item 1. Business General Papa John’s International, Inc. (referred to as the "Company”, “Papa John’s” or in the first person notations of “we”, “us” and “our”) operates and franchises pizza delivery and carry-out restaurants under the trademark “Papa John's” domestically in 49 states, the District of Columbia and ten international markets, and under the trademark “Perfect Pizza” in the United Kingdom. The first Company-owned Papa John’s restaurant opened in 1985 and the first franchised restaurant opened in 1986. We acquired Perfect Pizza Holdings Limited (“Perfect Pizza”) in 1999 as part of our plan to develop restaurants internationally (see Business - Expansion). At December 31, 2000, there were 2,612 Papa John’s restaurants in operation, consisting of 641 Company-owned and 1,971 franchised restaurants. Additionally, there were 205 Perfect Pizza restaurants in operation, consisting of three Company-owned and 202 franchised restaurants. In February 2001, the Company realigned into four key groups - Operations, Administration, Development and Resource/Support, each reporting to our Chief Executive Officer. The four areas are as follows:
Operations - responsible for Corporate Restaurant Operations, PJ Food Service and Support Services. Administration - responsible for Finance, Information Systems and Office Services. Development - responsible for Restaurant Development, International Operations, Franchise Sales and Legal. Resource/Support - responsible for Franchise Operations and Business Consulting, Education and Training, Human Resources, Field Marketing and Internal Communications.
Strategy Our goal is to build the strongest brand loyalty of all pizzerias internationally. To accomplish this goal, we have developed a strategy designed to achieve high levels of customer satisfaction and repeat business, as well as to establish recognition and acceptance of the Papa John’s brand. The key elements of our strategy include: Focused Menu. Papa John’s restaurants offer a focused menu of high-quality pizza, breadsticks and cheesesticks. Papa John’s traditional crust pizza is prepared using fresh dough (never frozen), cheese made from 100% real mozzarella, fresh-packed pizza sauce made from vine-ripened tomatoes (not from concentrate) and a proprietary mix of savory spices, and a choice of high-quality meat (no artificial fillers) and vegetable toppings. Papa John’s thin crust pizza is made with a prepared crust and the same high-quality toppings. We believe our focused menu creates a strong identity in the marketplace, while also simplifying operations at our restaurants.
3
Efficient Operating System. We believe our operating and distribution systems, restaurant layout and designated delivery areas result in lower restaurant operating costs and improved food quality, and promote superior customer service. Our Quality Control Center ("QC Centers") system takes advantage of volume purchasing of food and supplies, and provides consistency and efficiencies of scale in dough production. This eliminates the need for each restaurant to order food from multiple vendors and commit substantial labor and other resources to dough preparation. Because Papa John’s restaurants have a focused menu and specialize in delivery and carry-out services, each team member can concentrate on a well-defined function in preparing and delivering the customer’s order. Commitment to Team Member Training and Development. We are committed to the development and motivation of our team members through training programs, incentive compensation and opportunities for advancement. Team member training programs are conducted for corporate team members, and offered to our franchisees at training centers across the United States. We offer performance-based financial incentives to restaurant team members at various levels. Our growth also provides significant opportunities for advancement. We believe these factors create an entrepreneurial spirit throughout Papa John’s, resulting in a positive work environment and motivated, customer-oriented team members. Marketing. Our restaurant-level marketing programs target the delivery area of each restaurant, making extensive use of distinctive print materials in direct mail and store-to-door couponing. Local marketing efforts also include a variety of community-oriented activities with schools, sports teams and other organizations. In markets where we or our franchisees have a significant presence, local marketing efforts are supplemented with radio and television advertising. Three national television campaigns aired in 2000. Franchise System. We are committed to developing a strong franchise system by attracting experienced operators, allowing them to expand in a controlled manner and monitoring their compliance with our high standards. We seek to attract franchisees with experience in multi-unit restaurant operations and with the financial resources and management capability to open multiple locations. To ensure consistent food quality, each domestic franchisee is required to purchase dough and spice mix from us and purchase all other supplies from us or our approved suppliers. QC Centers outside the U.S. may be operated by franchisees pursuant to license agreements. We devote significant resources to provide Papa John’s franchisees with assistance in restaurant operations, management training, team member training, marketing, site selection and restaurant design. Unit Economics We believe our unit economics are exceptional. In 2000, the 534 Company-owned restaurants included in the most recent comparable restaurant base generated average sales, based on a 53-week year, of $782,000, average cash flow (operating income plus depreciation) of $155,000 and average restaurant operating income of $127,000 (or 16.2% of average sales). The average cash investment for the 42 domestic company-owned restaurants opened during the 2000 fiscal year, exclusive of land, was approximately $268,000. We expect the average cash investment for Company-owned restaurants opening in 2001 to be approximately $272,000. Expansion A total of 358 Papa John’s restaurants were opened during 2000, consisting of 44 Company-owned (42 domestic and 2 in the United Kingdom) and 314 franchised restaurants. During 1999, we acquired Perfect
4
Pizza, an operator and franchisor of 206 delivery and carry-out pizza restaurants in the United Kingdom (See “Note 3” of “Notes to Consolidated Financial Statements”). During 2000, 11 Perfect Pizza franchised restaurants were opened and we converted eight Company-owned Perfect Pizza restaurants to Papa John’s units. During 2001, we plan to open approximately 15 to 20 restaurants domestically and acquire an additional 20 restaurants from our franchisees and expect franchisees to open approximately 195 to 255 restaurants both domestically and internationally. Newer domestic market expansion is planned for the West Coast, Mid-Atlantic states, and Rocky Mountain regions, in addition to building out existing markets throughout the country. International expansion in 2001 is planned primarily in Mexico, Puerto Rico, Venezuela, Costa Rica, Guatemala, Honduras, Saudi Arabia, Canada, Bahamas, and the United Kingdom. The conversion of Perfect Pizza restaurants will continue during the next four or five years. Our ability and the ability of our franchisees to open new restaurants is affected by a number of factors, many of which are beyond our control and the control of our franchisees. These factors include, among other things, selection and availability of suitable restaurant and QC Center sites, increases in food, paper or labor costs, negotiation of suitable lease or financing terms, constraints on permitting and construction of restaurants and the hiring, training and retention of management and other personnel. Accordingly, there can be no assurance that we or our franchisees will be able to meet planned growth targets or open restaurants in markets now targeted for expansion. Our expansion strategy is to cluster restaurants in targeted markets, thereby increasing consumer awareness and enabling us to take advantage of operational, distribution and advertising efficiencies. Our experience in developing markets indicates that market penetration through the opening of multiple restaurants within a particular market results in increased average restaurant sales in that market. We have co-developed markets with some franchisees or divided markets among franchisees, and will continue to utilize market co-development in the future. In determining which new markets to develop, we consider many factors, including the size of the market, demographics and population trends, competition, and availability and costs of real estate. Before entering a new market, we analyze detailed information concerning these factors and each market is toured and evaluated by a member of our Development department. Menu Papa John’s restaurants offer a focused menu of high-quality pizza, breadsticks and cheesesticks, as well as canned or bottled soft drinks. Papa John’s traditional crust pizza is prepared using fresh dough (never frozen), and our thin crust pizza is made with a prepared crust. Papa John’s pizzas are made from hard wheat flour, cheese made from 100% real mozzarella, fresh-packed pizza sauce made with vine-ripened tomatoes (not from concentrate) and a proprietary mix of savory spices, and a choice of high-quality meat (no artificial fillers) and vegetable toppings. Fresh onions and green peppers are purchased from local produce suppliers or the QC Center system and sliced daily in the restaurants. Fresh baby portabella mushrooms are purchased from the QC Center system, which delivers twice weekly. Each traditional crust pizza is served with a container of our special garlic sauce and two pepperoncinis, and each thin crust pizza is served with a container of special seasonings and two pepperoncinis. We believe our focused menu helps create a strong identity among consumers and simplifies operations, resulting in lower restaurant operating costs, improved food quality and consistency and superior customer service. Additionally, we may from time to time test product variations or new products which are consistent with our goal of simplified operations and superior customer service.
5
Restaurant Design and Site Selection The exterior of most Papa John’s restaurants is characterized by backlit awnings, neon window designs and other visible signage. A typical domestic Papa John’s restaurant averages 1,200 to 1,800 square feet and a typical international Papa John’s restaurant averages 800 to 1,400 square feet. Papa John’s restaurants are designed to facilitate a smooth flow of food orders through the restaurant. The layout includes specific areas for order taking, pizza preparation and routing, resulting in simplified operations, lower training and labor costs, increased efficiency and improved consistency and quality of food products. The typical interior of a Papa John’s restaurant has a vibrant red and white color scheme with green striping, and includes a bright menu board, custom counters and a carry-out customer area. The counters are designed to allow customers to watch the team members slap out the dough and put sauce and toppings on pizzas. We consider the location of a restaurant to be important and therefore devote significant resources to the investigation and evaluation of potential sites. The site selection process includes a review of trade area demographics, target population density, household income levels and competitive factors. A member of our development team inspects each potential domestic Company-owned or franchised restaurant location and the surrounding market before a site is approved. Our restaurants are typically located in strip shopping centers or free-standing buildings that provide visibility, curb appeal and accessibility. Our restaurant design may be configured to fit a wide variety of building shapes and sizes, which increases the number of suitable locations for our restaurants. Since 1994, an increasing number of free-standing restaurants have been opened in the Papa John’s system. We seek either existing buildings suitable for conversion, or locations suitable for the construction of our prototype restaurant. Free-standing buildings generally provide more signage and better visibility, accessibility and parking. We believe that these locations improve Papa John’s image and brand awareness. At year-end, free-standing units represented approximately 23% of Company-owned restaurants. We expect this ratio to remain fairly constant in future years. We also have ten multi-bay units open, but we do not expect to significantly increase the number of these units. All of the equipment, fixtures and smallwares needed to open a Papa John’s restaurant are available for purchase through us. We also provide layout and design services and recommend subcontractors, signage installers and telephone systems to Papa John’s franchisees. Although not required to do so, substantially all Papa John’s franchisees purchase most of their equipment from us. Quality Control Centers; Strategic Supply Chain Management Our domestic QC Centers, comprised of eleven regional production and distribution centers, supply pizza dough, food products, paper products, smallwares and cleaning supplies twice weekly to each restaurant. Our system enables us to monitor and control product quality and consistency, while lowering food costs. A full-service QC Center was opened in Phoenix, Arizona in the second quarter of 2000 replacing our previous distribution center. Our other full-service QC Centers are in Louisville, Kentucky; Dallas, Texas; Pittsburgh, Pennsylvania; Orlando, Florida; Raleigh, North Carolina; Jackson, Mississippi; Denver, Colorado; Rotterdam, New York; Portland, Oregon and Des Moines, Iowa. The primary difference between a full-service QC Center and a distribution center is that full-service QC Centers produce fresh pizza dough. The QC Center system capacity is continually evaluated in relation to planned restaurant growth, and facilities are developed or upgraded as operational or economic conditions warrant.
6
Six franchised QC Centers located in Canada, Mexico, Honduras, Iceland, Saudi Arabia and Alaska were opened in 2000, and a corporate QC Center was opened in Cambridge, Canada. Other international franchised QC Centers are located in Puerto Rico, Costa Rica, Venezuela, and Guatemala. We expect future international QC Centers to be licensed to franchisees; however, we may open Company-owned QC Centers at our discretion. Perfect Pizza relocated and expanded its distribution center to accommodate a full-service QC Center during 2000. We set quality standards for all products used in our restaurants and designate approved outside suppliers of food and paper products that meet our quality standards. In order to ensure product quality and consistency, all of our restaurants are required to purchase proprietary spice mix and dough from our QC Centers. Franchisees may purchase other goods directly from approved suppliers or our QC Centers. National purchasing agreements with most of our suppliers generally result in volume discounts to us, allowing us to sell products to our restaurants at prices which we believe are below those generally available in the marketplace. Within our domestic QC Center system, products are distributed to restaurants by refrigerated trucks leased and operated by us or transported by a dedicated logistics company. Effective December 27, 1999, PJ Food Service, our wholly-owned subsidiary that operates our domestic company-owned QC Centers, entered into a purchasing arrangement with a third-party entity formed at the direction of the Franchise Advisory Council (see Franchise Program – Franchise Advisory Council) for the sole purpose of reducing cheese price volatility. Under this arrangement, PJ Food Service purchases cheese at a fixed quarterly price based in part on historical average cheese prices. Gains and losses incurred by the selling entity are passed to the commissary via adjustments to the selling price over time. Ultimately PJ Food Service purchases cheese at a price approximating the actual average market price, but with more predictability and less volatility than the previous purchasing method. (See "Note 12" of "Notes to Consolidated Financial Statements.") Marketing Programs Our restaurant-level marketing programs target the delivery area of each restaurant, making extensive use of distinctive print materials in direct mail and store-to-door couponing. The local marketing efforts also include a variety of community-oriented activities with schools, sports teams and other organizations. In markets in which we or Papa John’s franchisees have a significant presence, local marketing efforts are supplemented with radio and television advertising. All Company-owned and franchised Papa John’s restaurants within a developed market are required to join an advertising cooperative (“Co-op”). Each member restaurant contributes a percentage of sales to the Co-op for market wide programs, such as radio, television and print. The rate of contribution and uses of the monies collected are determined by a majority vote of the Co-op’s members. The restaurant-level and Co-op marketing efforts are supported by print and electronic advertising materials that are produced by the Papa John’s Marketing Fund, Inc., a non-profit corporation (the “Marketing Fund”), for use by us and our franchisees. The Marketing Fund produces Papa John’s national television commercials. We provide both Company-owned and franchised restaurants with catalogs for the purchase of uniforms and promotional items and pre-approved print marketing materials. We also provide direct marketing services to Company-owned and franchised restaurants utilizing customer information gathered by our proprietary point-of-sale technology.

7

8
Company Operations Restaurant Personnel. A typical Papa John’s restaurant employs a restaurant manager, two assistant managers and approximately 20 to 25 hourly team members, most of whom work part-time. The manager is responsible for the day-to-day operation of the restaurant and for maintaining Company-established operating standards. The operating standards and other resources are contained in a comprehensive operations manual supplied to each restaurant and updated regularly. We seek to hire experienced restaurant managers and staff, provide comprehensive training on operations and managerial skills, and motivate and retain them by providing opportunities for advancement and performance-based financial incentives. We employ area supervisors, each of whom has responsibility for overseeing three to six Company-owned restaurants. We also employ operations vice presidents and district managers who oversee area supervisors and managers within their respective markets. These team members are eligible to earn performance-based financial incentives. Training and Education. We have a department dedicated to training and developing team members, as well as assisting with new restaurant openings. We have at least one full-time training coordinator for each of our markets and regional training directors located strategically across the country. We provide an on-site training team three days before and three days after the opening of any Company-owned or franchised restaurant requesting assistance. Each operations vice president, district manager, area supervisor and restaurant manager completes our management training program and on-going development programs in which instruction is given on all aspects of our systems and operations. The programs include classroom instruction and hands-on training at an operating Papa John’s restaurant or at Company-certified training centers. Our training includes: new team member orientation, in-store and delivery training, core management skills training, new product or program implementation and ongoing developmental programs. Point of Sale Technology. Point of sale technology (our proprietary PROFIT SystemTM) is in place in substantially all Company-owned and franchised restaurants. We believe this technology facilitates faster and more accurate order taking and pricing, reduces paperwork and allows the restaurant manager to better monitor and control food and labor costs. We believe the PROFIT System enhances restaurant-level marketing capabilities through the development of a data base containing information on customers and their buying habits with respect to our products. Polling capabilities allow us to obtain restaurant operating information, thereby improving the speed, accuracy and efficiency of restaurant-level reporting. Reporting. Managers at Company-owned restaurants evaluate daily reports of sales, cash deposits and operating costs. Physical inventories of all food and beverage items are taken nightly. Our area supervisors prepare weekly operating projections for each of the restaurants under their supervision. Hours of Operations. Our domestic restaurants are open seven days a week, typically from 11:00 a.m. to 12:30 a.m. Monday through Thursday, 11:00 a.m. to 1:30 a.m. on Friday and Saturday and 12:00 noon to 11:30 p.m. on Sunday. Franchise Program General. We continue to attract many franchisees with significant restaurant experience. We consider our franchisees to be a vital part of our system’s continued growth and believe our relationship with our
9
franchisees is excellent. As of December 31, 2000, there were 1,971 franchised Papa John’s restaurants operating in 49 states, the District of Columbia, and ten international markets, and 202 franchised Perfect Pizza restaurants operating in the United Kingdom. We have development agreements with our domestic franchisees for approximately 460 additional franchised restaurants committed to open through 2007 and agreements for 343 additional international franchised restaurants to open through 2009. There can be no assurance that all of these restaurants will be opened or that the development schedule set forth in the development agreements will be achieved. Formal development agreements for franchised Perfect Pizza restaurants do not exist, although a pipeline of qualified franchisees interested in expansion is maintained. During the 2000 fiscal year, 314 (271 domestic and 43 international) franchised Papa John’s restaurants were opened, and 11 Perfect Pizza franchised restaurants were opened . Approval. Franchisees are approved on the basis of the applicant’s business background, restaurant operating experience and financial resources. We generally seek franchisees who will enter into development agreements for multiple restaurants. We seek franchisees who have restaurant experience or, in the case of franchisees who do not have restaurant experience, we require the franchisee to hire a full-time operator who has either an equity interest or the right to acquire an equity interest in the franchise operation. Development and Franchise Agreements. We enter into development agreements with our domestic franchisees for the opening of a specified number of restaurants within a defined period of time and specified geographic area. Under our current standard development agreement, the franchisee is required to pay, at the time of signing the agreement, a non-refundable fee of $5,000 per restaurant covered by the development agreement. This amount is credited against the standard $20,000 franchise fee payable to us upon signing the franchise agreement for a specific location. Generally, a franchise agreement is executed when a franchisee secures a location. Our current standard domestic franchise agreement provides for a term of 10 years (with one ten-year renewal option) and payment to us of a royalty fee of 4% of sales. The current agreement, as well as substantially all existing franchise agreements, permit us to increase the royalty fee up to 5% of sales after the agreement has been in effect for three years. However, the royalty fee cannot be increased to an amount greater than the percentage royalty fee then in effect for new franchisees. We have the right to terminate a franchise agreement for a variety of reasons, including a franchisee’s failure to make payments when due or failure to adhere to our policies and standards. Many state franchise laws limit the ability of a franchisor to terminate or refuse to renew a franchise. We opened our first franchised restaurant outside the United States in 1998. In international markets, we enter into either a development agreement or a master franchise agreement with a franchisee for the opening of a specified number of restaurants within a defined period of time and specified geographic area. Under a master franchise agreement, the franchisee has the right to subfranchise a portion of the development to one or more subfranchisees approved by us. Under our current standard international development agreement, the franchisee is required to pay total fees of $25,000 per restaurant, $5,000 at the time of signing the agreement, and $20,000 when the restaurant opens or the agreed-upon development date, whichever comes first. Under our current master franchise agreement, the master franchisee is required to pay total fees of $25,000 per restaurant owned and operated by the master franchisee, under the same terms as for the development agreement, and $15,000 for each subfranchised restaurant, $5,000 at the time of signing the agreement and $10,000 when the restaurant opens or the agreed-upon development date, whichever comes first.
10
Our current standard international master franchise and development agreements provide for payment to us of a royalty fee of 5% of sales (including sales by subfranchised restaurants), with no provision for increase. The remaining terms applicable to the operation of individual restaurants are substantially equivalent to the terms of our standard domestic franchise agreement. We franchise restaurants in the United Kingdom under Perfect Pizza franchise agreements, which were in effect at the time of our acquisition. These franchise agreements differ from our standard international franchise agreements in many respects, although with few material differences. A principal difference is the term of the agreement, which is five years. The franchisee fee is £8,000 (approximately $11,900 at an exchange rate of 1.49), and the royalty rate of 5% is the same as our standard international agreements. The Perfect Pizza system has been developed principally through franchising of individual restaurants to single location franchisees. Thus, the system has no equivalent to our development agreements or master franchise agreements. We have entered into a limited number of development and franchise agreements for non-traditional restaurant units. These agreements generally cover venues or areas not originally targeted for development and have terms differing from the standard agreement. These agreements have not had a significant impact on our revenues or earnings. Franchise Restaurant Development. We provide assistance to Papa John’s franchisees in selecting sites, developing restaurants and evaluating the physical specifications for typical restaurants. Each franchisee is responsible for selecting the location for its restaurants but must obtain our approval of restaurant design and location based on accessibility and visibility of the site and targeted demographic factors, including population, density, income, age and traffic. We provide design plans, fixtures and equipment for most franchisee locations at competitive prices. Franchisee Loan Program. We have a program under which selected franchisees can borrow funds principally for use in the construction and development of their restaurants. Loans made under the program typically bear interest at fixed or floating rates (ranging from 7.0% to 12.0% at December 31, 2000), and are secured by the fixtures, equipment and signage (and where applicable, the land) of the restaurant and the ownership interests in the franchisee. In limited cases, we have obtained a purchase option with respect to the financed restaurants. At December 31, 2000, loans outstanding under the franchise loan program totaled $16.7 million, net of the estimated allowance for doubtful collection of certain notes, with commitments to lend up to an additional $6.0 million. The loans outstanding include a loan of $3.4 million to the Marketing Fund (see Marketing Programs). We do not expect to significantly expand the franchisee loan program beyond current commitment levels. See "Notes 4 and 7" of "Notes to Consolidated Financial Statements” for additional information. Franchise Training and Support. Every franchisee is required to have a principal operator approved by us who satisfactorily completes our required training program and who devotes his or her full business time and efforts to the operation of the franchisee's restaurants. Each franchised restaurant manager is also required to complete our Company-certified management training program. We provide an on-site training crew three days before and three days after the opening of a franchisee's first two restaurants. Ongoing supervision of training is monitored by the corporate franchise training team. Multi-unit franchisees are encouraged to hire a full-time training coordinator certified to deliver Company approved programs in order to train new team members and management candidates for their restaurants. Our franchise consultants, reporting to the Vice President of Franchise Operations, maintain open communication with
11
the franchise community, relaying operating and marketing information and new ideas between us and franchisees. Franchise Operations. All franchisees are required to operate their Papa John’s restaurants in compliance with our policies, standards and specifications, including matters such as menu items, ingredients, materials, supplies, services, fixtures, furnishings, decor and signs. Each franchisee has full discretion to determine the prices to be charged to its customers. Franchise Advisory Council. We have a Franchise Advisory Council that consists of Company and franchisee representatives. The Advisory Council holds quarterly meetings to discuss new marketing ideas, operations, growth and other relevant issues. Reporting. We collect weekly and monthly sales and other operating information from Papa John’s franchisees. We have agreements with most Papa John’s domestic franchisees permitting us to electronically debit the franchisees’ bank accounts for the payment of royalties, Marketing Fund contributions and QC Center purchases from Papa John’s. This system significantly reduces the resources needed to process receivables, improves cash flow and virtually eliminates past-due accounts related to these items. Franchisees generally are required to purchase and install the Papa John’s PROFIT System in their restaurants (see Company Operations — Point of Sale Technology). Competition The restaurant industry is intensely competitive with respect to price, service, location and food quality, and there are many well-established competitors with substantially greater financial and other resources than Papa John’s. Competitors include a large number of international, national and regional restaurant chains, as well as local pizza operators. Some of our competitors have been in existence for a substantially longer period than us and may be better established in the markets where our restaurants are, or may be, located. Within the pizza segment of the restaurant industry, we believe our primary competitors are the international pizza chains, including Pizza Hut, Domino’s and Little Caesars, and several regional chains. A change in the pricing or other marketing strategies of one or more of our competitors could have an adverse impact on our sales and earnings. The restaurant business is often affected by changes in consumer tastes, national, regional or local economic conditions, demographic trends, traffic patterns and the type, number and location of competing restaurants. In addition, factors such as inflation, increased cheese and other commodity costs, fuel costs, labor and benefits costs and the lack of experienced management and hourly team members may adversely affect the restaurant industry in general and our restaurants in particular. With respect to the sale of franchises, we compete with many franchisors of restaurants and other business concepts. In general, there is also active competition for management personnel and attractive commercial real estate sites suitable for our restaurants. Government Regulation We, along with our franchisees, are subject to various federal, state and local laws affecting the operation of our respective businesses. Each Papa John’s restaurant is subject to licensing and regulation by a number of governmental authorities, which include health, safety, sanitation, building and fire agencies in the state or municipality in which the restaurant is located. Difficulties in obtaining, or the failure to obtain,
12
required licenses or approvals can delay or prevent the opening of a new restaurant in a particular area. Our full-service QC Centers and distribution facilities are licensed and subject to regulation by state and local health and fire codes, and the operation of our trucks is subject to Department of Transportation regulations. We are also subject to federal and state environmental regulations. We are subject to Federal Trade Commission (“FTC”) regulation and various state laws regulating the offer and sale of franchises. Several state laws also regulate substantive aspects of the franchisor-franchisee relationship. The FTC requires us to furnish to prospective franchisees a franchise offering circular containing prescribed information. A number of states in which we might consider franchising also regulate the sale of franchises and require registration of the franchise offering circular with state authorities. Substantive state laws that regulate the franchisor-franchisee relationship presently exist in a substantial number of states, and bills have been introduced in Congress from time to time which would provide for federal regulation of the franchisor-franchisee relationship in certain respects. The state laws often limit, among other things, the duration and scope of non-competition provisions and the ability of a franchisor to terminate or refuse to renew a franchise. Some foreign countries also have disclosure requirements and other laws regulating franchising and the franchisor-franchisee relationship. As we expand internationally, we will be subject to applicable laws in each jurisdiction where franchised units are established. We are also subject to the Americans With Disabilities Act of 1990, which, among other things, may require renovations to restaurants to meet federally-mandated requirements. The cost of these renovations is not expected to be material. Further government initiatives could adversely affect us and our franchisees as well as the restaurant industry in general. Trademarks Our rights in principal trademarks and service marks are a significant part of our business. We are the owner of the federal registration of the trademark “Papa John’s.” We have also registered “Pizza Papa John’s and design” (our logo), “Better Ingredients. Better Pizza.” and “Pizza Papa John’s Better Ingredients. Better Pizza. and design” as trademarks and service marks. We also own federal registrations for several ancillary marks, principally advertising slogans. We have also applied to register our primary trademark, “Pizza Papa John’s and design,” in 90 foreign countries and the European Community. The “Perfect Pizza” trademark is also registered in the United Kingdom. We are aware of the use by other persons in certain geographical areas of names and marks which are the same as or similar to our marks. It is our policy to pursue registration of our marks whenever possible and to oppose vigorously any infringement of our marks. See "Item 3. Legal Proceedings" and "Note 14" of "Notes to Consolidated Financial Statements" for additional information. Employees As of December 31, 2000, we employed 17,922 persons, of whom approximately 15,582 were restaurant team members, 770 were restaurant management and supervisory personnel, 681 were corporate personnel and 889 were PJ Food Service and support services personnel. Most restaurant team members work part-time and are paid on an hourly basis. None of our team members is covered by a collective bargaining agreement. We consider our team member relations to be excellent. Forward Looking Statements
13
This Form 10-K contains forward looking statements within the meaning of the Private Securities Litigation Reform Act of 1995 (the “Act”), including information within Management’s Discussion and Analysis of Financial Condition and Results of Operations. The following cautionary statements are being made pursuant to the provisions of the Act and with the intention of obtaining the benefits of the “safe harbor” provisions of the Act. Although we believe that our expectations are based on reasonable assumptions, actual results may differ materially from those in the forward looking statements as a result of various factors, including but not limited to, the following: 1. Our ability and the ability of our franchisees to continue to expand through the opening of new restaurants is affected by a number of factors, many of which are beyond our control and our franchisees’ control. These factors include, among other things, selection and availability of suitable restaurant locations, increases in food, paper and labor costs, negotiation of suitable lease or financing terms, constraints on permitting and construction of other restaurants, higher than anticipated construction costs, and the hiring, training and retention of management and other personnel. Accordingly, there can be no assurance that we or the Papa John’s franchisees will be able to meet planned growth targets, open restaurants in markets now targeted for expansion, or continue to operate in existing markets. 2. The restaurant industry is intensely competitive with respect to price, service, location and food quality, and there are many well-established competitors with substantially greater financial and other resources than Papa John’s and our franchisees. Some of these competitors have been in existence for a substantially longer period than us or our franchisees and may be better established in the markets where restaurants operated by Papa John’s or our franchisees are, or may be, located. A change in the pricing or other marketing or promotional strategies of one or more of our major competitors could have an adverse impact on sales and earnings at restaurants operated by us and our franchisees. 3. An increase in the cost of cheese or other commodities could adversely affect the profitability of our restaurant operations. Cheese, representing approximately 35 to 40% of our food cost, and other commodities are subject to seasonal fluctuations, weather, availability, demand and other factors that are beyond our control. Additionally, sustained increases in fuel costs could adversely affect profitability of our restaurant and QC Center businesses. 4. Changes in consumer taste, demographic trends, traffic patterns and the type, number and location of competing restaurants could adversely affect our restaurant business. 5. Our restaurant operations are subject to federal and state laws governing such matters as wages, working conditions, citizenship requirements and overtime. A significant number of hourly personnel employed by us and our franchisees are paid at rates related to the federal minimum wage. Accordingly, further increases in the minimum wage will increase labor costs for us and our franchisees. Additionally, labor shortages in various markets could result in higher required wage rates. 6. Our international operations are subject to a number of additional factors, including international economic and political conditions, currency regulations and fluctuations, differing cultures and consumer preferences, diverse government regulations and structures, availability and cost of land and construction, and differing interpretation of the obligations established in franchise agreements with international franchisees. Accordingly, there can be no assurance that our international operations will achieve or maintain profitability or meet planned growth rates.

14
7. Our planned conversion of Perfect Pizza restaurants to Papa John’s restaurants over the next four to five years represents the first time we have attempted to expand the Papa John’s brand in this manner. There can be no assurance that all conversion issues will be identified and successfully addressed in a timely and cost-effective manner or that the existing Perfect Pizza market share can be successfully converted to Papa John’s.
15
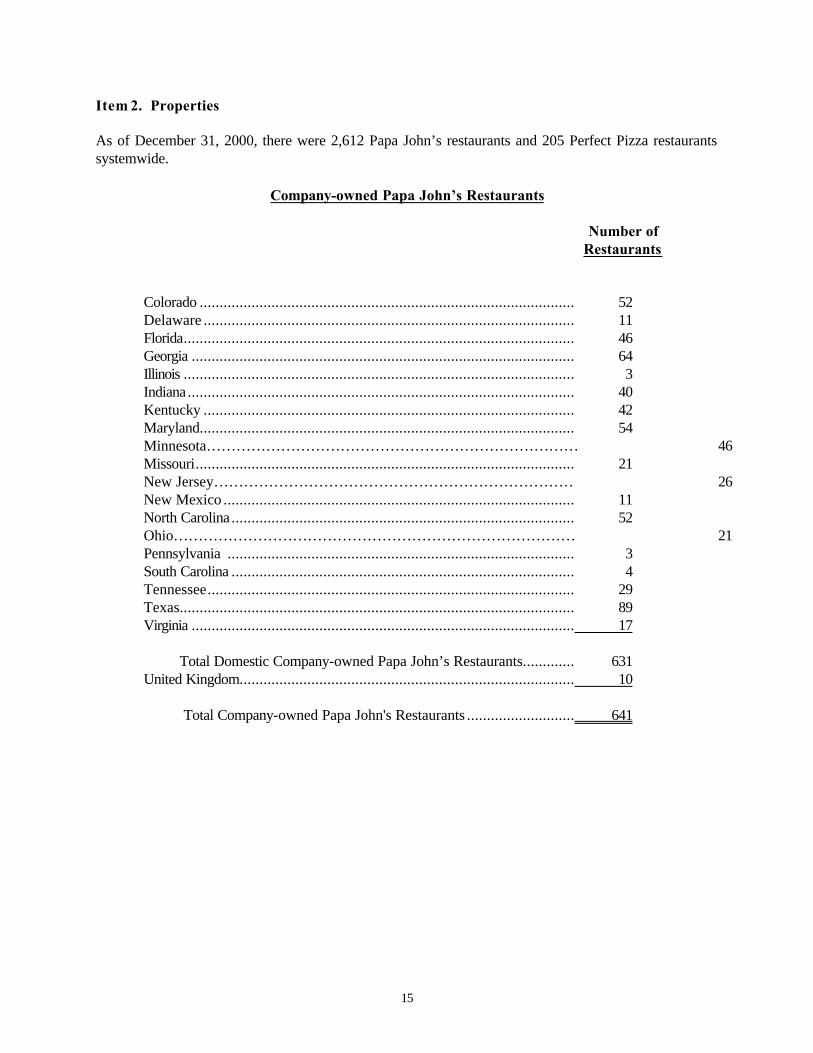
Item 2. Properties As of December 31, 2000, there were 2,612 Papa John’s restaurants and 205 Perfect Pizza restaurants systemwide.
Company-owned Papa John’s Restaurants Number of Restaurants Colorado .............................................................................................. 52 Delaware ............................................................................................. 11 Florida.................................................................................................. 46 Georgia ................................................................................................ 64 Illinois .................................................................................................. 3 Indiana ................................................................................................. 40 Kentucky ............................................................................................. 42 Maryland.............................................................................................. 54 Minnesota………………………………………………………………… 46 Missouri............................................................................................... 21 New Jersey……………………………………………………………… 26 New Mexico ........................................................................................ 11 North Carolina ...................................................................................... 52 Ohio……………………………………………………………………… 21 Pennsylvania ....................................................................................... 3 South Carolina ...................................................................................... 4 Tennessee............................................................................................ 29 Texas................................................................................................... 89 Virginia ................................................................................................ 17 Total Domestic Company-owned Papa John’s Restaurants............. 631 United Kingdom.................................................................................... 10 Total Company-owned Papa John's Restaurants ........................... 641
16
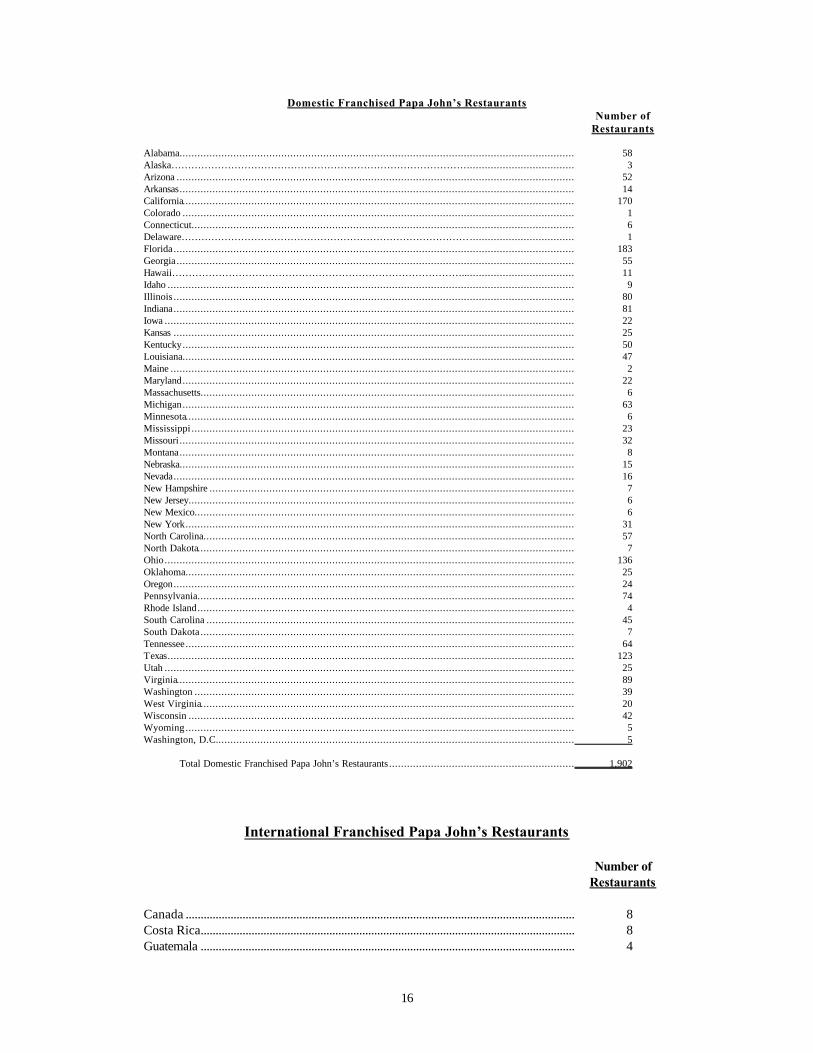
Domestic Franchised Papa John’s Restaurants Number of Restaurants Alabama.................................................................................................................................... 58 Alaska………………………………………………………………………………................................... 3 Arizona ..................................................................................................................................... 52 Arkansas.................................................................................................................................... 14 California................................................................................................................................... 170 Colorado ................................................................................................................................... 1 Connecticut................................................................................................................................ 6 Delaware……………………………………………………………………………................................... 1 Florida...................................................................................................................................... 183 Georgia..................................................................................................................................... 55 Hawaii……………………………………………………………………………...................................... 11 Idaho ........................................................................................................................................ 9 Illinois ...................................................................................................................................... 80 Indiana...................................................................................................................................... 81 Iowa ......................................................................................................................................... 22 Kansas ...................................................................................................................................... 25 Kentucky................................................................................................................................... 50 Louisiana................................................................................................................................... 47 Maine ....................................................................................................................................... 2 Maryland................................................................................................................................... 22 Massachusetts............................................................................................................................. 6 Michigan................................................................................................................................... 63 Minnesota.................................................................................................................................. 6 Mississippi ................................................................................................................................ 23 Missouri .................................................................................................................................... 32 Montana.................................................................................................................................... 8 Nebraska.................................................................................................................................... 15 Nevada...................................................................................................................................... 16 New Hampshire .......................................................................................................................... 7 New Jersey................................................................................................................................. 6 New Mexico............................................................................................................................... 6 New York.................................................................................................................................. 31 North Carolina............................................................................................................................ 57 North Dakota.............................................................................................................................. 7 Ohio......................................................................................................................................... 136 Oklahoma.................................................................................................................................. 25 Oregon...................................................................................................................................... 24 Pennsylvania.............................................................................................................................. 74 Rhode Island.............................................................................................................................. 4 South Carolina ........................................................................................................................... 45 South Dakota ............................................................................................................................. 7 Tennessee.................................................................................................................................. 64 Texas........................................................................................................................................ 123 Utah ......................................................................................................................................... 25 Virginia..................................................................................................................................... 89 Washington ............................................................................................................................... 39 West Virginia............................................................................................................................. 20 Wisconsin ................................................................................................................................. 42 Wyoming .................................................................................................................................. 5 Washington, D.C........................................................................................................................ 5
Total Domestic Franchised Papa John’s Restaurants .............................................................. 1,902
International Franchised Papa John’s Restaurants
Number of Restaurants Canada .................................................................................................................................. 8 Costa Rica............................................................................................................................. 8 Guatemala ............................................................................................................................. 4
17
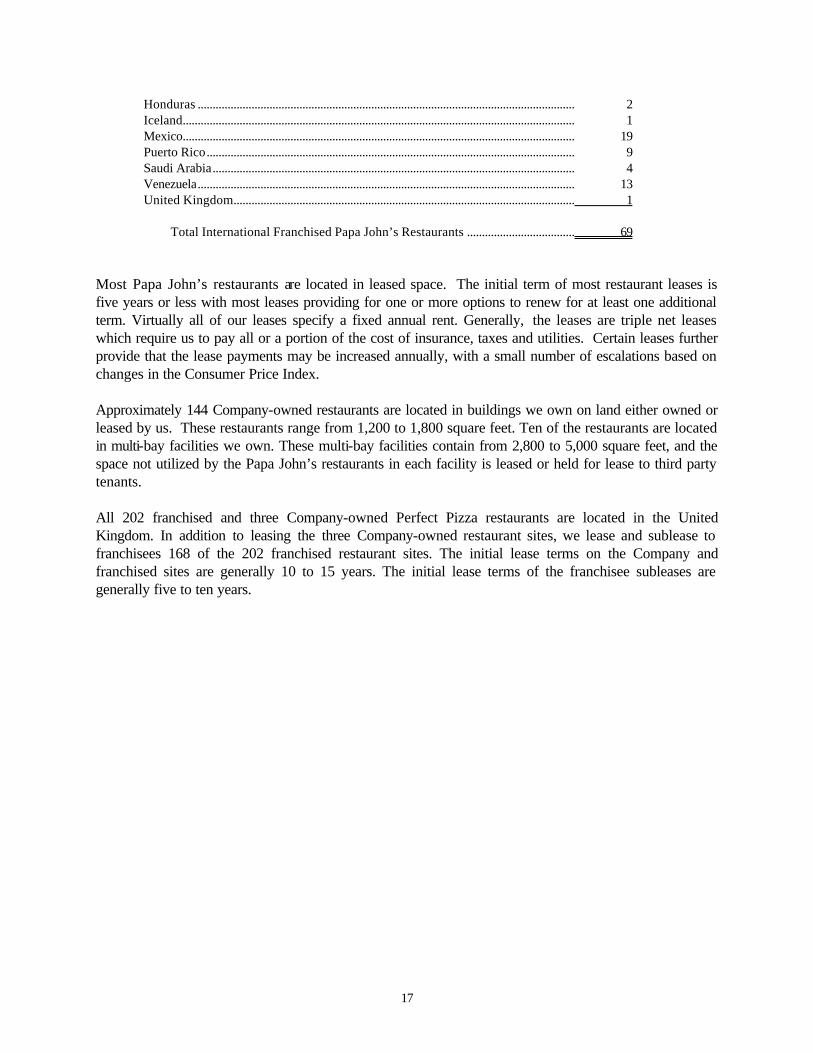
Honduras .............................................................................................................................. 2 Iceland................................................................................................................................... 1 Mexico................................................................................................................................... 19 Puerto Rico........................................................................................................................... 9 Saudi Arabia......................................................................................................................... 4 Venezuela.............................................................................................................................. 13 United Kingdom.................................................................................................................. 1 Total International Franchised Papa John’s Restaurants .................................... 69 Most Papa John’s restaurants are located in leased space. The initial term of most restaurant leases is five years or less with most leases providing for one or more options to renew for at least one additional term. Virtually all of our leases specify a fixed annual rent. Generally, the leases are triple net leases which require us to pay all or a portion of the cost of insurance, taxes and utilities. Certain leases further provide that the lease payments may be increased annually, with a small number of escalations based on changes in the Consumer Price Index. Approximately 144 Company-owned restaurants are located in buildings we own on land either owned or leased by us. These restaurants range from 1,200 to 1,800 square feet. Ten of the restaurants are located in multi-bay facilities we own. These multi-bay facilities contain from 2,800 to 5,000 square feet, and the space not utilized by the Papa John’s restaurants in each facility is leased or held for lease to third party tenants. All 202 franchised and three Company-owned Perfect Pizza restaurants are located in the United Kingdom. In addition to leasing the three Company-owned restaurant sites, we lease and sublease to franchisees 168 of the 202 franchised restaurant sites. The initial lease terms on the Company and franchised sites are generally 10 to 15 years. The initial lease terms of the franchisee subleases are generally five to ten years.
18
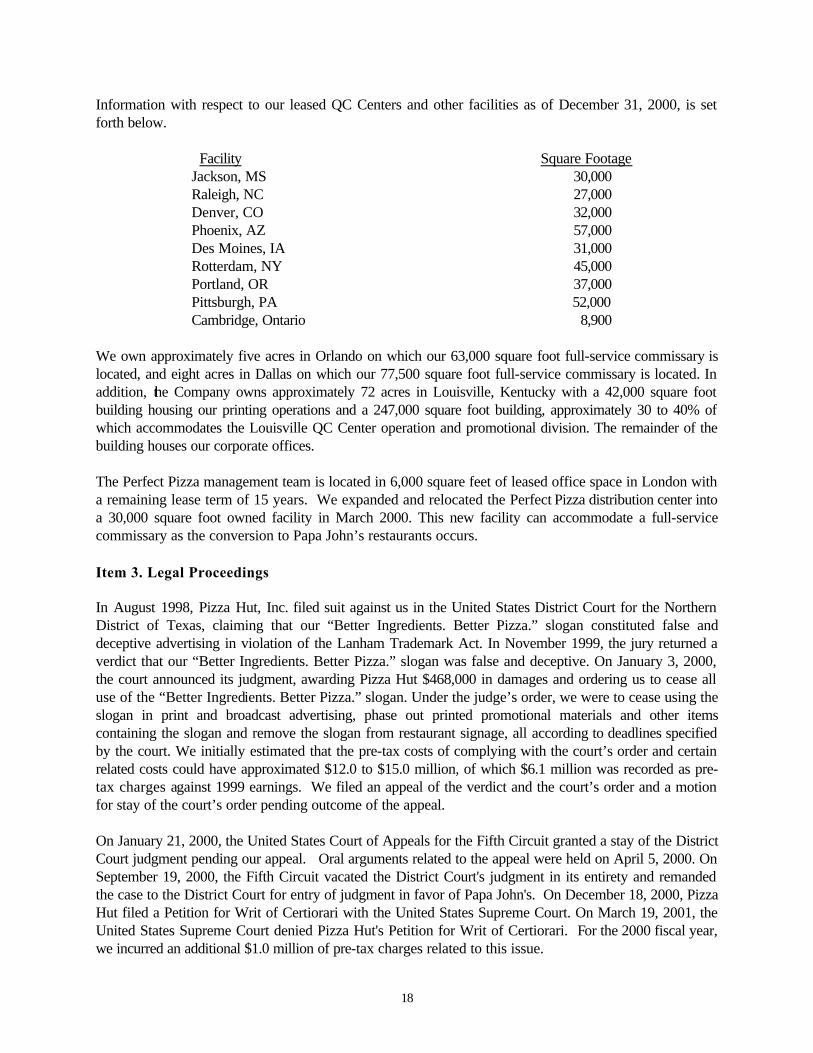
Information with respect to our leased QC Centers and other facilities as of December 31, 2000, is set forth below.
Facility Square Footage Jackson, MS 30,000 Raleigh, NC 27,000 Denver, CO 32,000 Phoenix, AZ 57,000 Des Moines, IA 31,000 Rotterdam, NY 45,000 Portland, OR 37,000 Pittsburgh, PA 52,000 Cambridge, Ontario 8,900 We own approximately five acres in Orlando on which our 63,000 square foot full-service commissary is located, and eight acres in Dallas on which our 77,500 square foot full-service commissary is located. In addition, the Company owns approximately 72 acres in Louisville, Kentucky with a 42,000 square foot building housing our printing operations and a 247,000 square foot building, approximately 30 to 40% of which accommodates the Louisville QC Center operation and promotional division. The remainder of the building houses our corporate offices. The Perfect Pizza management team is located in 6,000 square feet of leased office space in London with a remaining lease term of 15 years. We expanded and relocated the Perfect Pizza distribution center into a 30,000 square foot owned facility in March 2000. This new facility can accommodate a full-service commissary as the conversion to Papa John’s restaurants occurs. Item 3. Legal Proceedings In August 1998, Pizza Hut, Inc. filed suit against us in the United States District Court for the Northern District of Texas, claiming that our “Better Ingredients. Better Pizza.” slogan constituted false and deceptive advertising in violation of the Lanham Trademark Act. In November 1999, the jury returned a verdict that our “Better Ingredients. Better Pizza.” slogan was false and deceptive. On January 3, 2000, the court announced its judgment, awarding Pizza Hut $468,000 in damages and ordering us to cease all use of the “Better Ingredients. Better Pizza.” slogan. Under the judge’s order, we were to cease using the slogan in print and broadcast advertising, phase out printed promotional materials and other items containing the slogan and remove the slogan from restaurant signage, all according to deadlines specified by the court. We initially estimated that the pre-tax costs of complying with the court’s order and certain related costs could have approximated $12.0 to $15.0 million, of which $6.1 million was recorded as pre-tax charges against 1999 earnings. We filed an appeal of the verdict and the court’s order and a motion for stay of the court’s order pending outcome of the appeal. On January 21, 2000, the United States Court of Appeals for the Fifth Circuit granted a stay of the District Court judgment pending our appeal. Oral arguments related to the appeal were held on April 5, 2000. On September 19, 2000, the Fifth Circuit vacated the District Court's judgment in its entirety and remanded the case to the District Court for entry of judgment in favor of Papa John's. On December 18, 2000, Pizza Hut filed a Petition for Writ of Certiorari with the United States Supreme Court. On March 19, 2001, the United States Supreme Court denied Pizza Hut's Petition for Writ of Certiorari. For the 2000 fiscal year, we incurred an additional $1.0 million of pre-tax charges related to this issue.

19
We are also subject to claims and legal actions in the ordinary course of our business. We believe that all such claims and actions currently pending against us are either adequately covered by insurance or would not have a material adverse effect on us if decided in a manner unfavorable to us. Item 4. Submission of Matters to a Vote of Security Holders Not applicable.
20
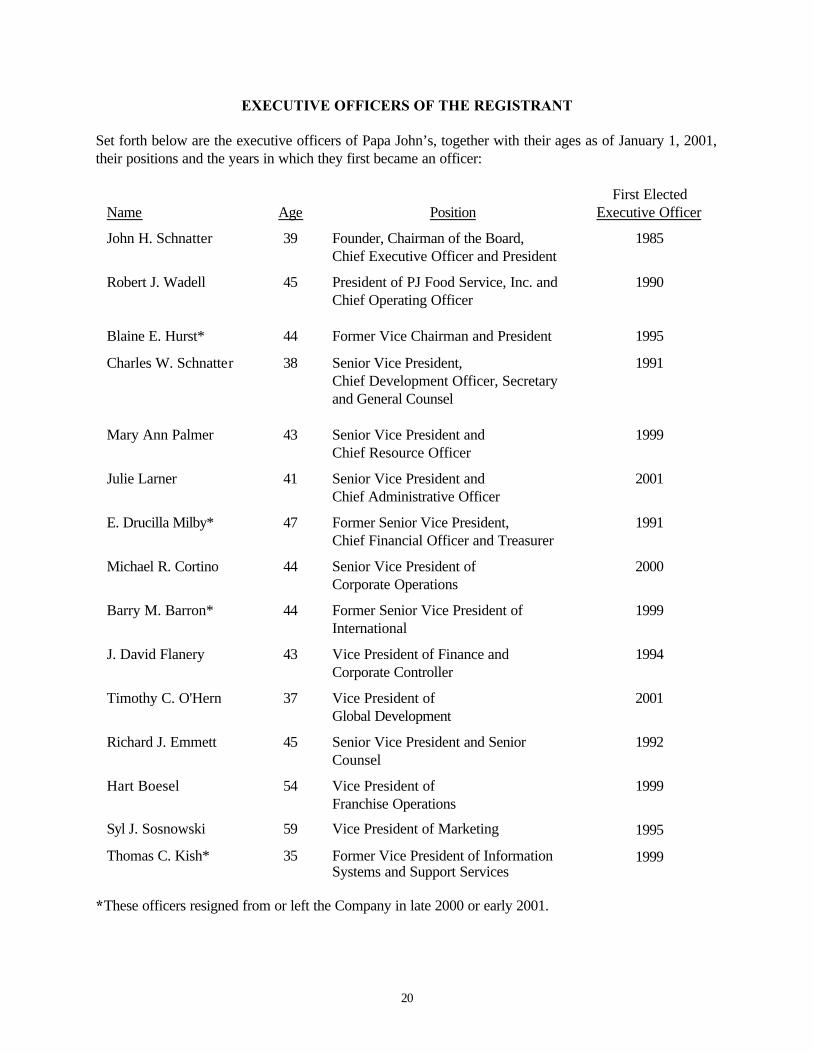
EXECUTIVE OFFICERS OF THE REGISTRANT Set forth below are the executive officers of Papa John’s, together with their ages as of January 1, 2001, their positions and the years in which they first became an officer:
Name
Age
Position
First Elected Executive Officer
John H. Schnatter 39 Founder, Chairman of the Board, Chief Executive Officer and President
1985
Robert J. Wadell 45 President of PJ Food Service, Inc. and Chief Operating Officer
1990
Blaine E. Hurst* 44 Former Vice Chairman and President 1995
Charles W. Schnatter 38 Senior Vice President, Chief Development Officer, Secretary and General Counsel
1991
Mary Ann Palmer 43 Senior Vice President and Chief Resource Officer
1999
Julie Larner 41 Senior Vice President and Chief Administrative Officer
2001
E. Drucilla Milby* 47 Former Senior Vice President, Chief Financial Officer and Treasurer
1991
Michael R. Cortino 44 Senior Vice President of Corporate Operations
2000
Barry M. Barron* 44 Former Senior Vice President of International
1999
J. David Flanery 43 Vice President of Finance and Corporate Controller
1994
Timothy C. O'Hern 37 Vice President of Global Development
2001
Richard J. Emmett 45 Senior Vice President and Senior Counsel
1992
Hart Boesel 54 Vice President of Franchise Operations
1999
Syl J. Sosnowski 59 Vice President of Marketing 1995
Thomas C. Kish* 35 Former Vice President of Information Systems and Support Services
1999
*These officers resigned from or left the Company in late 2000 or early 2001.
21
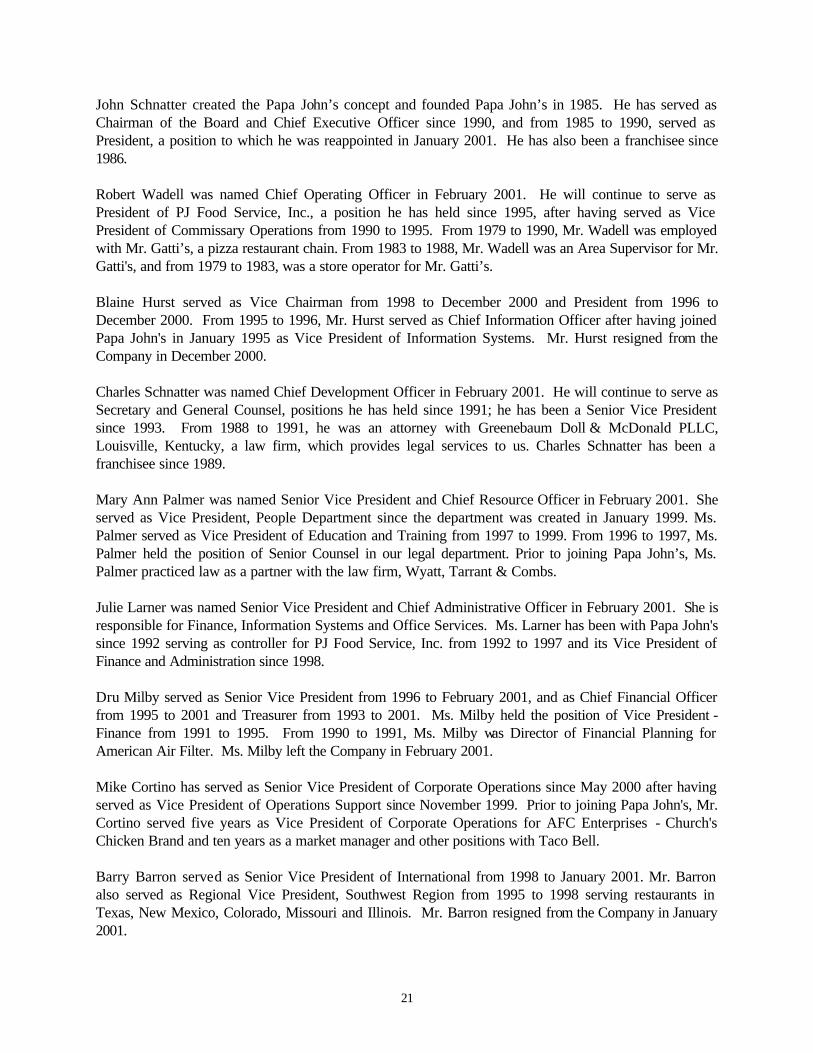
John Schnatter created the Papa John’s concept and founded Papa John’s in 1985. He has served as Chairman of the Board and Chief Executive Officer since 1990, and from 1985 to 1990, served as President, a position to which he was reappointed in January 2001. He has also been a franchisee since 1986. Robert Wadell was named Chief Operating Officer in February 2001. He will continue to serve as President of PJ Food Service, Inc., a position he has held since 1995, after having served as Vice President of Commissary Operations from 1990 to 1995. From 1979 to 1990, Mr. Wadell was employed with Mr. Gatti’s, a pizza restaurant chain. From 1983 to 1988, Mr. Wadell was an Area Supervisor for Mr. Gatti's, and from 1979 to 1983, was a store operator for Mr. Gatti’s. Blaine Hurst served as Vice Chairman from 1998 to December 2000 and President from 1996 to December 2000. From 1995 to 1996, Mr. Hurst served as Chief Information Officer after having joined Papa John's in January 1995 as Vice President of Information Systems. Mr. Hurst resigned from the Company in December 2000. Charles Schnatter was named Chief Development Officer in February 2001. He will continue to serve as Secretary and General Counsel, positions he has held since 1991; he has been a Senior Vice President since 1993. From 1988 to 1991, he was an attorney with Greenebaum Doll & McDonald PLLC, Louisville, Kentucky, a law firm, which provides legal services to us. Charles Schnatter has been a franchisee since 1989. Mary Ann Palmer was named Senior Vice President and Chief Resource Officer in February 2001. She served as Vice President, People Department since the department was created in January 1999. Ms. Palmer served as Vice President of Education and Training from 1997 to 1999. From 1996 to 1997, Ms. Palmer held the position of Senior Counsel in our legal department. Prior to joining Papa John’s, Ms. Palmer practiced law as a partner with the law firm, Wyatt, Tarrant & Combs. Julie Larner was named Senior Vice President and Chief Administrative Officer in February 2001. She is responsible for Finance, Information Systems and Office Services. Ms. Larner has been with Papa John's since 1992 serving as controller for PJ Food Service, Inc. from 1992 to 1997 and its Vice President of Finance and Administration since 1998. Dru Milby served as Senior Vice President from 1996 to February 2001, and as Chief Financial Officer from 1995 to 2001 and Treasurer from 1993 to 2001. Ms. Milby held the position of Vice President - Finance from 1991 to 1995. From 1990 to 1991, Ms. Milby was Director of Financial Planning for American Air Filter. Ms. Milby left the Company in February 2001. Mike Cortino has served as Senior Vice President of Corporate Operations since May 2000 after having served as Vice President of Operations Support since November 1999. Prior to joining Papa John's, Mr. Cortino served five years as Vice President of Corporate Operations for AFC Enterprises - Church's Chicken Brand and ten years as a market manager and other positions with Taco Bell. Barry Barron served as Senior Vice President of International from 1998 to January 2001. Mr. Barron also served as Regional Vice President, Southwest Region from 1995 to 1998 serving restaurants in Texas, New Mexico, Colorado, Missouri and Illinois. Mr. Barron resigned from the Company in January 2001.
22
David Flanery has served as Vice President of Finance since 1995 after having joined Papa John’s in 1994 as Corporate Controller. From 1979 to 1994, Mr. Flanery was with Ernst & Young LLP in a variety of positions, most recently as Audit Senior Manager. Mr. Flanery is a licensed Certified Public Accountant. Tim O'Hern was appointed Vice President of Global Development in February 2001 after having served as Vice President of U.S. Development since March 1997. From December 1996 to March 1997, Mr. O'Hern held the position of Director of Franchise Development. Mr. O'Hern joined Papa John's in November 1995 as a construction manager. Prior to joining Papa John's, Mr. O'Hern owned his own business and has been a franchisee since 1993. Richard Emmett was appointed Senior Vice President and Senior Counsel in March 1997, after having served as Senior Vice President of Development from August 1996 to March 1997. From 1992 to 1996, Mr. Emmett held the position of Vice President and Senior Counsel. From 1983 to 1992, Mr. Emmett was an attorney with the law firm of Greenebaum Doll & McDonald PLLC, having become a partner of the firm in 1989. Mr. Emmett has been a franchisee since 1992. Hart Boesel has served as Vice President of Franchise Operations since 1995. In his capacity as Vice President, Mr. Boesel serves as the primary corporate contact for the Papa John’s franchise family. Prior to joining Papa John’s, Mr. Boesel had 17 years of experience in corporate, franchise and international operations with Wendy's International, Inc. Syl Sosnowski has served as Vice President of Marketing since 1995. Mr. Sosnowski also served as Vice President of Support Services from 1997 to 1998. From 1990 to 1995, Mr. Sosnowski served as Vice President of Marketing and Sales for Carvel Corporation. Tom Kish served as Vice President, Information Systems from October 1996 to February 2001 and Vice President, Support Services, from March 1998 to February 2001. From 1995 to 1996, Mr. Kish served as Director of Store Systems. Prior to joining Papa John’s, Mr. Kish held several consulting positions, many of them with Fortune 500 companies. Mr. Kish has been a franchisee since 1998. Mr. Kish resigned from the Company in February 2001. John and Charles Schnatter are brothers. There are no other family relationships among the executive officers and other key personnel.
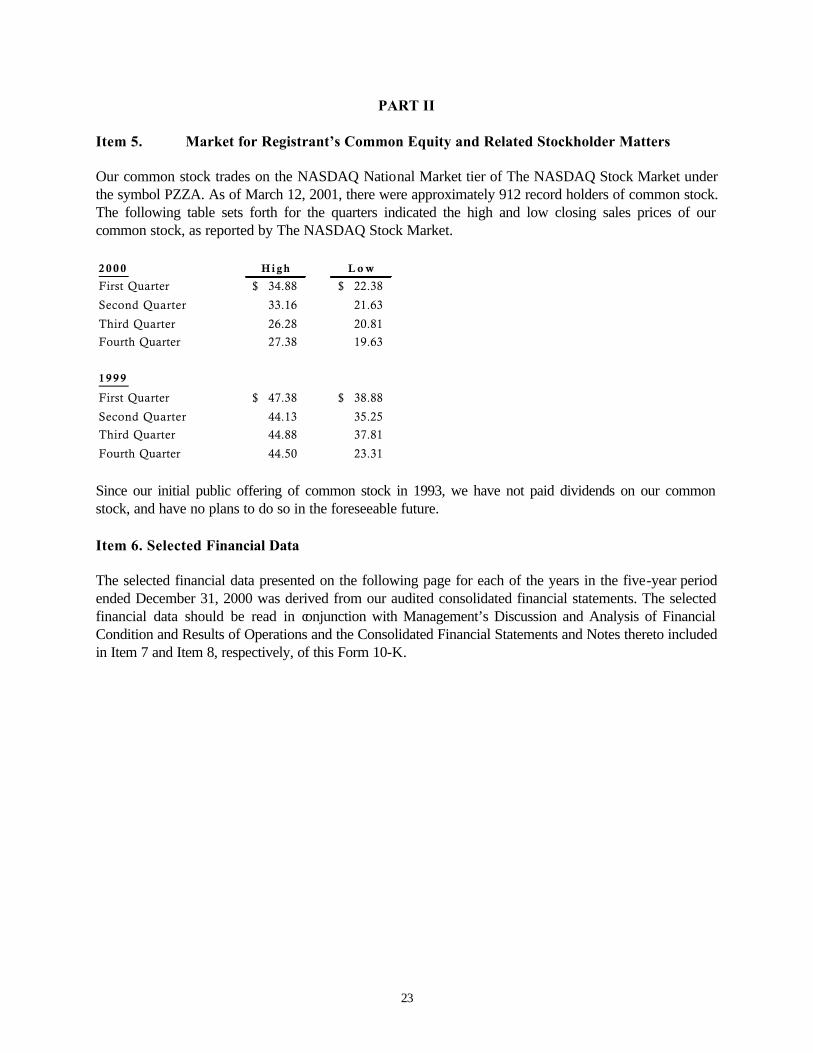
23
PART II Item 5. Market for Registrant’s Common Equity and Related Stockholder Matters Our common stock trades on the NASDAQ National Market tier of The NASDAQ Stock Market under the symbol PZZA. As of March 12, 2001, there were approximately 912 record holders of common stock. The following table sets forth for the quarters indicated the high and low closing sales prices of our common stock, as reported by The NASDAQ Stock Market. 2 0 0 0 H i g h L o w
First Quarter 34.88$ 22.38$
Second Quarter 33.16 21.63
Third Quarter 26.28 20.81
Fourth Quarter 27.38 19.63
1 9 9 9
First Quarter 47.38$ 38.88$
Second Quarter 44.13 35.25
Third Quarter 44.88 37.81
Fourth Quarter 44.50 23.31
Since our initial public offering of common stock in 1993, we have not paid dividends on our common stock, and have no plans to do so in the foreseeable future. Item 6. Selected Financial Data The selected financial data presented on the following page for each of the years in the five-year period ended December 31, 2000 was derived from our audited consolidated financial statements. The selected financial data should be read in conjunction with Management’s Discussion and Analysis of Financial Condition and Results of Operations and the Consolidated Financial Statements and Notes thereto included in Item 7 and Item 8, respectively, of this Form 10-K.
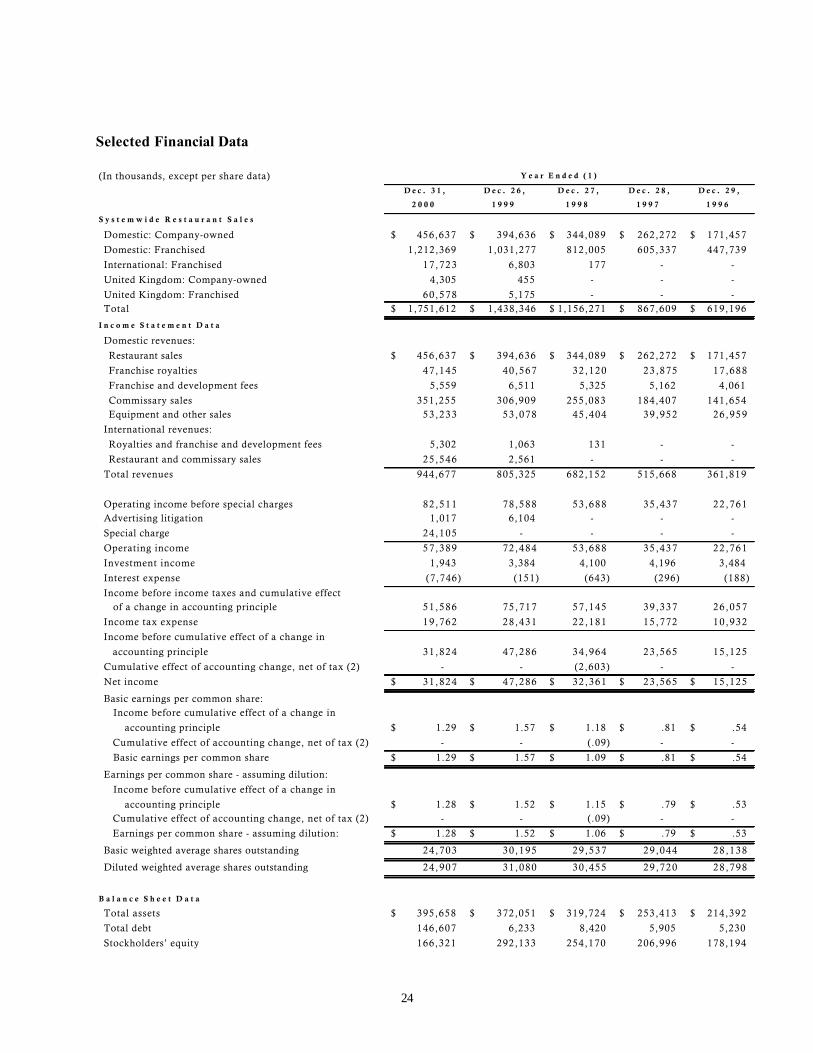
24
Selected Financial Data
(In thousands, except per share data) Y e a r E n d e d ( 1 )
D e c . 3 1 , D e c . 2 6 , D e c . 2 7 , D e c . 2 8 , D e c . 2 9 ,
2 0 0 0 1 9 9 9 1 9 9 8 1 9 9 7 1 9 9 6
S y s t e m w i d e R e s t a u r a n t S a l e s
Domestic: Company-owned 456,637$ 394,636$ 344,089$ 262,272$ 171,457$
Domestic: Franchised 1,212,369 1,031,277 812,005 605,337 447,739
International: Franchised 17,723 6,803 177 - -
United Kingdom: Company-owned 4,305 455 - - -
United Kingdom: Franchised 60,578 5,175 - - - Total 1,751,612$ 1,438,346$ 1,156,271$ 867,609$ 619,196$
I n c o m e S t a t e m e n t D a t a
Domestic revenues:
Restaurant sales 456,637$ 394,636$ 344,089$ 262,272$ 171,457$
Franchise royalties 47,145 40 ,567 32 ,120 23 ,875 17 ,688
Franchise and development fees 5,559 6,511 5,325 5,162 4,061
Commissary sales 351,255 306,909 255,083 184,407 141,654 Equipment and other sales 53,233 53 ,078 45 ,404 39 ,952 26 ,959
International revenues:
Royalties and franchise and development fees 5,302 1,063 131 - -
Restaurant and commissary sales 25,546 2,561 - - -
Total revenues 944,677 805,325 682,152 515,668 361,819
Operating income before special charges 82,511 78 ,588 53 ,688 35 ,437 22 ,761 Advertising litigation 1,017 6,104 - - -
Special charge 24,105 - - - -
Operating income 57,389 72 ,484 53 ,688 35 ,437 22 ,761
Investment income 1,943 3,384 4,100 4,196 3,484
Interest expense (7,746) (151) (643) (296) (188)
Income before income taxes and cumulative effect of a change in accounting principle 51,586 75 ,717 57 ,145 39 ,337 26 ,057
Income tax expense 19,762 28,431 22,181 15,772 10,932
Income before cumulative effect of a change in
accounting principle 31,824 47 ,286 34 ,964 23 ,565 15 ,125
Cumulative effect of accounting change, net of tax (2) - - (2,603) - -
Net income 31,824$ 47 ,286$ 32 ,361$ 23 ,565$ 15 ,125$
Basic earnings per common share: Income before cumulative effect of a change in
accounting principle 1.29$ 1.57$ 1.18$ .81$ .54$
Cumulative effect of accounting change, net of tax (2) - - (.09) - -
Basic earnings per common share 1.29$ 1.57$ 1.09$ .81$ .54$
Earnings per common share - assuming dilution:
Income before cumulative effect of a change in
accounting principle 1.28$ 1.52$ 1.15$ .79$ .53$ Cumulative effect of accounting change, net of tax (2) - - (.09) - -
Earnings per common share - assuming dilution: 1.28$ 1.52$ 1.06$ .79$ .53$
Basic weighted average shares outstanding 24,703 30 ,195 29 ,537 29 ,044 28 ,138
Diluted weighted average shares outstanding 24,907 31 ,080 30 ,455 29 ,720 28 ,798
B a l a n c e S h e e t D a t a
Total assets 395,658$ 372,051$ 319,724$ 253,413$ 214,392$
Total debt 146,607 6,233 8,420 5,905 5,230
Stockholders’ equity 166,321 292,133 254,170 206,996 178,194
25
(1) We operate on a 52-53 week fiscal year ending on the last Sunday of December of each year. The 2000 fiscal year consisted of 53 weeks, and the 1999, 1998, 1997 and 1996 fiscal years consisted of 52 weeks. (2) Reflects the cumulative effect on income and earnings per share of a change in accounting principle, net of tax, as required by Statement of Position 98-5 “Reporting the Costs of Start-Up Activities” (see “Note 2” of “Notes to Consolidated Financial Statements”). Item 7. Management’s Discussion and Analysis of Financial Condition and Results of Operations Introduction Papa John’s International, Inc. (referred to as the "Company,” “Papa John’s” or in the first person notations of “we,” “us” and “our”) began operations in 1985 with the opening of the first Papa John’s restaurant in Jeffersonville, Indiana. At December 31, 2000, there were 2,612 Papa John’s restaurants in operation, consisting of 641 Company-owned and 1,971 franchised, and 205 Perfect Pizza restaurants in the United Kingdom (consisting of 3 Company-owned and 202 franchised). Our revenues are principally derived from retail sales of pizza to the general public by Company-owned restaurants, franchise royalties, sales of franchise and development rights, sales to franchisees of food and paper products, restaurant equipment, printing and promotional items, risk management services, and information systems and related services used in their operations.
We intend to continue to expand the number of Company-owned and franchised restaurants. Our expansion strategy is to cluster restaurants in targeted markets, thereby increasing consumer awareness and enabling us to take advantage of operational, distribution and advertising efficiencies. We believe that our expansion strategy has contributed to increases in comparable annual sales for Company-owned restaurants of 3.0% in 2000, 3.5% in 1999, and 9.0% in 1998. Average sales for the Company’s most recent comparable base restaurants increased to $782,000 for 2000, based on a 53-week year, from $754,000 for 1999 and $750,000 in 1998 (based on 52-week years). This increase is attributable to continuing strong sales of maturing restaurants. Average sales volumes in new markets are generally lower than in those markets in which we have established a significant market position. Approximately 45% of our revenues for 2000 and 1999 were derived from the sale to franchisees of food and paper products, restaurant equipment, printing and promotional items, risk management services and information systems equipment and software and related services by us, our commissary subsidiary, PJ Food Service, Inc., our support services subsidiary, Papa John’s Support Services, Inc. and Perfect Pizza. We believe that, in addition to supporting both Company and franchised growth, these subsidiaries contribute to product quality and consistency throughout the Papa John’s system. We continually strive to obtain high-quality sites with good access and visibility, and to enhance the appearance and quality of our restaurants. We believe that these factors improve our image and brand awareness. The average cash investment for the 42 domestic Company-owned restaurants opened during 2000, exclusive of land, increased to approximately $268,000 from $224,000 for the 36 units opened in 1999. We expect the average cash investment for restaurants opening in 2001 to be approximately $272,000.

26
Our fiscal year ends on the last Sunday in December of each year. Our 2000 fiscal year consists of 53 weeks, and all other fiscal years presented consist of 52 weeks.
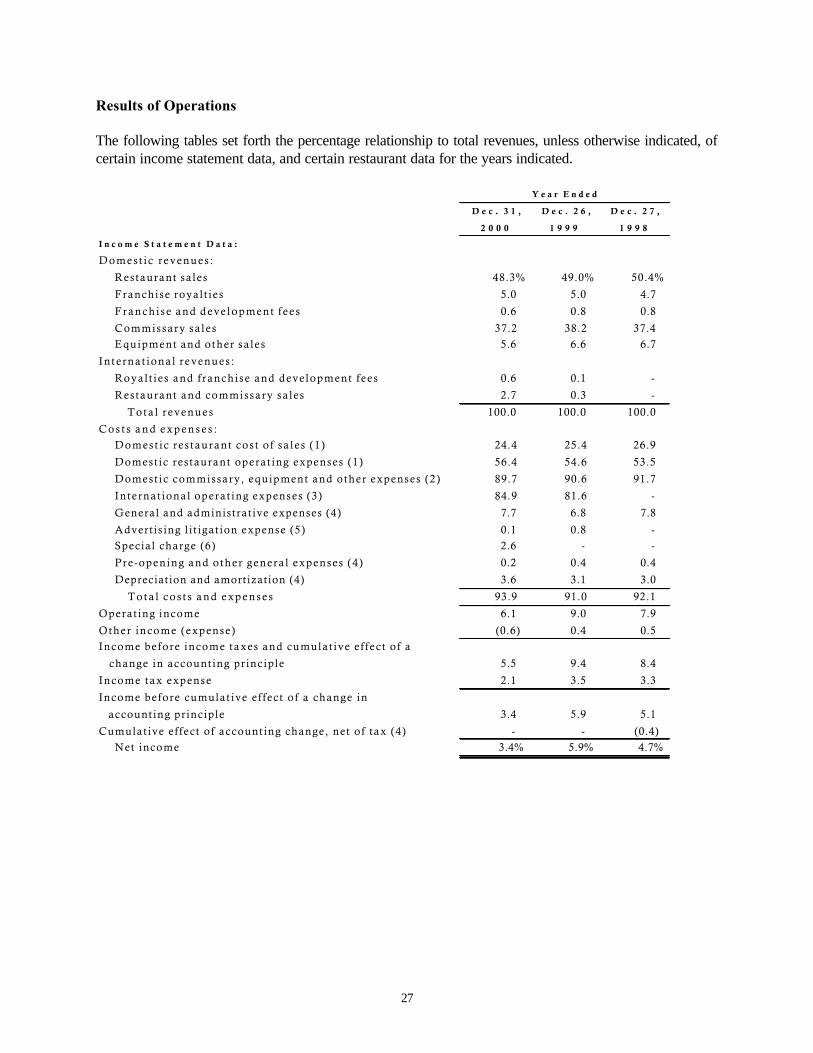
27
Results of Operations The following tables set forth the percentage relationship to total revenues, unless otherwise indicated, of certain income statement data, and certain restaurant data for the years indicated.
Y e a r E n d e d
D e c . 3 1 , D e c . 2 6 , D e c . 2 7 ,
2 0 0 0 1 9 9 9 1 9 9 8
I n c o m e S t a t e m e n t D a t a :
Domes t i c r evenues :
Res taurant sa les 48.3% 49.0% 50.4%
Franchise royal t ies 5.0 5.0 4.7
F ranch i se and deve lopment f ee s 0.6 0.8 0.8
Commissary sa les 37.2 38.2 37.4 Equipment and other sa les 5.6 6.6 6.7
In te rna t iona l r evenues :
Royal t i e s and f ranchise and deve lopment fees 0.6 0.1 -
Res taurant and commissary sa les 2.7 0.3 -
T o t a l r e v e n u e s 100.0 100.0 100.0
C o s t s a n d e x p e n s e s : Domes t i c r e s taurant cos t o f sa le s (1 ) 24.4 25.4 26.9
Domest ic res taurant operat ing expenses (1 ) 56.4 54.6 53.5
Domest ic commissary , equipment and other expenses (2 ) 89.7 90.6 91.7
In ternat ional opera t ing expenses (3 ) 84.9 81.6 -
General and administrat ive expenses (4) 7.7 6.8 7.8
Advert i s ing l i t igat ion expense (5) 0.1 0.8 - Special charge (6) 2.6 - -
Pre -opening and o ther genera l expenses (4 ) 0.2 0.4 0.4
Depreciation and amortization (4) 3.6 3.1 3.0
T o t a l c o s t s a n d e x p e n s e s 93.9 91.0 92.1
Operat ing income 6.1 9.0 7.9
Other income (expense) (0.6) 0.4 0.5 Income before income taxes and cumulat ive e f fec t o f a
change in account ing pr inciple 5.5 9.4 8.4
Income tax expense 2.1 3.5 3.3
Income before cumulat ive e f fec t o f a change in
account ing pr inciple 3.4 5.9 5.1
Cumulat ive e f fect of account ing change, net of tax (4) - - (0.4) Net income 3.4% 5.9% 4.7%
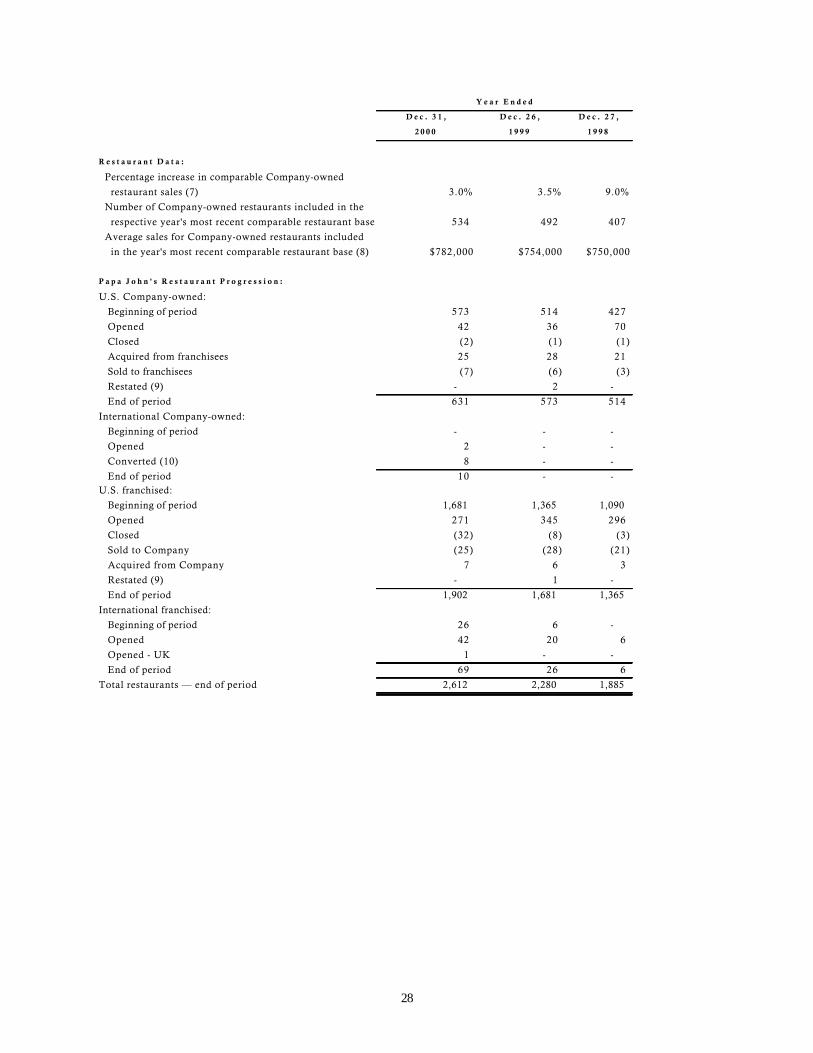
28
Y e a r E n d e d
D e c . 3 1 , D e c . 2 6 , D e c . 2 7 ,
2 0 0 0 1 9 9 9 1 9 9 8
R e s t a u r a n t D a t a :
Percentage increase in comparable Company-owned
restaurant sales (7) 3.0% 3.5% 9.0%
Number of Company-owned restaurants included in the
respective year's most recent comparable restaurant base 534 492 407
Average sales for Company-owned restaurants included
in the year's most recent comparable restaurant base (8) $782,000 $754,000 $750,000
P a p a J o h n ' s R e s t a u r a n t P r o g r e s s i o n :
U.S. Company-owned:
Beginning of period 573 514 427
Opened 42 36 70
Closed (2) (1) (1)
Acquired from franchisees 25 28 21
Sold to franchisees (7) (6) (3)
Restated (9) - 2 -
End of period 631 573 514
International Company-owned:
Beginning of period - - -
Opened 2 - -
Converted (10) 8 - -
End of period 10 - - U.S. franchised:
Beginning of period 1,681 1,365 1,090
Opened 271 345 296
Closed (32) (8) (3)
Sold to Company (25) (28) (21)
Acquired from Company 7 6 3
Restated (9) - 1 -
End of period 1,902 1,681 1,365
International franchised:
Beginning of period 26 6 -
Opened 42 20 6
Opened - UK 1 - -
End of period 69 26 6
Total restaurants — end of period 2,612 2,280 1,885
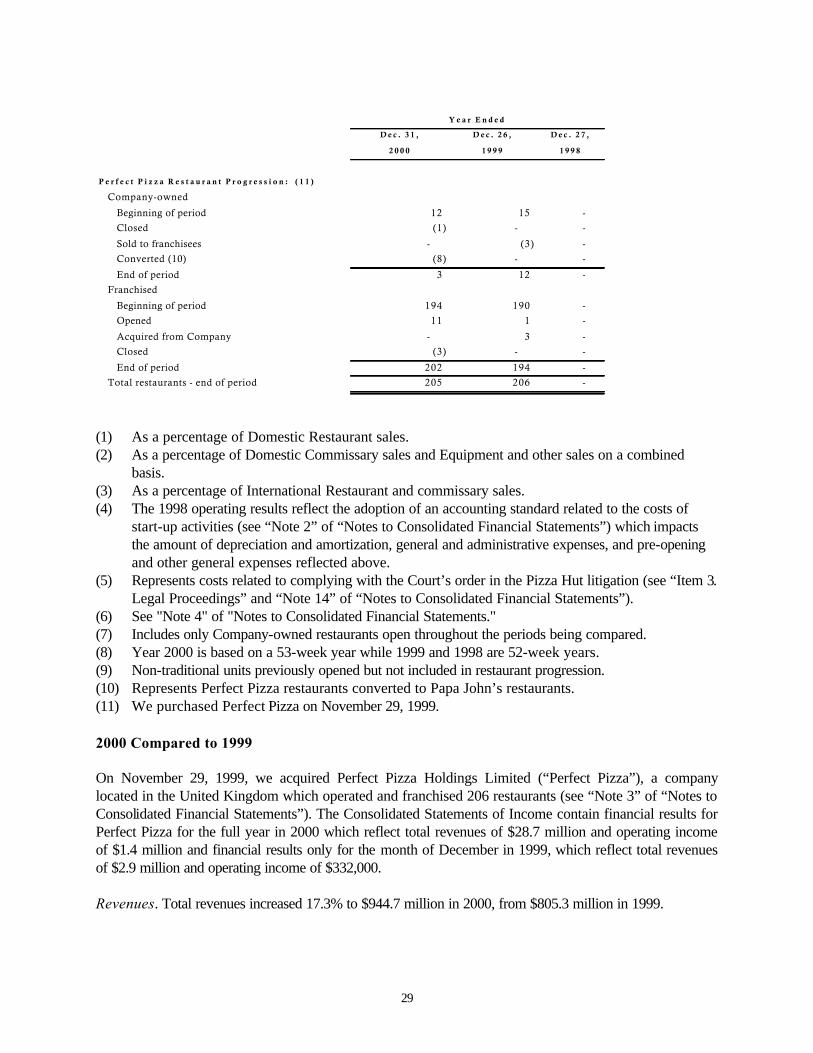
29
Y e a r E n d e d
D e c . 3 1 , D e c . 2 6 , D e c . 2 7 ,
2 0 0 0 1 9 9 9 1 9 9 8
P e r f e c t P i z z a R e s t a u r a n t P r o g r e s s i o n : ( 1 1 )
Company-owned
Number of restaurants at November 29, 1999 date of acquisition Beginning of period 12 15 -
Closed (1) - -
Sold to franchisees - (3) -
Converted (10) (8) - -
End of period 3 12 -
Franchised
Sold to franchisees Beginning of period 194 190 -
Opened 11 1 -
Acquired from Company - 3 -
Closed (3) - -
End of period End of period 202 194 -
Total restaurants - end of period 205 206 -
(1) As a percentage of Domestic Restaurant sales. (2) As a percentage of Domestic Commissary sales and Equipment and other sales on a combined
basis. (3) As a percentage of International Restaurant and commissary sales. (4) The 1998 operating results reflect the adoption of an accounting standard related to the costs of
start-up activities (see “Note 2” of “Notes to Consolidated Financial Statements”) which impacts the amount of depreciation and amortization, general and administrative expenses, and pre-opening and other general expenses reflected above.
(5) Represents costs related to complying with the Court’s order in the Pizza Hut litigation (see “Item 3. Legal Proceedings” and “Note 14” of “Notes to Consolidated Financial Statements”).
(6) See "Note 4" of "Notes to Consolidated Financial Statements." (7) Includes only Company-owned restaurants open throughout the periods being compared. (8) Year 2000 is based on a 53-week year while 1999 and 1998 are 52-week years. (9) Non-traditional units previously opened but not included in restaurant progression. (10) Represents Perfect Pizza restaurants converted to Papa John’s restaurants. (11) We purchased Perfect Pizza on November 29, 1999. 2000 Compared to 1999 On November 29, 1999, we acquired Perfect Pizza Holdings Limited (“Perfect Pizza”), a company located in the United Kingdom which operated and franchised 206 restaurants (see “Note 3” of “Notes to Consolidated Financial Statements”). The Consolidated Statements of Income contain financial results for Perfect Pizza for the full year in 2000 which reflect total revenues of $28.7 million and operating income of $1.4 million and financial results only for the month of December in 1999, which reflect total revenues of $2.9 million and operating income of $332,000. Revenues. Total revenues increased 17.3% to $944.7 million in 2000, from $805.3 million in 1999.
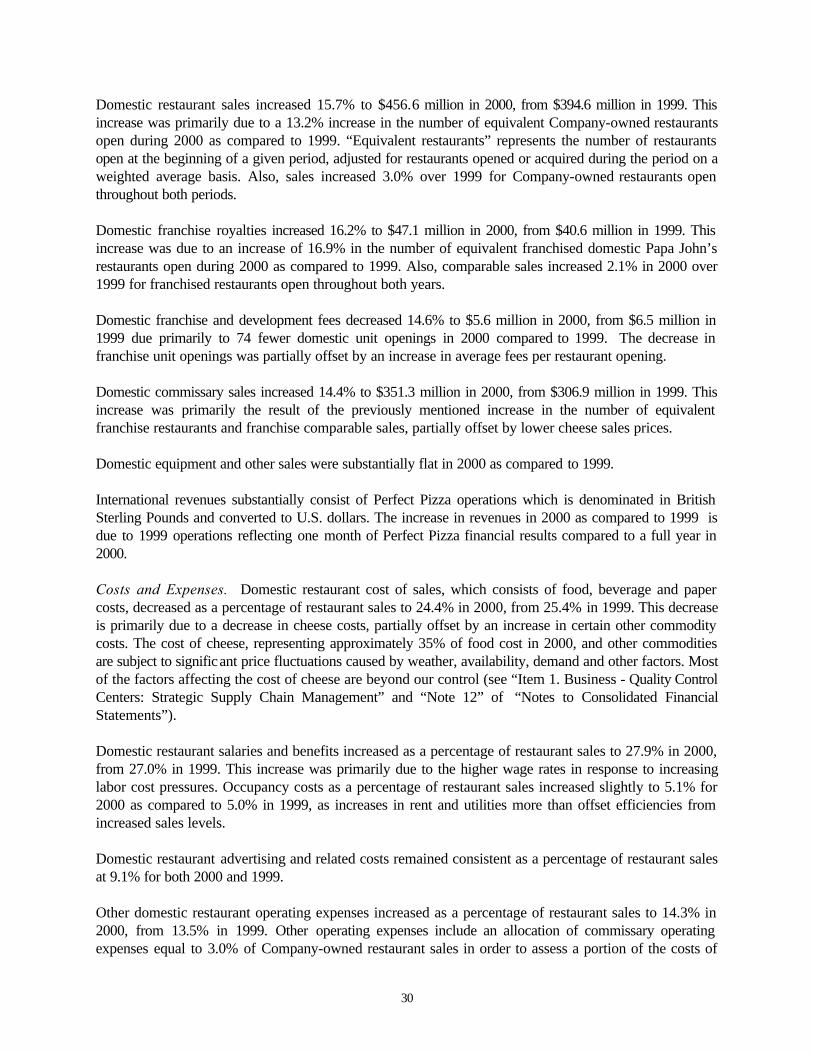
30
Domestic restaurant sales increased 15.7% to $456.6 million in 2000, from $394.6 million in 1999. This increase was primarily due to a 13.2% increase in the number of equivalent Company-owned restaurants open during 2000 as compared to 1999. “Equivalent restaurants” represents the number of restaurants open at the beginning of a given period, adjusted for restaurants opened or acquired during the period on a weighted average basis. Also, sales increased 3.0% over 1999 for Company-owned restaurants open throughout both periods. Domestic franchise royalties increased 16.2% to $47.1 million in 2000, from $40.6 million in 1999. This increase was due to an increase of 16.9% in the number of equivalent franchised domestic Papa John’s restaurants open during 2000 as compared to 1999. Also, comparable sales increased 2.1% in 2000 over 1999 for franchised restaurants open throughout both years. Domestic franchise and development fees decreased 14.6% to $5.6 million in 2000, from $6.5 million in 1999 due primarily to 74 fewer domestic unit openings in 2000 compared to 1999. The decrease in franchise unit openings was partially offset by an increase in average fees per restaurant opening. Domestic commissary sales increased 14.4% to $351.3 million in 2000, from $306.9 million in 1999. This increase was primarily the result of the previously mentioned increase in the number of equivalent franchise restaurants and franchise comparable sales, partially offset by lower cheese sales prices. Domestic equipment and other sales were substantially flat in 2000 as compared to 1999. International revenues substantially consist of Perfect Pizza operations which is denominated in British Sterling Pounds and converted to U.S. dollars. The increase in revenues in 2000 as compared to 1999 is due to 1999 operations reflecting one month of Perfect Pizza financial results compared to a full year in 2000. Costs and Expenses. Domestic restaurant cost of sales, which consists of food, beverage and paper costs, decreased as a percentage of restaurant sales to 24.4% in 2000, from 25.4% in 1999. This decrease is primarily due to a decrease in cheese costs, partially offset by an increase in certain other commodity costs. The cost of cheese, representing approximately 35% of food cost in 2000, and other commodities are subject to significant price fluctuations caused by weather, availability, demand and other factors. Most of the factors affecting the cost of cheese are beyond our control (see “Item 1. Business - Quality Control Centers: Strategic Supply Chain Management” and “Note 12” of “Notes to Consolidated Financial Statements”). Domestic restaurant salaries and benefits increased as a percentage of restaurant sales to 27.9% in 2000, from 27.0% in 1999. This increase was primarily due to the higher wage rates in response to increasing labor cost pressures. Occupancy costs as a percentage of restaurant sales increased slightly to 5.1% for 2000 as compared to 5.0% in 1999, as increases in rent and utilities more than offset efficiencies from increased sales levels. Domestic restaurant advertising and related costs remained consistent as a percentage of restaurant sales at 9.1% for both 2000 and 1999. Other domestic restaurant operating expenses increased as a percentage of restaurant sales to 14.3% in 2000, from 13.5% in 1999. Other operating expenses include an allocation of commissary operating expenses equal to 3.0% of Company-owned restaurant sales in order to assess a portion of the costs of
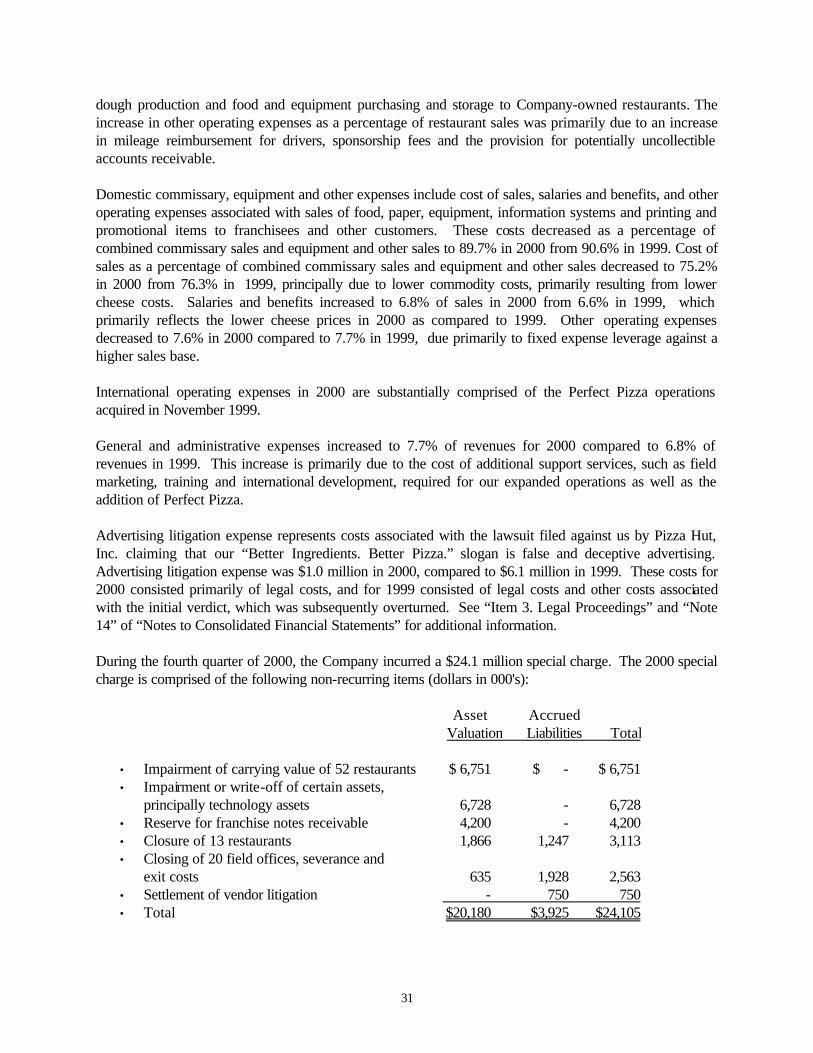
31
dough production and food and equipment purchasing and storage to Company-owned restaurants. The increase in other operating expenses as a percentage of restaurant sales was primarily due to an increase in mileage reimbursement for drivers, sponsorship fees and the provision for potentially uncollectible accounts receivable. Domestic commissary, equipment and other expenses include cost of sales, salaries and benefits, and other operating expenses associated with sales of food, paper, equipment, information systems and printing and promotional items to franchisees and other customers. These costs decreased as a percentage of combined commissary sales and equipment and other sales to 89.7% in 2000 from 90.6% in 1999. Cost of sales as a percentage of combined commissary sales and equipment and other sales decreased to 75.2% in 2000 from 76.3% in 1999, principally due to lower commodity costs, primarily resulting from lower cheese costs. Salaries and benefits increased to 6.8% of sales in 2000 from 6.6% in 1999, which primarily reflects the lower cheese prices in 2000 as compared to 1999. Other operating expenses decreased to 7.6% in 2000 compared to 7.7% in 1999, due primarily to fixed expense leverage against a higher sales base. International operating expenses in 2000 are substantially comprised of the Perfect Pizza operations acquired in November 1999. General and administrative expenses increased to 7.7% of revenues for 2000 compared to 6.8% of revenues in 1999. This increase is primarily due to the cost of additional support services, such as field marketing, training and international development, required for our expanded operations as well as the addition of Perfect Pizza. Advertising litigation expense represents costs associated with the lawsuit filed against us by Pizza Hut, Inc. claiming that our “Better Ingredients. Better Pizza.” slogan is false and deceptive advertising. Advertising litigation expense was $1.0 million in 2000, compared to $6.1 million in 1999. These costs for 2000 consisted primarily of legal costs, and for 1999 consisted of legal costs and other costs associated with the initial verdict, which was subsequently overturned. See “Item 3. Legal Proceedings” and “Note 14” of “Notes to Consolidated Financial Statements” for additional information. During the fourth quarter of 2000, the Company incurred a $24.1 million special charge. The 2000 special charge is comprised of the following non-recurring items (dollars in 000's): Asset Accrued Valuation Liabilities Total
• Impairment of carrying value of 52 restaurants $ 6,751 $ - $ 6,751 • Impairment or write-off of certain assets, principally technology assets 6,728 - 6,728 • Reserve for franchise notes receivable 4,200 - 4,200 • Closure of 13 restaurants 1,866 1,247 3,113 • Closing of 20 field offices, severance and exit costs 635 1,928 2,563 • Settlement of vendor litigation - 750 750 • Total $20,180 $3,925 $24,105
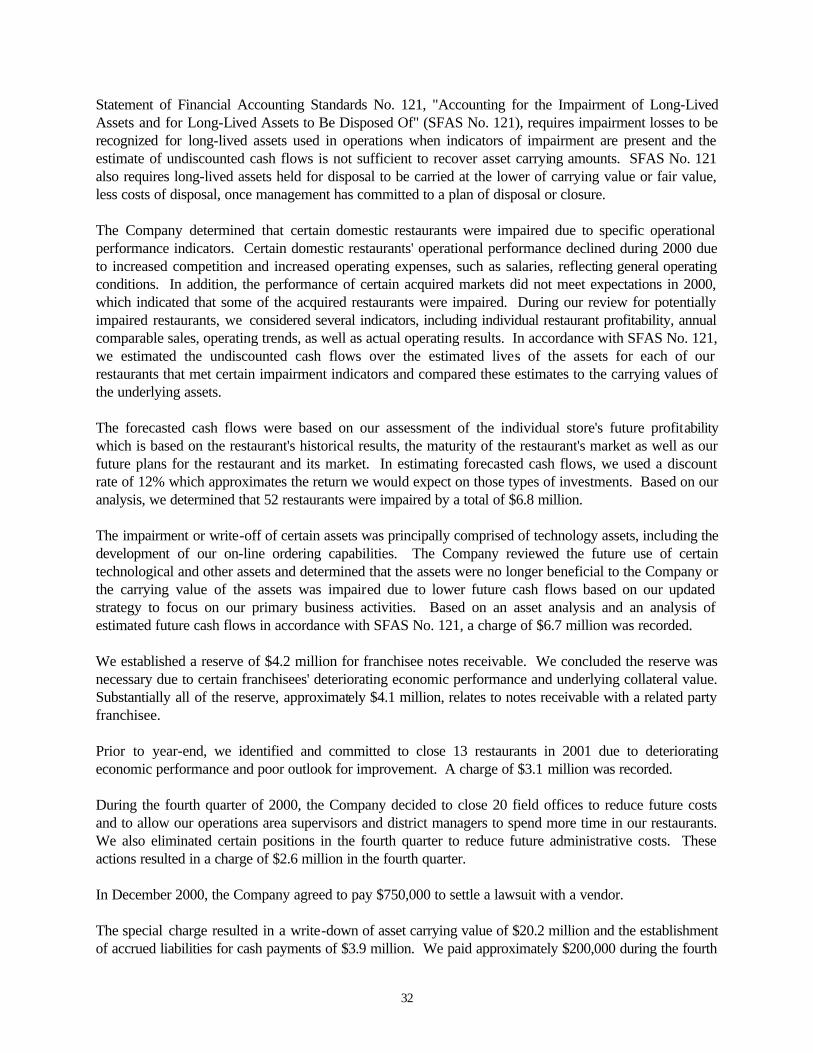
32
Statement of Financial Accounting Standards No. 121, "Accounting for the Impairment of Long-Lived Assets and for Long-Lived Assets to Be Disposed Of" (SFAS No. 121), requires impairment losses to be recognized for long-lived assets used in operations when indicators of impairment are present and the estimate of undiscounted cash flows is not sufficient to recover asset carrying amounts. SFAS No. 121 also requires long-lived assets held for disposal to be carried at the lower of carrying value or fair value, less costs of disposal, once management has committed to a plan of disposal or closure. The Company determined that certain domestic restaurants were impaired due to specific operational performance indicators. Certain domestic restaurants' operational performance declined during 2000 due to increased competition and increased operating expenses, such as salaries, reflecting general operating conditions. In addition, the performance of certain acquired markets did not meet expectations in 2000, which indicated that some of the acquired restaurants were impaired. During our review for potentially impaired restaurants, we considered several indicators, including individual restaurant profitability, annual comparable sales, operating trends, as well as actual operating results. In accordance with SFAS No. 121, we estimated the undiscounted cash flows over the estimated lives of the assets for each of our restaurants that met certain impairment indicators and compared these estimates to the carrying values of the underlying assets. The forecasted cash flows were based on our assessment of the individual store's future profitability which is based on the restaurant's historical results, the maturity of the restaurant's market as well as our future plans for the restaurant and its market. In estimating forecasted cash flows, we used a discount rate of 12% which approximates the return we would expect on those types of investments. Based on our analysis, we determined that 52 restaurants were impaired by a total of $6.8 million. The impairment or write-off of certain assets was principally comprised of technology assets, including the development of our on-line ordering capabilities. The Company reviewed the future use of certain technological and other assets and determined that the assets were no longer beneficial to the Company or the carrying value of the assets was impaired due to lower future cash flows based on our updated strategy to focus on our primary business activities. Based on an asset analysis and an analysis of estimated future cash flows in accordance with SFAS No. 121, a charge of $6.7 million was recorded. We established a reserve of $4.2 million for franchisee notes receivable. We concluded the reserve was necessary due to certain franchisees' deteriorating economic performance and underlying collateral value. Substantially all of the reserve, approximately $4.1 million, relates to notes receivable with a related party franchisee. Prior to year-end, we identified and committed to close 13 restaurants in 2001 due to deteriorating economic performance and poor outlook for improvement. A charge of $3.1 million was recorded. During the fourth quarter of 2000, the Company decided to close 20 field offices to reduce future costs and to allow our operations area supervisors and district managers to spend more time in our restaurants. We also eliminated certain positions in the fourth quarter to reduce future administrative costs. These actions resulted in a charge of $2.6 million in the fourth quarter. In December 2000, the Company agreed to pay $750,000 to settle a lawsuit with a vendor. The special charge resulted in a write-down of asset carrying value of $20.2 million and the establishment of accrued liabilities for cash payments of $3.9 million. We paid approximately $200,000 during the fourth
33
quarter 2000 related to these liabilities. We anticipate paying a majority of the remaining liabilities associated with this special charge during 2001. The payments are expected to be made from operating cash flow. The impairment of the restaurant and other corporate assets in 2000 will reduce deprecia tion and amortization in 2001 approximately $2.1 million as compared to 2000. The closing of the 20 field offices and the severance and exit costs will reduce salaries and operating expenses approximately $900,000 in 2001 as compared to 2000. Pre-opening and other general expenses decreased to $2.2 million in 2000 from $3.4 million in 1999. Pre-opening costs of $1.1 million, relocation costs of $1.3 million and net gains on restaurant and other asset dispositions of $200,000 were included in the 2000 amount, as compared to pre-opening costs of $759,000, relocation costs of $1.3 million and net losses on restaurant and other asset dispositions of $1.4 million in 1999. Depreciation and amortization was 3.6% of revenues in 2000 compared to 3.1% for 1999, due primarily to a full year of depreciation on the corporate headquarters facility, a full year of goodwill amortization on the Perfect Pizza acquisition in 2000 as compared to only a partial year impact of each of these items in 1999, as well as the goodwill amortization related to restaurants purchased during 2000. The purchase of Perfect Pizza in November 1999 resulted in $30.9 million of goodwill. Total goodwill amortization for the Company was $2.6 million in 2000 compared to $1.1 million in 1999. Net Interest. Net interest expense was $5.8 million in 2000 compared to net interest income of $3.2 million in 1999, due to the cash used and debt incurred to fund the stock repurchase program. Income Tax Expense. The effective income tax rate increased to 38.3% in 2000 compared to 37.6% for 1999, due primarily to the sale of certain tax-exempt investments during the fourth quarter of 1999 to fund the Perfect Pizza acquisition and to begin funding of the stock repurchase program. Operating Income and Earnings Per Common Share. Operating income in 2000 was $57.4 million, or 6.1% of total revenues, as compared to $72.5 million or 9.0% of total revenues. Excluding the special charge in 2000 and the advertising litigation expense in both years, operating income in 2000 was $82.5 million, or 8.7% of total revenues, compared to $78.6 million, or 9.8% of total revenues, in 1999. The decline in 2000 operating income as a percentage of sales as compared to 1999 was principally due to a decrease in the restaurant operating margin and the previously mentioned increase in general and administrative expenses. Diluted earnings per share in 2000 was $1.28 compared to $1.52 in 1999. Excluding the special charge and advertising litigation, diluted earnings per share in 2000 was $1.90 compared to $1.64 in 1999. In December 1999, the Company began a repurchase program of its common stock. Through December 31, 2000, a total of 7.6 million shares were repurchased under this program. The repurchase of the Company's common shares resulted in a $0.11 increase in the diluted earnings per share for 2000 as compared to 1999. 1999 Compared to 1998 Revenues. Total revenues increased 18.1% to $805.3 million in 1999, from $682.2 million in 1998.
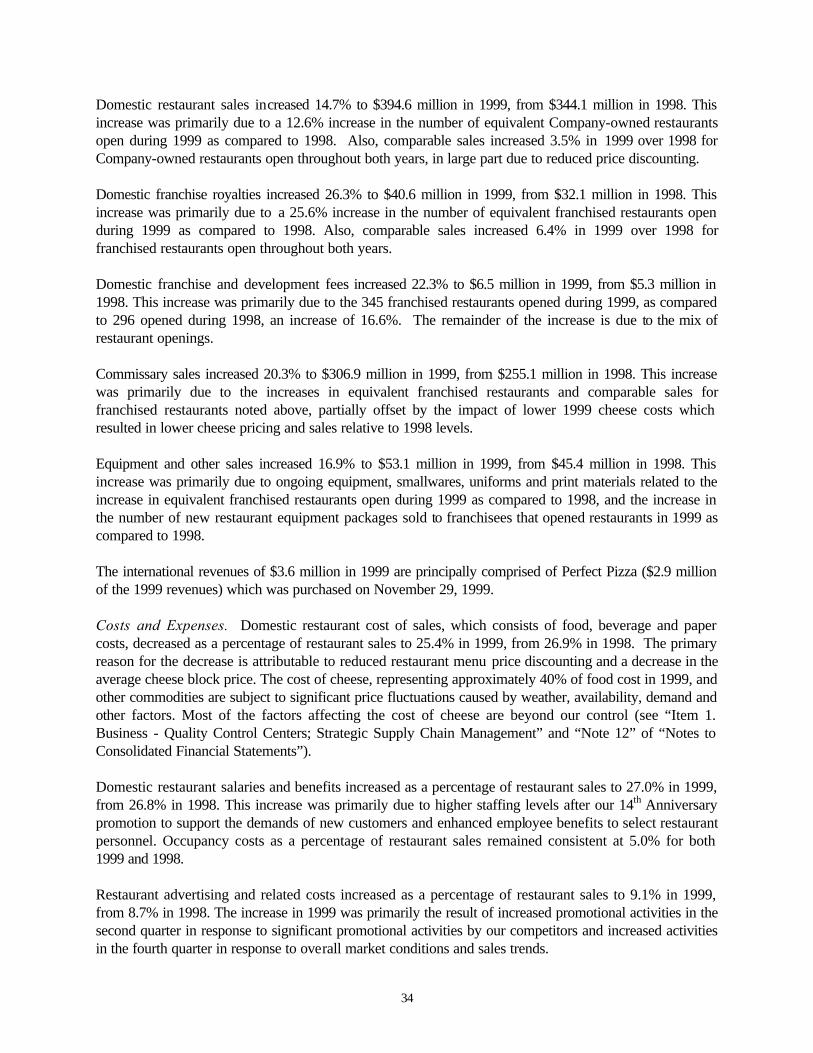
34
Domestic restaurant sales increased 14.7% to $394.6 million in 1999, from $344.1 million in 1998. This increase was primarily due to a 12.6% increase in the number of equivalent Company-owned restaurants open during 1999 as compared to 1998. Also, comparable sales increased 3.5% in 1999 over 1998 for Company-owned restaurants open throughout both years, in large part due to reduced price discounting. Domestic franchise royalties increased 26.3% to $40.6 million in 1999, from $32.1 million in 1998. This increase was primarily due to a 25.6% increase in the number of equivalent franchised restaurants open during 1999 as compared to 1998. Also, comparable sales increased 6.4% in 1999 over 1998 for franchised restaurants open throughout both years. Domestic franchise and development fees increased 22.3% to $6.5 million in 1999, from $5.3 million in 1998. This increase was primarily due to the 345 franchised restaurants opened during 1999, as compared to 296 opened during 1998, an increase of 16.6%. The remainder of the increase is due to the mix of restaurant openings. Commissary sales increased 20.3% to $306.9 million in 1999, from $255.1 million in 1998. This increase was primarily due to the increases in equivalent franchised restaurants and comparable sales for franchised restaurants noted above, partially offset by the impact of lower 1999 cheese costs which resulted in lower cheese pricing and sales relative to 1998 levels. Equipment and other sales increased 16.9% to $53.1 million in 1999, from $45.4 million in 1998. This increase was primarily due to ongoing equipment, smallwares, uniforms and print materials related to the increase in equivalent franchised restaurants open during 1999 as compared to 1998, and the increase in the number of new restaurant equipment packages sold to franchisees that opened restaurants in 1999 as compared to 1998. The international revenues of $3.6 million in 1999 are principally comprised of Perfect Pizza ($2.9 million of the 1999 revenues) which was purchased on November 29, 1999. Costs and Expenses. Domestic restaurant cost of sales, which consists of food, beverage and paper costs, decreased as a percentage of restaurant sales to 25.4% in 1999, from 26.9% in 1998. The primary reason for the decrease is attributable to reduced restaurant menu price discounting and a decrease in the average cheese block price. The cost of cheese, representing approximately 40% of food cost in 1999, and other commodities are subject to significant price fluctuations caused by weather, availability, demand and other factors. Most of the factors affecting the cost of cheese are beyond our control (see “Item 1. Business - Quality Control Centers; Strategic Supply Chain Management” and “Note 12” of “Notes to Consolidated Financial Statements”). Domestic restaurant salaries and benefits increased as a percentage of restaurant sales to 27.0% in 1999, from 26.8% in 1998. This increase was primarily due to higher staffing levels after our 14th Anniversary promotion to support the demands of new customers and enhanced employee benefits to select restaurant personnel. Occupancy costs as a percentage of restaurant sales remained consistent at 5.0% for both 1999 and 1998. Restaurant advertising and related costs increased as a percentage of restaurant sales to 9.1% in 1999, from 8.7% in 1998. The increase in 1999 was primarily the result of increased promotional activities in the second quarter in response to significant promotional activities by our competitors and increased activities in the fourth quarter in response to overall market conditions and sales trends.
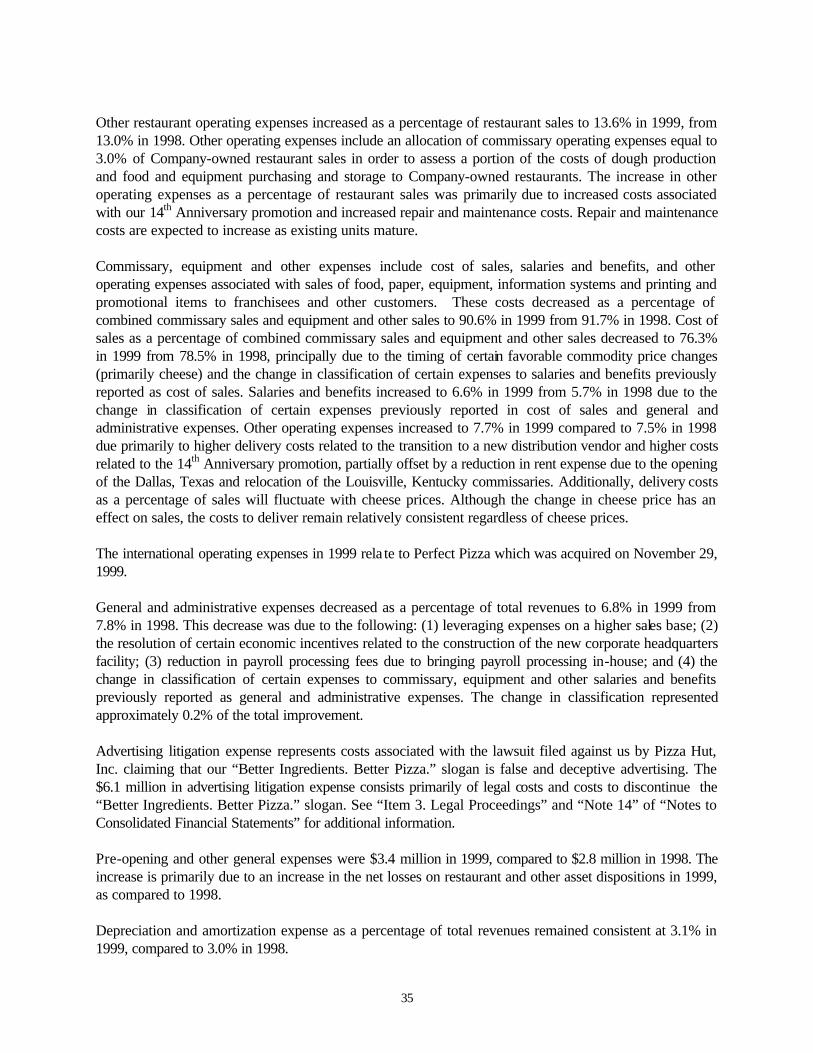
35
Other restaurant operating expenses increased as a percentage of restaurant sales to 13.6% in 1999, from 13.0% in 1998. Other operating expenses include an allocation of commissary operating expenses equal to 3.0% of Company-owned restaurant sales in order to assess a portion of the costs of dough production and food and equipment purchasing and storage to Company-owned restaurants. The increase in other operating expenses as a percentage of restaurant sales was primarily due to increased costs associated with our 14th Anniversary promotion and increased repair and maintenance costs. Repair and maintenance costs are expected to increase as existing units mature. Commissary, equipment and other expenses include cost of sales, salaries and benefits, and other operating expenses associated with sales of food, paper, equipment, information systems and printing and promotional items to franchisees and other customers. These costs decreased as a percentage of combined commissary sales and equipment and other sales to 90.6% in 1999 from 91.7% in 1998. Cost of sales as a percentage of combined commissary sales and equipment and other sales decreased to 76.3% in 1999 from 78.5% in 1998, principally due to the timing of certain favorable commodity price changes (primarily cheese) and the change in classification of certain expenses to salaries and benefits previously reported as cost of sales. Salaries and benefits increased to 6.6% in 1999 from 5.7% in 1998 due to the change in classification of certain expenses previously reported in cost of sales and general and administrative expenses. Other operating expenses increased to 7.7% in 1999 compared to 7.5% in 1998 due primarily to higher delivery costs related to the transition to a new distribution vendor and higher costs related to the 14th Anniversary promotion, partially offset by a reduction in rent expense due to the opening of the Dallas, Texas and relocation of the Louisville, Kentucky commissaries. Additionally, delivery costs as a percentage of sales will fluctuate with cheese prices. Although the change in cheese price has an effect on sales, the costs to deliver remain relatively consistent regardless of cheese prices. The international operating expenses in 1999 rela te to Perfect Pizza which was acquired on November 29, 1999. General and administrative expenses decreased as a percentage of total revenues to 6.8% in 1999 from 7.8% in 1998. This decrease was due to the following: (1) leveraging expenses on a higher sales base; (2) the resolution of certain economic incentives related to the construction of the new corporate headquarters facility; (3) reduction in payroll processing fees due to bringing payroll processing in-house; and (4) the change in classification of certain expenses to commissary, equipment and other salaries and benefits previously reported as general and administrative expenses. The change in classification represented approximately 0.2% of the total improvement. Advertising litigation expense represents costs associated with the lawsuit filed against us by Pizza Hut, Inc. claiming that our “Better Ingredients. Better Pizza.” slogan is false and deceptive advertising. The $6.1 million in advertising litigation expense consists primarily of legal costs and costs to discontinue the “Better Ingredients. Better Pizza.” slogan. See “Item 3. Legal Proceedings” and “Note 14” of “Notes to Consolidated Financial Statements” for additional information. Pre-opening and other general expenses were $3.4 million in 1999, compared to $2.8 million in 1998. The increase is primarily due to an increase in the net losses on restaurant and other asset dispositions in 1999, as compared to 1998. Depreciation and amortization expense as a percentage of total revenues remained consistent at 3.1% in 1999, compared to 3.0% in 1998.
36
Operating income was $72.5 million, or 9.0% of total revenues, compared to $53.7 million, or 7.9% of total revenues, for the comparable period in 1998. Investment Income. Investment income decreased to $3.4 million in 1999 from $4.1 million in 1998 due to a lower average balance of franchise loans and a decrease in our average investment portfolio balance. Interest Expense. Interest expense was $151,000 in 1999 compared to $643,000 in 1998. Interest expense for both periods relates to debt assumed from the acquisition of Minnesota Pizza. Income Tax Expense. Income tax expense (exclusive of the cumulative effect of accounting change and related taxes) reflects a combined federal, state and local effective tax rate of 37.6% for 1999, compared to 38.8% in 1998. The effective income tax rate for 1998, including an income tax benefit for the treatment of Minnesota Pizza as a C Corporation (see “Note 3” of “Notes to Consolidated Financial Statements”), was 37.0%. The effective income tax rate in 1999 increased as compared to the 1998 rate as a result of a continued decrease in the relative level of tax-exempt investment income to total pre-tax income. Liquidity and Capital Resources Cash flow from operations for 2000 decreased to $76.7 million from $89.6 million in 1999 primarily due to an increase in working capital requirements, principally increases in inventory levels (including accumulation of hot bag inventory for continued installa tion in franchise restaurants during 2001), changes in accounts payable and accrued expense levels and a decrease in tax benefits related to the exercise of non-qualified stock options. Cash flow from operations increased $24.6 million in 1999 compared to 1998. This increase is primarily due to increased net income in 1999 as compared to 1998. Earnings Before Interest, Taxes, Depreciation and Amortization (EBITDA), excluding advertising litigation and the special charge, increased 12.8% in 2000 to $116.7 million, compared to $103.4 million in 1999. EBITDA, excluding advertising litigation cost, increased 39.4% in 1999 to $103.4 million from $74.2 million in 1998. We require capital primarily for the development and acquisition of restaurants, the addition of new QC Centers and support services facilities and equipment, the enhancement of corporate systems and facilities and the funding of franchisee loans. Additionally, we began a common stock repurchase program in December 1999. During 2000, common stock share repurchases of $156.2 million, capital expenditures of $59.4 million, acquisitions of $6.6 million, and net loans to franchisees of $9.0 million were primarily funded by net advances of $145.0 million on a $200.0 million unsecured revolving line of credit, liquidation of investments of $15.1 million and cash flow from operations. Total 2001 capital expenditures are expected to be approximately $30 million to $35 million, about one-half of which is for the development, relocation or remodeling of restaurants, and about one-half of which is for QC Centers, Support Services and corporate requirements. During 2001, we plan to open approximately 15 to 20 new Company-owned restaurants and relocate an additional 15 to 20 restaurants.
37
Additionally, during 2001 we may fund up to $5 to $6 million in additional loans under existing franchisee loan program commitments. Approximately $16.7 million, net of allowance for potential uncollectible balances, was outstanding under this program as of December 31, 2000. At this time, we do not expect to significantly expand the program beyond existing commitments. The Board of Directors has authorized up to $275 million for the share repurchase program through 2001 year-end. Through December 31, 2000, a total of 7.6 million shares have been repurchased for $187.9 million at an average price of $24.67 per share since the repurchase program started in 1999 (approximately 6.3 million shares in 2000 and 1.3 million shares in 1999). These repurchases were funded by a revolving line of credit, cash flow from operations, and liquidation of available investments, cash and cash equivalents. Subsequent to year end (through March 12, 2001), we acquired an additional 319,500 shares at an aggregate cost of $7.2 million. As of March 12, 2001, approximately $79.9 million of common stock remains available for repurchase under this authorization. The Company expects to fund the planned capital expenditures, acquisition of franchised restaurants, disbursements under the franchise loan program and additional share repurchases for the next twelve months from operating cash flow and the remaining availability under the Company's unsecured revolving line of credit. The Company’s debt at December 31, 2000 was $146.6 million compared to $6.2 million at December 26, 1999. The increase in debt is due to the common stock repurchase program. Through December 2000, we earned approximately $6.0 million ($1.1 million in 2000, $2.9 million in 1999 and $2.0 million in 1998) of an expected $13.0 million in incentives under the Kentucky Jobs Development Act in connection with the relocation of the corporate offices. We expect to earn the remaining $7.0 million of such incentives through 2007. Impact of Inflation We do not believe inflation has materia lly affected earnings during the past three years. Substantial increases in costs, particularly labor, benefits, food, utilities and fuel costs, could have a significant impact on us. Thus far in 2001, we have continued to experience higher than normal utility and fuel costs and ongoing wage rate pressures. Our restaurant and commissary margins continue to be impacted by these cost factors. Cheese costs appear to be returning to more historical levels, after being unusually low throughout most of 2000; however, this increase in costs will not begin to impact our restaurant margins until the third quarter of 2001 due to our existing cheese purchasing arrangement (See "Note 12" of "Notes to Consolidated Financial Statements”). Forward Looking Statements Certain information contained in this annual report, particularly information regarding future financial performance and plans and objectives of management, is forward looking. Certain factors could cause actual results to differ materially from those expressed in forward looking statements. These factors include, but are not limited to, our ability and the ability of our franchisees to obtain suitable locations and financing for new restaurant development; the hiring, training, and retention of management and other personnel; competition in the industry with respect to price, service, location, and food quality; an increase in food cost due to seasonal fluctuations, weather, and demand; changes in consumer tastes and demographic trends; changes in federal and state laws, such as increases in minimum wage; and risks inherent to international development, including operational or market risks associated with the planned conversion of Perfect Pizza restaurants to Papa John’s in the United Kingdom.
38
Item 7A. Quantitative and Qualitative Disclosures about Market Risk The Company’s debt at December 31, 2000 is principally comprised of a $145.0 million outstanding principal balance on the $200.0 million unsecured revolving line of credit. The interest rate on the revolving line of credit is variable and is based on the London Interbank Offered Rate (LIBOR). An increase in interest rate of 100 basis points would increase interest expense approximately $1.5 million annually. The weighted average interest rate on the revolving line of credit was 7.13% in 2000 and 7.25% as of December 31, 2000. In March 2000, we entered into a $100.0 million interest rate collar, which is effective until March 2003. The collar establishes a 6.36% floor and a 9.50% ceiling on the LIBOR base rate on a no-fee basis. Substantially all of our business is transacted in U.S. dollars. Accordingly, foreign exchange rate fluctuations do not have a significant impact on the Company. Cheese, representing approximately 35 to 40% of our food cost, is subject to seasonal fluctuations, weather, availability, demand and other factors that are beyond our control. We have entered into a purchasing arrangement with a third-party entity formed at the direction of the Franchise Advisory Council for the sole purpose of reducing cheese price volatility. Under this arrangement, we are able to purchase cheese at a fixed quarterly price, based in part on historical average cheese prices. Gains and losses incurred by the selling entity will be used as a factor in determining adjustments to the selling price over time. Ultimately, we will purchase cheese at a price approximating the actual average market price, but with less short-term volatility. See "Note 12" of "Notes to Consolidated Financial Statements" for further information.
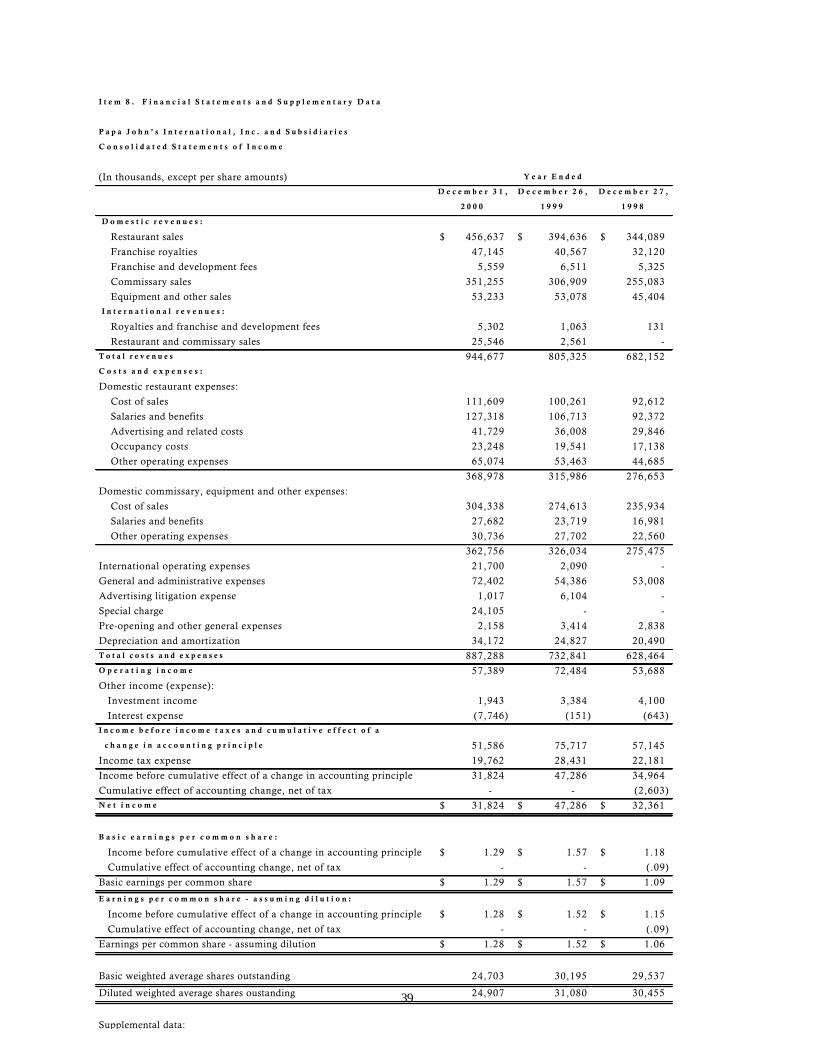
39
I t e m 8 . F i n a n c i a l S t a t e m e n t s a n d S u p p l e m e n t a r y D a t a
P a p a J o h n ’ s I n t e r n a t i o n a l , I n c . a n d S u b s i d i a r i e s
C o n s o l i d a t e d S t a t e m e n t s o f I n c o m e
(In thousands, except per share amounts) Y e a r E n d e d
D e c e m b e r 3 1 , D e c e m b e r 2 6 , D e c e m b e r 2 7 ,
2 0 0 0 1 9 9 9 1 9 9 8
D o m e s t i c r e v e n u e s :
Restaurant sales 456,637$ 394,636$ 344,089$
Franchise royalties 47,145 40,567 32,120
Franchise and development fees 5,559 6,511 5,325
Commissary sales 351,255 306,909 255,083
Equipment and other sales 53,233 53,078 45,404 I n t e r n a t i o n a l r e v e n u e s :
Royalties and franchise and development fees 5,302 1,063 131
Restaurant and commissary sales 25,546 2,561 - T o t a l r e v e n u e s 944,677 805,325 682,152 C o s t s a n d e x p e n s e s :
Domestic restaurant expenses:
Cost of sales 111,609 100,261 92,612
Salaries and benefits 127,318 106,713 92,372
Advertising and related costs 41,729 36,008 29,846
Occupancy costs 23,248 19,541 17,138
Other operating expenses 65,074 53,463 44,685
368,978 315,986 276,653
Domestic commissary, equipment and other expenses:
Cost of sales 304,338 274,613 235,934
Salaries and benefits 27,682 23,719 16,981
Other operating expenses 30,736 27,702 22,560
362,756 326,034 275,475
International operating expenses 21,700 2,090 -
General and administrative expenses 72,402 54,386 53,008
Advertising litigation expense 1,017 6,104 -
Special charge 24,105 - -
Pre-opening and other general expenses 2,158 3,414 2,838
Depreciation and amortization 34,172 24,827 20,490 T o t a l c o s t s a n d e x p e n s e s 887,288 732,841 628,464 O p e r a t i n g i n c o m e 57,389 72,484 53,688
Other income (expense):
Investment income 1,943 3,384 4,100
Interest expense (7,746) (151) (643) I n c o m e b e f o r e i n c o m e t a x e s a n d c u m u l a t i v e e f f e c t o f a
c h a n g e i n a c c o u n t i n g p r i n c i p l e 51,586 75,717 57,145
Income tax expense 19,762 28,431 22,181
Income before cumulative effect of a change in accounting principle 31,824 47,286 34,964
Cumulative effect of accounting change, net of tax - - (2,603) N e t i n c o m e 31,824$ 47,286$ 32,361$
B a s i c e a r n i n g s p e r c o m m o n s h a r e :
Income before cumulative effect of a change in accounting principle 1.29$ 1.57$ 1.18$
Cumulative effect of accounting change, net of tax - - (.09)
Basic earnings per common share 1.29$ 1.57$ 1.09$
E a r n i n g s p e r c o m m o n s h a r e - a s s u m i n g d i l u t i o n :
Income before cumulative effect of a change in accounting principle 1.28$ 1.52$ 1.15$
Cumulative effect of accounting change, net of tax - - (.09)
Earnings per common share - assuming dilution 1.28$ 1.52$ 1.06$
Basic weighted average shares outstanding 24,703 30,195 29,537
Diluted weighted average shares oustanding 24,907 31,080 30,455
Supplemental data:
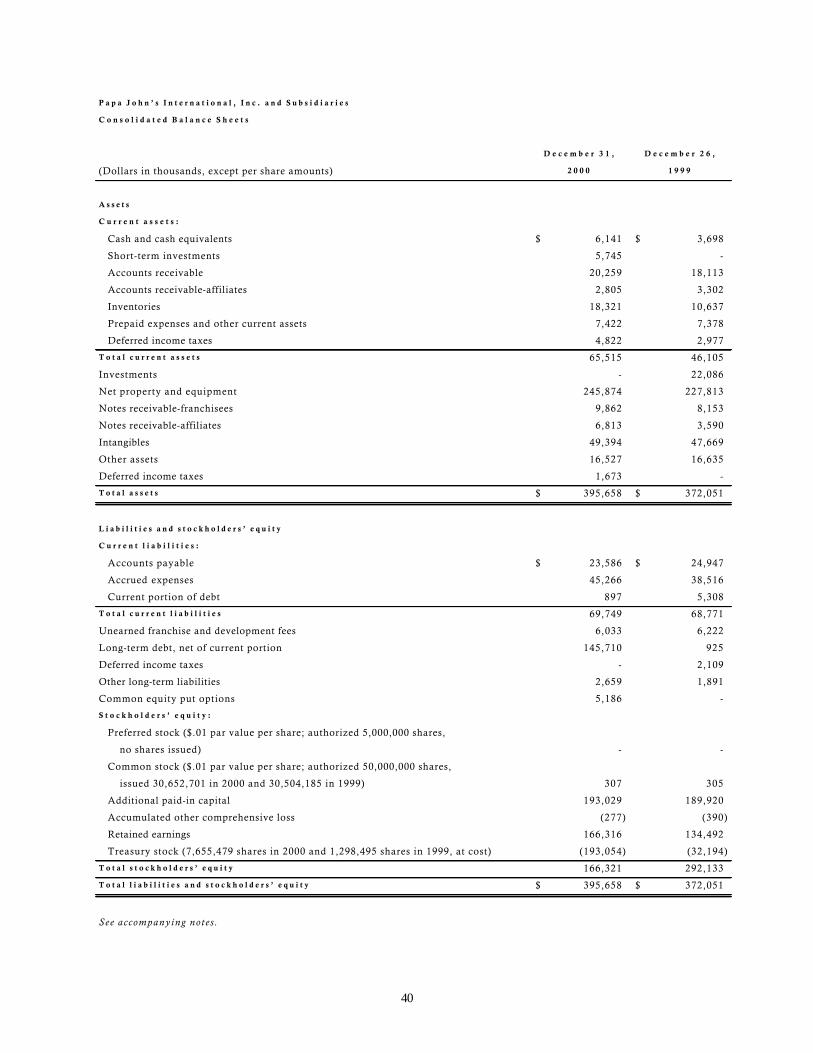
40
P a p a J o h n ’ s I n t e r n a t i o n a l , I n c . a n d S u b s i d i a r i e s
C o n s o l i d a t e d B a l a n c e S h e e t s
D e c e m b e r 3 1 , D e c e m b e r 2 6 ,
(Dollars in thousands, except per share amounts) 2 0 0 0 1 9 9 9
A s s e t s
C u r r e n t a s s e t s :
Cash and cash equivalents 6,141$ 3,698$
Short-term investments 5,745 -
Accounts receivable 20,259 18,113
Accounts receivable-affiliates 2,805 3,302
Inventories 18,321 10,637
Prepaid expenses and other current assets 7,422 7,378
Deferred income taxes 4,822 2,977
T o t a l c u r r e n t a s s e t s 65,515 46,105
Investments - 22,086
Net property and equipment 245,874 227,813
Notes receivable-franchisees 9,862 8,153
Notes receivable-affiliates 6,813 3,590
Intangibles 49,394 47,669
Other assets 16,527 16,635
Deferred income taxes 1,673 -
T o t a l a s s e t s 395,658$ 372,051$
L i a b i l i t i e s a n d s t o c k h o l d e r s ’ e q u i t y
C u r r e n t l i a b i l i t i e s :
Accounts payable 23,586$ 24,947$
Accrued expenses 45,266 38,516
Current portion of debt 897 5,308
T o t a l c u r r e n t l i a b i l i t i e s 69,749 68,771
Unearned franchise and development fees 6,033 6,222
Long-term debt, net of current portion 145,710 925
Deferred income taxes - 2,109
Other long-term liabilities 2,659 1,891
Common equity put options 5,186 -
S t o c k h o l d e r s ’ e q u i t y :
Preferred stock ($.01 par value per share; authorized 5,000,000 shares,
no shares issued) - -
Common stock ($.01 par value per share; authorized 50,000,000 shares,
issued 30,652,701 in 2000 and 30,504,185 in 1999) 307 305
Additional paid-in capital 193,029 189,920
Accumulated other comprehensive loss (277) (390)
Retained earnings 166,316 134,492
Treasury stock (7,655,479 shares in 2000 and 1,298,495 shares in 1999, at cost) (193,054) (32,194)
T o t a l s t o c k h o l d e r s ’ e q u i t y 166,321 292,133
T o t a l l i a b i l i t i e s a n d s t o c k h o l d e r s ’ e q u i t y 395,658$ 372,051$
S e e a c c o m p a n y i n g n o t e s .
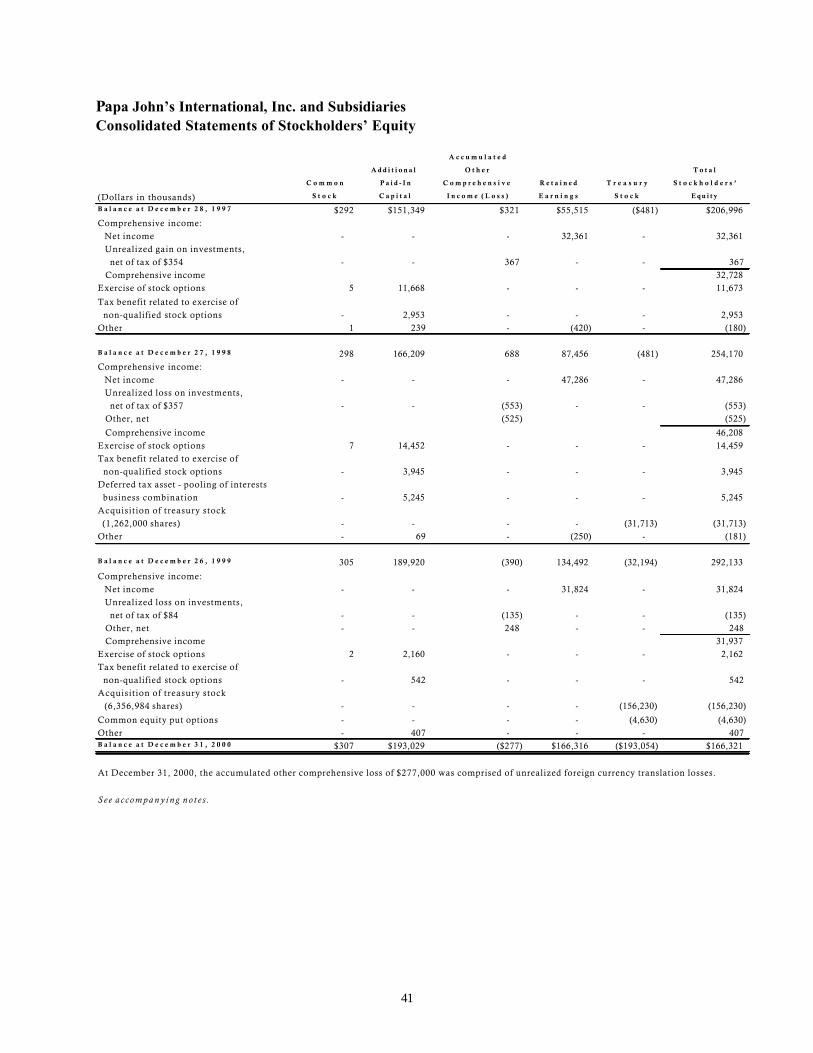
41
Papa John’s International, Inc. and Subsidiaries Consolidated Statements of Stockholders’ Equity
A c c u m u l a t e d
A d d i t i o n a l O t h e r T o t a l
C o m m o n P a i d - I n C o m p r e h e n s i v e R e t a i n e d T r e a s u r y S t o c k h o l d e r s ’
(Dollars in thousands) S t o c k C a p i t a l I n c o m e ( L o s s ) E a r n i n g s S t o c k E q u i t y
B a l a n c e a t D e c e m b e r 2 8 , 1 9 9 7 $292 $151,349 $321 $55,515 ($481) $206,996Comprehensive income: Net income - - - 32,361 - 32,361 Unrealized gain on investments, net of tax of $354 - - 367 - - 367 Comprehensive income 32,728 Exercise of stock options 5 11,668 - - - 11,673
Tax benefit related to exercise of non-qualified stock options - 2,953 - - - 2,953 Other 1 239 - (420) - (180)
B a l a n c e a t D e c e m b e r 2 7 , 1 9 9 8 298 166,209 688 87,456 (481) 254,170 Comprehensive income: Net income - - - 47,286 - 47,286 Unrealized loss on investments, net of tax of $357 - - (553) - - (553) Other, net (525) (525)
Comprehensive income 46,208 Exercise of stock options 7 14,452 - - - 14,459 Tax benefit related to exercise of non-qualified stock options - 3,945 - - - 3,945 Deferred tax asset - pooling of interests business combination - 5,245 - - - 5,245 Acquisition of treasury stock (1,262,000 shares) - - - - (31,713) (31,713) Other - 69 - (250) - (181)
B a l a n c e a t D e c e m b e r 2 6 , 1 9 9 9 305 189,920 (390) 134,492 (32,194) 292,133
Comprehensive income: Net income - - - 31,824 - 31,824 Unrealized loss on investments, net of tax of $84 - - (135) - - (135) Other, net - - 248 - - 248 Comprehensive income 31,937 Exercise of stock options 2 2,160 - - - 2,162 Tax benefit related to exercise of non-qualified stock options - 542 - - - 542 Acquisition of treasury stock (6,356,984 shares) - - - - (156,230) (156,230)
Common equity put options - - - - (4,630) (4,630) Other - 407 - - - 407 B a l a n c e a t D e c e m b e r 3 1 , 2 0 0 0 $307 $193,029 ($277) $166,316 ($193,054) $166,321
At December 31, 2000, the accumulated other comprehensive loss of $277,000 was comprised of unrealized foreign currency translation losses.
S e e a c c o m p a n y i n g n o t e s .
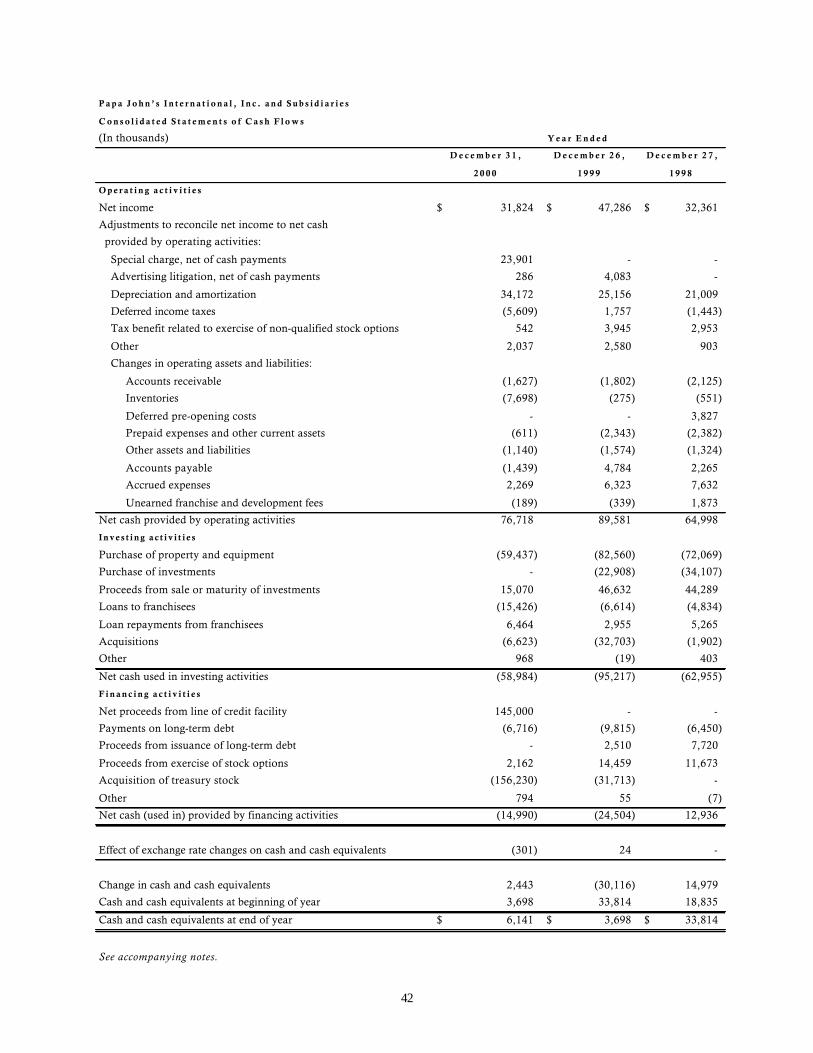
42
P a p a J o h n ’ s I n t e r n a t i o n a l , I n c . a n d S u b s i d i a r i e s
C o n s o l i d a t e d S t a t e m e n t s o f C a s h F l o w s
(In thousands) Y e a r E n d e d
D e c e m b e r 3 1 , D e c e m b e r 2 6 , D e c e m b e r 2 7 ,
2 0 0 0 1 9 9 9 1 9 9 8
O p e r a t i n g a c t i v i t i e s
Net income 31,824$ 47,286$ 32,361$
Adjustments to reconcile net income to net cash
provided by operating activities:
Special charge, net of cash payments 23,901 - -
Advertising litigation, net of cash payments 286 4,083 -
Depreciation and amortization 34,172 25,156 21,009
Deferred income taxes (5,609) 1,757 (1,443)
Tax benefit related to exercise of non-qualified stock options 542 3,945 2,953
Other 2,037 2,580 903
Changes in operating assets and liabilities:
Accounts receivable (1,627) (1,802) (2,125)
Inventories (7,698) (275) (551)
Deferred pre-opening costs - - 3,827
Prepaid expenses and other current assets (611) (2,343) (2,382)
Other assets and liabilities (1,140) (1,574) (1,324)
Accounts payable (1,439) 4,784 2,265
Accrued expenses 2,269 6,323 7,632
Unearned franchise and development fees (189) (339) 1,873
Net cash provided by operating activities 76,718 89,581 64,998
I n v e s t i n g a c t i v i t i e s
Purchase of property and equipment (59,437) (82,560) (72,069)
Purchase of investments - (22,908) (34,107)
Proceeds from sale or maturity of investments 15,070 46,632 44,289
Loans to franchisees (15,426) (6,614) (4,834)
Loan repayments from franchisees 6,464 2,955 5,265
Acquisitions (6,623) (32,703) (1,902)
Other 968 (19) 403
Net cash used in investing activities (58,984) (95,217) (62,955)
F i n a n c i n g a c t i v i t i e s
Net proceeds from line of credit facility 145,000 - -
Payments on long-term debt (6,716) (9,815) (6,450)
Proceeds from issuance of long-term debt - 2,510 7,720
Proceeds from exercise of stock options 2,162 14,459 11,673
Acquisition of treasury stock (156,230) (31,713) -
Other 794 55 (7)
Net cash (used in) provided by financing activities (14,990) (24,504) 12,936
Effect of exchange rate changes on cash and cash equivalents (301) 24 -
Change in cash and cash equivalents 2,443 (30,116) 14,979
Cash and cash equivalents at beginning of year 3,698 33,814 18,835
Cash and cash equivalents at end of year 6,141$ 3,698$ 33,814$
See accompanying notes.
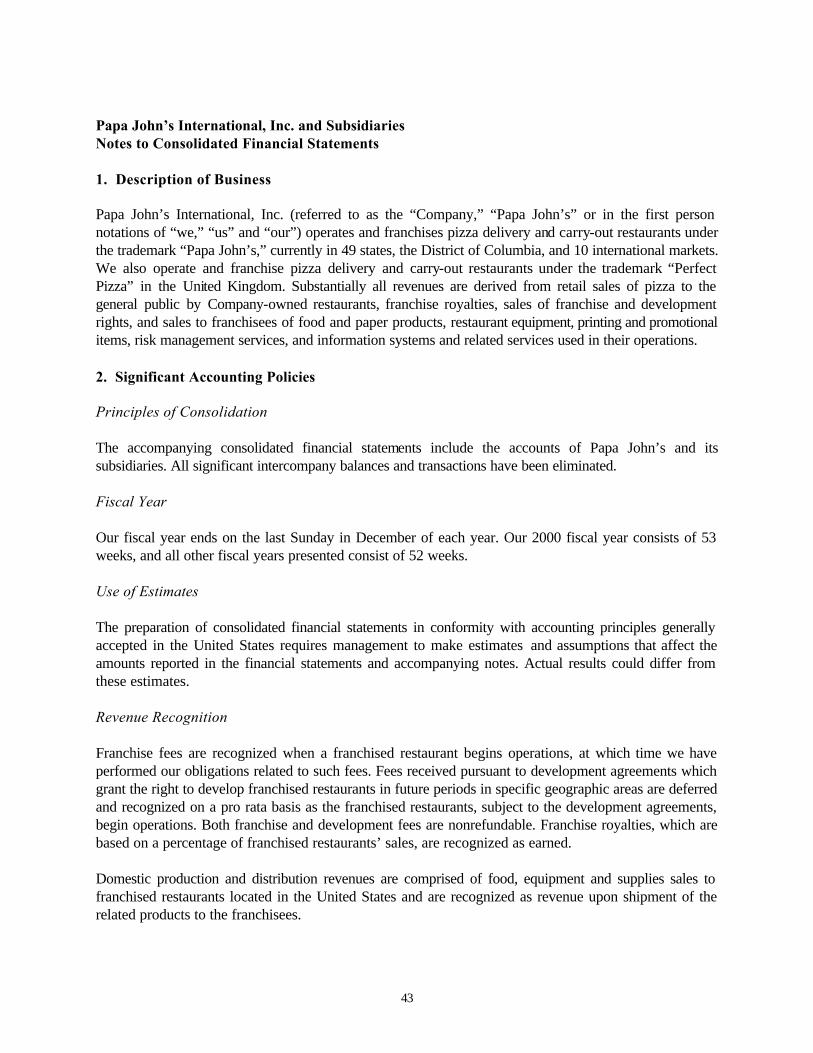
43
Papa John’s International, Inc. and Subsidiaries Notes to Consolidated Financial Statements 1. Description of Business Papa John’s International, Inc. (referred to as the “Company,” “Papa John’s” or in the first person notations of “we,” “us” and “our”) operates and franchises pizza delivery and carry-out restaurants under the trademark “Papa John’s,” currently in 49 states, the District of Columbia, and 10 international markets. We also operate and franchise pizza delivery and carry-out restaurants under the trademark “Perfect Pizza” in the United Kingdom. Substantially all revenues are derived from retail sales of pizza to the general public by Company-owned restaurants, franchise royalties, sales of franchise and development rights, and sales to franchisees of food and paper products, restaurant equipment, printing and promotional items, risk management services, and information systems and related services used in their operations. 2. Significant Accounting Policies Principles of Consolidation The accompanying consolidated financial statements include the accounts of Papa John’s and its subsidiaries. All significant intercompany balances and transactions have been eliminated. Fiscal Year Our fiscal year ends on the last Sunday in December of each year. Our 2000 fiscal year consists of 53 weeks, and all other fiscal years presented consist of 52 weeks. Use of Estimates The preparation of consolidated financial statements in conformity with accounting principles generally accepted in the United States requires management to make estimates and assumptions that affect the amounts reported in the financial statements and accompanying notes. Actual results could differ from these estimates. Revenue Recognition Franchise fees are recognized when a franchised restaurant begins operations, at which time we have performed our obligations related to such fees. Fees received pursuant to development agreements which grant the right to develop franchised restaurants in future periods in specific geographic areas are deferred and recognized on a pro rata basis as the franchised restaurants, subject to the development agreements, begin operations. Both franchise and development fees are nonrefundable. Franchise royalties, which are based on a percentage of franchised restaurants’ sales, are recognized as earned. Domestic production and distribution revenues are comprised of food, equipment and supplies sales to franchised restaurants located in the United States and are recognized as revenue upon shipment of the related products to the franchisees.
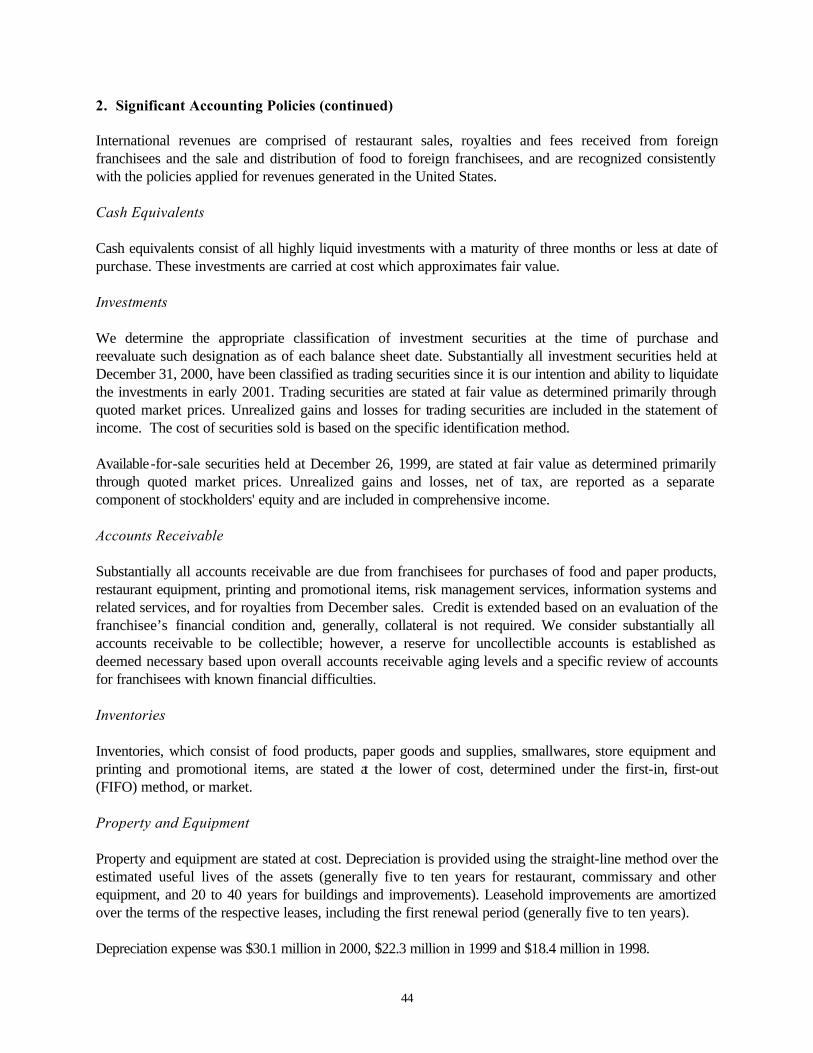
44
2. Significant Accounting Policies (continued) International revenues are comprised of restaurant sales, royalties and fees received from foreign franchisees and the sale and distribution of food to foreign franchisees, and are recognized consistently with the policies applied for revenues generated in the United States. Cash Equivalents Cash equivalents consist of all highly liquid investments with a maturity of three months or less at date of purchase. These investments are carried at cost which approximates fair value. Investments We determine the appropriate classification of investment securities at the time of purchase and reevaluate such designation as of each balance sheet date. Substantially all investment securities held at December 31, 2000, have been classified as trading securities since it is our intention and ability to liquidate the investments in early 2001. Trading securities are stated at fair value as determined primarily through quoted market prices. Unrealized gains and losses for trading securities are included in the statement of income. The cost of securities sold is based on the specific identification method. Available-for-sale securities held at December 26, 1999, are stated at fair value as determined primarily through quoted market prices. Unrealized gains and losses, net of tax, are reported as a separate component of stockholders' equity and are included in comprehensive income. Accounts Receivable Substantially all accounts receivable are due from franchisees for purchases of food and paper products, restaurant equipment, printing and promotional items, risk management services, information systems and related services, and for royalties from December sales. Credit is extended based on an evaluation of the franchisee’s financial condition and, generally, collateral is not required. We consider substantially all accounts receivable to be collectible; however, a reserve for uncollectible accounts is established as deemed necessary based upon overall accounts receivable aging levels and a specific review of accounts for franchisees with known financial difficulties. Inventories Inventories, which consist of food products, paper goods and supplies, smallwares, store equipment and printing and promotional items, are stated at the lower of cost, determined under the first-in, first-out (FIFO) method, or market. Property and Equipment Property and equipment are stated at cost. Depreciation is provided using the straight-line method over the estimated useful lives of the assets (generally five to ten years for restaurant, commissary and other equipment, and 20 to 40 years for buildings and improvements). Leasehold improvements are amortized over the terms of the respective leases, including the first renewal period (generally five to ten years). Depreciation expense was $30.1 million in 2000, $22.3 million in 1999 and $18.4 million in 1998.

45
46
2. Significant Accounting Policies (continued) Long-Lived and Intangible Assets The recoverability of long-lived and intangible assets is evaluated annually at an operating unit level basis (e.g. an individual restaurant) when impairment indicators exist. We consider several indicators in assessing impairment including historical financial performance, operating trends as well as management's future operating plans. If impairment indicators exist, we evaluate whether impairment exists on the basis of undiscounted expected future cash flows before interest for the expected remaining useful life of the operating unit. Recorded values that are not expected to be recovered through undiscounted future cash flows are written down to current fair value, which is generally determined from estimated discounted future net cash flows (assets held for use) or net realizable value (assets held for sale). Intangible assets principally represent costs in excess of net assets of companies acquired (i.e., goodwill). Goodwill is amortized on a straight-line basis ranging from 15 to 25 years. Accumulated amortization was $6.2 million at December 31, 2000 and $3.6 million at December 26, 1999 (see Note 4). Systems Development Costs We defer certain systems development and related costs which meet established criteria. Amounts deferred are amortized principally over periods not exceeding five years beginning in the month subsequent to completion of the related systems project. Total costs deferred were approximately $2.3 million in 2000, $1.4 million in 1999, and $1.2 million in 1998. Advertising and Related Costs Advertising and related costs include the costs of Company-owned restaurant activities such as mail coupons, door hangers and promotional items and contributions to the Papa John’s Marketing Fund, Inc. (the “Marketing Fund”) and local market cooperative advertising funds. Contributions by Company-owned and franchised restaurants to the Marketing Fund and the cooperative advertising funds are based on an established percentage of monthly restaurant revenues. The Marketing Fund is responsible for developing and conducting marketing and advertising for the Papa John’s system. The local market cooperative advertising funds are responsible for developing and conducting advertising activities in a specific market, including the placement of electronic and print materials developed by the Marketing Fund. We recognize Company-owned restaurant contributions to the Marketing Fund and to those local market cooperative advertising funds deemed to be controlled by us (collectively, the “Controlled Funds”), and funds advanced to the Marketing Fund as loans (see Note 7), as advertising and related costs at the time the Controlled Funds actually incur such expenses. Foreign Currency Translation The local currency is the functional currency for our foreign subsidiary, Perfect Pizza. Earnings are translated into U.S. dollars using monthly average exchange rates, while balance sheet accounts are translated using year-end exchange rates. The resulting translation adjustments are included as a component of accumulated other comprehensive income.
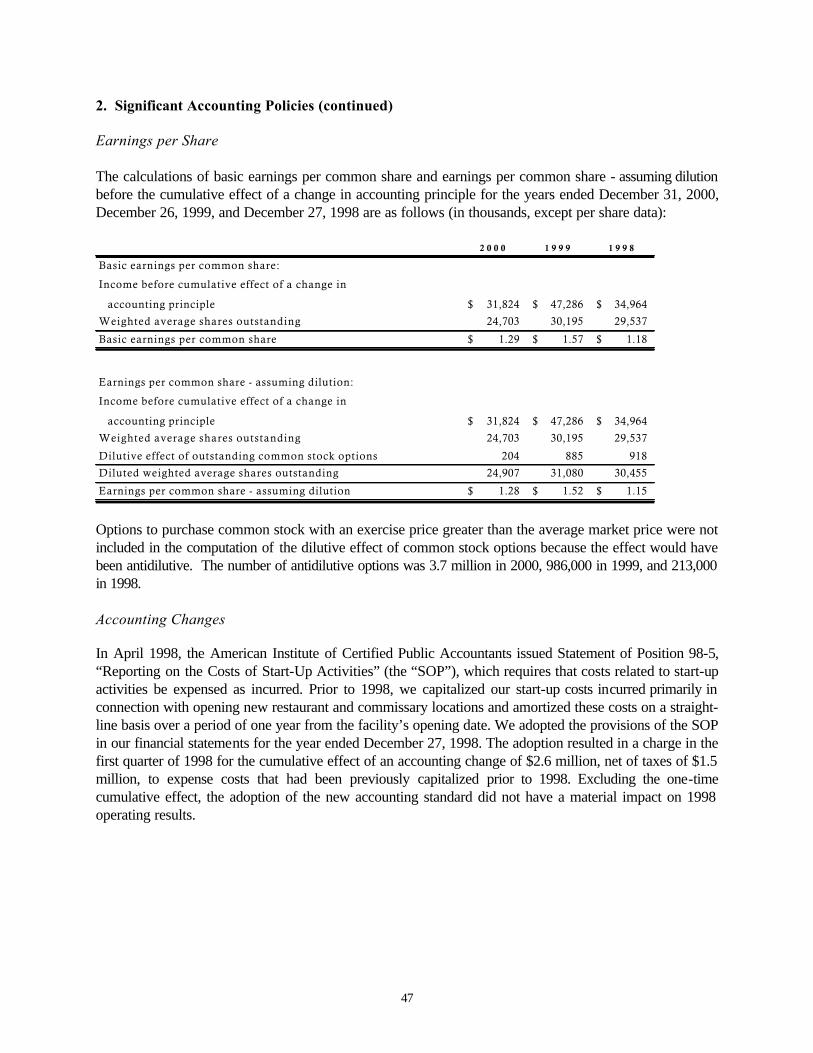
47
2. Significant Accounting Policies (continued) Earnings per Share The calculations of basic earnings per common share and earnings per common share - assuming dilution before the cumulative effect of a change in accounting principle for the years ended December 31, 2000, December 26, 1999, and December 27, 1998 are as follows (in thousands, except per share data):
2 0 0 0 1 9 9 9 1 9 9 8
Basic earnings per common share:
Income before cumulative effect of a change in
accounting principle 31,824$ 47,286$ 34,964$
Weighted average shares outstanding 24,703 30,195 29,537
Basic earnings per common share 1.29$ 1.57$ 1.18$
Earnings per common share - assuming dilution:
Income before cumulative effect of a change in
accounting principle 31,824$ 47,286$ 34,964$
Weighted average shares outstanding 24,703 30,195 29,537
Dilutive effect of outstanding common stock options 204 885 918
Diluted weighted average shares outstanding 24,907 31,080 30,455
Earnings per common share - assuming dilution 1.28$ 1.52$ 1.15$
Options to purchase common stock with an exercise price greater than the average market price were not included in the computation of the dilutive effect of common stock options because the effect would have been antidilutive. The number of antidilutive options was 3.7 million in 2000, 986,000 in 1999, and 213,000 in 1998. Accounting Changes In April 1998, the American Institute of Certified Public Accountants issued Statement of Position 98-5, “Reporting on the Costs of Start-Up Activities” (the “SOP”), which requires that costs related to start-up activities be expensed as incurred. Prior to 1998, we capitalized our start-up costs incurred primarily in connection with opening new restaurant and commissary locations and amortized these costs on a straight-line basis over a period of one year from the facility’s opening date. We adopted the provisions of the SOP in our financial statements for the year ended December 27, 1998. The adoption resulted in a charge in the first quarter of 1998 for the cumulative effect of an accounting change of $2.6 million, net of taxes of $1.5 million, to expense costs that had been previously capitalized prior to 1998. Excluding the one-time cumulative effect, the adoption of the new accounting standard did not have a material impact on 1998 operating results.
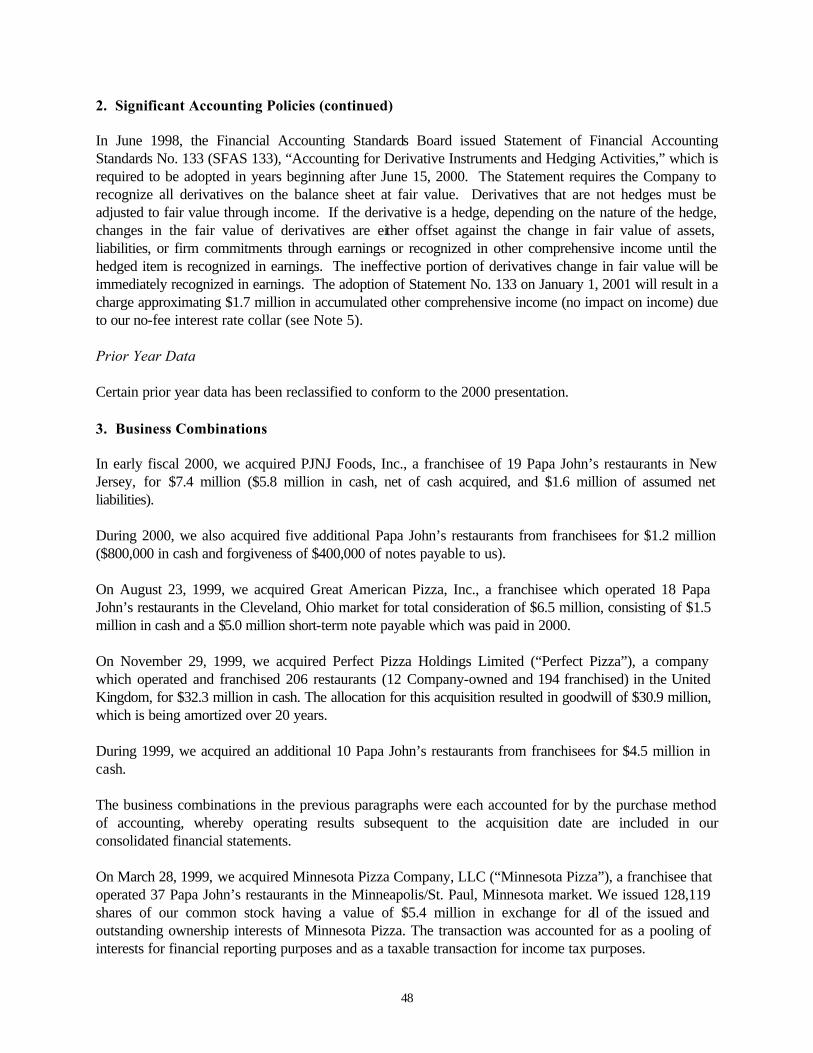
48
2. Significant Accounting Policies (continued) In June 1998, the Financial Accounting Standards Board issued Statement of Financial Accounting Standards No. 133 (SFAS 133), “Accounting for Derivative Instruments and Hedging Activities,” which is required to be adopted in years beginning after June 15, 2000. The Statement requires the Company to recognize all derivatives on the balance sheet at fair value. Derivatives that are not hedges must be adjusted to fair value through income. If the derivative is a hedge, depending on the nature of the hedge, changes in the fair value of derivatives are either offset against the change in fair value of assets, liabilities, or firm commitments through earnings or recognized in other comprehensive income until the hedged item is recognized in earnings. The ineffective portion of derivatives change in fair value will be immediately recognized in earnings. The adoption of Statement No. 133 on January 1, 2001 will result in a charge approximating $1.7 million in accumulated other comprehensive income (no impact on income) due to our no-fee interest rate collar (see Note 5). Prior Year Data Certain prior year data has been reclassified to conform to the 2000 presentation. 3. Business Combinations In early fiscal 2000, we acquired PJNJ Foods, Inc., a franchisee of 19 Papa John’s restaurants in New Jersey, for $7.4 million ($5.8 million in cash, net of cash acquired, and $1.6 million of assumed net liabilities). During 2000, we also acquired five additional Papa John’s restaurants from franchisees for $1.2 million ($800,000 in cash and forgiveness of $400,000 of notes payable to us). On August 23, 1999, we acquired Great American Pizza, Inc., a franchisee which operated 18 Papa John’s restaurants in the Cleveland, Ohio market for total consideration of $6.5 million, consisting of $1.5 million in cash and a $5.0 million short-term note payable which was paid in 2000. On November 29, 1999, we acquired Perfect Pizza Holdings Limited (“Perfect Pizza”), a company which operated and franchised 206 restaurants (12 Company-owned and 194 franchised) in the United Kingdom, for $32.3 million in cash. The allocation for this acquisition resulted in goodwill of $30.9 million, which is being amortized over 20 years. During 1999, we acquired an additional 10 Papa John’s restaurants from franchisees for $4.5 million in cash. The business combinations in the previous paragraphs were each accounted for by the purchase method of accounting, whereby operating results subsequent to the acquisition date are included in our consolidated financial statements. On March 28, 1999, we acquired Minnesota Pizza Company, LLC (“Minnesota Pizza”), a franchisee that operated 37 Papa John’s restaurants in the Minneapolis/St. Paul, Minnesota market. We issued 128,119 shares of our common stock having a value of $5.4 million in exchange for all of the issued and outstanding ownership interests of Minnesota Pizza. The transaction was accounted for as a pooling of interests for financial reporting purposes and as a taxable transaction for income tax purposes.

49
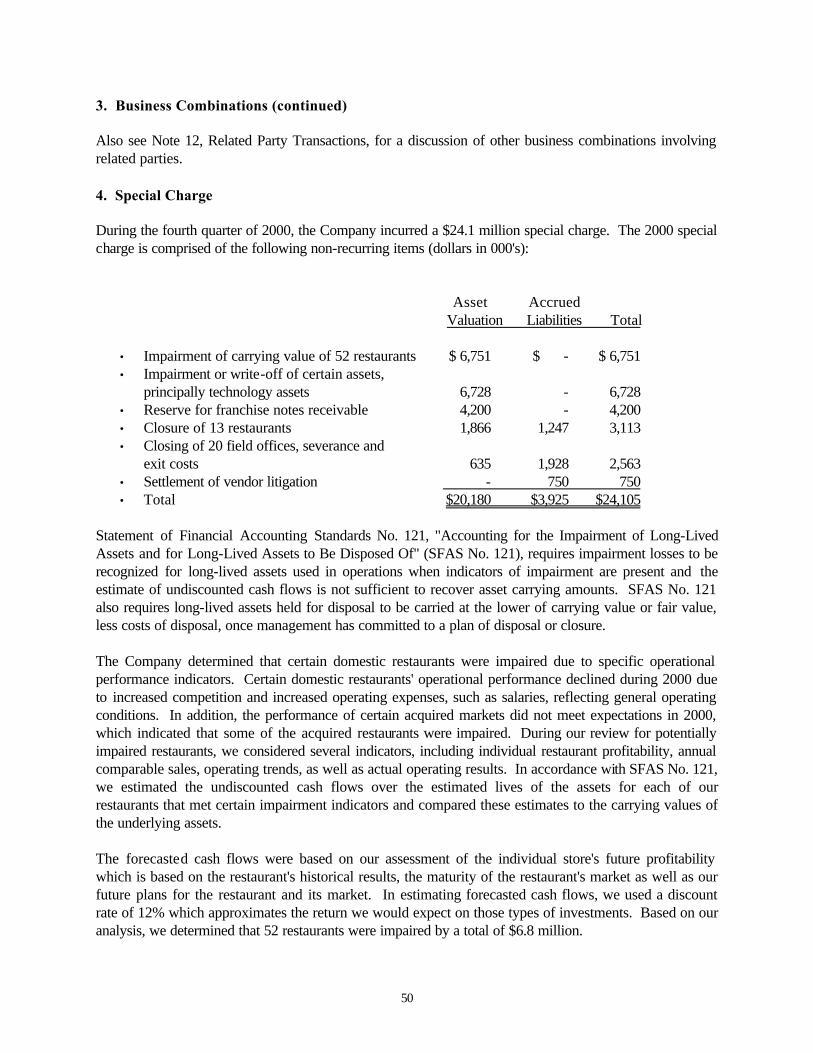
50
3. Business Combinations (continued) Also see Note 12, Related Party Transactions, for a discussion of other business combinations involving related parties. 4. Special Charge During the fourth quarter of 2000, the Company incurred a $24.1 million special charge. The 2000 special charge is comprised of the following non-recurring items (dollars in 000's): Asset Accrued Valuation Liabilities Total
• Impairment of carrying value of 52 restaurants $ 6,751 $ - $ 6,751 • Impairment or write-off of certain assets, principally technology assets 6,728 - 6,728 • Reserve for franchise notes receivable 4,200 - 4,200 • Closure of 13 restaurants 1,866 1,247 3,113 • Closing of 20 field offices, severance and exit costs 635 1,928 2,563 • Settlement of vendor litigation - 750 750 • Total $20,180 $3,925 $24,105
Statement of Financial Accounting Standards No. 121, "Accounting for the Impairment of Long-Lived Assets and for Long-Lived Assets to Be Disposed Of" (SFAS No. 121), requires impairment losses to be recognized for long-lived assets used in operations when indicators of impairment are present and the estimate of undiscounted cash flows is not sufficient to recover asset carrying amounts. SFAS No. 121 also requires long-lived assets held for disposal to be carried at the lower of carrying value or fair value, less costs of disposal, once management has committed to a plan of disposal or closure. The Company determined that certain domestic restaurants were impaired due to specific operational performance indicators. Certain domestic restaurants' operational performance declined during 2000 due to increased competition and increased operating expenses, such as salaries, reflecting general operating conditions. In addition, the performance of certain acquired markets did not meet expectations in 2000, which indicated that some of the acquired restaurants were impaired. During our review for potentially impaired restaurants, we considered several indicators, including individual restaurant profitability, annual comparable sales, operating trends, as well as actual operating results. In accordance with SFAS No. 121, we estimated the undiscounted cash flows over the estimated lives of the assets for each of our restaurants that met certain impairment indicators and compared these estimates to the carrying values of the underlying assets. The forecasted cash flows were based on our assessment of the individual store's future profitability which is based on the restaurant's historical results, the maturity of the restaurant's market as well as our future plans for the restaurant and its market. In estimating forecasted cash flows, we used a discount rate of 12% which approximates the return we would expect on those types of investments. Based on our analysis, we determined that 52 restaurants were impaired by a total of $6.8 million.
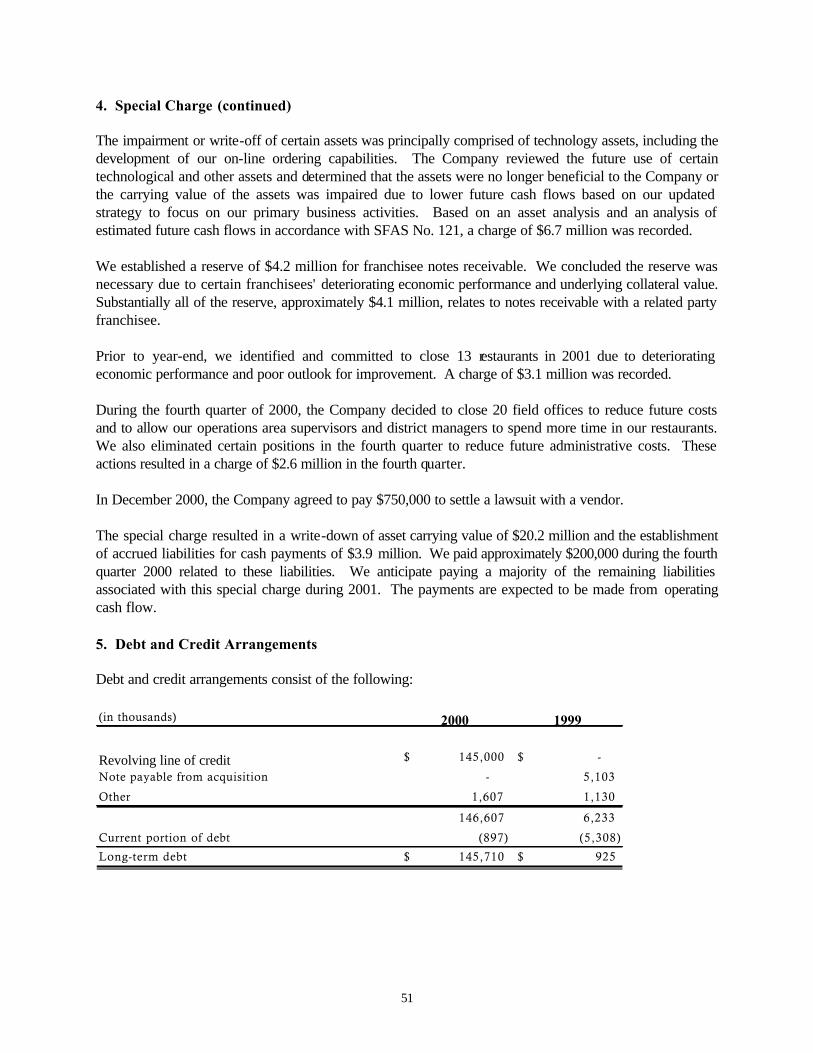
51
4. Special Charge (continued) The impairment or write-off of certain assets was principally comprised of technology assets, including the development of our on-line ordering capabilities. The Company reviewed the future use of certain technological and other assets and determined that the assets were no longer beneficial to the Company or the carrying value of the assets was impaired due to lower future cash flows based on our updated strategy to focus on our primary business activities. Based on an asset analysis and an analysis of estimated future cash flows in accordance with SFAS No. 121, a charge of $6.7 million was recorded. We established a reserve of $4.2 million for franchisee notes receivable. We concluded the reserve was necessary due to certain franchisees' deteriorating economic performance and underlying collateral value. Substantially all of the reserve, approximately $4.1 million, relates to notes receivable with a related party franchisee. Prior to year-end, we identified and committed to close 13 restaurants in 2001 due to deteriorating economic performance and poor outlook for improvement. A charge of $3.1 million was recorded. During the fourth quarter of 2000, the Company decided to close 20 field offices to reduce future costs and to allow our operations area supervisors and district managers to spend more time in our restaurants. We also eliminated certain positions in the fourth quarter to reduce future administrative costs. These actions resulted in a charge of $2.6 million in the fourth quarter. In December 2000, the Company agreed to pay $750,000 to settle a lawsuit with a vendor. The special charge resulted in a write-down of asset carrying value of $20.2 million and the establishment of accrued liabilities for cash payments of $3.9 million. We paid approximately $200,000 during the fourth quarter 2000 related to these liabilities. We anticipate paying a majority of the remaining liabilities associated with this special charge during 2001. The payments are expected to be made from operating cash flow. 5. Debt and Credit Arrangements Debt and credit arrangements consist of the following: (in thousands) 2000 1999
Revolving line of credit 145,000$ -$
Note payable from acquisition - 5,103
Other 1,607 1,130
146,607 6,233
Current portion of debt (897) (5,308)
Long-term debt 145,710$ 925$
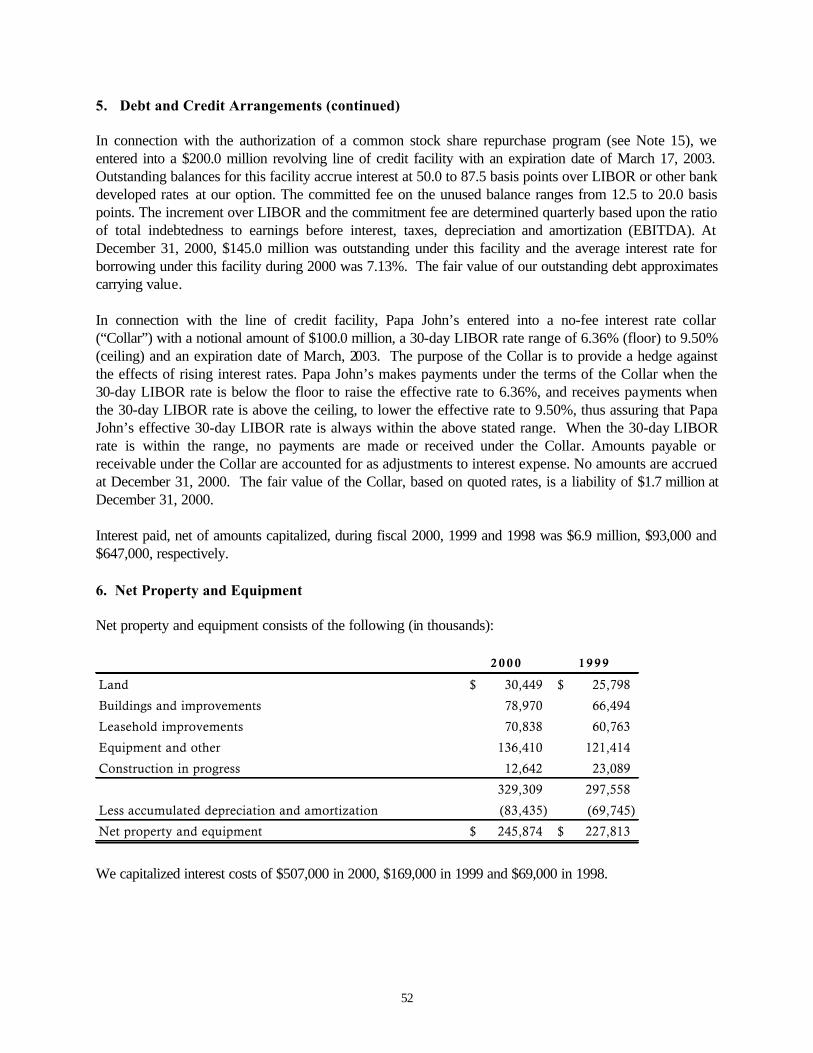
52
5. Debt and Credit Arrangements (continued) In connection with the authorization of a common stock share repurchase program (see Note 15), we entered into a $200.0 million revolving line of credit facility with an expiration date of March 17, 2003. Outstanding balances for this facility accrue interest at 50.0 to 87.5 basis points over LIBOR or other bank developed rates at our option. The committed fee on the unused balance ranges from 12.5 to 20.0 basis points. The increment over LIBOR and the commitment fee are determined quarterly based upon the ratio of total indebtedness to earnings before interest, taxes, depreciation and amortization (EBITDA). At December 31, 2000, $145.0 million was outstanding under this facility and the average interest rate for borrowing under this facility during 2000 was 7.13%. The fair value of our outstanding debt approximates carrying value. In connection with the line of credit facility, Papa John’s entered into a no-fee interest rate collar (“Collar”) with a notional amount of $100.0 million, a 30-day LIBOR rate range of 6.36% (floor) to 9.50% (ceiling) and an expiration date of March, 2003. The purpose of the Collar is to provide a hedge against the effects of rising interest rates. Papa John’s makes payments under the terms of the Collar when the 30-day LIBOR rate is below the floor to raise the effective rate to 6.36%, and receives payments when the 30-day LIBOR rate is above the ceiling, to lower the effective rate to 9.50%, thus assuring that Papa John’s effective 30-day LIBOR rate is always within the above stated range. When the 30-day LIBOR rate is within the range, no payments are made or received under the Collar. Amounts payable or receivable under the Collar are accounted for as adjustments to interest expense. No amounts are accrued at December 31, 2000. The fair value of the Collar, based on quoted rates, is a liability of $1.7 million at December 31, 2000. Interest paid, net of amounts capitalized, during fiscal 2000, 1999 and 1998 was $6.9 million, $93,000 and $647,000, respectively. 6. Net Property and Equipment Net property and equipment consists of the following (in thousands):
2 0 0 0 1 9 9 9
Land 30,449$ 25,798$
Buildings and improvements 78,970 66,494
Leasehold improvements 70,838 60,763
Equipment and other 136,410 121,414
Construction in progress 12,642 23,089
329,309 297,558
Less accumulated depreciation and amortization (83,435) (69,745)
Net property and equipment 245,874$ 227,813$
We capitalized interest costs of $507,000 in 2000, $169,000 in 1999 and $69,000 in 1998.
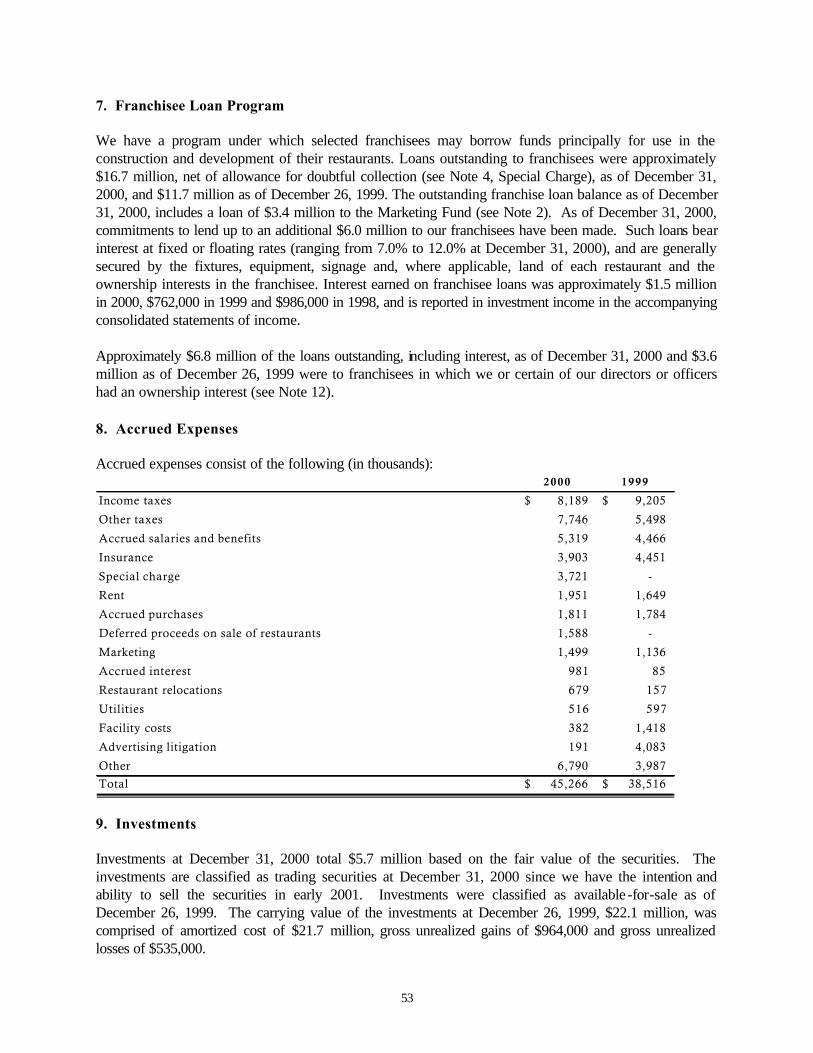
53
7. Franchisee Loan Program We have a program under which selected franchisees may borrow funds principally for use in the construction and development of their restaurants. Loans outstanding to franchisees were approximately $16.7 million, net of allowance for doubtful collection (see Note 4, Special Charge), as of December 31, 2000, and $11.7 million as of December 26, 1999. The outstanding franchise loan balance as of December 31, 2000, includes a loan of $3.4 million to the Marketing Fund (see Note 2). As of December 31, 2000, commitments to lend up to an additional $6.0 million to our franchisees have been made. Such loans bear interest at fixed or floating rates (ranging from 7.0% to 12.0% at December 31, 2000), and are generally secured by the fixtures, equipment, signage and, where applicable, land of each restaurant and the ownership interests in the franchisee. Interest earned on franchisee loans was approximately $1.5 million in 2000, $762,000 in 1999 and $986,000 in 1998, and is reported in investment income in the accompanying consolidated statements of income. Approximately $6.8 million of the loans outstanding, including interest, as of December 31, 2000 and $3.6 million as of December 26, 1999 were to franchisees in which we or certain of our directors or officers had an ownership interest (see Note 12). 8. Accrued Expenses Accrued expenses consist of the following (in thousands):
2000 1999
Income taxes 8,189$ 9,205$
Other taxes 7,746 5,498
Accrued salaries and benefits 5,319 4,466
Insurance 3,903 4,451
Special charge 3,721 -
Rent 1,951 1,649
Accrued purchases 1,811 1,784
Deferred proceeds on sale of restaurants 1,588 -
Marketing 1,499 1,136
Accrued interest 981 85
Restaurant relocations 679 157
Utilities 516 597
Facility costs 382 1,418
Advertising litigation 191 4,083
Other 6,790 3,987
Total 45,266$ 38,516$
9. Investments Investments at December 31, 2000 total $5.7 million based on the fair value of the securities. The investments are classified as trading securities at December 31, 2000 since we have the intention and ability to sell the securities in early 2001. Investments were classified as available -for-sale as of December 26, 1999. The carrying value of the investments at December 26, 1999, $22.1 million, was comprised of amortized cost of $21.7 million, gross unrealized gains of $964,000 and gross unrealized losses of $535,000.
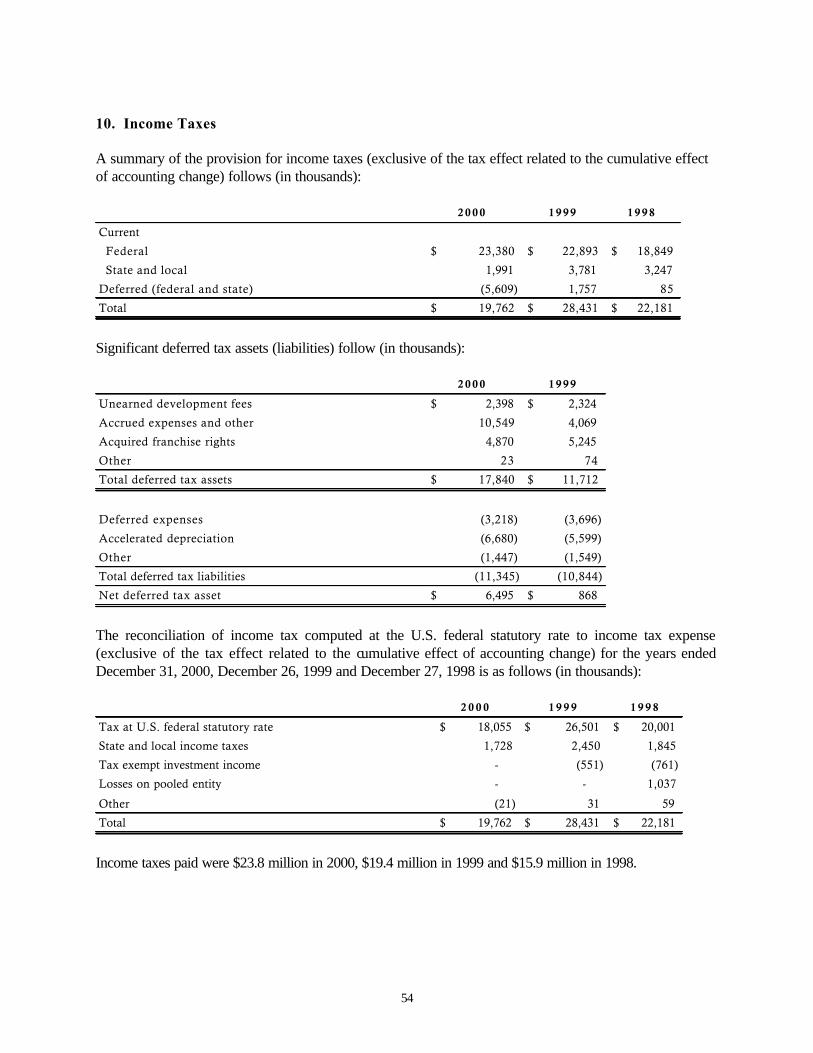
54
10. Income Taxes A summary of the provision for income taxes (exclusive of the tax effect related to the cumulative effect of accounting change) follows (in thousands):
2 0 0 0 1 9 9 9 1 9 9 8
Current
Federal 23,380$ 22,893$ 18,849$
State and local 1,991 3,781 3,247
Deferred (federal and state) (5,609) 1,757 85
Total 19,762$ 28,431$ 22,181$
Significant deferred tax assets (liabilities) follow (in thousands):
2 0 0 0 1 9 9 9
Unearned development fees 2,398$ 2,324$
Accrued expenses and other 10,549 4,069
Acquired franchise rights 4,870 5,245
Other 23 74
Total deferred tax assets 17,840$ 11,712$
Deferred expenses (3,218) (3,696)
Accelerated depreciation (6,680) (5,599)
Other (1,447) (1,549)
Total deferred tax liabilities (11,345) (10,844)
Net deferred tax asset 6,495$ 868$
The reconciliation of income tax computed at the U.S. federal statutory rate to income tax expense (exclusive of the tax effect related to the cumulative effect of accounting change) for the years ended December 31, 2000, December 26, 1999 and December 27, 1998 is as follows (in thousands):
2 0 0 0 1 9 9 9 1 9 9 8
Tax at U.S. federal statutory rate 18,055$ 26,501$ 20,001$
State and local income taxes 1,728 2,450 1,845
Tax exempt investment income - (551) (761)
Losses on pooled entity - - 1,037
Other (21) 31 59
Total 19,762$ 28,431$ 22,181$
Income taxes paid were $23.8 million in 2000, $19.4 million in 1999 and $15.9 million in 1998.
55
11. PJ America, Inc. Stock Warrant PJ America, Inc. (“PJ America”), a franchisee of Papa John’s, completed an initial public offering (“IPO”) of its common stock in October, 1996. In connection with the IPO, PJ America issued a warrant to us to purchase 225,000 shares of its common stock. The warrant is exercisable in whole or in part at any time within five years from the closing date of the IPO, and the purchase price of each share of common stock pursuant to the warrant is $11.25 per share (90% of the IPO price of $12.50 per share). The warrant was issued by PJ America to Papa John’s in consideration for the grant of rights to enter into development agreements for certain specified territories and the waiver by us of certain market transfer fees. Our agreement with PJ America anticipates that PJ America will pay standard development and franchise fees in connection with opening restaurants in the specified territories. We did not recognize income in connection with receipt of the warrant. The warrant is classified as an available-for-sale security, and accordingly, is stated at fair value in the consolidated balance sheets, with unrealized gains, net of tax, reported within comprehensive income. The fair value of the warrant was zero on December 31, 2000 and $956,000 on December 26, 1999, based upon the closing price per share of $5.56 and $15.50 for PJ America common stock on those respective dates, and is reported in investments in the accompanying consolidated balance sheets. The intrinsic value of the warrant (market value of PJ America common stock less the exercise price of the warrant) is considered a reasonable approximation of the fair value of the warrant. The warrant expires in October 2001. One of our directors is also a director of PJ America. 12. Related Party Transactions Certain of our officers and directors own equity interests in entities that operate and/or have rights to develop franchised restaurants. Certain of these affiliated entities have agreements to acquire area development rights at reduced development fees and also pay reduced initial franchise fees when restaurants are opened. Following is a summary of transactions and balances with affiliated entities (in thousands):
2 0 0 0 1 9 9 9 1 9 9 8
Revenues from affiliates:
Commissary sales 91,237$ 80,336$ 64,977$
Equipment and other sales 12,085 10,423 10,721
Franchise royalties 12,493 10,530 8,067
Franchise and development fees 955 1,574 1,372
Total 116,770$ 102,863$ 85,137$
Other income from affiliates 920$ 314$ 570$
Accounts receivable-affiliates 2,805$ 3,302$ 2,273$
Notes receivable-affiliates 6,813$ 3,590$ 4,741$
56
We paid $695,000 in 2000, $1.3 million in 1999 and $966,000 in 1998 for charter aircraft services provided by entities owned by certain directors and officers, including the Chief Executive Officer (CEO) of Papa John’s. 12. Related Party Transactions (continued) We advanced $183,000 in 2000, 1999 and 1998, in premiums for split-dollar life insurance coverage on the CEO for the purpose of funding estate tax obligations. Papa John’s and the officer share the cost of the premiums. The premiums advanced by us will be repaid out of the cash value or proceeds of the policies. The Marketing Fund made payments to an advertising agency, who in turn, made payments to an advertising agency who made payments to the CEO, for the use of his image and services in the production and use of certain electronic and print advertisements. In 2000, 1999 and 1998, the CEO earned $169,000, $189,000 and $24,000, respectively, for these services. The Company and two directors are parties to consulting agreements under which $203,000 in 2000, $120,000 in 1999 and $90,000 in 1998 were paid to the directors. During 2000, we acquired one restaurant from Superior Pizza, LLC in exchange for forgiveness of a $270,000 note payable to us. Prior to the acquisition, we were a 49% owner of Superior Pizza, LLC. This transaction was accounted for by the purchase method of accounting, whereby operating results subsequent to the acquisition date are included in our consolidated financial statements. During the fourth quarter of 1999, we sold five restaurants to Capital Pizza, Inc., for total consideration of $1.6 million ($1.4 million in cash and $200,000 as a note receivable) and acquired one restaurant from Capital Pizza, Inc. for total consideration of $190,000, in which we forgave a note payable to us. Capital Pizza, Inc. is owned by certain of our officers, including our former Vice Chairman and President who resigned in December 2000. This transaction was accounted for by the purchase method of accounting. During 1999, we were reimbursed a total of $626,000 by a franchise owned by the CEO and his wife, for advances made by the Company toward construction, design and equipment costs of a new prototype restaurant in Louisville, Kentucky. The advances were made during the design and construction phase of the project in consideration of the franchisee's willingness to permit the Company to test certain experimental and prototypical construction, design and equipment ideas in the restaurant. Construction of the restaurant was completed in February 1999. Following the final completion of the project and a replication of the facility in a second location in 1999, the franchisee repaid the actual costs that would have been incurred to construct the restaurant had final design and construction plans been available at the beginning of the project. The Company absorbed the remaining $245,000 in development costs associated with the project. Papa John’s Franchise Advisory Council has initiated a program that allows the cost of cheese to Papa John’s restaurants to be established on a quarterly basis. An independent franchisee-owned corporation, BIBP Commodities, Inc. (“BIBP”), was established effective December 27, 1999, through which the program is administered. BIBP purchases cheese at the market price and sells it to our distribution subsidiary, PJ Food Service, Inc. ("PJFS"), at a fixed quarterly price based in part upon historical average market prices. PJFS in turn sells cheese to Papa John’s restaurants (Company-owned and franchised) at a set quarterly price. Gains or losses incurred by BIBP, due to differences in the actual market price of cheese purchased and the established quarterly sales price, are a factor used to determine the price for
57
subsequent quarters. We have agreed to provide a $17.6 million loan facility to BIBP to fund cash deficits that may arise. No amounts were advanced under this facility as of December 31, 2000. During 2000, we purchased $136.6 million of cheese from BIBP (none in 1999 or 1998). 13. Lease Commitments We lease office, retail and commissary space under operating leases with terms generally ranging from three to five years and providing for at least one renewal. Certain leases further provide that the lease payments may be increased annually based on the Consumer Price Index. We also lease certain equipment under operating leases with terms ranging from three to seven years. Future minimum lease payments are as follows: 2001 - $19.1 million; 2002 - $16.8 million; 2003 - $14.6 million; 2004 - $12.1 million; 2005 - $9.1 million and thereafter - $29.5 million. Total rent expense was $14.5 million in 2000, $12.4 million in 1999, and $11.2 million in 1998. 14. Advertising Litigation In August 1998, Pizza Hut, Inc. filed suit against us in the United States District Court for the Northern District of Texas, claiming that our “Better Ingredients. Better Pizza.” slogan constituted false and deceptive advertising in violation of the Lanham Trademark Act. In November 1999, the jury returned a verdict that our “Better Ingredients. Better Pizza.” slogan was false and deceptive. On January 3, 2000, the court announced its judgment, awarding Pizza Hut $468,000 in damages and ordering us to cease all use of the “Better Ingredients. Better Pizza.” slogan. Under the judge’s order, we were to cease using the slogan in print and broadcast advertising, phase out printed promotional materials and other items containing the slogan and remove the slogan from restaurant signage, all according to deadlines specified by the court. We initially estimated that the pre-tax costs of complying with the court’s order and certain related costs could have approximated $12.0 to $15.0 million, of which $6.1 million was recorded as pre-tax charges against 1999 earnings. We filed an appeal of the verdict and the court’s order and a motion for stay of the court’s order pending outcome of the appeal. On January 21, 2000, the United States Court of Appeals for the Fifth Circuit granted a stay of the District Court judgment pending our appeal. Oral arguments related to the appeal were held on April 5, 2000. On September 19, 2000, the Fifth Circuit vacated the District Court's judgment in its entirety and remanded the case to the District Court for entry of judgment in favor of Papa John's. On December 18, 2000, Pizza Hut filed a Petition for Writ of Certiorari with the United States Supreme Court. On March 19, 2001, the United States Supreme Court denied Pizza Hut's Petition for Writ of Certiorari. For the 2000 fiscal year, we incurred an additional $1.0 million of pretax charges related to this issue. We are also subject to claims and legal actions in the ordinary course of business. We believe that all such claims and actions currently pending against us are either adequately covered by insurance or would not have a material adverse effect on us if decided in a manner unfavorable to us. 15. Share Repurchase and Common Equity Put Options The Papa John’s Board of Directors has authorized the repurchase of up to $275.0 million of common stock under a share repurchase program that began December 9, 1999, and runs through December 30, 2001. Funding for the share repurchase program is provided through a $200.0 million credit facility, operating cash flows and the liquidation of available investments, cash and cash equivalents.
58
Through December 31, 2000, a total of 7.6 million shares with an aggregate cost of $187.9 million and an average price of $24.67 per share were repurchased under this program and placed in treasury. Subsequent to year-end, an additional 319,500 shares with an aggregate cost of $7.2 million were repurchased. 15. Share Repurchase and Common Equity Put Options (continued) At December 31, 2000, 250,000 common equity put options were outstanding, all of which were sold in the third quarter 2000. The options expire at various dates through July 2001 and have exercise prices between $19.50 and $21.99. The $5.2 million total exercise price of the options outstanding is reflected in the balance sheet in common equity put options at December 31, 2000, and the related offset, net of premiums received, is recorded in treasury stock. 16. Stockholder Protection Rights Agreement On February 14, 2000, the Board of Directors of the Company adopted a Stockholder Protection Rights Agreement (the “Rights Plan”). Under the terms of the Rights Plan, one preferred stock purchase right was distributed as a dividend on each outstanding share of Papa John’s common stock held of record as of the close of business on March 1, 2000. The rights generally will not become exercisable until a person or group acquires beneficial ownership of 15% or more of the Company’s common stock in a transaction that is not approved in advance by the Board of Directors. The Company’s Founder and CEO, John Schnatter, who currently owns more than 25% of the outstanding common stock, will be excluded from operation of the Rights Plan unless (together with his affiliates and family members) he acquires more than 40% of the Company’s common stock. If the rights are triggered, then each right owned by a stockholder other than the unapproved acquirer entitles its holder to purchase shares of Company common stock at 50% of its market price. In addition, after the rights are triggered, if the Company is acquired by an unapproved acquirer in a merger or other business combination transaction, each right that has not previously been exercised will entitle its holder to purchase, at the right’s current exercise price, common shares of such other entity having a value of twice the right’s exercise price. The Company may redeem the rights for a nominal amount at any time prior to an event that causes the rights to become exercisable. 17. Stock Options In accordance with SFAS No. 123, “Accounting for Stock-Based Compensation” (SFAS 123), we have elected to follow Accounting Principles Board Opinion No. 25, “Accounting for Stock Issued to Employees” (APB 25), and related Interpretations in accounting for our employee stock options because, as discussed below, the alternative fair value accounting provided for under SFAS 123 requires the use of option valuation models that were not developed for use in valuing employee stock options. Under APB 25, because the exercise price of our employee stock options equals or exceeds the market price of the underlying stock on the date of grant, no compensation expense is recognized. We award stock options from time to time under the Papa John’s International, Inc. 1993 Stock Ownership Incentive Plan (the “1993 Plan”), the Papa John’s International, Inc. 1993 Non-Employee Directors Stock Option Plan (the “Directors Plan”) and the Papa John’s International, Inc. 1999 Team Member Stock Ownership Plan (the “1999 Plan”). Shares of common stock authorized for issuance are

59
6,400,000 under the 1993 Plan, 370,000 under the Directors Plan and 1,000,000 under the 1999 Plan. Options granted under all plans generally expire ten years from the date of grant and vest over one-to five-year periods, except for certain options awarded under a previous, multi-year operations compensation program that vested immediately upon grant.
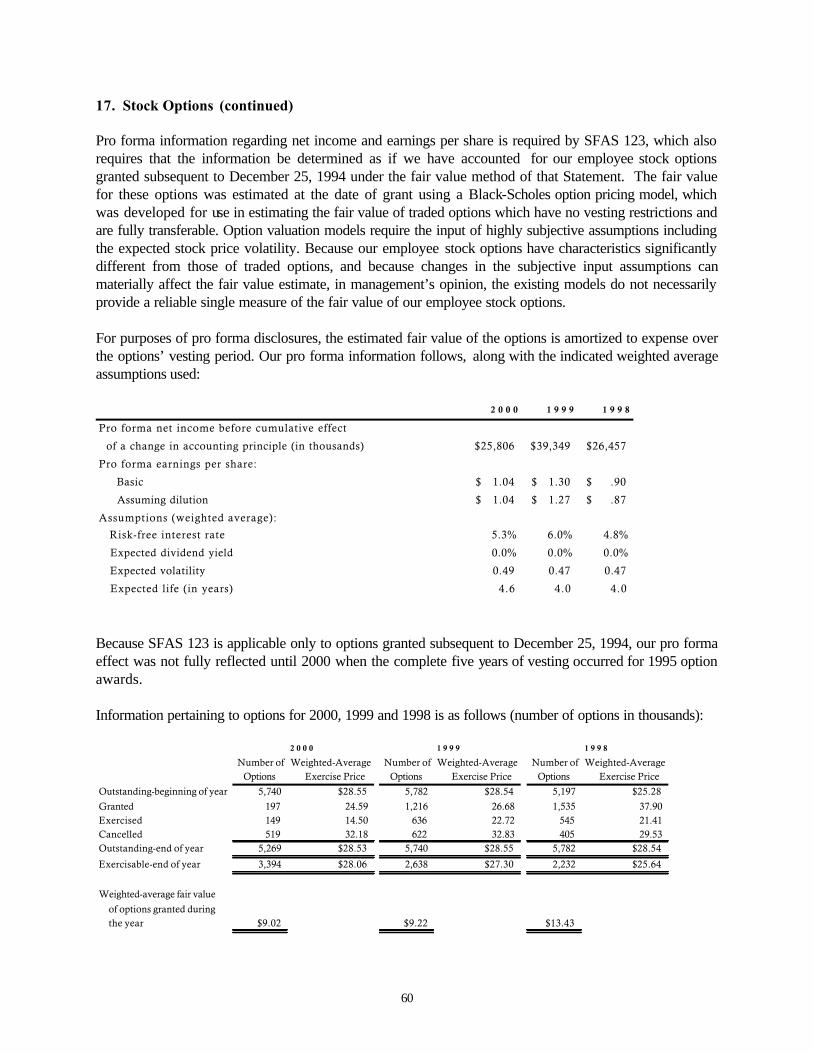
60
17. Stock Options (continued) Pro forma information regarding net income and earnings per share is required by SFAS 123, which also requires that the information be determined as if we have accounted for our employee stock options granted subsequent to December 25, 1994 under the fair value method of that Statement. The fair value for these options was estimated at the date of grant using a Black-Scholes option pricing model, which was developed for use in estimating the fair value of traded options which have no vesting restrictions and are fully transferable. Option valuation models require the input of highly subjective assumptions including the expected stock price volatility. Because our employee stock options have characteristics significantly different from those of traded options, and because changes in the subjective input assumptions can materially affect the fair value estimate, in management’s opinion, the existing models do not necessarily provide a reliable single measure of the fair value of our employee stock options. For purposes of pro forma disclosures, the estimated fair value of the options is amortized to expense over the options’ vesting period. Our pro forma information follows, along with the indicated weighted average assumptions used:
2 0 0 0 1 9 9 9 1 9 9 8
Pro forma net income before cumulative effect
of a change in accounting principle (in thousands) 25,806$ 39,349$ 26,457$
Pro forma earnings per share:
Basic 1.04$ 1.30$ .90$
Assuming dilution 1.04$ 1.27$ .87$
Assumptions (weighted average):
Risk-free interest rate 5.3% 6.0% 4.8%
Expected dividend yield 0.0% 0.0% 0.0%
Expected volatility 0.49 0.47 0.47
Expected life (in years) 4.6 4.0 4.0 Because SFAS 123 is applicable only to options granted subsequent to December 25, 1994, our pro forma effect was not fully reflected until 2000 when the complete five years of vesting occurred for 1995 option awards. Information pertaining to options for 2000, 1999 and 1998 is as follows (number of options in thousands):
2 0 0 0 1 9 9 9 1 9 9 8
Number of Weighted-Average Number of Weighted-Average Number of Weighted-AverageOptions Exercise Price Options Exercise Price Options Exercise Price
Outstanding-beginning of year 5,740 $28.55 5,782 $28.54 5,197 $25.28
Granted 197 24.59 1,216 26.68 1,535 37.90 Exercised 149 14.50 636 22.72 545 21.41 Cancelled 519 32.18 622 32.83 405 29.53 Outstanding-end of year 5,269 $28.53 5,740 $28.55 5,782 $28.54
Exercisable-end of year 3,394 $28.06 2,638 $27.30 2,232 $25.64
Weighted-average fair value
of options granted during the year $9.02 $9.22 $13.43
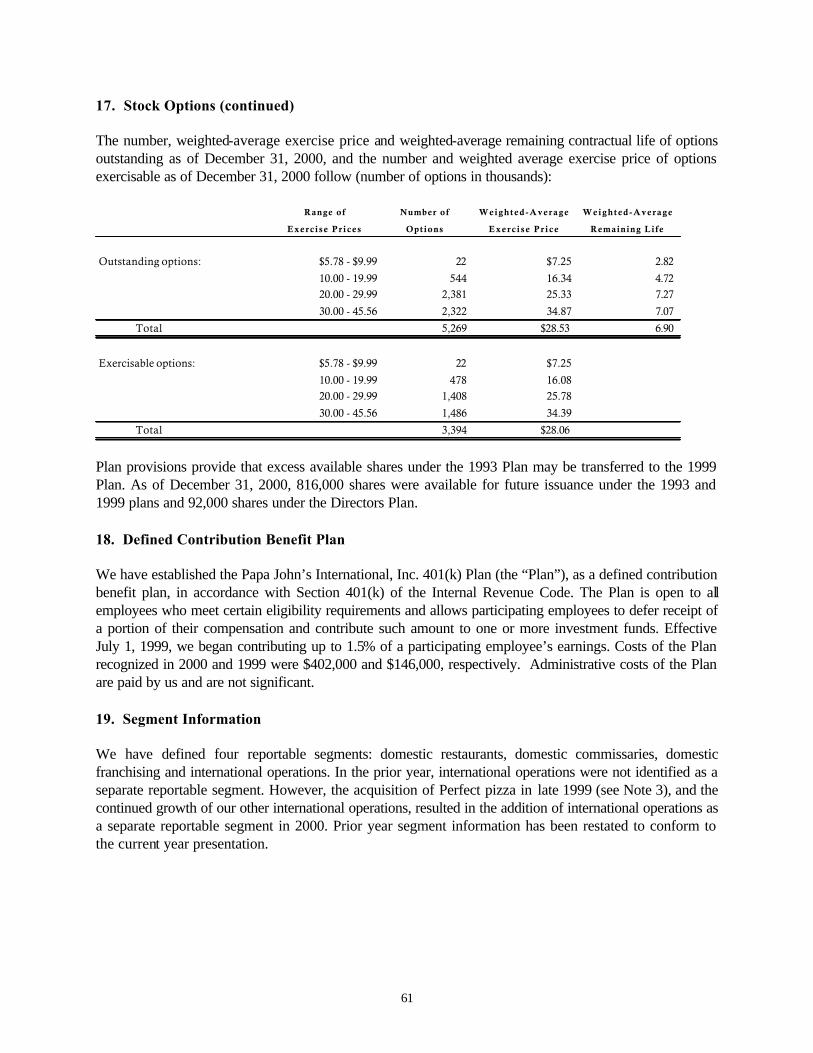
61
17. Stock Options (continued) The number, weighted-average exercise price and weighted-average remaining contractual life of options outstanding as of December 31, 2000, and the number and weighted average exercise price of options exercisable as of December 31, 2000 follow (number of options in thousands):
Range of Number of Weighted-Average Weighted-Average
Exerc i se Pr ices Options Exerc i se Pr i ce Remaining Life
Outstanding options: $5.78 - $9.99 22 $7.25 2.82
10.00 - 19.99 544 16.34 4.72 20.00 - 29.99 2,381 25.33 7.27
30.00 - 45.56 2,322 34.87 7.07
Total 5,269 $28.53 6.90
Exercisable options: $5.78 - $9.99 22 $7.25
10.00 - 19.99 478 16.08 20.00 - 29.99 1,408 25.78
30.00 - 45.56 1,486 34.39
Total 3,394 $28.06
Plan provisions provide that excess available shares under the 1993 Plan may be transferred to the 1999 Plan. As of December 31, 2000, 816,000 shares were available for future issuance under the 1993 and 1999 plans and 92,000 shares under the Directors Plan. 18. Defined Contribution Benefit Plan We have established the Papa John’s International, Inc. 401(k) Plan (the “Plan”), as a defined contribution benefit plan, in accordance with Section 401(k) of the Internal Revenue Code. The Plan is open to all employees who meet certain eligibility requirements and allows participating employees to defer receipt of a portion of their compensation and contribute such amount to one or more investment funds. Effective July 1, 1999, we began contributing up to 1.5% of a participating employee’s earnings. Costs of the Plan recognized in 2000 and 1999 were $402,000 and $146,000, respectively. Administrative costs of the Plan are paid by us and are not significant. 19. Segment Information We have defined four reportable segments: domestic restaurants, domestic commissaries, domestic franchising and international operations. In the prior year, international operations were not identified as a separate reportable segment. However, the acquisition of Perfect pizza in late 1999 (see Note 3), and the continued growth of our other international operations, resulted in the addition of international operations as a separate reportable segment in 2000. Prior year segment information has been restated to conform to the current year presentation.
62
19. Segment Information (continued) The domestic restaurant segment consists of the operations of all domestic Company-owned restaurants and derives its revenues from retail sales of pizza, breadsticks, cheesesticks and soft drinks to the general public. The domestic commissary segment consists of the operations of our regional dough production and product distribution centers and derives its revenues from the sale and distribution of food and paper products to domestic Company-owned and franchised restaurants. The domestic franchising segment consists of our franchise sales and support activities and derives its revenues from sales of franchise and development rights and collection of royalties from our domestic franchisees. The international operations segment consists of our Company-owned restaurants located in the United Kingdom, our Company-owned commissary operations located outside of the United States and our franchise sales and support activities, which derive revenues from sales of franchise and development rights and the collection of royalties from our international franchisees. All other business units that do not meet the quantitative thresholds for determining reportable segments consist of operations that derive revenues from the sale, principally to Company-owned and franchised restaurants, of restaurant equipment, printing and promotional items, risk management services, and information systems and related services used in restaurant operations. Generally, we evaluate performance and allocate resources based on profit or loss from operations before income taxes and eliminations. Certain administrative and capital costs are allocated to segments based upon predetermined rates or actual estimated resource usage. The accounting policies of the segments are the same as those described in the summary of significant accounting policies (see Note 2). We account for intercompany sales and transfers as if the sales or transfers were to third parties and eliminate the related profit in consolidation. Our reportable segments are business units that provide different products or services. Separate management of each segment is required because each business unit is subject to different operational issues and strategies. No single external customer accounted for 10% or more of our consolidated revenues.
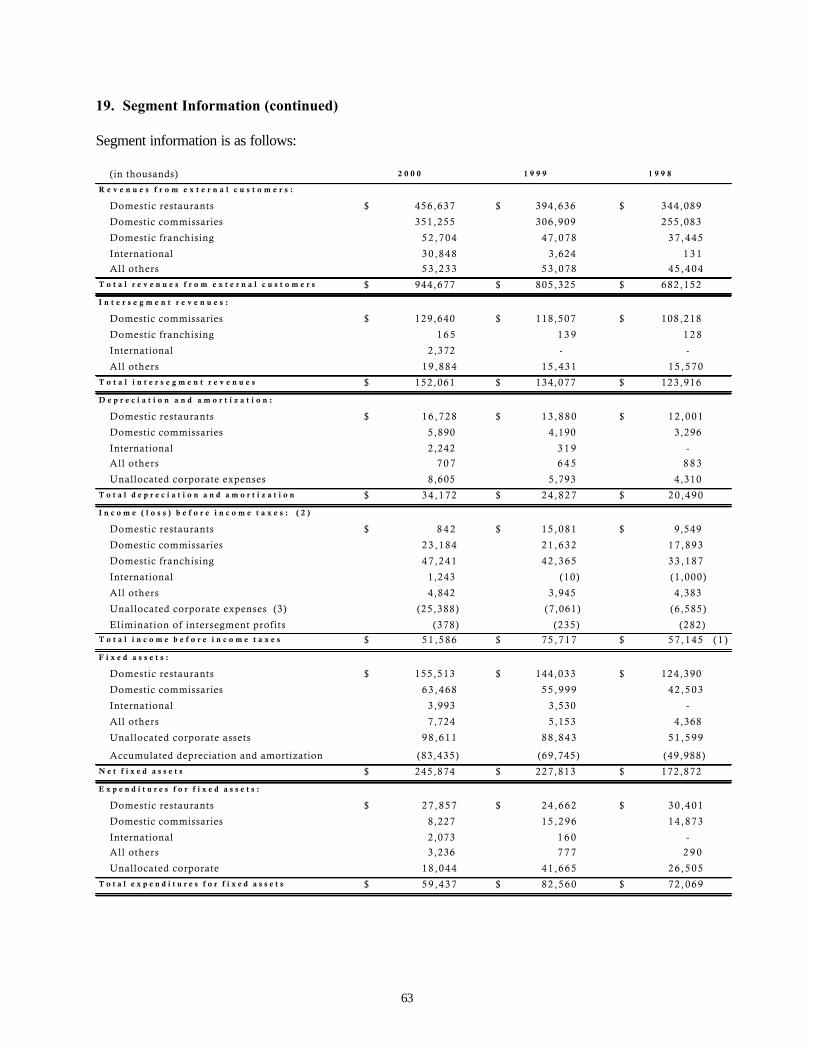
63
19. Segment Information (continued) Segment information is as follows:
(in thousands) 2 0 0 0 1 9 9 9 1 9 9 8
R e v e n u e s f r o m e x t e r n a l c u s t o m e r s :
Domestic restaurants 456,637$ 394,636$ 344,089$
Domestic commissaries 351,255 306,909 255,083
Domestic franchising 5 2 , 7 0 4 4 7 , 0 7 8 3 7 , 4 4 5
International 3 0 , 8 4 8 3,624 1 3 1
All others 5 3 , 2 3 3 5 3 , 0 7 8 4 5 , 4 0 4
T o t a l r e v e n u e s f r o m e x t e r n a l c u s t o m e r s 944,677$ 805,325$ 682,152$
I n t e r s e g m e n t r e v e n u e s :
Domestic commissaries 129,640$ 118,507$ 108,218$
Domestic franchising 1 6 5 1 3 9 1 2 8
International 2,372 - -
All others 1 9 , 8 8 4 1 5 , 4 3 1 1 5 , 5 7 0
T o t a l i n t e r s e g m e n t r e v e n u e s 152,061$ 134,077$ 123,916$
D e p r e c i a t i o n a n d a m o r t i z a t i o n :
Domestic restaurants 1 6 , 7 2 8$ 1 3 , 8 8 0$ 1 2 , 0 0 1$
Domestic commissaries 5,890 4,190 3,296
International 2,242 3 1 9 -
All others 7 0 7 6 4 5 8 8 3
Unallocated corporate expenses 8,605 5,793 4,310
T o t a l d e p r e c i a t i o n a n d a m o r t i z a t i o n 3 4 , 1 7 2$ 2 4 , 8 2 7$ 2 0 , 4 9 0$
I n c o m e ( l o s s ) b e f o r e i n c o m e t a x e s : ( 2 )
Domestic restaurants 8 4 2$ 1 5 , 0 8 1$ 9,549$
Domestic commissaries 2 3 , 1 8 4 2 1 , 6 3 2 1 7 , 8 9 3
Domestic franchising 4 7 , 2 4 1 4 2 , 3 6 5 3 3 , 1 8 7
International 1,243 (10) (1 ,000)
All others 4,842 3,945 4,383
Unallocated corporate expenses (3) (25,388) (7 ,061) (6 ,585)
Elimination of intersegment profits (378) (235) (282) T o t a l i n c o m e b e f o r e i n c o m e t a x e s 5 1 , 5 8 6$ 7 5 , 7 1 7$ 5 7 , 1 4 5$ ( 1 )
F i x e d a s s e t s :
Domestic restaurants 155,513$ 144,033$ 124,390$
Domestic commissaries 6 3 , 4 6 8 5 5 , 9 9 9 4 2 , 5 0 3
International 3,993 3,530 -
All others 7,724 5,153 4,368
Unallocated corporate assets 9 8 , 6 1 1 8 8 , 8 4 3 5 1 , 5 9 9
Accumulated depreciation and amortization (83,435) (69,745) (49,988)
N e t f i x e d a s s e t s 245,874$ 227,813$ 172,872$
E x p e n d i t u r e s f o r f i x e d a s s e t s :
Domestic restaurants 2 7 , 8 5 7$ 2 4 , 6 6 2$ 3 0 , 4 0 1$
Domestic commissaries 8,227 1 5 , 2 9 6 1 4 , 8 7 3
International 2,073 1 6 0 -
All others 3,236 7 7 7 2 9 0
Unallocated corporate 1 8 , 0 4 4 4 1 , 6 6 5 2 6 , 5 0 5
T o t a l e x p e n d i t u r e s f o r f i x e d a s s e t s 5 9 , 4 3 7$ 8 2 , 5 6 0$ 7 2 , 0 6 9$
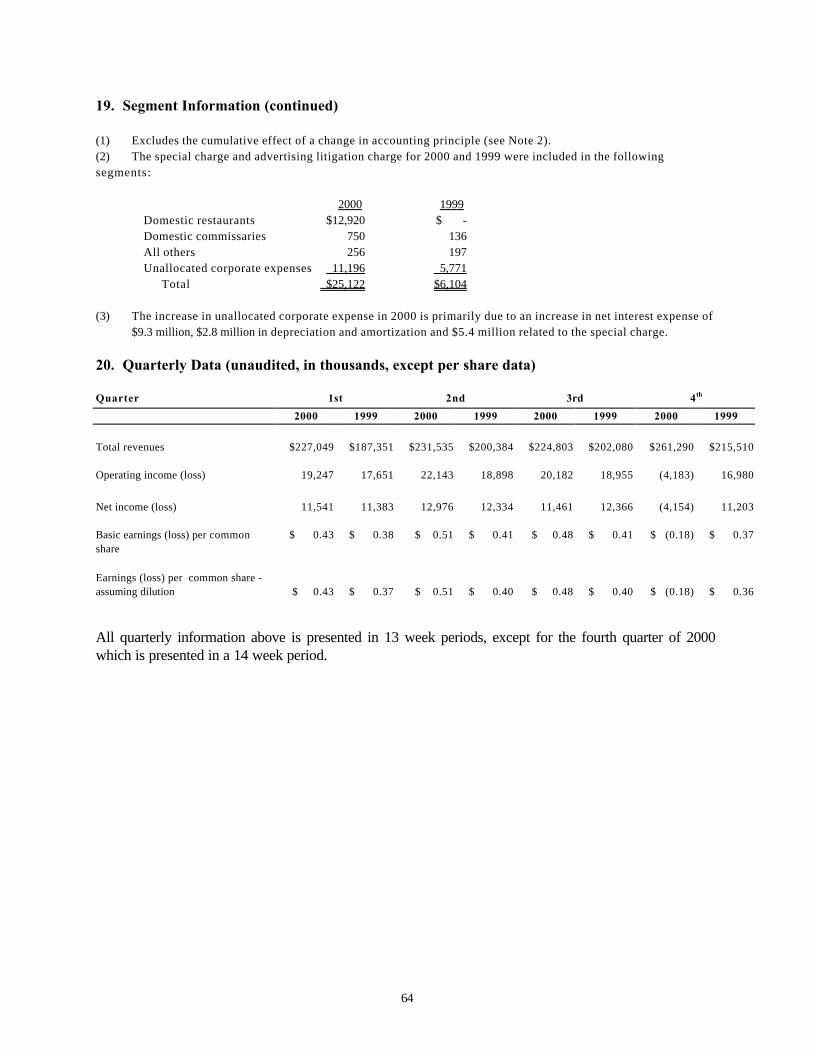
64
19. Segment Information (continued) (1) Excludes the cumulative effect of a change in accounting principle (see Note 2). (2) The special charge and advertising litigation charge for 2000 and 1999 were included in the following segments: 2000 1999 Domestic restaurants $12,920 $ - Domestic commissaries 750 136 All others 256 197 Unallocated corporate expenses 11,196 5,771 Total $25,122 $6,104 (3) The increase in unallocated corporate expense in 2000 is primarily due to an increase in net interest expense of
$9.3 million, $2.8 million in depreciation and amortization and $5.4 million related to the special charge.
20. Quarterly Data (unaudited, in thousands, except per share data) Quarter 1st 2nd 3rd 4th
2000 1999 2000 1999 2000 1999 2000 1999
Total revenues
$227,049 $187,351 $231,535 $200,384 $224,803 $202,080 $261,290 $215,510
Operating income (loss) 19,247 17,651 22,143 18,898 20,182 18,955 (4,183) 16,980
Net income (loss) 11,541 11,383
12,976 12,334 11,461 12,366 (4,154) 11,203
Basic earnings (loss) per common share
$ 0.43 $ 0.38 $ 0.51 $ 0.41 $ 0.48 $ 0.41 $ (0.18) $ 0.37
Earnings (loss) per common share - assuming dilution
$ 0.43
$ 0.37
$ 0.51
$ 0.40
$ 0.48
$ 0.40
$ (0.18)
$ 0.36
All quarterly information above is presented in 13 week periods, except for the fourth quarter of 2000 which is presented in a 14 week period.
65
Report of Management The consolidated financial statements appearing in this Annual Report have been prepared by management, which is responsible for their preparation, integrity and fair presentation. The statements have been prepared in accordance with accounting principles generally accepted in the United States and necessarily include some amounts that are based on management’s best estimates and judgments. Management is responsible for the system of internal controls over financial reporting at Papa John’s International, Inc. and its subsidiaries, a system designed to provide reasonable assurance regarding the preparation of reliable published financial statements. This system is augmented by written policies and procedures and the selection and training of qualified personnel. Management believes that its system of internal controls over financial reporting provides reasonable assurance that the financial records are reliable for preparing financial statements. The Audit Committee of the Board of Directors meets with the independent auditors and management periodically to discuss internal controls over financial reporting and other auditing and financial reporting matters. The Committee reviews with the independent auditors the scope and results of the audit effort. The Committee also meets with the independent auditors without management present to ensure that the independent auditors have free access to the Committee. The independent auditors are recommended by the Audit Committee of the Board of Directors and selected by the Board of Directors. Based upon their audit of the consolidated financial statements, the independent auditors, Ernst & Young LLP, have issued their Report of Independent Auditors, which follows. Report of Independent Auditors The Board of Directors and Stockholders Papa John’s International, Inc. We have audited the accompanying consolidated balance sheets of Papa John’s International, Inc. and subsidiaries as of December 31, 2000 and December 26, 1999, and the related consolidated statements of income, stockholders’ equity and cash flows for each of the three years in the period ended December 31, 2000. Our audits also included the financial statement schedule listed in the Index at Item 14(a). These financial statements and schedule are the responsibility of the Company's management. Our responsibility is to express an opinion on these financial statements and schedule based on our audits. We conducted our audits in accordance with auditing standards generally accepted in the United States. Those standards require that we plan and perform the audit to obtain reasonable assurance about whether the financial statements are free of material misstatement. An audit includes examining, on a test basis, evidence supporting the amounts and disclosures in the financial statements. An audit also includes assessing the accounting principles used and significant estimates made by management, as well as evaluating the overall financial statement presentation. We believe that our audits provide a reasonable basis for our opinion. In our opinion, the consolidated financial statements referred to above (appearing on pages 36 through 58 of this annual report) present fairly, in all material respects, the consolidated financial position of Papa John’s International, Inc. and subsidiaries at December 31, 2000 and December 26, 1999 , and the consolidated results of their operations and their cash flows for each of the three years in the period ended December 31, 2000, in conformity with accounting principles generally accepted in the United States. Also, in our opinion, the related financial statement schedule, when considered in relation to the financial statements taken as a whole, present fairly in all material respects the information set forth therein. As discussed in Note 2 to the consolidated financial statements, effective for fiscal year 1998, the Company adopted SOP 98-5, “Reporting on the Costs of Start-Up Activities.”
/s/ Ernst & Young LLP Louisville, Kentucky February 27, 2001, except for Note 14
66
as to which the date is March 19, 2001
Item 9. Changes in and Disagreements with Accountants on Accounting and Financial Disclosure None.
PART III Items 10, 11, 12 and 13. Directors and Officers of the Registrant; Executive Compensation;
Security Ownership of Certain Beneficial Owners and Management; and Certain Relationships and Related Transactions:
The information required by these items, other than the information set forth in this Report under Part I, “Executive Officers of the Registrant,” is omitted because we are filing a definitive proxy statement pursuant to Regulation 14A not later than 120 days after the end of the fiscal year covered by this Report which includes the required information. Such information is incorporated herein by reference.
PART IV Item 14. Exhibits, Financial Statement Schedules and Reports on Form 8-K (a)(1) Consolidated Financial Statements and Schedule: The following consolidated financial statements, notes related thereto and report of independent auditors are included in Item 8 of this Report: Consolidated Statements of Income for the years ended December 31, 2000, December 26, 1999 and December 27, 1998 Consolidated Balance Sheets as of December 31, 2000 and December 26, 1999 Consolidated Statements of Stockholders' Equity for the years ended December 31, 2000, December 26, 1999 and December 27, 1998 Consolidated Statements of Cash Flows for the years ended December 31, 2000, December 26, 1999 and December 27, 1998 Notes to Consolidated Financial Statements Report of Independent Auditors (a)(2) Consolidated Financial Statement Schedule: Schedule II Valuation and Qualifying Accounts (a)(3) Exhibits:
3.1 Our Amended and Restated Certificate of Incorporation. Exhibit 3.1 to our Registration Statement on Form S-1 (Registration No. 33-61366) is incorporated herein by reference.
67
3.2 Our Restated By-Laws. Exhibit 3.2 to our Registration Statement on Form S-1 (Registration No. 33-61366) is incorporated herein by reference.
3.3 Certificate of Amendment of Amended and Restated Certificate of Incorporation of Papa
John’s International, Inc. Exhibit 3 to our Quarterly Report on Form 10-Q for the quarterly period ended June 29, 1997, is incorporated herein by reference.
4.1 Specimen Common Stock Certificate. Exhibit 4.1 to our Annual Report on Form 10-K for
the fiscal year ended December 31, 1995 (Commission File No. 0-21660) is incorporated herein by reference.
4.2 Amended and Restated Certificate of Incorporation and Restated By-Laws (See 3.1, 3.2
and 3.3 above) is incorporated herein by reference. 10.1* Separation Agreement and Release between Papa John’s International, Inc. and E.
Drucilla Milby. 10.2* Consulting Agreement dated March 29, 1991, between Papa John’s and Richard F.
Sherman. Exhibit 10.4 to our Registration Statement on Form S-1 (Registration No. 33-61366) is incorporated herein by reference.
10.3* 1996 Papa John’s International, Inc. Executive Option Program. Exhibit 10.26 to our
Annual Report on Form 10-K for the fiscal year ended December 31, 1995 is incorporated herein by reference.
10.4* Papa John’s International, Inc. 1993 Stock Ownership Incentive Plan. Exhibit 10.2 to our
quarterly report on Form 10-Q for the quarter ended September 29, 1996 is incorporated herein by reference.
10.5* Amendment to Papa John’s International, Inc. 1993 Stock Ownership Incentive Plan.
Exhibit 10 to our quarterly report on Form 10-Q for the quarter ended June 29, 1997 is incorporated herein by reference.
10.6* Amendment to Papa John’s International, Inc. 1993 Stock Ownership Incentive Plan.
Exhibit 10 to our quarterly report on Form 10-Q for the quarter ended June 28, 1998 is incorporated herein by reference.
10.7* Amendment to Papa John’s International, Inc. 1993 Stock Ownership Incentive Plan.
Exhibit 10.1 to our quarterly report on Form 10-Q for the quarter ended June 27, 1999 is incorporated herein by reference.
10.8* Papa John’s International, Inc. 1993 Stock Option Plan for Non-Employee Directors.
Exhibit 10.3 to our quarterly report on Form 10-Q for the quarter ended September 29, 1996 is incorporated herein by reference.
10.9* Amendment to Papa John’s International, Inc. 1993 Non-Employee Directors Stock Option
Plan. Exhibit 10.2 to our quarterly report on Form 10-Q for the quarter ended June 27, 1999 is incorporated herein by reference.
68
10.10* Papa John’s International, Inc. 1999 Team Member Stock Ownership Plan Amended and
Restated as of October 20, 1999. Exhibit 10.9 to our Annual Report on Form 10-K for the fiscal year ended December 26, 1999 is incorporated herein by reference.
10.11 Loan Agreement among Mississippi Business Finance Corporation (acting for and on
behalf of the State of Mississippi), Bank of Mississippi (as Servicing Trustee) and PJFS of Mississippi, Inc. Exhibit 10.1 to our quarterly report on Form 10-Q for the quarter ended March 27, 1994 is incorporated herein by reference.
10.12 Lease dated May 14, 1993, between PJ Food Service, Inc. and Sample Properties relating
to our commissary facility in Raleigh, North Carolina. Exhibit 10.16 to our Registration Statement on Form S-1 (Registration No. 33-61366) is incorporated herein by reference.
10.13 Lease dated November 1, 1993, between PJ Food Service, Inc. and Jackson Developers,
LLC, a Missouri limited liability company, relating to our commissary and distribution facility in Jackson, Mississippi. Exhibit 10.18 to our Registration Statement on Form S-1 (Registration No. 33-73530) is incorporated herein by reference.
10.14 Lease dated January 3, 1996, between PJ Food Service, Inc. and Fraser, L.L.C. relating
to our commissary and distribution facility in Denver, Colorado. Exhibit 10.29 to our Annual Report on Form 10-K for the fiscal year ended December 31, 1995 is incorporated herein by reference.
10.15 Sublease dated January 16, 1997, between PJ Food Service, Inc. and Distribution
Unlimited, Inc. relating to our commissary and distribution facility opened in Rotterdam, New York. Exhibit 10.26 to our Annual Report on Form 10-K for the fiscal year ended December 28, 1997 is incorporated herein by reference.
10.16 Lease dated August 30, 1996, between PJ Food Service, Inc. and A. Terry Moss and Ira
E. White relating to our commissary and distribution facility opened in Des Moines, Iowa. Exhibit 10.29 to our Annual Report on Form 10-K for the fiscal year ended December 29, 1996 is incorporated herein by reference.
10.17 Lease dated November 27, 1997 by and between Papa John’s and SF Property
Investments, LLC, an Oregon limited liability corporation, relating to our commissary and distribution facility in Portland, Oregon. Exhibit 10.31 to our Annual Report on Form 10-K for the fiscal year ended December 28, 1997 is incorporated herein by reference.
10.18 First Lease Modification Agreement to Lease dated May 14, 1993 between PJ Food
Service, Inc., and Sample Properties relating to our commissary and distribution facility in Raleigh, North Carolina. Exhibit 10.34 to our Annual Report on Form 10-K for the fiscal year ended December 28, 1997 is incorporated herein by reference.
10.19 Lease dated December 6, 1998, between PJ Food Service, Inc. and The Buncher
Company relating to our commissary and distribution facility to be opened in Pittsburgh, Pennsylvania. Exhibit 10.38 to our Annual Report on Form 10-K for the fiscal year ended December 27, 1998, is incorporated herein by reference.
69
10.20 Acquisition Agreement dated March 29, 1999, with the Minnesota Pizza Company.
Exhibit 10.1 to our quarterly report on Form 10-Q for the quarter ended March 28, 1999 is incorporated herein by reference.
10.21 Agreement for the Sale and Purchase of the Entire Issued Share Capital of Perfect Pizza
Holdings Limited Between Geoffrey Street and Others and Papa John’s (UK) Limited and Papa John’s International, Inc. dated November 29, 1999. Exhibit 10.24 to our Annual Report on Form 10-K for the fiscal year ended December 26, 1999 is incorporated herein by reference.
10.22 Credit Agreement by and among Papa John’s International, Inc. and The Banks Party
Hereto and Bank One, Indiana, NA, As Syndication Agent and PNC Bank, National Association, As Lender Arranger and Administrative Agent dated as of March 17, 2000. Exhibit 10.25 to our Annual Report on Form 10-K for the fiscal year ended December 26, 1999 is incorporated by reference.
10.23 Second Amendment to Credit Agreement by and among Papa John’s International, Inc.
and The Guarantors Party Hereto and the Banks Party Hereto and Bank One, Indiana, NA, as Syndication Agent and PNC Bank, National Association, as Lead Arranger and Administrative Agent and dated as of October 30, 2000. Exhibit 10.1 to our quarterly report on Form 10-Q for the quarter ended September 24, 2000 is incorporated herein by reference.
10.24 Letter between Papa John’s International, Inc. and Bank One, Indiana, N.A. governed by
the International Swaps and Derivatives Association, Inc. Master Agreement dated February 22, 2000. Exhibit 10.26 to our Annual Report on Form 10-K for the fiscal year ended December 26, 1999 is incorporated herein by reference.
10.25 Secured Loan Agreement entered into as of December 27, 1999, by and between BIBP
Commodities, Inc. and Capital Delivery, Ltd. Exhibit 10.1 to our quarterly report on Form 10-Q for the quarter ended March 26, 2000 is incorporated herein by reference.
10.26 Promissory Note dated December 27, 1999, by BIBP Commodities, Inc. Exhibit 10.2 to
our quarterly report on Form 10-Q for the quarter ended March 26, 2000 is incorporated herein by reference.
10.27 Stockholder Protection Rights Agreement dated February 14, 2000, by and between Papa
John’s International, Inc. and National City Bank, as Rights Agent (including the form of Certificate of Designation of Preferences and Rights and the form of Rights Certificate). Exhibit 4 of our Form 8-A dated February 16, 2000 is incorporated herein by reference.
21 Subsidiaries of the Company: (a) Papa John’s USA, Inc., a Kentucky corporation (b) PJ Food Service, Inc., a Kentucky corporation
(c) PJFS of Mississippi, Inc., a Mississippi corporation
70
(d) PJ Food Service Canada, Inc., a Canadian corporation (e) Papa John’s Support Services, Inc., a Kentucky corporation (f) Risk Services Corp., a Kentucky corporation (g) Capital Delivery, Ltd., a Kentucky corporation
(h) RSC Insurance Services Ltd., a Bermuda corporation (i) Papa John’s Online LLC, a Kentucky
corporation (j) Papa John’s (U.K.) Ltd., a United Kingdom corporation (k) Perfect Pizza Ltd., a United Kingdom corporation (l) Perfect Pizza Holdings, Ltd., a United Kingdom corporation
23 Consent of Ernst & Young LLP. 99.1 Cautionary Statements. __________________ *Compensatory plan required to be filed as an exhibit pursuant to Item 14(c) of Form 10-K. (b) Reports on Form 8-K
1. We filed a Current Report on Form 8-K dated December 13, 2000 attaching a press release dated December 12, 2000 announcing systemwide comparable sales increases for the four weeks ended November 19, 2000 and a revision to projected earnings per share for the fourth quarter ending December 31, 2000.
2. We filed a Current Report on Form 8-K dated December 22, 2000 attaching a press release
dated December 22, 2000 announcing that our President and Vice Chairman, Blaine Hurst, would leave the Company and our Board of Directors at the end of January 2001.
(c) Exhibits
The response to this portion of Item 14 is submitted as a separate section of this report. (d) Consolidated Financial Statement Schedules The response to this portion of Item 14 is submitted as a separate section of this report.
71
SIGNATURES Pursuant to the requirements of Section 13 or 15(d) of the Securities Exchange Act of 1934, the Registrant has duly caused this report to be signed on its behalf by the undersigned, thereunto duly authorized. Date: March 23, 2001 PAPA JOHN'S INTERNATIONAL, INC. By: /s/ John H. Schnatter John H. Schnatter, Founder, Chairman of the Board, Chief Executive Officer, President and Director Pursuant to the requirements of the Securities Exchange Act of 1934, this report has been signed below by the following persons on behalf of the Registrant and in the capacities and on the dates indicated. Signature Title Date /s/ John H. Schnatter Founder, Chairman of the Board, Chief March 23, 2001 John H. Schnatter Executive Officer, President and Director (Principal Executive Officer) /s/ Charles W. Schnatter Senior Vice President, Chief Development March 23, 2001 Charles W. Schnatter Officer, Secretary, General Counsel and Director /s/ O. Wayne Gaunce Director March 23, 2001 O. Wayne Gaunce /s/ Jack A. Laughery Director March 23, 2001 Jack A. Laughery /s/ Michael W. Pierce Director March 23, 2001 Michael W. Pierce /s/ Wade S. Oney Director March 23, 2001 Wade S. Oney /s/ Richard F. Sherman Director March 23, 2001 Richard F. Sherman /s/ J. David Flanery Vice President of Finance and Corporate March 23, 2001 J. David Flanery Controller (Principal Accounting Officer)
72
EXHIBIT INDEX
Sequentially Exhibit Numbered Number Description of Exhibit Page
10.1 Separation Agreement and Release between Papa John’s International, Inc. and E.
Drucilla Milby.
21 Subsidiaries of the Company 23 Consent of Ernst & Young LLP.
99.1 Cautionary Statements
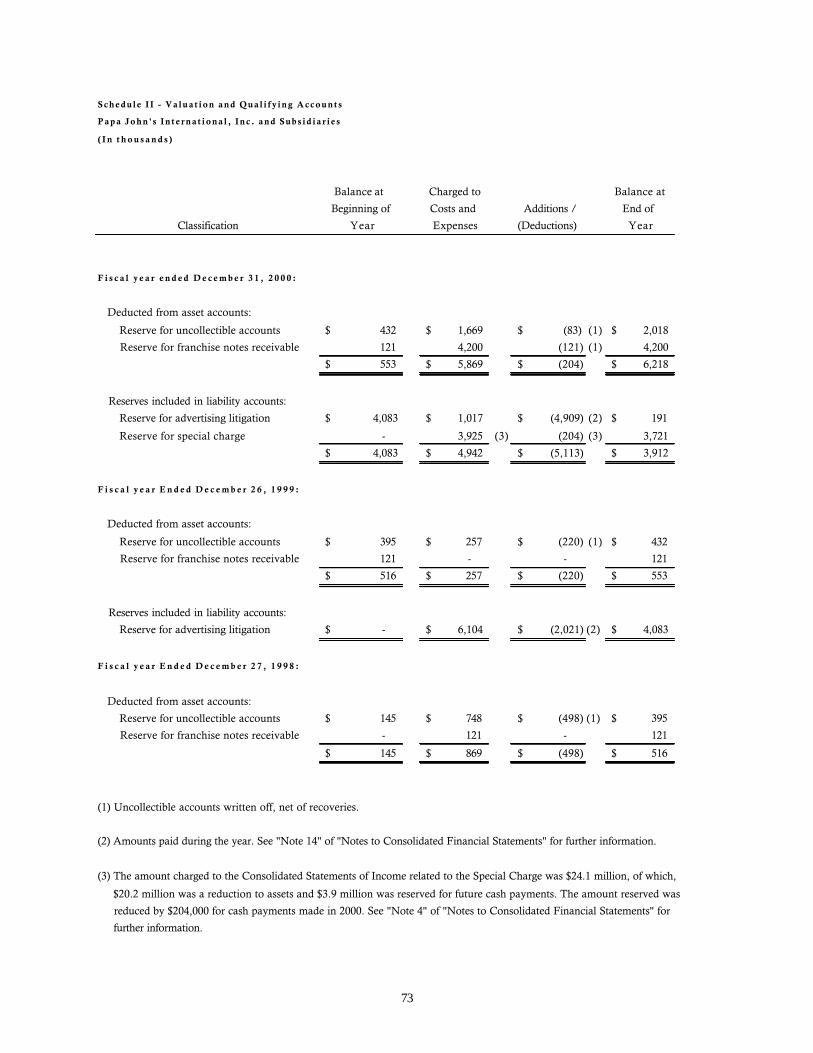
73
S c h e d u l e I I - V a l u a t i o n a n d Q u a l i f y i n g A c c o u n t s
P a p a J o h n ' s I n t e r n a t i o n a l , I n c . a n d S u b s i d i a r i e s
( I n t h o u s a n d s )
Balance at Charged to Balance at
Beginning of Costs and Additions / End of
Classification Year Expenses (Deductions) Year
F i s c a l y e a r e n d e d D e c e m b e r 3 1 , 2 0 0 0 :
Deducted from asset accounts:
Reserve for uncollectible accounts 432$ 1,669$ (83)$ (1) 2,018$
Reserve for franchise notes receivable 121 4,200 (121) (1) 4,200
553$ 5,869$ (204)$ 6,218$
Reserves included in liability accounts:
Reserve for advertising litigation 4,083$ 1,017$ (4,909)$ (2) 191$
Reserve for special charge - 3,925 (3) (204) (3) 3,721
4,083$ 4,942$ (5,113)$ 3,912$
F i s c a l y e a r E n d e d D e c e m b e r 2 6 , 1 9 9 9 :
Deducted from asset accounts:
Reserve for uncollectible accounts 395$ 257$ (220)$ (1) 432$
Reserve for franchise notes receivable 121 - - 121
516$ 257$ (220)$ 553$
Reserves included in liability accounts:
Reserve for advertising litigation -$ 6,104$ (2,021)$ (2) 4,083$
F i s c a l y e a r E n d e d D e c e m b e r 2 7 , 1 9 9 8 :
Deducted from asset accounts:
Reserve for uncollectible accounts 145$ 748$ (498)$ (1) 395$
Reserve for franchise notes receivable - 121 - 121
145$ 869$ (498)$ 516$
(1) Uncollectible accounts written off, net of recoveries.
(2) Amounts paid during the year. See "Note 14" of "Notes to Consolidated Financial Statements" for further information.
(3) The amount charged to the Consolidated Statements of Income related to the Special Charge was $24.1 million, of which,
$20.2 million was a reduction to assets and $3.9 million was reserved for future cash payments. The amount reserved was
reduced by $204,000 for cash payments made in 2000. See "Note 4" of "Notes to Consolidated Financial Statements" for
further information.

74

wouldn’t change and what Papa John’s is all about
focus on our commitment to quality ingredients
Our focus won’t change. We’ll continue to keep the
Main Thing the Main Thing – make a superior
quality traditional pizza. The great thing about a
challenge is it makes us stronger as a team. Focus
on being the number one pizza brand in the world.
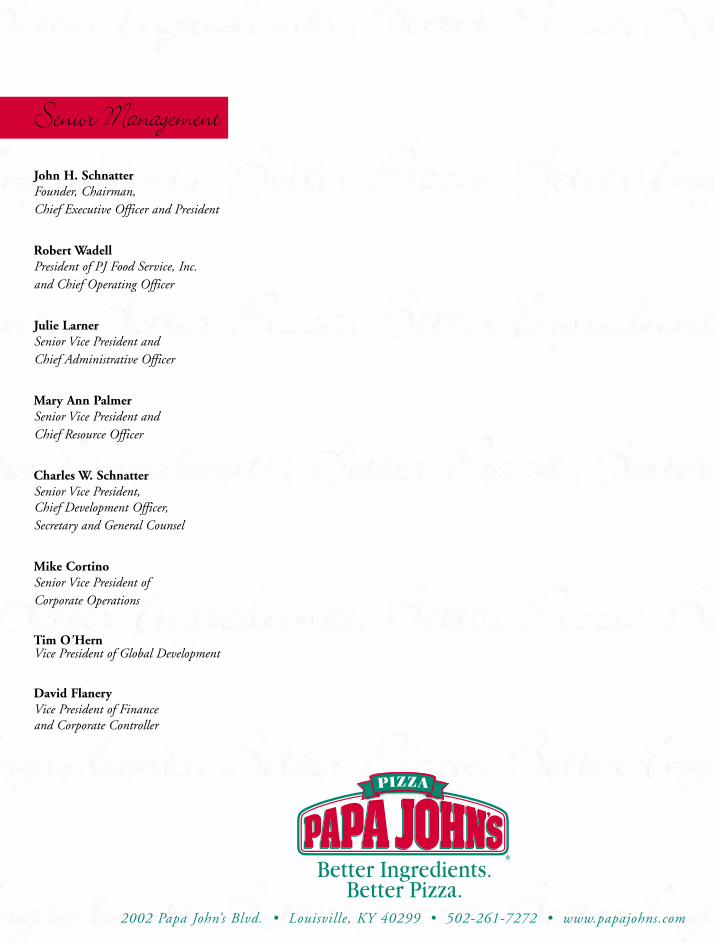
Senior Management
John H. SchnatterFounder, Chairman, Chief Executive Officer and President
Robert WadellPresident of PJ Food Service, Inc. and Chief Operating Officer
Julie LarnerSenior Vice President andChief Administrative Officer
Mary Ann PalmerSenior Vice President and Chief Resource Officer
Charles W. SchnatterSenior Vice President,Chief Development Officer,Secretary and General Counsel
Mike CortinoSenior Vice President of Corporate Operations
Tim O' HernVice President of Global Development
David FlaneryVice President of Finance and Corporate Controller
2002 Papa John’s Blvd. • Louisville, KY 40299 • 502-261-7272 • www.papajohns.com