Embed Size (px)
Citation preview

www.elsevier.com/locate/geoderma
Geoderma 133 (2
Sensing landscape level change in soil fertility following
deforestation and conversion in the highlands of Madagascar
using Vis-NIR spectroscopy
Tor-G. Vagen a,*, Keith D. Shepherd b, Markus G. Walsh b
a Norwegian University of Life Sciences, Department of Plant and Environmental Research, 1432 As, Norwayb World Agroforestry Centre (ICRAF), P.O. Box 30677, Nairobi 00100, Kenya
Received 7 September 2004; received in revised form 6 July 2005; accepted 27 July 2005
Available online 26 September 2005
Abstract
Research data on soil quality are scarce in Madagascar, despite the island’s widely recognized problems of soil and
environmental degradation. One of the major constraints to properly assessing current status, trends and processes of soil
degradation is the high level of costs involved when using conventional soil analytical methods. Previous studies have
demonstrated that visible-near-infrared (Vis-NIR) reflectance spectroscopy may permit rapid and cost effective analysis of
tropical soils that could provide new opportunities for farmers, land managers, local authorities and researchers in assessing and
managing soil quality. This study tested the potential of Vis-NIR soil spectral libraries for predicting and mapping soil
properties in the eastern highlands of Madagascar. Stable calibration models were developed for several key soil properties.
Cross-validated r2 values were soil organic carbon (SOC), 0.94; total nitrogen (TN), 0.96; and cation exchange capacity (CEC),
0.80. A spectral soil fertility index (SFI) was developed based on ten commonly used agronomic indicators of soil fertility. SFI
varied significantly with current and historic land use. The index was successfully calibrated to both soil reflectance measured
in the laboratory ( p =0.003) and Landsat TM reflectance ( p =0.003), which permitted mapping of the index.
D 2005 Elsevier B.V. All rights reserved.
Keywords: Madagascar; Deforestation; Soil quality; Soil fertility; Diffuse reflectance spectroscopy; Oxisols; Remote sensing
0016-7061/$ - see front matter D 2005 Elsevier B.V. All rights reserved.
doi:10.1016/j.geoderma.2005.07.014
* Corresponding author. Norwegian Centre for Soil and Envir-
onmental Research, Frederik A. Dahls vei 20, 1432 As, Norway.
Tel.: +254 20 7224000.
E-mail address: [email protected] (T.-G. Va gen).
1. Introduction
Basic data on land resources and soil quality in
particular are scarce in Madagascar, particularly
when considering the island’s diverse landforms
and soils, and the vast extent of severe soil degrada-
tion. Existing soil maps are generally based on the
digitized world soil map (FAO, 1995) at 1 :1,000,000
006) 281–294

T.-G. Vagen et al. / Geoderma 133 (2006) 281–294282
scale, and more detailed soil surveys have not been
conducted in significant areas of land degradation in
Madagascar. There are, however, exceptions such as
in certain important agricultural areas like the Vaki-
nakaratra region south of Antananarivo, where more
detailed soil maps (e.g., Raunet, 1981) are available.
In particular there is a lack of scientifically based
information on historical extents, rates and processes
of land degradation, which has led to an oversimpli-
fied understanding of present problems, often blam-
ing the practice of slash-and-burn (shifting)
agriculture for widespread degradation (Jarosz,
1993; Vagen, 2004). Two principal reasons for the
limited information on land degradation are (i) lim-
ited use of scientifically-rigorous statistical and sam-
pling designs at a landscape level, and (ii) the high
costs involved in large-scale soil sampling and ana-
lysis using standard procedures.
In light of these constraints, rapid and economical
soil analysis techniques are critical for farmers, land
managers, local authorities and researchers to be able
to utilize soil testing to its full potential in assessing
and managing soil quality. Visible-near-infrared
reflectance (Vis-NIR) spectroscopy is a nondestruc-
tive analytical technique where the interactions
between incident light and a materialTs surface are
studied (Chang et al., 2001; Shepherd and Walsh,
2004). The technique is simple, rapid, needs very little
sample preparation, and is widely used in pharmaceu-
tical, petrochemical and other industries and in grain
and forage quality assessments.
The Vis-NIR spectra are influenced not only by the
chemistry of a material, but also by its physical struc-
ture. They are directly influenced by combinations
and overtones of fundamental molecular absorptions
for organic functional groups found in the mid infra-
red region, and their potential use in analysis of soil
organic carbon (SOC) content has been demonstrated
in a number of studies (Ben-Dor and Banin, 1995;
Couillard et al., 1997; Shepherd and Walsh, 2002).
Water, particle size, surface properties, total carbon
(C), total nitrogen (N), texture, moisture content and
aggregation are often considered primary soil proper-
ties due to their direct influence on Vis-NIR spectra.
However, previous studies have shown that near-
infrared spectra can also predict soil properties not
theoretically related to near-infrared light, if these
properties are correlated with any of the primary soil
properties mentioned above (Fritze et al., 1994; Ben-
Dor and Banin, 1995; Chang et al., 2001).
Overlaps of weak overtones and fundamental
vibrational bands make Vis-NIR spectra difficult to
interpret directly (Wetzel, 1983). For quantitative ana-
lysis, multivariate calibration is therefore required. A
number of different calibration techniques are avail-
able and have been applied when relating measured
NIR spectra to measured values of soil properties. The
choice of calibration technique will depend on the
application of the data. Principal components regres-
sion (PCR), partial least squares regression (PLSR),
stepwise multiple-linear regression, locally weighted
regression and artificial neural networks are the most
common (Wise et al., 2003).
Indicators of soil quality are still widely debated
among soil scientists (Doran and Jones, 1996; Gre-
gorich and Carter, 1997; Letey et al., 2003), mainly
due to the complexity involved in integrating various
soil properties into indices of soil quality and differ-
ential effects of soil management on different soil
properties. Several authors have questioned the viabi-
lity of institutionalizing soil quality as a defined para-
meter in soil science (Sojka and Upchurch, 1999;
Letey et al., 2003; Sanchez et al., 2003) particularly
since significant questions remain, making the con-
cept illusive and value laden. Doran and Jones (1996)
proposed a minimum data set of physical, chemical,
and biological indicators for screening the quality (or
health) of soils, which included texture, depth of soil
rooting, infiltration and bulk density, water holding
capacity (physical), soil organic matter, pH, electrical
conductivity, extractable N, P and K (chemical),
microbial biomass C and N, potentially mineralisable
N, and soil respiration (biological). Others have pro-
posed similar indicators and systems where soils are
given scores (e.g., 1–5) based on SOC content, pH
and other soil properties and yet others have devel-
oped soil quality (or health) cards based on farmer–
scientist collaboration.
One of the major constraints in the two former
approaches is the difficulties involved in comparing
different studies since all of the soil properties
involved may not be available, often due to the
level of costs involved as discussed earlier, and the
problem of setting standard norms for soil quality
indicators (Letey et al., 2003). Sanchez et al. (2003)
used the term bmeasure everythingQ for these

T.-G. Vagen et al. / Geoderma 133 (2006) 281–294 283
approaches, which stem largely from what Sojka and
Upchurch (1999) labelled as the bMollisol-centricQsoil quality paradigm, and questioned its relevance
in the tropics. The latter approach, on the other
hand, is largely qualitative and has limited scientific
validity. The challenge therefore remains to develop
quantitative approaches to understanding dynamic
changes in soil functional properties within the
broader context of integrated natural resource man-
agement in the tropics on a diverse range of soil types
and under a wide variety of land use systems.
Shepherd and Walsh (2002) proposed a spectral
library approach, whereby the variability of soils in
a study area is thoroughly sampled and spectrally
characterized. Soil properties or attributes of soil qual-
ity are measured on only a selection of soils, designed
to sample the variation in the spectral library, and then
calibrated to soil Vis-NIR reflectance. The soil quality
indicators can then be predicted for the entire library
and for new samples from the study area. New sam-
ples that classify as spectral outliers to the library are
characterized and added to the calibration library,
thereby increasing the predictive value of the library.
The approach can be extended to provide spectral
indicators of soil quality.
The objective of this study was to develop and test
a soil fertility index (SFI) based on Vis-NIR soil
spectral data and assess its performance for predicting
change in soil quality (or fertility) after deforestation
and conversion of forest to agricultural land and grass-
land in the eastern highlands of Madagascar. A sec-
ondary objective was to test whether the SFI could be
calibrated to remote sensing imagery and used to map
out SFI decline so that soil degradation problem areas
(hot-spots) in the highlands of Madagascar can be
rapidly identified.
2. Materials and methods
The study was conducted in an area to the north-
east and east of the town of Ambositra, in Fianarant-
soa province (478 25V 15W East and 208 34V 11W South
to 478 16V 04W East and 208 27V 02W South). Average
annual rainfall varies considerably, but generally
increases from about 1300 mm (Ambositra) to over
2000 mm (rainfall data from Fandriana) from west to
east, at the eastern escarpment. The topography is
hilly as are most of the highland plateau areas of
Madagascar, with the steep eastern escarpment drop-
ping off at the eastern end of the study area. Elevation
ranges from 1160 (eastern part) to 1420 (western part)
m. Soils are predominantly Oxisols (determined
through classification in field and the use of existing
soil maps).
Land use practices show great variation within the
area. In brief, western parts are largely intensively
cultivated to wetland rice (paddy) while shifting cul-
tivation (tavy) is practiced in eastern parts. A range of
different dryland crops are cultivated on slopes,
including dryland rice varieties, cassava, maize,
beans, potatoes, sweet potatoes, as well as vegetables
and fruit trees. In the eastern part of the study area
(near present forest margins) there are extensive Euca-
lyptus woodlands that supply the important wood
carving industry in Ambositra. Grassland savannas
are widespread, and grazed by the local Zebu cattle.
Grasslands are also periodically burnt before the onset
of rains, normally between September and November,
to provide fresh fodder for animals. According to
farmers in the study area, burning is also a means of
controlling pests such as rodents and used to fertilize
lower-lying paddy fields with ashes from the burnt
grass. Occasionally fire is also used as a means of
protest against authorities or as revenge.
2.1. Soil sampling and analysis
Topsoil (0–20 cm) samples were collected from
two small watersheds northeast and east of the town
of Ambositra, and from selected areas in a 26 km
transect between these watersheds, representing
chronosequences of deforestation and land use
change. The aim of the sampling strategy was to
collect representative data from various landforms,
land use types and areas with different conversion
histories thus covering as wide a range of soil condi-
tions as possible. The selection of sampling areas was
based on field surveys, interviews with farmers and
local experts, and satellite image analysis (land use
mapping) using Landsat (MSS, TM, ETM+) scenes
from 1972, 1985, 1992 and 2001 (Vagen, 2004). A
stratified random sampling design on land use was
used, where composites of 10 samples from plots of
approximately 30 by 30 m, corresponding to Landsat
ETM+ pixels, were collected. Soil samples were ran-

T.-G. Vagen et al. / Geoderma 133 (2006) 281–294284
domly collected within plots and mixed so that one
composite sample was collected from each plot to
avoid invalidating sample independence assumptions.
Collecting several samples from within the same field
may also inflate the validation performance due to
pseudo-replication from spatial correlation effects.
Soil sampling points were georeferenced to an accu-
racy of 0.3 m using a satellite differential GPS, except
samples from within the natural forest, where extre-
mely dense vegetation made this impossible. The
geographic locations of sampling points in the forest
catchment were therefore based on maps of the area,
aerial photographs and high resolution EROS-A satel-
lite images (ImageSat International N.V.).
Soil chemical analyses were conducted at the
FOFIFA (Centre National de la Recherche Appliquee
au Developpement Rural) soil analysis laboratory in
Antananarivo, Madagascar, using standard laboratory
procedures. Soil pH was determined in water and
KCl using a 1 :1 soil : solution ratio. Total carbon
(SOC) was analyzed using the Walkley–Black pro-
cedure (Jackson, 1958), while total nitrogen (TN)
and available phosphorus (P) were analyzed using
the Kjeldahl (Bremmer and Sulvaney, 1982) and
Bray-II (Bray and Kurtz, 1945) procedures, respec-
tively. Exchangeable Ca, Mg, K and cation exchange
capacity (CEC) were determined according to meth-
ods described in Jackson (1958) and Hesse (1972).
Particle size analysis (texture) was conducted using
the Modified Pipette Method (Gee and Bauder,
1986). Samples were pretreated with hydrogen per-
oxide (H2O2) to remove organic matter through oxi-
dation, and iron oxides were then removed by adding
20 ml of a 0.3 M sodium citrate and 84 g l�1
sodium bicarbonate solution.
2.2. Measurement of soil reflectance
Soil visible near-infrared reflectance was measured
relative to a white reference using a FieldSpec FR
spectroradiometer (Analytical Spectral Devices Inc.,
1997) at wavelengths from 0.35 to 2.5 Am with a
spectral sampling interval of 1 nm, as described by
Shepherd and Walsh (2002), but using the optical
setup described in Shepherd et al. (2003). Air-dried
soils were used for convenience and to control for the
effect of soil moisture on reflectance. Lobell and
Asner (2002) reported a nonlinear soil spectral depen-
dence on soil moisture, which was described well with
an exponential model. They also found that the short-
wave infrared (SWIR) spectral region was better sui-
ted for measuring volumetric moisture contents above
about 20% that the visible and near-infrared spectral
regions. Other studies report similar results, including
Ben-Dor et al., 1999; Muller and Decamps, 2000.
Reflectance spectra were recorded at two positions
by rotating the sample 908 to sample within dish
variation. This was done to minimize variation due
to different fields of view of the individual spectro-
meters in the instrument (Analytical Spectral Devices
Inc., 1997). The average of two spectra was recorded
at each position to minimize instrument noise. Before
reading each sample, reference spectra were recorded
using calibrated spectralon (LabsphereR, Sutton,
NH). Reflectance readings for each wavelength band
were expressed relative to the average of white refer-
ence readings.
2.3. Exploratory data analysis
To assess whether spectral calibrations of soil prop-
erties were due to interdependencies among soil vari-
ables, correlation coefficients and partial correlation
coefficients were computed, and conditional indepen-
dence assumptions among soil properties were tested
using graphical models (Edwards, 2000; Shepherd
and Walsh, 2002). A stepwise search procedure was
applied, starting with a saturated (full) model and
removing edges using maximum likelihood estimation
(backward selection). At each step of this procedure,
significance tests were used to decide whether to
include or exclude edges in the model. Soil properties
were transformed using Box–Cox (Box and Cox,
1964) transformations where necessary to obtain
approximately normal distributions. This procedure
finds the optimal power transformation to symmetry
of an empirical distribution.
2.4. Spectral prediction of soil properties
Soil laboratory analysis results were calibrated to
reflectance measurements using partial least squares
regression (PLSR), which is a multivariate data ana-
lysis technique commonly used in chemometrics
(Wise et al., 1990), and in a number of other disci-
plines. This method is related to PCA (Jackson, 1981;

T.-G. Vagen et al. / Geoderma 133 (2006) 281–294 285
Lay, 1997) in that a matrix of scores is obtained with
as many latent variables (LVs) as we want to retain in
the final regression. The calculation of scores is essen-
tially based on an empirical covariance matrix, how-
ever PLSR not only attempts to find factors that
capture variance in the data, but also achieve the
best correlation or fit with measured variables. This
method therefore occupies a middle-ground between
PCR and Multiple Linear Regression (MLR) (Wise et
al., 1990). System properties (soil variables in our
case) were regressed on the latent variable scores of
the measured variables (soil spectra in our case). This
is one way of addressing the problem of ill-condi-
tioned matrices (Martens and Naes, 1989; Hoskulds-
son, 1996). The number of latent variables (factors) to
retain in the PLS model was determined through
cross-validation to reduce the root mean square error
of prediction (RMSEP) (Naes et al., 1986) and thus
ensure stable and more parsimonious models by
excluding components that may be associated with
noise. A PLSR algorithm known as SIMPLS was
applied (de Jong, 1993; de Jong et al., 2001), where
the sample covariance matrix is deflated in every step
of the algorithm, maximizing covariance between
scores. The data were cross-validated by selecting
random samples, with 5 splits and 20 iterations.
Raw reflectance spectra were resampled by select-
ing every tenth-nanometer wavelength value from
0.35 to 2.5 Am, resulting in 216 bands. This procedure
not only reduces the volume of data for analysis, but
also matches the data more closely to the spectral
resolution of the instrument (3 to 10 nm). Spectral
bands 0.35 to 0.38, 0.97 to 1.01, and 2.46–2.50 Am,
respectively, were omitted from the data since they are
in regions of low signal to noise ratio or display noise
due to splicing between individual spectrometers in
the instrument (Analytical Spectral Devices Inc.,
1997), resulting in 202 bands for analysis.
A random subset of one third of the samples was
used for model validation, and the remaining two
thirds for model calibration. The reflectance spectra
were transformed by calculating their first derivatives
using a Savitzky–Golay filter, with 2nd order poly-
nomial smoothing and a window width of 20 nm.
Derivative transformation is known to minimize var-
iation in the data caused by variation in grinding and
optical setup (Martens and Naes, 1989), and is com-
monly applied in similar studies (Shepherd and Walsh,
2002). Light scattering effects are sources of irrelevant
noise in NIR spectra (Fearn, 1983; Naes et al., 1986).
A transformation technique known as multiplicative
scatter correction (MSC) was therefore applied to the
first derivative spectra to reduce this noise prior to
fitting the PLSR model by using the mean spectra of
the calibration data set as reference (see Wise et al.,
2003 for details). A number of other data transforma-
tion techniques are also available, including second
derivatives and orthogonal signal correction (OSC),
but these did not improve or decreased the accuracy of
prediction estimates and were therefore not applied in
this study. All computations were performed using the
PLS Toolbox (Eigenvector Research Inc.) for Matlab
version 6.5 (Mathworks, Inc.). Principal components
analysis (PCA) was applied for outlier detection.
2.5. Soil fertilty index development
When developing indices of soil fertility, the chal-
lenge is generally to integrate various soil properties
into single index values. In many studies (e.g., Karlen
et al., 1998; Lal, 1998; Diack and Stott, 2001), a
scoring system is applied based on agronomic refer-
ence values for different soil properties, and in some
cases certain soil properties (often SOC) are weighted
more heavily than others. However, one major pro-
blem in tropical soils is that robust reference values do
not exist (Sanchez et al., 2003) and the weighting of
soil properties or assignment of scores is therefore not
scientifically rigorous. Other approaches such as finite
mixture models (McLachlan and Peel, 2000) provide
an interesting niche between parametric and non-para-
metric approaches to statistical estimation and model-
ing heterogeneity in for example soil properties.
We used the expectation–maximization (EM) algo-
rithm as implemented in the MIM software package
(Edwards, 2000) to classify each soil sample into
poor, medium and good soil condition (SC) classes
or mixture components using data for 10 of the most
commonly used agronomic indicators of soil quality;
SC ¼ f�pH ; SOC; TN ;Av:P;Ca;Mg;K;CEC;
Clay; SiltgAll soil variables, except pH, were transformed
prior to analysis using Box–Cox transformation
(Box and Cox, 1964) to obtain approximately normal
distributions.

T.-G. Vagen et al. / Geoderma 133 (2006) 281–294286
The EM-algorithm is a general method for finding
the maximum-likelihood estimate (MLE) of the para-
meters of an underlying distribution from a given data
set when the data is incomplete or has missing values.
Details on the algorithm and various applications can
be found in Dempster et al. (1977) or Bilmes (1998).
In brief, the first step of the algorithm, the E-step,
consists of the calculation of conditional expectation;
Q hjh tð Þ� �
¼ etlogP x; yjhð Þjy; h tð Þb
¼XxaX
p xjy; h tð Þ� �
dlogp x; yjhð Þ ð1Þ
where x is the observed data, y is the unknown data,
h(t) are the current parameter estimates that were used
to calculate the expectation and h are the new para-
meters that we optimized to increase Q. A local lower
bound to the posterior distribution is constructed and
optimized thereby improving the estimate of the
unknowns in the M-step (Dellaert, 2002). This step
maximizes Q(h|h(t)) to obtain the next estimate;
h tþ1ð Þ ¼ argmaxh
Q hjh Tð Þ� �
ð2Þ
These steps are repeated as necessary resulting in
an increase in the log-likelihood making the algorithm
converge to a local maximum of the likelihood func-
tion. Once a suitable model has been selected, the
posterior probability for an observation (x =vector of
soil properties) belonging to a given component may
be calculated as:
Pr kjxð Þ ¼pkN x;
Xk
!
Xk
pkN x;Xk
! ð3Þ
and forms the basis for discriminating between com-
ponent (k) distributions.
To identify spectral wavebands that were diagnos-
tic of soil condition, a classification model using
decision trees (CART) was developed in Matlab ver-
sion 6.5 (Mathworks, Inc.). The soil condition classes
defined using the EM-algorithm were used as
response variables and 1st derivative soil spectra as
predictors. We started by growing a full tree, and then
computed a bresubstitutionQ estimate of the error var-
iance for the full tree, ending up with increasingly
homogenous subsets (pruned trees) that provided the
best separation of soil condition classes by cross
validation. This procedure also reduces the chance
of over-fitting and the effects of outliers or other
artifacts in the data are minimized. The best tree is
the one that has a residual variance that is no more
than one standard error above the minimum value
along the cross-validation line.
Logistic models are generalized linear models
(GLMs) that predict the binary or ordinal response
of categorical variables, and that are not subject to the
liabilities of multivariate regression in the presence of
qualitative variables (Aldrich and Nelson, 1984; Cam-
pling et al., 2002). Logistic regression models for
ordinal data are referred to as proportional odds mod-
els when cumulative logits are involved (McCullagh,
1980). We developed a soil fertility index (SFI) for
each sampling point using a proportional odds ordinal
(polychotomous) logistic regression model (LRM).
This procedure uses MLE to calculate logistic regres-
sion (logit) coefficients. The diagnostic spectral wave-
bands identified in the CART analysis were used as
predictors and SC as dependent variables. In polycho-
tomous LRMs with ordinal data, one value (typically
first or last) is designated as the reference category
(Y=h0) (Menard, 2001). We used natural forest soils
as reference and labeled the SC class corresponding to
these soils as bgoodQ and used this as our baseline.
The probability of membership in other categories
was then compared to the probability of membership
in this reference category. The SFI was computed as
the log–odds of soil condition classes;
SFI ¼ lnð P Yi ¼ 1ð Þ1� P Yi ¼ 1ð ÞÞ ¼ aþ
XKk¼1
bkXik ; ð4Þ
where P(Yi=1) is the probability of soil sample i
falling in SC class good, a is the intercept, bi the
fixed wavelength specific regression coefficients and
Xik the log–odds ratios for the SFI by Xik association.
In this study a proportional odds logistic regression
model (LRM) function developed by Harrell (2003)
for S-Plus (Insightful Inc.) was used. The diagnostic
spectral bands finally used in the SFI index were
selected based on significance tests in the LRM and
overall performance was assessed through resampling
validation of the logistic model (Harrell and Lee, 1985;
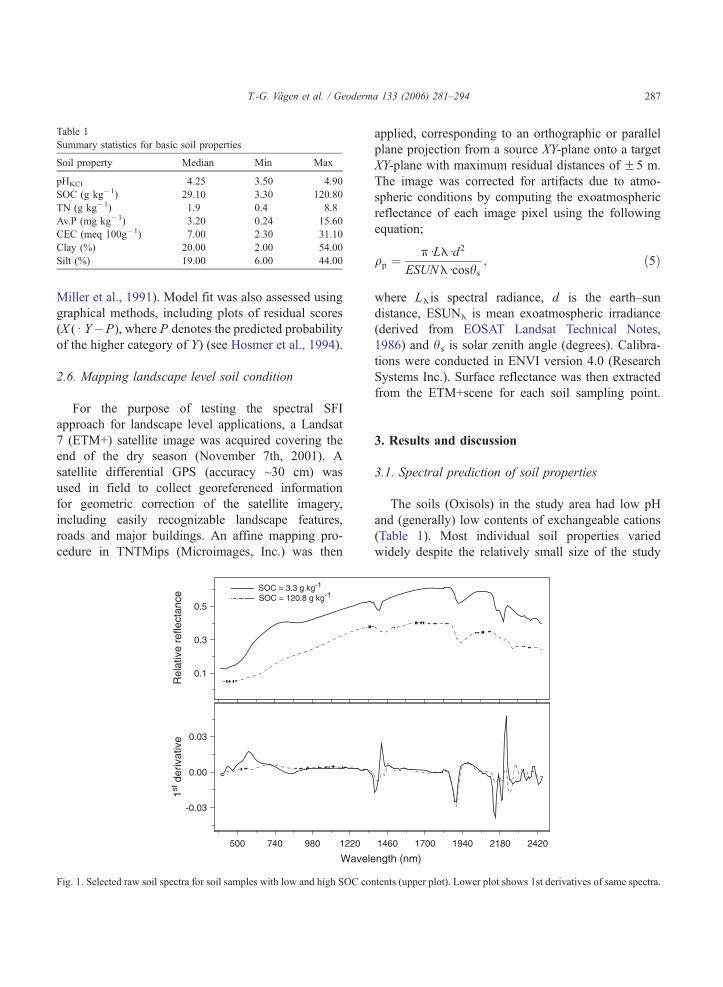
Table 1
Summary statistics for basic soil properties
Soil property Median Min Max
pHKCl 4.25 3.50 4.90
SOC (g kg�1) 29.10 3.30 120.80
TN (g kg�1) 1.9 0.4 8.8
Av.P (mg kg�1) 3.20 0.24 15.60
CEC (meq 100g�1) 7.00 2.30 31.10
Clay (%) 20.00 2.00 54.00
Silt (%) 19.00 6.00 44.00
T.-G. Vagen et al. / Geoderma 133 (2006) 281–294 287
Miller et al., 1991). Model fit was also assessed using
graphical methods, including plots of residual scores
(X (d Y�P), where P denotes the predicted probability
of the higher category of Y) (see Hosmer et al., 1994).
2.6. Mapping landscape level soil condition
For the purpose of testing the spectral SFI
approach for landscape level applications, a Landsat
7 (ETM+) satellite image was acquired covering the
end of the dry season (November 7th, 2001). A
satellite differential GPS (accuracy ~30 cm) was
used in field to collect georeferenced information
for geometric correction of the satellite imagery,
including easily recognizable landscape features,
roads and major buildings. An affine mapping pro-
cedure in TNTMips (Microimages, Inc.) was then
0.1
0.3
0.5SOC = 120.8 g kg-1SOC = 3.3 g kg-1
500 740 980 1220
Wavele
-0.03
0.00
0.03
1st d
eriv
ativ
eR
elat
ive
refle
ctan
ce
Fig. 1. Selected raw soil spectra for soil samples with low and high SOC con
applied, corresponding to an orthographic or parallel
plane projection from a source XY-plane onto a target
XY-plane with maximum residual distances of F5 m.
The image was corrected for artifacts due to atmo-
spheric conditions by computing the exoatmospheric
reflectance of each image pixel using the following
equation;
qp ¼kdLEdd2
ESUNEdcoshs; ð5Þ
where LE is spectral radiance, d is the earth–sun
distance, ESUNE is mean exoatmospheric irradiance
(derived from EOSAT Landsat Technical Notes,
1986) and hs is solar zenith angle (degrees). Calibra-
tions were conducted in ENVI version 4.0 (Research
Systems Inc.). Surface reflectance was then extracted
from the ETM+scene for each soil sampling point.
3. Results and discussion
3.1. Spectral prediction of soil properties
The soils (Oxisols) in the study area had low pH
and (generally) low contents of exchangeable cations
(Table 1). Most individual soil properties varied
widely despite the relatively small size of the study
1460 1700 1940 2180 2420
ngth (nm)
tents (upper plot). Lower plot shows 1st derivatives of same spectra.

Table 3
Prediction results for selected soil properties
Soil property RMSEC* RMSEP** r2 LVs
Cal Val
pHKCl 0.04 0.19 0.97 0.81 16
SOC (g kg�1) 6.00 8.40 0.94 0.92 10
TN (g kg�1) 0.32 0.64 0.96 0.93 10
Av.P (mg kg�1) 1.47 1.91 0.84 0.49 6
CEC (meq 100g�1) 2.55 3.12 0.80 0.68 8
Clay (%) 3.31 6.10 0.93 0.72 12
Silt (%) 2.50 6.45 0.84 0.40 12
* Calibration; ** validation.
T.-G. Vagen et al. / Geoderma 133 (2006) 281–294288
area (482 km2) (Table 1). The shape of the raw
spectral curves was similar to that described by Ben-
Dor et al., (1999) and Shepherd and Walsh (2002),
with prominent absorption features at 1400, 1900 and
2200 nm (Fig. 1). These features are associated with
clay minerals (Hunt, 1982; Ben-Dor et al., 1999) due
to clay lattice and free water OH effects at 1400 and
2200 nm and free water OH only at 2200 nm. Con-
tents of SOC ranged from 3.3 g C kg in degraded
cropland to 120.8 g C kg in natural forest areas (Table
1). The primary importance of SOC for soil reflec-
tance (albedo) was evident from the raw reflectance
spectra (Fig. 1), while derivative processing removed
this albedo effect, limiting the effect of SOC to a few
absorption features (Fig. 1).
The graphical model analysis revealed dependen-
cies among base cations, but exchangeable Ca and K
were conditionally independent of CEC, while a com-
bination of Ca, Mg, K and Al contents contributed to
CEC (multiple r2=0.58) (Vagen et al., in press). One
would normally expect Ca to make up the bulk of
CEC, but this is modified in the soils of the study area
due to strong acidity, which also explains the contri-
bution of Al to CEC (Haynes and Mokolobate, 2001).
The correlation between CEC and SOC was relatively
strong (r2=0.66) (Table 2), while available P was
correlated with pH, exchangeable K and Mg, and
clay content, but conditionally independent of
exchangeable Ca and SOC.
Stable calibrations (r2z0.80) were obtained for soil
physicochemical properties (Table 3). After cross-vali-
dation, 10 latent variables (containing approximately
94% of the variance) were retained in the calibration
model for SOC and TN (Table 3). This gave the lowest
root mean standard errors of calibration (RMSEC) and
Table 2
Partial correlation coefficients (upper triangle) and correlation coefficients (lower triangle) for selected soil properties (n =101)
Propertya pHKCl SOC Av. P Ca Mg K CEC Clay Silt
pHKCl – �0.04 �0.48 �0.01 0.11 �0.20 �0.14 �0.37 0.04
SOC �0.26 – 0.05 �0.15 �0.13 �0.06 0.82 �0.28 �0.49Av. P �0.46 0.34 – 0.17 0.31 �0.22 �0.19 �0.58 �0.10Ca �0.27 �0.03 0.47 – 0.61 �0.23 �0.03 0.06 �0.04Mg �0.36 0.24 0.50 0.71 — 0.55 0.37 0.13 �0.13K �0.25 0.08 0.07 0.25 0.58 – 0.03 �0.13 0.23
CEC �0.32 0.80 0.24 0.13 0.48 0.35 – 0.02 0.40
Clay 0.05 �0.54 �0.56 �0.05 �0.16 0.00 �0.34 – �0.01Silt 0.14 �0.42 �0.39 �0.09 �0.07 0.26 �0.09 0.36 –
a Box–Cox transformations were applied to all soil properties except pH.
root mean standard errors of prediction (RMSEP)
(Table 3). Increasing the number of latent variables
beyond 10, gave higher coefficients of correlation
(r2), but increased RMSEP thus reducing the stability
of the calibration models (i.e., leading to over-fitting)
(Wise et al., 2003). Prediction estimates of SOC and
TN were stable with similar regression curve estimates
for calibration and validation data sets (Fig. 2). The
levels of accuracy in SOC and TN predictions were
sufficient for the direct application of Vis-NIR spectral
analysis in measuring SOC and TN levels in the study
area. These results confirm the results of earlier studies
from East African soils (Shepherd and Walsh, 2002)
and show the potential for assessing SOC and TN
contents directly from Vis-NIR spectra.
Predictions of pH, available P and texture showed
somewhat poorer results when considering the r2 of
validation (Table 3 and Fig. 3), but prediction errors
were relatively low with a lower number of latent
variables retained for predictions of available P and
CEC than for SOC and TN (Table 3) (i.e., RMSEP
increased dramatically with more LVs). The calibra-

0 5 10 15
Av.P (mg kg-1) predicted
0
5
10
15
Av.
P (m
g kg
-1) m
easu
red
CalibrationValidation
0 10 20 30
CEC (meq 100 g-1)
0
10
20
30
CE
C (
meq
100
g-1
)
CalibrationValidation
Fig. 3. Calibration and validation results for SIMPLS predictions fo
Bray-II P and CEC (see Table 3 for details).
SOC (g kg-1) predicted
00 20 40 60 80 100 120
20
40
60
80
100
120
SO
C (
g kg
-1)
actu
al
Calibration Validation
TN (g kg-1) predicted
00 2 4 6 8
2
4
6
8
TN
(g
kg-1
) ac
tual
Calibration Validation
Fig. 2. Calibration and validation results for SIMPLS predictions of
SOC and TN (see Table 3 for details).
T.-G. Vagen et al. / Geoderma 133 (2006) 281–294 289
tion result for CEC was attributed mainly to the close
correlation with SOC. Clay content was inversely
associated with SOC content (Table 2), a relationship
that partly explained the extremely good calibration
results for clay. The calibration models for predictions
of available P and silt content are not stable (r2valb0.5)
(Fig. 3). Most of the soil samples in this study had
Bray-II P contents lower than 12 mg kg�1 (Table 1),
and the relatively narrow range in available P contents
may have had some influence on the prediction per-
formance. Bray-II P levels lower than between 12 and
20 mg P kg�1 are generally regarded as critical for
occurrence of P deficiency on acid soils under rice
cultivation (Dobermann and Fairhurst, 2000). Spectral
predictions may be sufficiently accurate to identify P
deficiency in acid soils, and this is an area which
should be explored further for screening P deficiency
in acid soils.
3.2. Soil condition and trend
The EM-classification of soils into soil condition
classes resulted in two dominant classes (poor and
r

5.0
4.8 2.1I
Table 4
Summary statistics and results of multiple comparison tests for soil
properties on soil condition classes
Soil variable Soil condition class
Poor
(n =42)
Average
(n =15)
Good
(n =44)
Mean SE Mean SE Mean SE
SOC (g kg�1) 16.70a 0.85 43.93b 4.60 55.72b 3.54
TN (g kg�1) 1.20a 0.10 2.70b 0.20 3.90c 0.20
P (mg kg�1) 2.40a 0.28 2.00a 0.38 6.40b 0.52
Ca (meq 100g�1) 0.26a 0.05 0.05a 0.01 0.54b 0.07
Mg (meq 100g�1) 0.21a 0.04 0.07a 0.01 0.37b 0.03
K (meq 100g�1) 0.12a 0.01 0.07b 0.00 0.14a 0.01
CEC (meq 100g�1) 5.11a 0.37 7.59a 0.80 11.76b 0.89
pH(KCl) 4.31a 0.02 4.64b 0.04 4.08c 0.03
pH(H2O) 4.63a 0.03 5.21b 0.06 4.44c 0.04
Silt (%) 22.6a 0.78 18.67ab 2.54 16.84b 0.77
Clay (%) 29.6a 1.37 15.73b 3.05 14.32b 1.18
Different letters between columns indicate significant difference
(a =0.05).
T.-G. Vagen et al. / Geoderma 133 (2006) 281–294290
good) with only 15 samples classified as average
(Table 4). The contents of SOC, TN, P, Ca, Mg and
CEC were significantly higher in soils classified as
good than in poor soils, while pH varied less but was
significantly different in all soil condition classes
(Table 4). Overall, the procedure worked well in
separating the soils of the study area into ordinal
soil condition classes (i.e., had high sensitivity and
specificity).
Ten diagnostic spectral wavebands were initially
identified as good discriminators on soil condition in
the CART analysis. Significance tests in the LRM
identified five final bands as having significant effects
on SC (Table 5). The logit coefficients in Table 5
indicate that increasing relative reflectance at 570,
1410, 2040 and 2390 nm reduce probability of good
Table 5
Diagnostic wavebands retained in development of spectral SFI,
showing LRM coefficient/parameter estimates and results of sig-
nificance tests
Wavelength (nm) Coefficient P SE
570 �332.4 0.0001 84.1
1410 �168.3 0.0412 82.4
1940 1359.3 0.0003 376.1
2040 �3213.7 0.0001 799.8
2390 �2261.5 0.0003 630.3
Intercept 6.3 0.0030 2.1
SC, while increasing relative reflectance at 1940 nm
increases probability of good SC.
The resulting SFI was highest for rainforest soils,
and in mixed fallow systems, while cultivated areas
varied more widely depending on time since conver-
sion (Fig. 4). Tavy areas showed SFI values between
about �1.3 and 6.2, while areas that had been under
long-term cultivation had significantly lower SFI
values (�9.3 to �1.04). Soil fertility declined rapidly
the first 3–4 years after conversion and increased in
mixed fallow systems (years 5, 7 and 10) (Fig. 5), and
the overall nutrient depletion in the first decade after
clearing was therefore generally moderate. The long
term trend was, however, a significant decrease in
SFI, independent of land use, with the lowest values
in cultivated, eucalyptus and wasteland areas more
than 50 years post-clearing.
The LRM analysis of surface reflectance from
the ETM+scene showed significant relationships
between SC and bands 1 (450 to 520 nm), 5 (1550
to 1750 nm) and 7 (2090 to 2350 nm) (Table 6). The
resulting SFI modelled directly from Landsat reflec-
tance corresponded well with the SFI modelled from
diagnostic Vis-NIR spectral bands, despite the fact
that the spectral response of ETM+image pixels
represented only 6 spectral bands and a mixture of
soil, vegetation, shade and so forth, while the latter
represented pure soil spectra. The spatial representa-
rainforestmixed fallow
cultivatedgrass
eucalyptuswasteland
Land Use (current)
-5.0
0.0-2.2 -2.8 -4.8 -5.0
SF
Fig. 4. SFI for the different land use types in the study area. Bars are
means, showing SE of means.

Natural forest 1 2 3 4 5 7 8 10 20 20-50 > 50
Time since conversion (years)
-5
-3
-1
1
3
5S
oil f
ertil
ity in
dex
(SF
I)
Fig. 5. Trends in SFI with time since conversion, showing means and standard errors of means.
T.-G. Vagen et al. / Geoderma 133 (2006) 281–294 291
tion of SFI showed higher values in natural forest
areas (Table 7), as expected given the dense vegeta-
tion cover in t areas. Paddy fields in valley bottoms
were clearly visible due to higher SFI than neighbour-
ing cultivated areas on slopes (Fig. 6 and Table 7).
Cultivated areas on sloping land had the lowest SFI
and showed symptoms of severe degradation. The
ability of the spatial representation of SFI to identify
areas with soil degradation is hifghly promising and it
may potentially be used in large area soil degradation
surveillance and monitoring frameworks.
Table 7
Summary statistics for SFI by land use classes (maximum likelihood
4. Conclusions
We have demonstrated the ability of multivariate
calibration techniques commonly used in chemometrics
Table 6
Proportional-odds model (LRM) coefficient estimates and summary
statistics for assessing spatial distribution of soil condition classes
based on Landsat reflectance
Variable Est. SE Z P
Intercept 26.60 5.545 4.80 0.0000
TM 1 �255.13 70.645 �3.61 0.0003
TM 5 �46.23 19.527 �2.37 0.0179
TM 7 61.67 20.801 2.96 0.0030
and other disciplines to predict basic soil physicochem-
ical properties from soil Vis-NIR reflectance data.
Stable calibration models were developed for SOC,
TN, CEC and clay contents for an area under a wide
variety of land use types and landscape forms in the
highlands of Madagascar. These rapid and cost effective
methods permit the use of statistical sampling frames in
landscapes. They therefore improve the basis for asses-
sing landscape level changes in soil quality (or fertility)
as a consequence of deforestation and land use change.
We are proposing the use of soil spectral response as
a direct measurement of soil functional attributes
because Vis-NIR spectra integrate several fundamental
soil properties such as SOC, particle size distribution
classification*)
Land use SFI (mean) SE N (pixels) Area (ha)
Natural forest 3.70 0.003 55,835 4515
Transition zone 0.64 0.007 37,099 3000
Cultivated �6.04 0.006 119,613 9672
Eucalyptus �0.42 0.007 92,572 7486
Grassland �3.20 0.004 198,434 16046
Paddy �3.39 0.009 73,959 5981
Recent burn 1.64 0.017 18,573 1502
* Overall accuracy=99.5%; Kappa coefficient=0.99 (Vagen, 2004).

Fig. 6. Spatial representation of SFI for study area. Darker colours indicate lower SFI (see legend). Coordinates are UTM zone 38S
(geographical coordinates are also shown).
T.-G. Vagen et al. / Geoderma 133 (2006) 281–294292
and surface charge characteristics. A soil fertility index
integrating ten commonly used agronomic indicators of
soil fertility was developed and successfully calibrated
to local conditions, allowing the spatial representation of
soil fertility based on remote sensing satellite imagery.
In the present study stable calibration models were
developed for several key soil properties, with cross-
validated r2 values of 0.94 for soil organic carbon
(SOC), 0.96 for total nitrogen (TN), and 0.80 for
cation exchange capacity (CEC). These results are
highly encouraging and form the basis for developing
regional and national scale frameworks for assessment
and monitoring of soil condition and land degradation
extents and trends in Madagascar. The use of a spa-
tially explicit SFI in combination with rapid and cost-
effective identification of major soil constraints
through the spectral library approach will allow the
identification of land degradation hot-spots and thus
help target quality soil management interventions.
Acknowledgements
We would like to thank the staff of the FOFIFA
soil laboratory in Antananarivo and the ICRAF soil
laboratory in Nairobi. We also thank FTM (Foiben-
Taosarintanin’i Madagasikara) for providing access
to maps and aerial photos used in correction of
satellite imagery and land use mapping, and to
Masy and Salmata Andrianorofanomezana for
invaluable assistance.
References
Aldrich, J.H., Nelson, F.D., 1984. Linear Probability, Logit,
and Probit Models. Series: Quantitative Applications in
the Social Sciences. SAGE Publications, Inc., London, UK.
95 pp.
Analytical Spectral Devices Inc., 1997. FieldSpeck User’s guide.
Analytical Spectral Devices Inc., Boulder, CO.

T.-G. Vagen et al. / Geoderma 133 (2006) 281–294 293
Ben-Dor, E., Banin, A., 1995. Near infrared analysis (NIRA) as a
rapid method to simultaneously evaluate several soil properties.
Soil Science Society of America Journal 59, 364–372.
Ben-Dor, E., Irons, J.R., Epema, G.F., 1999. Soil reflectance.
In: Rencz, N. (Ed.), Remote Sensing for the Earth Sciences:
Manual of Remote Sensing, vol. 3. John Wiley and Sons, New
York, pp. 111–188.
Bilmes, J.A., 1998. A gentle tutorial of the EM algorithm and its
application to parameter estimation for Gaussian mixture and
hidden Markov models. International Computer Science Insti-
tute, Berkeley CA, and Computer Science Division, Department
of Engineering and Computer Science, U.C. Berkeley. 15 pp.
Box, G.E.P., Cox, D.R., 1964. An analysis of transformations.
Journal of the Royal Statistical Society, 211–243 (discussion
244–252).
Bray, R.H., Kurtz, L.T., 1945. Determination of total, organic
and available forms of phosphorus in soils. Soil Science 64,
101–109.
Bremmer, J.M., Sulvaney, C.S., 1982. Total nitrogen. In: Page, A.L.
et al. (Eds.), Methods of Soil Analysis, Part 2. p. 595-624.
Agron. Mongr. 9. 2nd ed. ASA and SSSA, Madison, WI.
Campling, P., Gobin, A., Feyen, J., 2002. Logistic modeling to
spatially predict the probability of soil drainage classes. Soil
Science Society of America Journal 66, 1390–1401.
Chang, C.W., Laird, D.A., Mausbach, M.J., Hurburgh, C.R., 2001.
Near-infrared reflectance spectroscopy — principal components
regression analyses of soil properties. Soil Science Society of
America Journal 65, 480–490.
Couillard, A., Turgeon, A.J., Shenk, J.S., Westerhaus, M.O., 1997.
Near infrared reflectance spectroscopy for analysis of turf soil
profiles. Crop Science 37, 1554–1559.
de Jong, S., 1993. SIMPLS: an alternative approach to partial least
squares regression. Chemometrics and Intelligent Laboratory
Systems. Laboratory Information Management 18, 251–263.
de Jong, S., Wise, B.M., Ricker, N.L., 2001. Canonical partial least
squares and continuum power regression. Journal of Chemo-
metrics 15, 85–100.
Dellaert, F., 2002. The Expectation Maximization Algorithm. Col-
lege of Computing, Georgia Institute of Technology. Technical
Report No. GIT-GVU-02-20. 7 pp.
Dempster, A., Laird, N.M., Rubin, D., 1977. Mixtures densities,
maximum likelihood from incomplete data via the EM algo-
rithm. Journal of the Royal Statistical Society 39 (1), 1–38.
Diack, M., Stott, D.E., 2001. Development of a soil quality index
for the Chalmers soil series in the midwestern USA. CD-ROM.
West Lafayette. International Soil Conservation Organization
Conference Proceedings.
Dobermann, A., Fairhurst, T., 2000. Rice. Nutrient Disorders
and Nutrient Management. Handbook Series. Potash and
Phosphate Institute (PPI), Potash and Phosphate Institute
of Canada (PPIC) and International Rice Research Institute.
191 pp.
Doran, J.W., Jones, A.J. (Eds.), Methods for Assessing Soil Quality,
SSSA Special Publication No. 49. Soil Science Society of
America (SSSA), Madison, WI. 409 pp.
Edwards, D., 2000. Introduction to Graphical Modeling, 2nd edi-
tion. Springer-Verlag, New York.
EOSAT Landsat technical notes. August, 1986. 4300 Forbes Bou-
levard, Lanham, MD 20706, USA.
FAO, 1995. Digital Soil Map of the World and Derived Soil Proper-
ties. FAO, Rome.
Fearn, T., 1983. Misuse of ridge regression in the calibration of
a near infrared reflectance instrument. Applied Statistics 32,
73–79.
Fritze, H.P., Jarvinen, P., Hiukka, R., 1994. Near-infrared character-
istics of forest humus are correlated with soil respiration and
microbial biomass in burnt soil. Biology and Fertility of Soils
18, 80–82.
Gee, G.W., Bauder, J.W., 1986. Particle-size analysis. In: Page, A.L.
(Ed.), Methods of Soil Analysis, Part 1, Physical and Miner-
alogical Methods, Second edition. Agronomy, pp. 383–411.
Gregorich, E.G., Carter, M.R. (Eds.), Soil Quality for Crop Produc-
tion and Ecosystem Health. Elsevier Science Publishers,
Amsterdam. 448 pp.
Harrell, F.E., 2003. The design library for S-Plus version 6.x
(Functions available on the web at:). http://lib.stat.cmu.edu/S/
Harrell/.
Harrell, F.E., Lee, K.L., 1985. A comparison of the discrimina-
tion of discriminant analysis and logistic regression under
multivariate normality. In: Sen, P.K. (Ed.), Biostatistics: Statis-
tics in Biomedical, Public Health, and Environmental Sciences.
The Bernard G. Greenberg Volume. North-Holland, New York,
pp. 333–343.
Haynes, R.J., Mokolobate, M.S., 2001. Amelioration of Al toxicity
and P deficiency in acid soils by additions of organic residues: a
critical review of the phenomenon and the mechanisms
involved. Nutrient Cycling in Agroecosystems 59, 47–63.
Hesse, P.R., 1972. ATextbook of Soil Chemical Analysis. Chemical
Publishing Co., N.Y., pp. 91–105.
Hoskuldsson, A., 1996. Prediction Methods in Science and Tech-
nology. Thor Publishing, Denmark.
Hosmer, D.W., Hosmer, T., Lemeshow, S., le Cessie, S., 1994. A
Comparison of Goodness-of-Fit Tests for the Logistic Regres-
sion Model. Manuscript, School of Public Health, Univ. of
Mass, Amherst, USA.
Hunt, G.R., 1982. Spectroscopic properties of rocks and minerals.
In: Carmichael, R.S. (Ed.), Handbook of Physical Properties of
Rocks. CRC Press, Boca Raton, FL, pp. 295–385.
Jackson, M.L., 1958. Soil Chemical Analysis. Prentice-Hall, Inc.,
Englewood, N.J.
Jackson, J.E., 1981. Principal components and factor analysis.
Part 1—principal components. Journal of Quality Technology
13 (1).
Jarosz, L., 1993. Defining and explaining tropical deforestation:
shifting cultivation and population growth in colonial Madagas-
car (1896–1940). Economic Geography 69 (4), 366–379.
Karlen, D.L., Gardner, J.C., Rosek, M.J., 1998. A soil quality
framework for evaluating the impact of CRP. Journal of Produc-
tion Agriculture 11, 56–60.
Lal, R., 1998. Soil quality and sustainability. In: Lal, R., et al.,
(Eds.), Methods for Assessment of Soil Degradation. Advances
in Soil Science. CRC Press, Boca Raton, FL.
Lay, D.C., 1997. Linear Algebra and its Applications, 2nd ed.
Addison Wesley Longman, Inc., New York, USA.

T.-G. Vagen et al. / Geoderma 133 (2006) 281–294294
Letey, J., Sojka, R.E., Upchurch, D.R., Cassel, D.K., Olsen, K.R.,
Payne, W.A., Petrie, S.E., Price, G.H., Reginato, R.J., Scott,
H.D., Smethurst, P.J., Triplett, G.B., 2003. Deficiencies in the
soil quality concept and its application. Journal of Soil and
Water Conservation 58, 180–182.
Lobell, D.B., Asner, G.P., 2002. Moisture effects on soil reflectance.
Soil Science Society of America Journal 66, 722–727.
Martens, H., Naes, T., 1989. Multivariate Calibration. Wiley, Chi-
chester, UK.
McLachlan, G., Peel, D., 2000. Finite Mixture Models, Wiley Series
in Probability and Statistics. Applied Probability and Statistics.
John Wiley and Sons, Inc., New York.
McCullagh, P., 1980. Regression models for ordinal data. Journal of
Royal Statistical Society B 42 (2), 109–142.
Menard, S., 2001. Applied Logistic Regression Analysis. Series:
Quantitative Applications in the Social Sciences, 2nd edition
SAGE Publications, Inc., London, UK. 111 pp.
Miller, M.E., Hui, S.L., Tierney, W.M., 1991. Validation techni-
ques for logistic regression models. Statistics in Medicine 10,
1213–1226.
Muller, E., Decamps, H., 2000. Modelling soil moisture–reflec-
tance. Remote Sensing of Environment 76, 173–180.
Naes, T., Irgens, C., Martens, H., 1986. Comparison of linear
statistical methods for calibration of NIR instruments. Applied
Statistics 35 (2), 195–206.
Raunet, M., 1981. Esquisse morpho-pedologique de la region
Ankaratra-Itasy, echelle 1/600,000. CIRAD, Paris, France.
Sanchez, P.A., Palm, C.A., Buol, S.W., 2003. Fertility capability soil
classification: a tool to help assess soil quality in the tropics.
Geoderma 114, 157–185.
Shepherd, K.D., Walsh, M.G., 2002. Development of reflectance
libraries for characterization of soil properties. Soil Science
Society of America Journal 66, 988–998.
Shepherd, K.D., Walsh, M.G., 2004. Diffuse reflectance spec-
troscopy for rapid soil analysis. In: Lal, Rattan (Ed.), En-
cyclopedia of Soil Science. Published online by Marcel
Dekker 04/26/2004. http://www.dekker.com/servlet/product/
DOI/101081EESS120017436.
Shepherd, K.D., Palm, C.A., Gachengo, C.N., Vanlauwe, B., 2003.
Rapid characterization of organic resource quality for soil and
livestock management in tropical agroecosystems using near-
infrared spectroscopy. Agronomy Journal 95, 1314–1322.
Sojka, R.E., Upchurch, D.R., 1999. Reservations regarding the soil
quality concept. Soil Science Society of America Journal 63,
1039–1054.
Vagen, T.-G., 2004. Change in soil quality as related to deforestation
and land use change in the highlands of Madagascar. Ph.D.
thesis, Norwegian University of Life Sciences (UMB).
Vagen, T.-G., Andrianorofanomezana, M.-A.A., Andrianorofano-
mezana, S., in press. Deforestation and cultivation effects on
characteristics of Oxisols in the highlands of Madagascar. Geo-
derma.
Wetzel, D.I., 1983. Infrared reflectance analysis: sleeper
among spectroscopic techniques. Analytical Chemistry 55,
1165A–1176A.
Wise, B.M., Ricker, N.L., Veltkamp, D.J., Kowalski, B.R., 1990. A
theoretical basis for the use of principal components models for
monitoring multivariate processes. Process Control and Quality
1 (1), 41–51.
Wise, B.M., Gallagher, N.B., Bro, R., Shaver, J.M., 2003. PLS
Toolbox Version 3.0 for Use with Matlab. Eigenvector Research
Inc. 171 pp.