Embed Size (px)
Citation preview

Sensor-based Quality Monitoring of Nano-manufacturing Systems
Satish Bukkapatnam Ranga KomanduriOklahoma State University
Stillwater, OK
National Science Foundation Workshop on Research Challenges in Nanomanufacturing Systems
Feb 11‐12, 2007

Introduction
Quality assurance is a major challenge in nano‐manufacturing systems
• Micro-electronic circuits have sub-30nm feature size, >9 metallization layers, >108 nano-devices in a chip
• Stringent planarity of thin films needed for depth-of-focus ranges for sequential lithography process
• Wafer quality and yield depend on assuring uniformity and integrity of the 10-200nm thick films and structures
• Sensor-based monitoring of deposition, growth and planarizationof nano-films and structures desirable
Wong, 2002

Sensing of Nano-Manufacturing Processes
• Monitoring of nano-film/structure deposition and growth– Endpoint detection
• e.g., thickness and deposition rate monitoring (Buzea and Robbie2005)
– Size and fault detection• e.g., in-situ AFM, optical/laser scanning, pyrometer, surface photo
absorption, micro-balance
• Monitoring of nano-film planarization and asperity removal– Endpoint detection
• e.g., Optical, AE, electrical current, acoustic, load sensors (Bibby and Holland 1998, Saka 2004, Moore 2004, Mikhaylich 2004)
– Defect detection• e.g., Optical, AE, electrical current, load sensors (Tang et al. 1998,
Vasilopolous 2000, Surana 2000, Dennison 2004, Steckenrider 2001, Braun 1998, Chan et al. 2004, Xie et al. 2004)
Recent advances in wireless MEMS/NEMS sensor technologies, and nonlinear stochastic dynamics modeling offer new opportunities – localized and economical
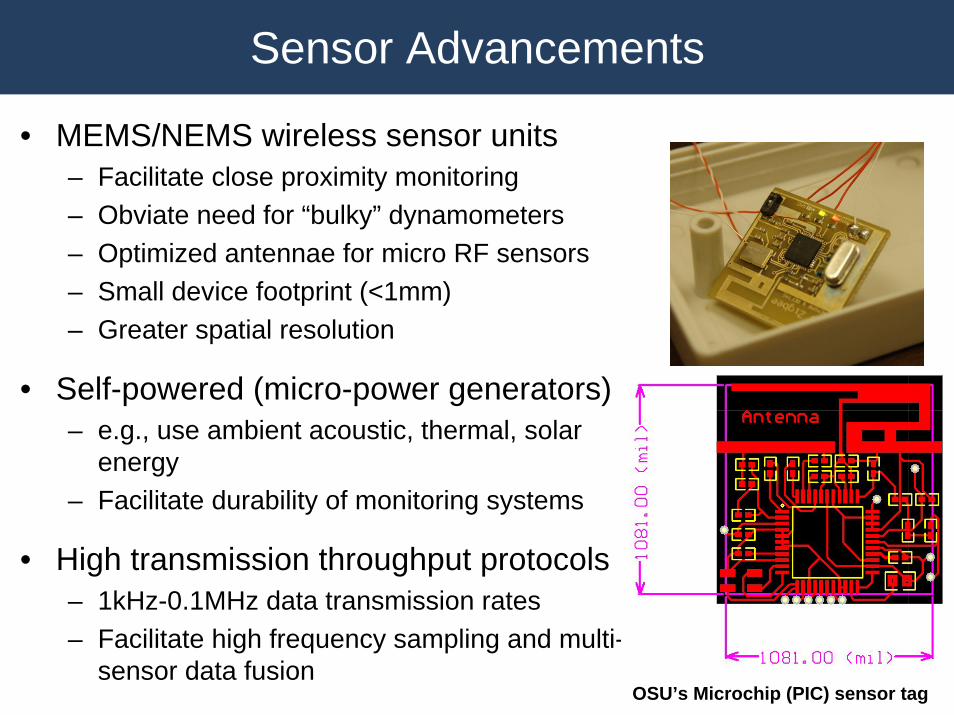
Sensor Advancements
• MEMS/NEMS wireless sensor units – Facilitate close proximity monitoring– Obviate need for “bulky” dynamometers– Optimized antennae for micro RF sensors– Small device footprint (<1mm)– Greater spatial resolution
• Self-powered (micro-power generators)– e.g., use ambient acoustic, thermal, solar
energy– Facilitate durability of monitoring systems
• High transmission throughput protocols– 1kHz-0.1MHz data transmission rates– Facilitate high frequency sampling and multi-
sensor data fusionOSU’s Microchip (PIC) sensor tag

Modeling & Feature Extraction Advances• Consideration of nonlinear dynamics
important to track nano-scale variations underlying measured sensor signals
• Dynamics is nonlinear stochastic and signals are highly nonstationary (bursty)
• Signals from wireless sensors contain higher noise levels due to • measurement errors and • transmission related distortions
• Recent approaches motivated in weather prediction (e.g., customized wavelets, recurrence analysis) can be helpful Time Index
Tim
e In
dex
Sine Wave Recurrence Plot
200 400 600 800 1000
200
400
600
800
1000
0.2
0.4
0.6
0.8
1
1.2
1.4

Research Methodology
Modeling: • Statistical analysis
• Dynamic characterization
Wireless sensing of MRR and Ra:
• Oxide CMP• Cu-CMP• Cu-ECP

Experimental Approach

Sensor Signal Characteristics
Aperiodic, Nonstationary (bursty) with continuous frequency spectrum

Nonlinear Stochastic Dynamics
0 1 2 3 4 5 6 7 8 9 10 11 12 13 14 15 16 17 18 19 200
0.1
0.2
0.3
0.4
0.5
0.6
0.7
0.8
0.9
Time Delay (Data Points)
Auto
Mut
ual I
nfor
mat
ion
1 2 3 4 5 6 7 8 90
0.1
0.2
0.3
0.4
0.5
0.6
0.7
0.8
0.9
Embedded Dimension
Frac
tion
Fals
e N
eare
st N
eigh
bors
Log. Neighborhood Window (log ε)
Cor
rela
tion
Sum
C (d
E,ε)
d E = 1
d E = 9
Log. Neighborhood Window (log ε)
Cor
rela
tion
Sum
C (d
E,ε)
d E = 1
d E = 9
Iteration Number
ln(D
iver
genc
e R
ate)
Iteration Number
ln(D
iver
genc
e R
ate)
Experimental characterization shows that nonlinear stochastic models are necessary to capture (high dimensional chaotic) process dynamics

MRR Estimation in Oxide CMP
• Machine settings (e.g., down force, flow rate) with principal sensor features enhance MRR prediction accuracy to 90%
• For unknown processing times, accuracy of statistical models with machine settings alone: R2~40.1%, sensor features: R2~82%
0 2 4 6x 10⁻⁴
0
2
4
6x 10⁻⁴
Observed
Pre
dict
ed
eΘ→Ψ⊕ζR2 = 85.6%15 Terms
0 2 4 6x 10⁻⁴
0
2
4
6x 10⁻⁴
Observed
Pre
dict
ed
eΘ→Ψ⊕ζR2 = 85.6%15 Terms
-0.0001
0
0.0001
0.0002
0.0003
0.0004
0.0005
0.0006
0.0007
1 3 5 7 9 11 13 15 17 19 21 23 25 27 29 31 33 35
Run Order
MR
R
wfmean
Nons + Sets + 11 terms
15 terms
18 terms
ζ + ψ→ΘObserved
11 terms

Monitoring Slurry Characteristics in Cu-CMP
Jindal et al. 2004

Cu-CMP Sensing Results
MRR is modeled effectively using vibration sensor data.Variations in input process parameters, i.e. slurry chemistry are modeled using sensor signals.Basis for more dynamic models to predict process performance.

Surface Finish Monitoring in Cu-ECPADE Phase ShiftMicroXam Laser Surface Profiler
0
200
-200
-400
As received, Ra = 350-500 nm
1min polish, Ra = 100-220nm
2min polish, Ra = 40-100 nm
3min polish, Ra = 10-50nm
Anode contact Vibration sensor
Slurry Reservoir
Motor Drive Unit
Wafer Holder

Real-time MRR and Ra Monitoring

Summary of Current Work
Physically consistent and accurate models of MRR and WIWNU are possible using Genetic AlgorithmsANFIS (SC) can capture the characteristics of CMP process and provide precise prediction (< 5% prediction errors) using sparsedata, and optimal parameter search as neededNonlinear and descriptive features lead to ~13% improvement in predictability compared to the use of descriptive features aloneSensor features can act as surrogates to process parameters, andconsideration of nonlinear descriptors leads to an improvement in process predictability of : 10% in Oxide CMP, 38% in Cu-CMP, 50% in Cu-ECPEffects of in-process slurry chemistry variations on MRR and Ra in Cu-ECP is captured using vibration sensor signal featuresCu-ECP is optimized in 2 stages: first high MRR, second lowsurface roughness

Sensing Needs in Nanomanufacturing• Sensors
– MEMS/NEMS wireless sensors with optimized antenna design (for close proximity monitoring, leading to enhanced sensitivity)
– Self-powered to obviate need for battery– High throughput transmission protocol for multi-sensor fusion
• Feature Extraction– Models that capture nonlinearity and nonstationarity of process
dynamics– Multi-scale representations and Recurrence analysis
• Applications– Beyond fault detection– Track variations in process dynamics to detect “instantaneous”
variations in deposition, growth, and planarization rates
Acknowledgements: • The generous support from NSF Manufacturing Machines and Equipment Program (CMMI-0700680,
Program Director: Dr. George A. Hazelrigg) is gratefully acknowledged