Embed Size (px)
Citation preview

Find CIBC research on Bloomberg, Reuters, firstcall.com CIBC World Markets Inc., P.O. Box 500, 161 Bay Street, BCE Place, Toronto, Canada M5J 2S8 (416) 594-7000and cibcwm.com
Equity ResearchInitiating Coverage
September 28, 2006 Paper & Forest Products/Income Trusts
Canfor Pulp Income Fund Initiating Coverage On Our Preferred Pulp Play As Sector Outperformer
� Canfor Pulp's pulp mills have become below-average-cost operations, allowing the fund to generate a good level of cash under our "moderate pulp prices" scenario. We believe that the expected distributions would provide an above-average return within our paper & forest products universe.
� Effective September 28, we are initiating coverage of Canfor Pulp Income Fund with a Sector Outperformer rating and a price target of $13.00.
� Given the current 90% payout ratio, we are looking for distributions of $1.28/unit in 2007. Our financial forecasts are lower than the current distribution level of $1.44/unit, but we do not think the current high pulp prices are sustainable.
� So far this year, pulp prices have improved by US$110/tonne, but we believe the current price of US$715/tonne is very close to what we think is a peak for this cycle. We estimate the "trough cycle" price to be US$640/tonne, which would allow the fund to generate roughly $0.82/unit.
Stock Price Performance
Source: Reuters
All figures in Canadian dollars, unless otherwise stated. 06-65541 © 2006
CIBC World Markets does and seeks to do business with companies covered in its research reports. As a result, investors should be aware that the firm may have a conflict of interest that could affect the objectivity of this report. Investors should consider this report as only a single factor in making their investment decision.
See "Important Disclosures" section at the end of this report for important required disclosures, including potential conflicts of interest. See "Price Target Calculation" and "Key Risks to Price Target" sections at the end of this report, where applicable.
Herve Carreau, CFA1 (514) [email protected]
Jonathan Lethbridge, CFA1 (514) [email protected]
Don Roberts1 (613) [email protected]
Stock Rating:
Sector Outperformer
Sector Weighting:
Underweight12-18 mo. Price Target $13.00CFX.UN-TSX (9/28/06) $11.59
Key Indices: None
3-5-Yr. AFFO Gr. Rate NA52-week Range $9.50-$12.25Units Outstanding 71.3MDistr. Frequency $0.12 MonthlyAvg. Daily Trading Vol. 100,000Market Capitalization $826.4MDCF Value/Distr. Yield NA / NAFiscal Year Ends DecemberBook Value $8.50 per Unit2006 D/CF NMLT Debt $125.0MNet Asset Value NMCommon Equity $606.1MConvertible Available No
Distributable Cash Flow/Unit Prev Current2005 --2006 $0.78E 2007 $1.42E Payout Ratio2005 NM2006 100.0%2007 90.1%2006 represents only the second half of the year
Cash Distribution per Unit2005 --2006 $0.78E2007 $1.28ECash-on-Cash Yield2005 NM2006 6.7%2007 11.0%
Company DescriptionCanfor Pulp Income Fund operates three market pulp mills in Western Canada that have a combined annual capacity of roughly 1 million tonnes.
www.canforpulp.com

Initiating Coverage On Our Preferred Pulp Play As Sector Outperformer - September 28, 2006
2
Introduction With a lack of softwood pulp capacity additions and the closure of high-cost mills in North America, we expect an improving supply/demand balance for softwood market pulp and moderate softwood pulp prices over the next two years. At the same time, we expect weakening hardwood pulp prices, resulting from a wall of new capacity coming on stream, mostly in South America. In that context, Canfor Pulp Income Fund (Canfor Pulp) (CFX.UN–SO), as a quasi-pure softwood pulp producer, is an income fund that could provide relatively stable cash flow for the medium term. The objectives of this report are sixfold:
1. To offer a description of Canfor Pulp and its strategy;
2. To summarize our outlook for pulp prices;
3. To provide an analysis of the fund within a SWOT (Strength, Weaknesses, Opportunities, and Threats) framework;
4. To assess the distributable cash outlook for Canfor Pulp;
5. To estimate the value of the units within a 12- to 18-month horizon;
6. To conclude with our recommendation on Canfor Pulp.
Despite the strong Canadian dollar, Canfor’s pulp mills have become below-average cost operations on a global basis because of very low wood fiber prices and an increase in energy generation. This low-cost position should allow the fund to generate cash at the bottom of the pulp cycle and mitigates the risk associated with the volatility in pulp prices. In the meantime, moderate pulp prices are allowing the fund to generate a good level of distributable cash. In light of the current unit price, we believe that the expected distributions would provide an above-average return within our paper & forest products universe. Consequently, effective September 28, we are initiating coverage on Canfor Pulp with a Sector Outperformer recommendation and a 12- to 18-month price target of $13.00.

Initiating Coverage On Our Preferred Pulp Play As Sector Outperformer - September 28, 2006
3
Company Description And Strategy On July 1, Canfor Corporation (CFP–SP) spun off to its shareholders 20% of its chemical pulp business in the form of an income fund. The trust’s assets include the Northwood pulp mill, Intercontinental pulp mill and Prince George pulp and paper mill, with associated management and employees. Units of the fund trade under the symbol CFX.UN on the TSX. The fund employs approximately 1,250 people.
The spinout offers the following advantages for Canfor Corporation:
• The income fund structure maximizes the value of the pulp business due to its advantageous tax structure.
• The separation of the building materials business from the pulp business allows Canfor Corp.’s management to focus on its core business and management of the pulp business to focus on operating the mills to produce maximum distributable cash.
• The spinout was a tax-efficient method to return capital to shareholders.
• The separation of the building materials business from the pulp business allows Canfor shareholders to participate either separately or on a combined basis in the growth potential of Canfor’s building materials business and in the mature pulp business. It also aligns the risks and returns from each asset class, and provides Canfor Corp. shareholders with the ability to alter their participation in each.
• The separation facilitates future growth of the pulp business by: 1) decreasing the cost of capital (due to the tax advantage); and 2) establishing an unambiguous market value of the assets, which in turn makes relative valuation easier when assessing potential merger opportunities.
Canfor Corp. is entitled to appoint four of the seven directors to the board of the General Partner for as long as it owns not less than 30% of the outstanding units. As long as Canfor Corp. holds not less than a 20% indirect economic interest in the fund, Canfor Corp.’s consent will be required in order to approve certain of the fund’s significant transactions.
Canfor Pulp is one of the largest producers of market northern bleached softwood kraft (NBSK) pulp in North America (see Exhibit 1) and among the top five softwood kraft pulp producers in the world.
Canfor Pulp is one of the largest producers of market northern bleached softwood kraft (NBSK) pulp in North America and among the top five softwood kraft pulp producers in the world.

Initiating Coverage On Our Preferred Pulp Play As Sector Outperformer - September 28, 2006
4
Exhibit 1. Capacity For Major Producers Of Market Pulp (000 tonnes), 2005
Company Country Kraft Softwood Hardwood Other TotalAracruz Brazil 0 2,980 0 2,980Weyerhaeuser North America n/a n/a n/a 2,790Metsa Botnia (1) Finland 1,809 891 0 2,700Tembec Canada 825 305 1,110 2,240Sodra Sweden 1,506 453 94 2,053Arauco Chile 1,635 405 3 2,043April Singapore 0 2,000 0 2,000Ilim Russia n/a n/a n/a 1,500IP U.S. n/a n/a n/a 1,420Koch Cellulose U.S. 0 0 1,319 1,319Mercer Germany 1,300 0 0 1,300CMPC Celulosa Chile 854 376 0 1,230West Fraser Canada 585 0 555 1,140Bowater (1) North America 446 346 260 1,052Ence Spain 0 1,040 0 1,040Canfor Pulp Income Fund (2) Canada 1,032 0 0 1,032VCP Brazil 0 1,000 0 1,000Cenibra Brazil 0 960 0 960Pope & Talbot North America 819 0 0 819Stora Enso Finland 296 287 216 799Rottneros Sweden 194 149 364 707Portucel Portugal 0 600 0 600SFK Pulp Canada 375 0 0 375
(1) Kraft capacities are estimated
(2) 80% owned by Canfor Corp.
Source: Company reports and CIBC World Markets Inc.
Canfor Pulp’s three pulp and paper mills are located in the Interior region of British Columbia and have an annual capacity to produce over one million tonnes of northern softwood market kraft pulp (90% of which is bleached to become NBSK pulp) and approximately 135,000 tonnes of kraft paper:
• Northwood: A two-line pulp mill with annual production of approximately 570,000 tonnes of NBSK pulp, making it the largest NBSK pulp facility in North America. Northwood’s pulp is used to make a variety of products, including printing and writing paper, and tissue and specialty papers, and they are delivered primarily to customers in North America, Europe and Asia.
• Intercontinental (Intercon): A single-line pulp mill with annual production of approximately 310,000 tonnes of NBSK pulp. Intercontinental’s pulp is used to make substantially the same products, and is delivered to the same markets, as Northwood’s pulp.
• Prince George Pulp & Paper (PG): An integrated two-line pulp and paper mill with annual market pulp production of approximately 153,000 tonnes and approximately 135,000 tonnes of kraft paper. PG supplies pulp markets in North America, Europe and Asia, as well as its internal paper-making facilities. The paper mill produces a wide range of both bleached and unbleached kraft paper. The mill is the largest producer of its types of bleached kraft paper in North America and primarily supplies North American and European markets.
Being a new company, Canfor Pulp has not communicated a detailed strategy for the future. However, over time we expect the fund to be a growth vehicle in the pulp business. In the meantime, management will focus primarily on optimizing the current operations.
Over time, we expect the fund will be a growth vehicle in the pulp business. In the meantime, management will focus on optimizing the current operations.

Initiating Coverage On Our Preferred Pulp Play As Sector Outperformer - September 28, 2006
5
The Macro Environment: Moderate Pulp Prices Expected Market pulp is the most globally traded commodity in the paper & forest products industry and a raw material in the production of paper and tissue products. The most interesting developments in the market for pulp are on the supply side. Over the 2005–2007 period, we forecast the start-up of roughly 8 million tonnes of new capacity. If there were no offsetting closures, global market pulp capacity would increase by 16% over the base at the end of 2004.
The major expansions in the global pulp industry are:
• The ramp-up in 2005 of a 1-million-Tpy hardwood mill in China by Asia Pulp & Paper (APUUY–OTC) and a 900,000-Tpy hardwood mill by Veracell [a joint venture by Aracruz (ARA–NYSE) and Stora Enso (SEO–NYSE) in Brazil].
• The start-up in 2006 of a 900,000-Tpy mill, which is 50/50 hardwood and softwood, by Arauco in Q1/2006 in Chile and a 780,000-Tpy hardwood mill by CMPC (CMPC–CE) in Q3/2006, also in Chile.
• The start-up in 2007 of two 1-million-Tpy hardwood mills, the first by Suzano (SUZB5–SAO) in Brazil and the second by Metsa Botnia in Uruguay. While these mills are expected to start up in 2007, they will not reach full production until well into 2008.
• The start-up in 2008 of a 500,000-Tpy hardwood mill by Ence (ENC–SSE) in Uruguay.
Note that there is currently considerable controversy surrounding the building of the two pulp mills in Uruguay by Botnia and Ence because of anxiety over their environmental and social impact. The Argentinean government is concerned that Botnia’s plant, along with Ence’s pulp mill, will cause pollution, and it believes that Uruguay should have consulted its neighbor before approving the projects. Both greenfield bleached eucalyptus pulp facilities are under construction near the Uruguay River, which forms part of the western border between the two countries. These two eucalyptus mills represent 1.5 million tonnes of new capacity and would account for a roughly 3% increase in global capacity.
Partly offsetting these expansions is a series of permanent and indefinite mill closures in North America. Of the 1.9 million tonnes of closures already announced since the end of 2005 (i.e., 3% of global capacity), 1.0 million tonnes are permanent and we think an additional 0.5 million tonnes will become permanent. We are expecting a further 1.3 million tonnes of permanent closures to be announced over the next year, mostly in North America. We expect the contraction to be split roughly 50/50 between softwood and hardwood.
Over the 2005–2007 period, we forecast the start-up of roughly 8 million tonnes of new capacity. If there were no offsetting closures, global market pulp capacity would increase by 16% over the base at the end of 2004.
Partly offsetting these expansions is a series of permanent and indefinite mill closures in North America.

Initiating Coverage On Our Preferred Pulp Play As Sector Outperformer - September 28, 2006
6
Permanent closures already announced:
• Western Forest Products (WEF–TSX) shuttered its 265,000-Tpy softwood mill in Squamish (B.C.) in January 2006.
• Bowater (BOW–SP) took down its 210,000-Tpy line in Thunder Bay (Ontario) in April 2006. After adjustments are made in the rest of Bowater’s mill, we expect that the decline in capacity at that facility will be split roughly 50/50 between softwood and hardwood.
• Fraser Papers (FPS–SU) closed its 230,000-Tpy hardwood mill in Berlin (New Hampshire) in May 2006.
• Georgia-Pacific permanently closed its hardwood pulp line in Old Town (Maine) in April 2006. Old Town was producing 208,000 Tpy of pulp, with about 188,000 tonnes sold in the open market.
• West Fraser Timber (WFT–SO) will permanently close the No. 1 pulp machine at its softwood pulp mill in Hinton (Alberta) in Q4/2006. This change will reduce the mill’s annual capacity by approximately 70,000 tonnes.
Indefinite closures already announced:
• Domtar (DTC–SU) brought down its 300,000-Tpy softwood mill in Quevillon (Quebec) in November 2005.
• Neenah Paper (NP–NYSE) closed its 325,000-Tpy softwood mill in Terrace Bay (Ontario) in February 2006.
• Tembec’s (TBC–SU) 200,000-Tpy softwood mill in Smooth Rock Falls (Ontario) was shut down in July 2006.
• Weyerhaeuser (WY–SP) took down its 130,000-Tpy mill in Prince Albert (Saskatchewan) in April 2006.
At a minimum, we expect the indefinite closures in Quevillon and Smooth Rock Falls to become permanent. However, with financial assistance from the government of Saskatchewan, we believe that Weyerhaeuser or Domtar will be successful in finding a buyer to restart the Prince Albert mill. Buchanan has just bought and restarted the mill in Terrace Bay, but we think it will go down again the next time pulp prices weaken.
We expect a series of as-yet-unannounced market pulp mill closures:
• Domtar’s 350,000-Tpy softwood/hardwood mill in Espanola (Ontario);
• Fraser Papers’ 245,000-Tpy hardwood mill in Thurso (Quebec);
• Smurfit’s (SSCC–NASDAQ) 245,000-Tpy hardwood mill in Pontiac (Quebec);
• Tembec’s 250,000-Tpy softwood mill in Tarascon (France).
We also factor in the closing of the following pulp lines, all of which produce softwood pulp:
• 50,000 Tpy at Weyerhaeuser’s Dryden (Ontario) mill;
• 40,000 Tpy at Potlatch’s (PCH–NYSE) Lewiston (Idaho) mill;
• 100,000 Tpy at Pope & Talbot’s (POP–NYSE) Halsey (Oregon) mill.

Initiating Coverage On Our Preferred Pulp Play As Sector Outperformer - September 28, 2006
7
Forecasting mill closures that have not yet been announced is a difficult and risky task. Note that while some solution may be found to save some of the specific mills identified above, there are others that are threatened (but which we assume to remain in operation through at least 2007). Given the secular shift in the pulp industry from the northern to the southern hemisphere, pundits could debate the remaining lifespan of a number of higher-cost facilities. These facilities include:
• Catalyst Paper’s (CTL–Restricted) pulp lines in Elk Falls (180,000 Tpy) and Crofton (318,000 Tpy) in B.C.;
• Pope & Talbot’s Harmac mill (395,000 Tpy) mill in Nanaimo, B.C.;
• The Marathon pulp mill (Ontario) owned jointly by Tembec and Kruger (190,000 Tpy).
Given the expected closures, we predict that the global operating rate for market pulp in aggregate will climb from 92% in 2005 to almost 95% in 2006 and then decline to 93% in 2007 (see Exhibit 2). The increase in demand is estimated using our global GDP assumptions and a regression between GDP and consumption of softwood and hardwood pulps. The healthy operating rate is expected to keep pulp prices at moderate levels over this period. With a scenario highly dependent on mill closures, it would be difficult to defend a very bullish view on pulp prices, as too strong prices would be inconsistent with significant mill closures.
Exhibit 2. Global Market Pulp Operating Rate
05,000
10,00015,00020,00025,00030,00035,00040,00045,00050,00055,00060,000
2001
2002
2003
2004
2005
E
2006
E
2007
E
Thou
sand
tonn
es
85%
87%
89%
91%
93%
95%
97%
99%
Demand Capacity Demand-to-Capacity Ratio
Source: NLK, RISI and CIBC World Markets Inc.
Given the expected changes in the composition of capacity, we also expect the prices of softwood and hardwood pulp to move in opposite directions for a period of time.
• We expect the operating rate for the global softwood industry to climb from almost 92% in 2005 to over 98% in 2006 and an unsustainably high 101% in 2007 (see Exhibit 3).
• Conversely, we expect the operating rate for the global hardwood industry to fall from 90% in 2005 and 2006 to 84% in 2007 (see Exhibit 4).
Given the expected closures, we are predicting that the global operating rate for market pulp in aggregate will climb from 92% in 2005 to almost 95% in 2006 and then decline to 93% in 2007. The healthy operating rate is expected to keep pulp prices at moderate levels.

Initiating Coverage On Our Preferred Pulp Play As Sector Outperformer - September 28, 2006
8
Exhibit 3. Global Softwood Market Pulp Operating Rate
0
5,000
10,000
15,000
20,000
25,000
2001
2002
2003
2004
2005
E
2006
E
2007
E
Thou
sand
tonn
es
85%87%89%91%93%95%97%99%101%103%105%
Demand Capacity Demand-to-Capacity Ratio
Source: NLK, RISI and CIBC World Markets Inc.
Exhibit 4. Global Hardwood Market Pulp Operating Rate
0
5,000
10,000
15,000
20,000
25,000
30,00020
01
2002
2003
2004
2005
E
2006
E
2007
E
Thou
sand
tonn
es
78%80%82%84%86%88%90%92%94%96%98%100%
Demand Capacity Demand-to-Capacity Ratio
Source: NLK, RISI and CIBC World Markets Inc.
In response to the divergence in operating rates, we expect the price spread between softwood and hardwood pulp to widen significantly over the next two years. We expect the benchmark NBSK price to rise from an average of US$611/tonne in 2005 to US$665/tonne in 2006 and US$680/tonne in 2007. At best, we expect the price of eucalyptus pulp to remain flat at around US$580/tonne. However, we do not think the resulting spread of roughly US$100/tonne is sustainable.
Exhibit 5. Pulp Price Forecasts
2000 2001 2002 2003 2004 2005 2006E 2007E NormalizedNBSK Pulp (US$/tonne) $680 $547 $461 $525 $617 $611 $665 $680 $665Eucalyptus Pulp (US$/tonne) $647 $488 $464 $514 $529 $577 $580 $580 $605Spread (US$/tonne) $33 $59 ($3) $11 $88 $34 $85 $100 $60
Euro/US$ Exchange Rate $0.92 $0.90 $0.95 $1.14 $1.24 $1.24 $1.26 $1.28 $1.28C$/US$ Exchange Rate $0.67 $0.65 $0.64 $0.72 $0.77 $0.83 $0.88 $0.89 $0.89
NBSK Pulp (Euro/tonne) €739 €608 €485 €461 €498 €493 €528 €531 €520NBSK Pulp (C$/tonne) $1,015 $842 $720 $729 $801 $736 $756 $764 $747
Source: Pulp & Paper Weeks and CIBC World Markets Inc.
In response to the divergence in operating rates, we expect the price spread between softwood and hardwood pulp to widen significantly over the next two years.

Initiating Coverage On Our Preferred Pulp Play As Sector Outperformer - September 28, 2006
9
As illustrated in Exhibit 5, we expect prices to remain relatively low when denominated in Canadian dollars and euros, as this is a necessary condition for further mill closures.
There is ongoing debate among pundits regarding the uniqueness of NBSK pulp and the price premium it deserves on the market. There is no doubt that NBSK pulp has superior attributes in the production of certain grades of paper and packaging due to its strength, but there are contradicting forces affecting the spread.
Given that softwood pulp is generally more expensive, the incentive to replace softwood pulp by hardwood pulp with new technology will remain. At the same time, the move by the paper industry towards lightweight and recycled grades that are performing well on fast printing presses increases the need for the softwood strength reinforcement pulp. The net impact of these forces over time is unknown, but the substitution will accelerate with the size of the spread between the two grades.
The data suggests that over time papermakers do respond to changes in relative pulp prices. Exhibit 6 documents the positive correlation between the relative price and relative consumption of NBSK and NBHK (northern bleached hardwood kraft) pulp in Western Europe in recent years. We think substitution will occur on both the supply and demand side of the global market and that the price spread will return to normal over the longer term. Over time, we expect the spread to move down to US$60/tonne, reflecting the cost differential for mills that can swing between the two grades. At the moment, there is still more NBSK pulp capacity than that needed for reinforcement, so the substitution in some applications, like tissue, will likely continue.
Exhibit 6. Relative Prices And Consumption Of Softwood And Hardwood
0.90
1.00
1.10
1.20
1.30
Jan-
03
Apr-0
3
Jul-0
3
Oct
-03
Jan-
04
Apr-0
4
Jul-0
4
Oct
-04
Jan-
05
Apr-0
5
Jul-0
5
Oct
-05
Jan-
06NBSK Price/Eucaly ptus Price BHK Consumption/BSK Consumption
Source: Utipulp, Paperloop, and CIBC World Markets Inc.
So far this year, pulp prices in Europe have improved by US$110/tonne. The driving force behind this increase is a series of permanent and indefinite pulp closures in North America, improved shipments, and lower inventories. The bulk of the current transactions are around US$715/tonne in Europe, which is above our forecast for 2007. This price represents a 10-year high, and is very close to what we think is a peak for this cycle. If prices were to increase much further it may encourage mills to restart, leading to an oversupplied situation next year.
We expect prices to remainrelatively low when denominated in both Canadian dollars and euros.
The current NBSK price represents a 10-year high, and is very close to what we think is a peak for this cycle.
Initiating Coverage On Our Preferred Pulp Play As Sector Outperformer - September 28, 2006
10
For example:
• New owners have already restarted the mill in Terrace Bay, Ontario. Not only this mill has restarted; Buchanan will also likely run a smaller second market pulp line in the future that would bump annual NBSK capacity to 475,000 tonnes.
• Cascades (CAS–SP) announced recently that it would re-evaluate the status of its shuttered FjordCell pulp mill in December, based on market conditions.
Without more closures, the global operating rate is expected to drop to the low 90%’s in 2007 from the year-to-date 95% because of the new capacity being built in the southern hemisphere.

Initiating Coverage On Our Preferred Pulp Play As Sector Outperformer - September 28, 2006
11
SWOT Analysis
Exhibit 7. SWOT Summary
Strengths OpportunitiesLow Fiber Costs Industry ConsolidationEnergy Generation Closure Of Chinese CapacityBelow-average Cost Pulp Mills
Weaknesses ThreatsStrong Canadian Dollar Wood Supply Reduction In British Columbia Post Beetle Low Geographic Diversification Risk Of An Oversupply Pulp MarketVolatile Pricing Environment For An Income Fund Foreign Exchange RiskMixed Operational Tract Record Dependency On Key CustomersExposure To China Slowdown Of The Global Economy
Unit Overhang From Canfor Corp.
Source: CIBC World Markets Inc.
Strengths
Low Fiber Costs As illustrated in Exhibit 8, chip prices in B.C. are currently the lowest in the world, as the processing of large volumes of beetle-killed wood by sawmills has caused a surplus of chips in the region. Nearly 85% of the wood supply to the fund’s Prince George area mills is from beetle-infested stands.
Exhibit 8. Average Delivered Conifer Wood Fiber Prices Q2/2006
020406080
100120140160
Can
ada
Wes
t
Aust
ralia
Chi
le
US
Sout
h
New
Zea
land
US
Nor
thw
est
Spai
n
Braz
il
Swed
en
Japa
n (d
om)
Finl
and
Nor
way
Ger
man
y
Fran
ce
Can
ada
East
Chips Roundw ood
Source: Wood Resource Quarterly and CIBC World Markets Inc.
In order to control the mountain pine beetle infestation in the area the Ministry of Forests has increased the annual allowable cut (AAC) in the region by approximately 30%. This increase in the AAC is projected to remain in effect for at least the next eight to 10 years, resulting in an abundant supply of wood chips. The chip surplus in the B.C. Central Interior region has now basically disappeared and the market is in balance. The surplus was sold on the B.C. Coast and in Alberta, replacing more expensive alternatives.
Chip prices in B.C. are currently the lowest in the world.

Initiating Coverage On Our Preferred Pulp Play As Sector Outperformer - September 28, 2006
12
If the beetle outbreak continues to spread, the potential implications for Canfor Pulp include a potential decrease in the quality of chips. The general consensus is that beetle-killed timber will remain merchantable for five to 15 years, depending on local site conditions. However, we think there are some risks that the decrease in chip quality leads to higher chemical costs in the future.
Energy Generation Low-cost pulp mills are generally almost 100% self-sufficient in power (electricity and fossil fuel).
Northwood generates approximately 83% of its electrical power requirements and purchases the remaining 17% from BC Hydro. The mill’s steam production is approximately 70% from black liquor from the kraft pulping process, 18% from hog fuel and 11% from natural gas.
Intercontinental historically produced approximately 53% of its electrical power requirements and purchased the remaining 47% from BC Hydro. With the completion of the cogeneration project, Intercontinental expects to produce or acquire from PG approximately 85% of its electrical power requirements and purchase the remaining 15% from BC Hydro. Intercontinental’s steam production is primarily from black liquor and hog fuel, with only 5% generated through natural gas.
Historically, energy used for the production of pulp and paper at PG was provided through purchased electricity and burning natural gas, hog fuel and internally generated black liquor. Most of these fuels were burned in boilers to produce steam that is used in mill processes. With the completion of the cogeneration project in June 2005, PG and Intercontinental are 92% self-sufficient in meeting their electricity requirements.
The Cogeneration Project
In October 2003, BC Hydro entered into an agreement under which it agreed to contribute $46 million, through its PowerSmart Program, to construct an electrical cogeneration facility at PG designed to produce 48 MW of electricity. In addition to the construction of the cogeneration facility, the project included the modification of two of the three boilers at the mill and the addition of wood waste and ash handling systems to enable a more efficient use of energy generated from black liquor and significantly higher steam production from hog fuel.
Significant cost overruns were incurred. Project costs were $36 million higher than originally planned, resulting from the underestimation of some elements, design modifications and higher steel prices. The initial estimate was $81 million.
The cogeneration project was started up in June 2005, fully completed in December 2005, and is currently operating at 91% of targeted generating capacity of the facility. The PG mill is now self-sufficient in electricity and natural gas purchases have been reduced by 77%. Annual savings are estimated at $21.5 million.

Initiating Coverage On Our Preferred Pulp Play As Sector Outperformer - September 28, 2006
13
Below-average Cost Pulp Mills According to a PricewaterhouseCoopers study, the Intercon and Northwood mills were in the first quartile of the Canadian NBSK production cost curve in 2004. Based on a 2005 cost curve from Paperloop, which assumes a Canadian dollar at US$0.85, the mills were between the top of the first quartile and the bottom of the second quartile on the global softwood kraft cost curve for delivery in Europe. Chilean and Russian producers dominate the bottom of the cost curve. However, Chilean mills ship very little product into Europe at present, and they sell a lower-value pulp (southern softwood). The Russian producers do not generally provide consistent quality and delivery, and tend to sell on the usually depressed spot market.
We believe that the PG mill was among the highest-cost market pulp operations in the B.C. Interior prior to the cogen project. However, with the $22.6 million savings resulting from the cogen project, we estimate that its unit costs are now more in line with those of the Intercon and Northwood mills.
Positions on cost curves are estimated based on the technical specifications and locations of mills. These estimations are subjects to errors. A look at Canfor Pulp’s EBITDA margins relative to other global players complements these estimates (see Exhibit 9). Being a low-cost producer is key in a commodity market if a company wants to be profitable over a cycle.
Exhibit 9. Selected 2005 Pulp EBITDA Margins With Canadian Dollar At US$0.83
Aracruz 49.7%Bowater 10.2%Canfor Corporation 6.9%Catalyst (7.4%)Cenibra 34.2%CMPC Celulosa 27.5%Ence 12.4%Metsa Botnia 20.3%Pope & Talbot 2.9%Portucel 25.4%Rottneros 3.3%SFK Pulp 13.0%Sodra 17.7%Tembec (1.1%)VCP 55.5%West Fraser 6.0%
North American Average 4.4%South American Average 41.7%European Average 15.8%Global Average (Weighted By Region) 15.3%
Canfor Pulp Actual 7.6%Canfor Pulp Proforma 17.0%
Source: Company reports and CIBC World Markets
Based on proforma margins, Canfor Pulp was a below-average-cost global pulp producer in 2005. In fact, its EBITDA margin is roughly two percentage points higher than the global weighted average, which is pulled up by South American pulp operations. The low-cost producers are primarily the Brazilian and Chilean companies. Although the value of currencies plays an important role in the cost position, we do not expect the South Americans to lose their status anytime
Based on proforma margins, Canfor Pulp was a below-average-cost pulp producer on a global basis in 2005.

Initiating Coverage On Our Preferred Pulp Play As Sector Outperformer - September 28, 2006
14
soon, even if their currencies are strengthening. However, it should be noted that South American producers generally need more capital to generate these high margins, as they usually own tree plantations and have modern assets. As a result, the profitability difference is much smaller on a return-on-capital basis.
There is a significant difference between Canfor Pulp’s actual and proforma margins due to the $51.2 million impact of the fiber price change and the $22.6 million savings from the cogen project. In general, without the benefits of the low fiber prices, the B.C. Interior would rank only in the third quartile of the global softwood pulp cost curve with a Canadian dollar at US$0.85.
The new wood fiber formula was fully implemented in the fourth quarter of 2005. The actual average delivered cost of chips during 2005 was $80.78/tonne, while the average cost using the pricing formula would have been $59.05/tonne, resulting in an average saving of $21.73/tonne. Had this pricing formula been applied to the total 2.4 million tonnes of wood chips consumed in the pulp business during 2005, the total cost of wood chips would have been reduced by approximately $51.2 million. We estimate that chip prices in the region are around $50/tonne before freight costs, compared to $100/tonne–$140/tonne in Eastern Canada.
Canfor Pulp is doing significantly better than the North American average and slightly better than the European average. Its margins compare favorably to those of producers in the northern hemisphere, which represent more than 60% of the global market pulp capacity (see Exhibit 10) and the vast majority of the global softwood pulp supply. This observation supports Paperloop’s benchmarking study findings. Having said this, South American producers will over time represent a growing percentage of capacity as mills are built in that region and facilities are shut down in North America. As a result, the global cost curve is expected to shift downwards in the future.
Exhibit 10. Market Pulp Capacity By Region (2005)
Canada
21%
U.S.
17%Eastern Europe
7%
South America
17%
Asia/Africa
12%
Western Europe
24%
Oceania
2%
Source: Pulp & Paper Fact Book and CIBC World Markets Inc.
Although lower chip prices have been in place for the full year, we have not yet seen the expected savings fully materialize. Based on proforma numbers, Canfor Pulp should post a better performance than SFK Pulp Fund (SFK.UN–SP) by four percentage points or $30/tonne, but year to date, its EBITDA margin has been 13% ($97/tonne) compared to SFK’s 11% ($75/tonne). This difference relative to potential reflects the fact that the new cogen facility has not operated at full capacity so far this year. There were also some operational issues in the first half of the year, and two of the three mills underwent major maintenance outages in Q2 (done every 18 months).

Initiating Coverage On Our Preferred Pulp Play As Sector Outperformer - September 28, 2006
15
The $20/tonne–$30/tonne difference between Canfor Pulp and SFK is a testimony to SFK’s continuing advantage in conversion costs. SFK starts producing pulp with a handicap of $150/tonne of pulp due to higher fiber costs. However, this disadvantage is reduced significantly throughout the production and delivery process.
Weaknesses
Strong Canadian Dollar The downside of Canfor Pulp’s locations is that all operations are in Canada where the currency is presently strong. Exhibit 11 shows that the Canadian dollar and the euro have appreciated by between 20% and 25% since 2000. Although the Brazilian real has increased by roughly 80% since 2003, that country remains highly competitive in the pulp world (note that the Brazilian real depreciated sharply over the 2000–2003 period).
Exhibit 11. Foreign Exchange Rate
0
20
40
60
80
100
120
140
Jan-
00
Jul-0
0
Jan-
01
Jul-0
1
Jan-
02
Jul-0
2
Jan-
03
Jul-0
3
Jan-
04
Jul-0
4
Jan-
05
Jul-0
5
Jan-
06
Jul-0
6
CAD EUR Brazil Real
Source: U.S. Federal Reserve Board and CIBC World Markets Inc.
Fortunately for Canfor Pulp, most of its closest competitors have also been affected by the strong Canadian dollar and euro. Roughly 80% of NBSK pulp is produced in Europe or Canada. This ratio drops to 73% when all softwood market pulp is considered, and to 45% for all market pulps. However, this protection should decline over time as high-cost mills in Europe and Canada are closed and replaced by mills in emerging countries with weaker currencies.
A US$0.01 increase in the Canadian dollar relative to the U.S. dollar would reduce EBITDA by $5 million and discounted cash flow per unit (DCFPU) by $0.07. Exhibits 12 and 13 show that within the paper and forest products universe, Canfor Pulp is in the middle of the pack in terms of exposure to the US$/C$ exchange rate.
The downside of Canfor Pulp’s locations is that all operations are in Canada where the currency is presently strong.

Initiating Coverage On Our Preferred Pulp Play As Sector Outperformer - September 28, 2006
16
Exhibit 12. EPS Sensitivity To A US$0.01 Change In The Canadian Dollar (US$)
$0.1
8
$0.1
7
$0.1
0
$0.0
8
$0.0
6
$0.0
4
$0.0
4
$0.0
4
$0.0
4
$0.0
4
$0.0
3
$0.0
3
$0.0
3
$0.0
2
$0.4
0
$0.00
$0.10
$0.20
$0.30
$0.40
$0.50
$0.60
Wes
t Fra
ser
Can
for
Tem
bec
Fras
er P
aper
Bow
ater
Can
for P
ulp
Cat
alys
t
Pape
r
Abiti
bi
Cas
cade
s
Tim
berW
est
SFK
Pulp
Fund
Dom
tar
Wey
erha
euse
r
Inte
rfor
LP
Source: Company reports and CIBC World Markets Inc.
Exhibit 13. Leverage Per US$1,000 Invested To A US$0.01 Change In The Canadian Dollar (US$)
$16.
81
$16.
67
$15.
58
$11.
99
$9.6
1
$5.9
5
$5.4
0
$4.5
3
$3.9
6
$3.8
6
$2.9
0
$1.1
0
$0.9
5
$17.
46
$0.00
$5.00
$10.00
$15.00
$20.00
$25.00
Can
for
Fras
er P
aper
Abiti
bi
Cat
alys
t Pap
er
Wes
t Fra
ser
SFK
Pulp
Fun
d
Can
for P
ulp
Dom
tar
Inte
rfor
Cas
cade
s
Bow
ater
Tim
berW
est
LP
Nor
bord
Note: Excludes Tembec at $133.
Source: Company reports and CIBC World Markets Inc.
Low Geographic Diversification Although the fund operates three pulp and paper mills, the operations are not only in the same province, but also in the same region of the province. This is a good location at this time, but it makes the fund vulnerable to regional shocks and to the C$/US$ exchange rate.
With three different sites, operational risks are diluted, but the risk of labor disruptions is not necessarily diversified, as the three operations, represented by two different unions, are covered by the same labor agreements. These agreements expire on April 30, 2008. The agreements provide for wage increases totaling 11% over the five-year term.

Initiating Coverage On Our Preferred Pulp Play As Sector Outperformer - September 28, 2006
17
Volatile Pricing Environment For An Income Fund Pulp prices are very volatile and we do not believe the pulp business is generally well suited for an income trust structure. However, this negative factor is mitigated by the good competitive position of the operations at this time and the fact that the cost of chips (which represents roughly 30% of manufacturing costs) is directly linked to the Canadian dollar price of pulp. Specifically, the price per tonne of chips is set to equal between 7.25% and 8.25% of the net realized price of NBSK pulp, denominated in Canadian dollars. Due to this linkage via an explicit formula, the sensitivity of Canfor’s earnings to changes in pulp prices is reduced by roughly 15% currently.
The chip price formula was adjusted last year to reflect the surplus of chips in the region. Being based on mill net prices (net of delivery costs and FX translations), this formula provides a partial hedge against pulp prices, the C$/US$ exchange rate, fuel prices and freight costs.
This formula applies to the chips supplied by Canfor Corp. through the Fibre Supply Agreement. This agreement covers roughly 75% of Canfor Pulp’s needs. The formula reflects chip prices on the open market and will be adjusted periodically if the relationship between pulp and chip prices changes in the region. As a result, there are no guarantees that chip prices will remain that low in the future. However, we think that low chip prices will prevail for the next eight years.
Mixed Operational Track Record Over the past several years, Canfor has experienced various operational difficulties on a relatively regular basis. Some of the problems were due to external factors such as cold weather and lightning strikes, but some were due to mechanical and operational deficiencies. These problems resulted in EBITDA margins that were not substantially better than the North American average between 2004 and 2005, despite the fact that Canfor enjoyed lower fiber and energy costs.
Note that the senior management team of the pulp operations was replaced in May 2005. The team is headed by Mr. Paul Richards, who is now the President and CEO of Canfor Pulp Limited Partnership, the business operating entity owned 20% by the Canfor Pulp Income Fund and 80% by Canfor Corp. Given his long and solid track record in managing pulp mills across Canada, we think Mr. Richards will provide better operational leadership going forward.
Exposure To China Exhibit 14 illustrates that Canfor has traditionally sold approximately 30% of its pulp to Asia (mostly China). Although it is not necessarily the case now, over a cycle, net realized pulp prices tend to be lower in China.
Canfor Pulp’s chip prices are directly linked to the realized Canadian dollar price of pulp. Due to this linkage, the sensitivity of Canfor’s earnings to changes in pulp prices is reduced by roughly 15%.

Initiating Coverage On Our Preferred Pulp Play As Sector Outperformer - September 28, 2006
18
Exhibit 14. 2005 Pulp Shipments By Region
North America
40%
Europe
29%
Asia
31%
Source: Company reports and CIBC World Markets Inc.
Another 30% of the pulp is sold in Europe, where Canfor Pulp has a competitive disadvantage vis-à-vis European producers in terms of freight costs. Delivery costs from B.C. to Europe are estimated at around US$95/tonne versus US$60/tonne from Scandinavia to continental Europe.
Like most pulp producers in Canada, Canfor Pulp is focusing on selling pulp in North America, which, due to shorter shipping distances, minimizes total transportation costs. Canfor Pulp has increased its North American sales by 30% from 2003 to 2005.
Opportunities
Industry Consolidation Despite some consolidation over the past 10 years, the pulp business remains highly fragmented. In 2005, the top five companies accounted for only 41% of North American capacity. This is one of the lowest concentration ratios in the North American paper and forest products industry. Considering that market pulp is truly a global commodity, the segment is, in reality, even more fragmented, with the top five global producers representing only 25% of global capacity. The weak concentration is one of the reasons why pulp prices are so volatile.
Industry fragmentation represents an opportunity for Canfor Pulp to increase its capacity and expand outside B.C. With a strong currency resulting from an income fund structure, there are likely opportunities to create value. The main challenge is to find good-quality assets that are non-core to the actual owners. Another challenge is that operations outside Canada would be taxable at the net income level. Given its income fund structure, Canfor Pulp would have an advantage in buying mills in Canada.
As discussed above, now that Canfor’s pulp operations have been separated into a market-traded entity, there is a greater likelihood it will participate in M&A activity, which would result in synergistic savings and a higher float. Such expansion may also facilitate an eventual reduction in Canfor’s ownership of the business.
Industry fragmentation represents an opportunity for Canfor Pulp to increase its capacity and expand outside B.C.
Initiating Coverage On Our Preferred Pulp Play As Sector Outperformer - September 28, 2006
19
Closure Of Chinese Capacity The biggest wildcard in the global pulp market is the potential closure of significant amounts of non-wood pulp capacity in China. Non-wood pulp accounts for over 80% of China’s total pulp capacity, and much of it is high cost, poor quality and highly polluting. The Chinese government has repeatedly stated its intention to close a number of the older non-wood mils. Hypothetically, a 25% reduction in Chinese non-wood pulp capacity could result in a 3.0-million-tonne increase in China’s importation of pulp (i.e., roughly an 85% increase in shipments to China). This tonnage represents roughly 6% of the global market pulp capacity. Given the worsening shortage of water in China and that older non-wood pulp/paper mills use up to 10 times the volume of water per tonne of paper, observers should not discount this potentially “positive shock” to the global pulp market. Our analysis does not reflect any closures of this non-wood pulp capacity, but we are continuing to monitor this issue.
Threats
Wood Supply Reduction In British Columbia Post Beetle Canfor Pulp benefits from the excess chip availability in the B.C. Interior. However, the situation is expected to reverse in eight to 10 years when salvage harvesting is over and harvesting levels drop below those before the infestation in order that the forest resource can be regenerated. At that time, the B.C. pulp industry will lose its unique cost advantage. The BC Competition Council, a committee created with a mandate to recommend key actions to improve the competitiveness of the B.C. industry, has recently warned that once the sawmilling activity in the Interior moderates, one half of the B.C. Interior pulp mills could shut.
Risk Of An Oversupplied Pulp Market Our pulp price outlook is heavily influenced by our view that an additional 1.3 million tonnes of market pulp capacity will be closed at the end of 2006, even though it has not yet been announced. If none of this additional capacity is withdrawn, we will likely face an oversupply situation in the pulp market. Under that more conservative scenario, our estimated operating rate in 2007 will drop below 92% instead of the 94% we are predicting. With an operating rate in the low 90%’s, we would expect some downward pressure on pulp prices. The spread between softwood and hardwood pulp prices could still increase in that situation, as the softwood operating rate would remain favorable, but we do not think that this would be sufficient to prevent softwood prices dropping as well.
There is a lack of visibility beyond 2007, but additional mills in South America are on the drawing board and we expect more hardwood pulp capacity to come on stream beyond our horizon.
If none of this additional capacity is withdrawn, we will likely face an oversupply situation in the pulp market.

Initiating Coverage On Our Preferred Pulp Play As Sector Outperformer - September 28, 2006
20
Foreign Exchange Risk Given that market pulp is sold in U.S. dollars in most markets globally, the fund is exposed to fluctuations in the value of the Canadian dollar, as most of the manufacturing costs are denominated in the local currency. This risk is mitigated by the following factors:
• Given that roughly 40% of global market pulp is consumed in Europe, the value of the euro tends to influence the U.S. dollar price of pulp. This relationship is strengthened by the fact that 24% of global market pulp is produced in Europe. This link is illustrated in Exhibit 15, which shows that pulp prices are less volatile in euros than in their trading currency. So far the euro has increased in concert with the Canadian dollar.
• Given that Canada represents roughly 20% of global market pulp capacity and that most of the global high-cost capacity is in Eastern Canada, the Canadian dollar sets the floor pulp price. Consequently, a stronger Canadian dollar should be associated with stronger pulp prices, as this situation should lead to more mill rationalizations.
Exhibit 15. Pulp Prices In Euro And In U.S. Dollars
200
400
600
800
1,000
1,200
Jan-
93
Jan-
94
Jan-
95
Jan-
96
Jan-
97
Jan-
98
Jan-
99
Jan-
00
Jan-
01
Jan-
02
Jan-
03
Jan-
04
Jan-
05
Jan-
06
euro US$
Source: Pulp & Paper Week and CIBC World Markets Inc.
Dependency On Key Customers Canfor Pulp depends on its key customers, the 10 largest of which represent roughly 65% of sales. These sales are spilt between large European magazine paper producers, large tissue producers and some Chinese specialty paper manufacturers.
In 2005, the fund’s largest customer accounted for approximately 23% of its sales. However, the relationship with this customer is long-standing and the sales agreement with this client is evergreen with a three-year notice period required to terminate the agreement.
This risk is mitigated by the fund’s good-quality product. Canfor Pulp’s pulp has better strength characteristics than NBSK pulp available from Scandinavia and the U.S. While this advantage does not allow Canfor Pulp to sell its product at a premium, it does allow the company to keep a very loyal customer base. NBSK pulp is the most expensive furnish in paper production and is added to strengthen a paper sheet. A strong pulp means savings for paper producers, as it reduces the volume of NBSK necessary to obtain the desired strength in the sheet.

Initiating Coverage On Our Preferred Pulp Play As Sector Outperformer - September 28, 2006
21
Slowdown Of The Global Economy In our pulp outlook, we assume that the global economy will grow at a rate of 4.1% in 2006 and 3.9% in 2007. However, the global economy is well into the current cycle and the risk of a slowdown does exist. Nevertheless, two institutions have just revised upward their GDP forecasts. The International Monetary Fund (IMF) increased its global 2006 forecast from 4.9% to 5.1% and its 2007 forecast from 4.7% to 4.9%. The European Union (EU) increased its 2006 EU GDP growth forecast from 2.1% to 2.6% and its 2007 forecast from 2.1% to 2.5%.
Unit Overhang From Canfor Corp. Canfor Corp. owns 80% of the outstanding units of Canfor Pulp Fund, and it is logical to assume that one of the reasons the fund was spun out is to facilitate an eventual sale. However, it is reasonable to conclude that the higher the value of the units, the greater the probability the parent will reduce its position. The flip side of Canfor Corp. eventually reducing its ownership is that it would increase the units’ market float and trading liquidity.
To the extent that Canfor Pulp grows, the parent’s position will likely be diluted and the overhang will be less of an issue.
Conclusion Of The SWOT Analysis Despite the strong Canadian dollar, Canfor Pulp is “on paper” a below-average-cost pulp producer on a global basis thanks to extremely low fiber prices and reduced electricity purchases. This low-cost position, combined with the fact that fiber prices are linked to realized pulp prices, mitigates the volatility associated with the pulp market and helps to make the operations more suitable for an income fund structure. Having said this, based on the year-to-date margins, it does not look as though the expected savings used in the proforma 2005 distributions are fully in place yet. This could be attributable to operational problems, a heavy maintenance schedule, or the fact that the cogen facility did not reach full capacity until late Q2/2006.

Initiating Coverage On Our Preferred Pulp Play As Sector Outperformer - September 28, 2006
22
Financial Sensitivities And Forecasts Canfor Pulp’s distributions are highly sensitive to pulp prices (see Exhibit 16) and to the value of the Canadian dollar relative to the U.S. dollar. In turn, pulp prices are influenced by global economic activity and the increase or decrease in the global supply of pulp. When the amount of capital invested in all the stocks is held constant, the leverage metric indicates that Canfor Pulp offers one of the highest leverages to pulp prices on a global basis.
Exhibit 16. EPS Sensitivity To A US$10/Tonne Change In Pulp Prices (US$)
$0.3
4
$0.2
6
$0.2
0
$0.1
8
$0.1
8
$0.1
3
$0.1
1
$0.0
7
$0.0
5
$0.0
4
$0.0
4
$0.0
3
$0.0
3
$0.0
3
$0.0
3
$0.0
3
$0.0
2
$0.0
1
$1.1
7
$0.00
$0.20$0.40
$0.60
$0.80
$1.00$1.20
$1.40
Arac
ruz
Pope
& T
albo
t
Mer
cer
Ence
Wes
t Fra
ser
Tem
bec
Can
for P
ulp
Ray
onie
r
Bow
ater
Can
for
Empr
esas
CM
PC
SFK
Pulp
Fun
d
VCP
Dom
tar
Fras
er P
aper
New
Dom
tar
Rot
tner
os
Cat
alys
t Pap
er
Portu
cel
Source: Company reports and CIBC World Markets Inc.
Exhibit 17. Leverage Per US$1,000 Invested To A US$10/Tonne Change In Pulp Prices (US$)
$28.
23
$26.
63
$23.
56
$12.
76
$10.
35
$5.4
6
$5.2
8
$4.6
6
$4.5
5
$4.5
5
$4.4
6
$4.2
8
$3.2
3
$3.0
4
$1.8
9
$1.7
0
$1.4
2
$58.
97
$137
.77
$0.00
$10.00$20.00
$30.00
$40.00
$50.00$60.00
$70.00
Tem
bec
Pope
& T
albo
t
Rot
tner
os
Mer
cer
Arac
ruz
Can
for P
ulp
SFK
Pulp
Fun
d
Wes
t Fra
ser
Cat
alys
t Pap
er
Dom
tar
Can
for
Fras
er P
aper
Ence
New
Dom
tar
Bow
ater
Ray
onie
r
VCP
Portu
cel
Empr
esas
CM
PC
Source: Company reports and CIBC World Markets Inc.
We think that a good income fund must be able to maintain an acceptable level of cash throughout a cycle in order to minimize the volatility in the unit price. To test that statement, one must define a pulp cycle and, more importantly, a trough pulp price. As mentioned above, given its high-cost status, we think that the Canadian industry presently sets the floor on global pulp prices.
Canfor Pulp’s distributions are highly sensitive to pulp prices and to the value of the Canadian dollar relative to the U.S. dollar.

Initiating Coverage On Our Preferred Pulp Play As Sector Outperformer - September 28, 2006
23
Exhibit 18 illustrates that over the past cycle, pulp prices have never fallen below an average of C$720/tonne over a 12-month period. This is true even during the severe 2001 U.S. recession. As a result, we think that C$720/tonne is a good proxy for the floor on NBSK pulp prices. At the current C$/US$ exchange rate of US$0.89, this translates into a price of US$640/tonne. This is a value relatively close to the current price of US$715/tonne, despite the recent run-up in U.S. dollar prices.
Exhibit 18. NBSK Pulp Prices In Canadian Dollars (LTM)
$500
$600
$700
$800$900
$1,000
$1,100
$1,200
$1,300
Dec
-93
Dec
-94
Dec
-95
Dec
-96
Dec
-97
Dec
-98
Dec
-99
Dec
-00
Dec
-01
Dec
-02
Dec
-03
Dec
-04
Dec
-05
Source: RISI and CIBC World Markets Inc.
Under these trough conditions, we think that Canfor Pulp could generate $0.82/unit at the bottom of the cycle. Given the initial payout ratio of 90%, this would lead to a distribution of $0.74/unit. We do not expect the fund’s cost structure to change in the medium term.
Our forecasts are derived from Canfor Corp.’s year-to-date pulp segment results. These results are not a perfect base, as they include the Taylor mechanical pulp mill (which is not part of the fund) and exclude unallocated corporate costs. The fund will publish its first results at the end of Q3.
Canfor Pulp Fund was launched effective July 1 and the first monthly distribution was announced later in July at $0.12/unit, resulting in an annualized rate of $1.44/unit. Subsequently, the fund declared a special cash distribution of $0.08/unit payable on October 13 to reflect additional distributable cash arising from the positive financial performance of the pulp operations.
Proforma to the $51.2 million impact of the wood fiber price change and the $22.6 million impact of the cogen project, the fund would have generated $1.24/unit and distributed $1.12/unit in 2005. Without these two benefits, 2005 distributable cash flow and distributions would have been only $0.21 and $0.19 per unit, respectively. These proforma numbers assume an interest rate of 8% of the debt of $125 million and capital expenditures of $34 million annually. The $125 million debt results in a sound debt-to-capital ratio of 16%. This leverage ratio does not account for the pension fund deficit of $53 million, which is expected to be funded with ongoing pension expenses.
Management estimates that in order to maintain the mills in good working order, future sustaining capital expenditures will average approximately $34 million per year, before adjustment for inflation. Estimated sustaining capital expenditures include an annual reserve of $4 million per year for the next 20 years to fund significant capital projects, including the reconstruction of a recovery boiler at Northwood at a cost of $55 million (in 2004 dollars). This capex level represents 72% of depreciation, which we think is reasonable.
We think that C$720/tonne is a good floor for NBSK pulp prices. At the current C$/US$ exchange rate of US$0.89, this translates into a price of US$640/tonne.
We think that Canfor Pulp could generate $0.82/unit at the bottom of the cycle. Given the initial payout ratio of 90%, this would lead to a distribution of $0.74/unit.

Initiating Coverage On Our Preferred Pulp Play As Sector Outperformer - September 28, 2006
24
Under our macro assumptions, which are more optimistic than those in the “trough scenario” (see Exhibit 5), we expect Canfor Pulp to generate $1.33/unit in 2006 on a proforma basis. Given that the spin-off occurred in early July, actual 2006 cash generation is forecast to be $0.78/unit, representing the last two quarters of the year. We expect the fund to generate DCFPU of $1.42 in 2007. Given the current 90% payout ratio, we are looking for distributions of $1.28/unit in 2007. Our financial forecasts are lower than the current distribution level of $1.44/unit, but we do not think the current high pulp prices are sustainable.
Alternative views of the pulp outlook are provided by the latest swap price for NBSK by Traditional Financial Services (TFS) and price forecasts by RISI (see Exhibit 19). It could be argued that the TFS swap prices reflect the view of some “pulp insiders,” with a price of US$698/tonne in 2007 and US$653/tonne for three years.
Exhibit 19. NBSK Pulp Alternative Forecasts (US$/tonne, del. Western Europe)
Current 2006 2007 2008 2009 3-year SwapTFS Pulp Swap 715 n/a 698 n/a n/a 653RISI 715 683 648 685 746 n/aCIBC World Markets 715 665 680 n/a n/a n/a
Average 715 674 675 685 746 653
Source: RISI, TFS and CIBC World Markets Inc.
In our view, upside risks to our financial forecasts include:
• An unexpected increase in the U.S. dollar vis-à-vis the Canadian dollar;
• An improvement of the euro relative to the Canadian dollar, which would increase European competitors’ costs;
• Stronger-than-expected pulp prices resulting from a disconnect between hardwood and softwood markets and/or the closure of old Chinese capacity.
Downside risks to our forecasts, in our opinion, include:
• Continuing decline in the value of the U.S. dollar relative to the Canadian dollar;
• A correction in softwood pulp prices resulting from the new hardwood pulp capacity coming on stream in the southern hemisphere or a global economic slowdown.
Given the current 90% payout ratio, we are looking for distributions of $1.28/unit in 2007. Our financial forecasts are lower than the current distribution level of $1.44/unit.

Initiating Coverage On Our Preferred Pulp Play As Sector Outperformer - September 28, 2006
25
Exhibit 20 shows Canfor Pulp’s sensitivity to US$50/tonne changes in pulp prices in terms of distributable cash at various exchange rates. Any US$50/tonne improvement in pulp prices improves the yield by six percentage points. At the current exchange rate of US$0.89 and pulp price of US$715/tonne, we estimate that Canfor Pulp is generating $1.95 per unit.
Exhibit 20. Sensitivity Of Canfor Pulp’s Distributable Cash To Pulp Prices And Exchange Rates
Pulp Prices (US$/Tonne)#REF! $550 $600 $650 $700 $750 $800
$0.77 0.78 1.65 2.40 3.26 4.12 4.99$0.79 0.53 1.38 2.23 2.95 3.79 4.63$0.81 0.40 1.13 1.96 2.65 3.47 4.29$0.83 0.17 0.88 1.69 2.37 3.17 3.97$0.85 (0.05) 0.65 1.44 2.23 2.89 3.67$0.87 (0.26) 0.42 1.20 1.97 2.61 3.38$0.89 (0.45) 0.31 0.97 1.72 2.35 3.10$0.91 (0.64) 0.10 0.75 1.49 2.23 2.83$0.93 (0.82) (0.09) 0.54 1.26 1.98 2.58$0.95 (0.83) (0.28) 0.44 1.04 1.75 2.33$0.97 (1.00) (0.46) 0.24 0.83 1.53 2.22$0.99 (1.16) (0.64) 0.05 0.64 1.31 1.99
FX R
ates
$1.01 (1.31) (0.80) (0.13) 0.44 1.11 1.78
Source: CIBC World Markets Inc.
Any US$50/tonne improvement in pulp prices improves the yield by six percentage points.

Initiating Coverage On Our Preferred Pulp Play As Sector Outperformer - September 28, 2006
26
Valuation And Recommendation With a float of roughly $160 million and a market capitalization of roughly $825 million, Canfor Pulp has the potential to become a relatively liquid income fund if Canfor Corp. partially or entirely disposes of its 80% ownership.
Based on our forecasts, Canfor Pulp looks cheaper than other Canadian pulp and paper companies in our universe in terms of TEV/EBITDA multiples (see Exhibit 21) despite the tax advantage enjoyed by income funds. We think the best comparables in our universe for Canfor Pulp are SFK Pulp Fund and Mercer International (MERC–SP). On a TEV/EBITDA basis, Canfor Pulp appears cheaper than both SFK and Mercer.
Exhibit 21. North American Companies P/E And TEV/EBITDA Valuation
P/E TEV/EBITDA EBITDAMkt Cap. ($ mlns.)
Float (mlns.)
Price 28-09-06 2005 2006E 2007E 2005 2006E 2007E Normalized 2005 2006E 2007E Normalized
Abitibi-Consolidated $1,320 1,186 $3.00 n.m. n.m. n.m. 7.8 7.7 6.7 8.5 $649 $662 $755 $598Bowater (US$) 1,180 1,130 20.56 n.m. n.m. 28.6 7.7 7.4 6.2 8.0 458 475 566 441Canfor 1,604 979 11.25 17.9 n.m. 26.2 8.1 9.9 8.3 8.2 297 241 287 292Cascades 986 621 12.20 n.m. 31.3 22.6 8.7 7.5 7.4 7.0 256 298 302 315Domtar 1,548 1,306 6.69 n.m. n.m. n.m. 10.5 8.9 7.1 8.0 358 420 531 468Mercer (1) (euro) 320 320 9.65 n.m. 9.2 n.m. 15.8 9.8 8.2 8.7 68 110 132 124SFK Pulp Fund 251 250 4.23 16.9 10.1 7.6 11.0 7.7 4.4 4.5 31 44 78 76Tembec 122 98 1.42 n.m. n.m. n.m. 205.1 24.6 26.8 46.1 9 75 69 40
Average (excl. Tembec) 1,030 827 17.4 16.8 21.2 9.9 8.4 6.9 7.6
Canfor Pulp 838 159 11.76 n.m. 8.4 8.3 7.2 6.7 6.7 7.5 133 144 144 128
(1) Mercer reports in euros and trades on the NASDAQ. Data including price, market cap and float are in US$; all other figures are in euros.
Source: Company reports and CIBC World Markets Inc.
In terms of TEV per tonne of capacity, Canfor Pulp’s valuation is just below SFK’s despite the fact that it has generated a better EBITDA per tonne year to date (see Exhibit 22). Canfor Pulp is also cheaper than Mercer on that basis. Mercer’s higher valuation per tonne is partially attributable to its better EBITDA per tonne year to date. This is somewhat surprising because Mercer does not have the tax advantage enjoyed by companies like SFK and Canfor Pulp, which are structured as income funds. However, because of its capital structure, we do not expect Mercer to pay meaningful income taxes anytime soon.
With a float of roughly $160 million and a market capitalization of roughly $825 million, Canfor Pulp has the potential to become a relatively liquid income fund.
In terms of TEV per tonne of capacity, Canfor Pulp’s valuation is just below that of SFK despite the fact that it has generated a better EBITDA per tonne year to date.

Initiating Coverage On Our Preferred Pulp Play As Sector Outperformer - September 28, 2006
27
Exhibit 22. Valuation Per Tonne
Mercer
Canfor PulpSFK
300
500
700
900
1,100
1,300
1,500
60 70 80 90 100 110 120
EBITDA/Tonne (y ear to date)
TEV/
Tonn
eSource: Company reports and CIBC World Markets Inc.
Canfor Pulp’s valuation per tonne is higher than the average price of C$770/tonne paid for pulp assets over the past 10 years (high of C$1,800/tonne, low of C$425/tonne, mean of C$654/tonne). Based on the average of precedent transactions, Canfor Pulp would trade at roughly $11.00 per unit. It should be noted, however, that some good pulp mills have been sold at close to C$2,000/tonne in the past, which is significantly higher than Canfor Pulp’s current valuation.
We expect Canfor Pulp to distribute cash of $1.20/unit in 2006 (proforma) and $1.28/unit in 2007. Based on the current pricing, these distributions represent expected yields of 10.3% in 2006 and 11.0% in 2007. Canfor Pulp’s expected returns are similar to the average cash-on-cash yield of 10.3% and 10.7% expected in 2006 and 2007, respectively, for the basic materials income trusts followed by CIBC World Markets. The three income trusts we cover in the paper & forest products industry [PRT Forest Regeneration Income Fund (PRT.UN–SP), SFK, and TimberWest Forest (TWF.UN–SP)] are expected to generate an average yield of 8.0% in 2006 and 10.4% in 2007. SFK itself provides an expected cash yield of 5.7% for 2006 and 13.2% for 2007.
We think Canfor Pulp should trade on the basis of a 10% yield. This is the average yield at which the materials income funds are trading. It represents a 600-basis-point premium over the 4.00% return from 10-year government bonds. Based on our 2007 cash distribution forecasts, we calculate a price target of $13.00/share on Canfor Pulp.
The expected yield of 11% for 2007 combined with the expected capital gain of 11% provides a total return of 22%. As a result, we are initiating coverage on Canfor Pulp with a Sector Outperformer rating.
Although we think that the current distribution level of $1.44/unit is not sustainable, we do not expect the unit price to suffer too much from a reduction in the distributions. We believe that the current cash-on-cash yield of 13% indicates that the market agrees that the current distributions are not sustainable.
In the short term, there might be some natural selling of the Canfor Pulp units, as investors in Canfor Corp. may not be interested in owning a pulp income fund.
We think Canfor Pulp should trade on the basis of a 10% yield. This is the average yield at which the materials income funds are trading.
The expected yield of 11% for 2007 combined with the expected capital gain of 11% provides a total return of 22%. As a result, we are initiating coverage on Canfor Pulp with a Sector Outperformer rating.

Initiating Coverage On Our Preferred Pulp Play As Sector Outperformer - September 28, 2006
28
The fact that we estimate the fund can distribute $0.74/unit under trough conditions makes us comfortable in identifying the downside risk in the unit price. Assuming the same 10% required yield, we do not think the units would trade significantly below $7.50 for a long period of time.
Price Target Calculation Our price target of $13.00 reflects a target yield of 10% based on our 2007 distribution forecast.
Key Risks To Price Target Potential risks to our price target include: a weaker-than-expected global economy that would negatively impact pulp prices, continuing upward pressure on the Canadian dollar, and an increase in fiber prices in British Columbia.
Initiating Coverage On Our Preferred Pulp Play As Sector Outperformer - September 28, 2006
29
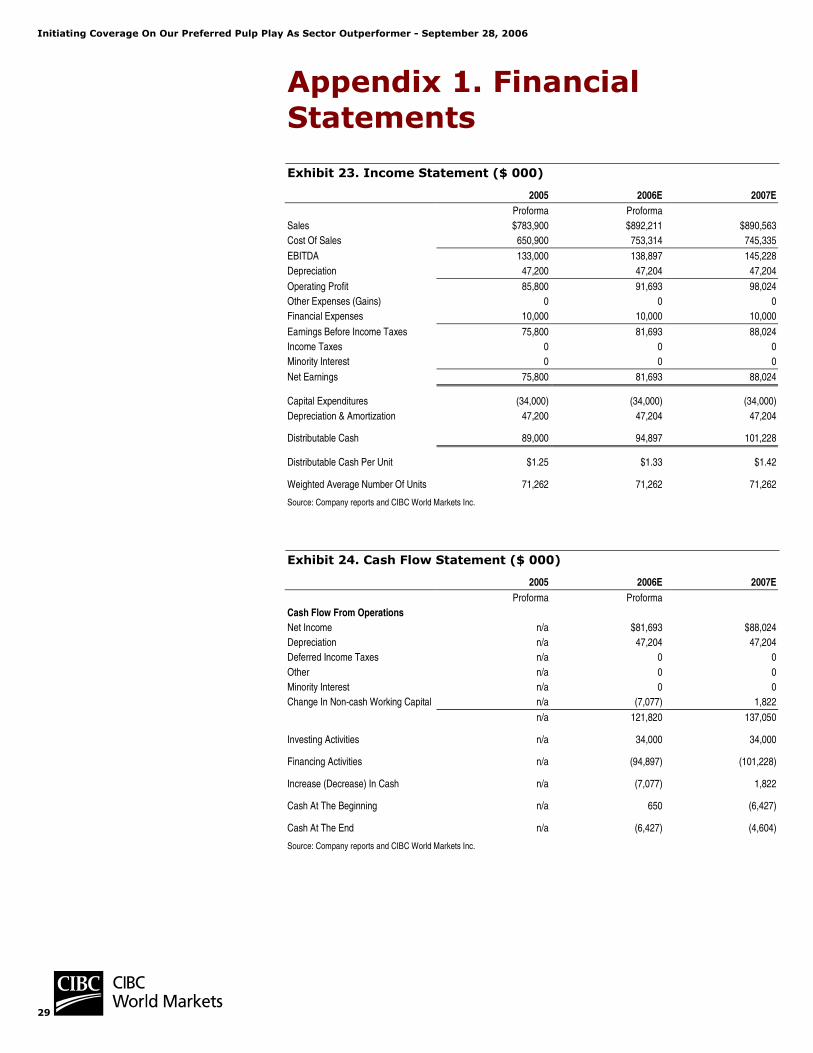
Appendix 1. Financial Statements
Exhibit 23. Income Statement ($ 000)
2005 2006E 2007EProforma Proforma
Sales $783,900 $892,211 $890,563 Cost Of Sales 650,900 753,314 745,335
EBITDA 133,000 138,897 145,228Depreciation 47,200 47,204 47,204
Operating Profit 85,800 91,693 98,024Other Expenses (Gains) 0 0 0Financial Expenses 10,000 10,000 10,000
Earnings Before Income Taxes 75,800 81,693 88,024Income Taxes 0 0 0Minority Interest 0 0 0
Net Earnings 75,800 81,693 88,024
Capital Expenditures (34,000) (34,000) (34,000)Depreciation & Amortization 47,200 47,204 47,204
Distributable Cash 89,000 94,897 101,228
Distributable Cash Per Unit $1.25 $1.33 $1.42
Weighted Average Number Of Units 71,262 71,262 71,262
Source: Company reports and CIBC World Markets Inc.
Exhibit 24. Cash Flow Statement ($ 000)
2005 2006E 2007EProforma Proforma
Cash Flow From OperationsNet Income n/a $81,693 $88,024Depreciation n/a 47,204 47,204 Deferred Income Taxes n/a 0 0 Other n/a 0 0 Minority Interest n/a 0 0 Change In Non-cash Working Capital n/a (7,077) 1,822
n/a 121,820 137,050
Investing Activities n/a 34,000 34,000
Financing Activities n/a (94,897) (101,228)
Increase (Decrease) In Cash n/a (7,077) 1,822
Cash At The Beginning n/a 650 (6,427)
Cash At The End n/a (6,427) (4,604)
Source: Company reports and CIBC World Markets Inc.

Initiating Coverage On Our Preferred Pulp Play As Sector Outperformer - September 28, 2006
30
Exhibit 25. Balance Sheet ($ 000)
2005 2006E 2007EProforma
AssetsCash $650 $0 $0 Other Current Assets 204,634 222,723 220,733
Total Current Assets 205,284 222,723 220,733
Property, Plant & Equipment 631,138 617,934 604,730Goodwill 0 0 0Investments 0 0 0Other Assets 90 90 90
Total Assets 836,512 840,747 825,553
Bank Indebtedness 0 6,427 4,604Other Current Liabilities 79,702 90,714 90,547Current Portion Of Long-term Debt 0 0 0
Total Current Liabilities 79,702 97,141 95,151
Long-term Debt 125,000 125,000 125,000Other Long-term Liabilities 25,700 25,700 25,700Deferred Income Taxes 0 0 0Minority Interest 0 0 0
Total Liabilities 230,402 247,841 245,851
Total Unitholders’ Equity 606,110 592,906 579,702
Total Liabilities And Unitholders’ Equity 836,512 840,747 825,553
Units Outstanding 71,262 71,262 71,262 Book Value $11.74 $11.80 $11.58Total Debt to Total Capital 17% 18% 18%
Source: Company reports and CIBC World Markets Inc.

Initiating Coverage On Our Preferred Pulp Play As Sector Outperformer - September 28, 2006
31
Appendix 2. Directors And Officers
Board Of Directors Peter J.G. Bentley, O.C., LL.D. has served on Canfor’s Board since 1966. He is Chairman of the Board of Directors of Canfor and of Canfor’s principal subsidiary, CFP, and Co-chairman and a director of HSPP General Partner Ltd., the general partner of Howe Sound Pulp and Paper Limited Partnership. After working in various positions throughout Canfor, Mr. Bentley became Executive Vice-President in 1970, President in 1975, and Chairman and CEO in 1985, a position he held until April 24, 1995. Mr. Bentley was reappointed to the position of President and CEO of Canfor on July 25, 1997, and relinquished the position on January 1, 1998. Mr. Bentley is President and a director of Sierra Mountain Minerals Inc. and a member of the Board of the Canadian Institute for Advanced Research, a member of the Advisory Board of BuildDirect.com and a Trustee and Chair Emeritus of the Vancouver General Hospital and University of British Columbia Hospital Foundation. He also served for many years as a director of Bank of Montreal and Shell Canada Ltd. Mr. Bentley is Chancellor of the University of Northern British Columbia. He holds an Honorary Doctorate of Laws degree from the University of British Columbia.
Stan Bracken-Horrocks is a retired partner of PricewaterhouseCoopers LLP and held various leadership positions during his career with PricewaterhouseCoopers LLP, including Global Leader of its Forest and Paper Industry practice. As a member of the Canadian Institute of Chartered Accountants, Mr. Bracken-Horrocks served as a member of the Board of Governors and a member of the Accounting Standards Committee and, as a member of the Institute of Chartered Accountants of British Columbia, he served as a member of council, Vice-President and President. Mr. Bracken-Horrocks is a director of Business Development Corporation, director and treasurer of the Vancouver Police Foundation and a director of G.F. Strong Rehabilitation Centre.
Donald Campbell is the Group President of CAE Inc., a position he has held since May 2002. Mr. Campbell joined CAE in September 2000 and served as Executive Vice President. Prior to this position, Mr. Campbell served as Deputy Foreign Minister and as the Prime Minister’s Personal Representative for G-8 Summits (1997–2000), Canada’s Ambassador to Japan (1993–1997), Deputy Minister for International Trade (1989–1993) and Canada’s Ambassador to Korea (1984–1985). Mr. Campbell is currently a director of Toyota Canada Inc., Rutter Inc., and the Perimeter Institute. In April 1999, Mr. Campbell received the Outstanding Achievement Award of the Public Service of Canada from the Governor General and the Prime Minister. In 2003, Mr. Campbell was appointed by the Prime Minister as the Canadian co-chairman of the Canada-Japan Forum, an external advisory group established by the governments of Japan and Canada to provide advice and to promote the bilateral relationship between the two countries.
Initiating Coverage On Our Preferred Pulp Play As Sector Outperformer - September 28, 2006
32
Charles Jago was appointed President of the University of Northern British Columbia in 1995, in the institution’s second full year of operations. Dr. Jago’s professional service has included membership on the Boards of the Association of Universities and Colleges of Canada, the Association of Commonwealth Universities, and the Office of Partnerships for Advanced Skills (OPAS). He has served as Chair of the Council of Western University Presidents and The University President’s Council of British Columbia and the Northern BC United Way. In the late 1990s he was one of three commissioners of the Nechako Environmental Enhancement Fund, formed to resolve long-standing social and environmental issues related to the Nechako River. He is also a member of the Board of Initiatives of Prince George and of Partnerships BC Inc. Dr. Jago received his BA in Honors English and History from the University of Western Ontario in London, Ontario, and graduated as the Honors gold medalist from Huron College (an affiliated college of the UWO) and with a Commonwealth Scholarship for graduate study at Cambridge University in Britain. In 1969 he graduated from Cambridge with a PhD in History. Dr. Jago was awarded the Queen’s Jubilee Medal for community service in 2003. He received the Order of Canada for his 25 years of outstanding achievement and service to education in June 2005.
Peter Lusztig is Dean Emeritus, Faculty of Commerce and Business Administration, the University of British Columbia. Mr. Lusztig served as the federal commissioner for the B.C. Treaty Commission (Federal) (1995–2003) and is a past director of Canfor. He is also a Trustee of the Health Benefit Trust (B.C.). Mr. Lusztig received his Commerce Degree from the University of British Columbia, his Masters of Business Administration from the University of Western Ontario and his Doctorate Degree from Stanford University.
Paul A. Richards is the President and CEO of the General Partner and holds the position of Vice-President, Pulp and Paper of Canfor. Prior to May 2, 2005, Mr. Richards was Vice-President, Pulp Manufacturing for Weldwood of Canada Limited, overseeing operations at Hinton and Quesnel, a position he held from 1997 to 2004. Prior to that, he served in a variety of positions with Repap from 1984 to 1997, most recently Vice President and General Manager of Repap New Brunswick. Mr. Richards is also a director of PAPRICAN. Mr. Richards received a Bachelor of Chemical Engineering degree from the Technical University of Nova Scotia.
James A. Shepherd is currently President and Chief Executive Officer of Canfor. Mr. Shepherd was appointed President of Canfor on April 1, 2004, and CEO of Canfor on April 30, 2004. From February 1999 to July 2000, Mr. Shepherd was the President and Chief Operating Officer of Slocan Forest Products Ltd. and was appointed CEO of Slocan in July 2000. Prior to this appointment, he was the President and Chief Operating Officer of Crestbrook Forest Industries Ltd. and President of Finlay Forest Industries Limited. Mr. Shepherd received his Mechanical Engineering degree from Queen’s University. He is a director of the Council of Forest Industries, the B.C. Progress Board, the B.C. Forest Safety Council and University of Northern British Columbia and Chairman of the Forest Products Association of Canada.
Initiating Coverage On Our Preferred Pulp Play As Sector Outperformer - September 28, 2006
33
Officers Paul A. Richards is the President and Chief Executive Officer of the General Partner (see above).
Joe Nemeth is the Vice President, Pulp and Paper Sales and Marketing of the General Partner and has held the position of Vice President, Pulp & Paper Marketing of Canfor since January 2003. Mr. Nemeth’s career spans a broad range of forest industry experience. This includes Woodlands, Solid Wood Products and Pulp & Paper sectors in both production and marketing disciplines. Prior to joining Canfor, Mr. Nemeth spent 14 years with Fletcher Challenge Canada (now Catalyst Paper), with his last two positions being Paper Mill Manager at Elk Falls and Vice-President, North American Newsprint Sales. He has a Master of Business Administration degree from the University of Western Ontario and a Bachelor of Forestry (Honours) degree from the University of British Columbia.
Thomas Sitar is the Chief Financial Officer of the General Partner. Prior to that, he was Chief Financial Officer of Gryphon Gold Corporation from November 2004 to May 2006. From 1998 to 2003, he was Vice President, Finance of Weldwood of Canada Limited. Mr. Sitar has 25 years’ experience in the financial management of public companies, including his position as Treasurer of Weldwood when it was a Toronto Stock Exchange-listed company. He has a Bachelor of Commerce from the University of Windsor and is a member of the Institute of Chartered Accountants of B.C.

Initiating Coverage On Our Preferred Pulp Play As Sector Outperformer - September 28, 2006
34
Our DCFPU estimates are shown below:
1 Qtr. 2 Qtr. 3 Qtr. 4 Qtr. Yearly
2005 Current -- -- -- -- --
2006 Current -- -- $0.40E $0.38E $0.78E
2007 Current -- -- -- -- $1.42E
Our CD estimates are shown below:
1 Qtr. 2 Qtr. 3 Qtr. 4 Qtr. Yearly
2005 Current -- -- -- -- --
2006 Current -- -- $0.44E $0.34E $0.78E
2007 Current -- -- -- -- $1.28E

Initiating Coverage On Our Preferred Pulp Play As Sector Outperformer - September 28, 2006
35
IMPORTANT DISCLOSURES:
Analyst Certification: Each CIBC World Markets research analyst named on the front page of this research report, or at the beginning of any subsection hereof, hereby certifies that (i) the recommendations and opinions expressed herein accurately reflect such research analyst's personal views about the company and securities that are the subject of this report and all other companies and securities mentioned in this report that are covered by such research analyst and (ii) no part of the research analyst's compensation was, is, or will be, directly or indirectly, related to the specific recommendations or views expressed by such research analyst in this report.
Potential Conflicts of Interest: Equity research analysts employed by CIBC World Markets are compensated from revenues generated by various CIBC World Markets businesses, including the CIBC World Markets Investment Banking Department within the Corporate and Leveraged Finance Division. Research analysts do not receive compensation based upon revenues from specific investment banking transactions. CIBC World Markets generally prohibits any research analyst and any member of his or her household from executing trades in the securities of a company that such research analyst covers. Additionally, CIBC World Markets generally prohibits any research analyst from serving as an officer, director or advisory board member of a company that such analyst covers.
In addition to 1% ownership positions in covered companies that are required to be specifically disclosed in this report, CIBC World Markets may have a long position of less than 1% or a short position or deal as principal in the securities discussed herein, related securities or in options, futures or other derivative instruments based thereon.
Recipients of this report are advised that any or all of the foregoing arrangements, as well as more specific disclosures set forth below, may at times give rise to potential conflicts of interest.
Important Disclosure Footnotes for Canfor Pulp Income Fund (CFX.UN)
2g CIBC World Markets Inc. expects to receive or intends to seek compensation for investment banking services from Canfor Pulp Income Fund in the next 3 months.
Initiating Coverage On Our Preferred Pulp Play As Sector Outperformer - September 28, 2006
36
Important Disclosure Footnotes for Companies Mentioned in this Report that Are Covered by CIBC World Markets:
Stock Prices as of 09/28/2006: Abitibi-Consolidated Inc. (2a, 2e, 2f, 2g, 6a) (A-TSX, $2.93, Sector Performer)
Bowater Inc. (2g, 7, 9) (BOW-NYSE, US$20.95, Sector Performer) Canfor Corporation (CFP-TSX, $11.19, Sector Performer)
Cascades Inc. (2a, 2e, 2g, 4a, 4b, 7) (CAS-TSX, $12.25, Sector Performer) Catalyst Paper Corporation (2a, 2e) (CTL-TSX, $3.24, Restricted)
Domtar Inc. (2a, 2d, 2g, 7) (DTC-TSX, $6.52, Sector Underperformer) Fraser Papers (2g) (FPS-TSX, $6.80, Sector Underperformer)
International Forest Products Limited (2g, 12) (IFP.A-TSX, $6.52, Sector Outperformer) International Paper Co. (IP-NYSE, US$34.79, Sector Performer)
Louisiana-Pacific Corp. (LPX-NYSE, US$18.97, Sector Performer) Mercer International Inc. (1, 2g) (MERC-NASDAQ, US$9.57, Sector Performer)
Norbord Inc (2g, 7) (NBD-TSX, $8.12, Sector Performer) PRT Forest Regeneration Income Fund (2g, 7) (PRT.UN-TSX, $10.20, Sector Performer)
SFK Pulp Fund (2g) (SFK.UN-TSX, $4.33, Sector Performer) Tembec Inc. (TBC-TSX, $1.35, Sector Underperformer)
TimberWest Forest Corp. (2g, 6a, 7) (TWF.UN-TSX, $14.20, Sector Performer) West Fraser Timber Co. Ltd. (2g) (WFT-TSX, $36.45, Sector Outperformer)
Weyerhaeuser Co. (2a, 2e, 7) (WY-NYSE, US$61.96, Sector Performer)
Companies Mentioned in this Report that Are Not Covered by CIBC World Markets: Stock Prices as of 09/28/2006: April SA (APR-PA, €36.34, Not Rated) Aracruz Celulose (ARA-NYSE, US$50.99, Not Rated)
Asia Pulp & Paper (APUUY-OTC, US$0.05, Not Rated) Empresas CMPC SA (CMPC-CE, [CLP]12350.00, Not Rated)
Grupo Empresarial ENCE (ENC-MA, €36.51, Not Rated) Neenah Paper (NP-NYSE, US$34.50, Not Rated)
Parque Arauco (PAR-SN, [CLP]355.00, Not Rated) Pope & Talbot Inc. (POP-NYSE, US$5.82, Not Rated)
Portucel (PTI-LS, €2.19, Not Rated) Potlatch Corp. (PCH-NYSE, US$37.62, Not Rated)
Rayonier Inc. (RYN-NYSE, US$37.99, Not Rated) Rottneros AB (RROS-ST, [SEK]6.45, Not Rated)
Smurfit Stone Container Corp. (SSCC-NASDAQ, US$11.13, Not Rated) Stora Enso Oyj (SEO-NYSE, US$15.24, Not Rated)
Suzano (SUZB5-SAO, [BRC]14.79, Not Rated) Votorantim Celulose e Papel SA (VCP-NYSE, US$17.05, Not Rated)
Western Forest Products Inc. (WEF-TSX, $1.60, Not Rated)
Important disclosure footnotes that correspond to the footnotes in this table may be found in the "Key to Important Disclosure Footnotes" section of this report.

Initiating Coverage On Our Preferred Pulp Play As Sector Outperformer - September 28, 2006
37
Key to Important Disclosure Footnotes: 1 CIBC World Markets Corp. makes a market in the securities of this company. 2a This company is a client for which a CIBC World Markets company has performed investment banking services
in the past 12 months. 2b CIBC World Markets Corp. has managed or co-managed a public offering of securities for this company in the
past 12 months. 2c CIBC World Markets Inc. has managed or co-managed a public offering of securities for this company in the
past 12 months. 2d CIBC World Markets Corp. has received compensation for investment banking services from this company in
the past 12 months. 2e CIBC World Markets Inc. has received compensation for investment banking services from this company in the
past 12 months. 2f CIBC World Markets Corp. expects to receive or intends to seek compensation for investment banking services
from this company in the next 3 months. 2g CIBC World Markets Inc. expects to receive or intends to seek compensation for investment banking services
from this company in the next 3 months. 3a This company is a client for which a CIBC World Markets company has performed non-investment banking,
securities-related services in the past 12 months. 3b CIBC World Markets Corp. has received compensation for non-investment banking, securities-related services
from this company in the past 12 months. 3c CIBC World Markets Inc. has received compensation for non-investment banking, securities-related services
from this company in the past 12 months. 4a This company is a client for which a CIBC World Markets company has performed non-investment banking,
non-securities-related services in the past 12 months. 4b CIBC World Markets Corp. has received compensation for non-investment banking, non-securities-related
services from this company in the past 12 months. 4c CIBC World Markets Inc. has received compensation for non-investment banking, non-securities-related
services from this company in the past 12 months. 5a The CIBC World Markets Corp. analyst(s) who covers this company also has a long position in its common
equity securities. 5b A member of the household of a CIBC World Markets Corp. research analyst who covers this company has a
long position in the common equity securities of this company. 6a The CIBC World Markets Inc. fundamental analyst(s) who covers this company also has a long position in its
common equity securities. 6b A member of the household of a CIBC World Markets Inc. fundamental research analyst who covers this
company has a long position in the common equity securities of this company. 7 CIBC World Markets Corp., CIBC World Markets Inc., and their affiliates, in the aggregate, beneficially own 1%
or more of a class of equity securities issued by this company. 8 A partner, director or officer of CIBC World Markets Inc. or any analyst involved in the preparation of this
research report has provided services to this company for remuneration in the past 12 months. 9 A senior executive member or director of Canadian Imperial Bank of Commerce ("CIBC"), the parent company
to CIBC World Markets Inc. and CIBC World Markets Corp., or a member of his/her household is an officer, director or advisory board member of this company or one of its subsidiaries.
10 Canadian Imperial Bank of Commerce ("CIBC"), the parent company to CIBC World Markets Inc. and CIBC World Markets Corp., has a significant credit relationship with this company.
11 The equity securities of this company are restricted voting shares. 12 The equity securities of this company are subordinate voting shares.
13 The equity securities of this company are non-voting shares. 14 The equity securities of this company are limited voting shares.

Initiating Coverage On Our Preferred Pulp Play As Sector Outperformer - September 28, 2006
38
CIBC World Markets Price Chart
No rating history data found for Canfor Pulp Income Fund

Initiating Coverage On Our Preferred Pulp Play As Sector Outperformer - September 28, 2006
39
CIBC World Markets' Stock Rating System
Abbreviation Rating Description
Stock Ratings
SO Sector Outperformer Stock is expected to outperform the sector during the next 12-18 months.
SP Sector Performer Stock is expected to perform in line with the sector during the next 12-18 months.
SU Sector Underperformer Stock is expected to underperform the sector during the next 12-18 months.
NR Not Rated CIBC World Markets does not maintain an investment recommendation on the stock.
R Restricted CIBC World Markets is restricted*** from rating the stock.
Sector Weightings**
O Overweight Sector is expected to outperform the broader market averages.
M Market Weight Sector is expected to equal the performance of the broader market averages.
U Underweight Sector is expected to underperform the broader market averages.
NA None Sector rating is not applicable.
**Broader market averages refer to the S&P 500 in the U.S. and the S&P/TSX Composite in Canada. "Speculative" indicates that an investment in this security involves a high amount of risk due to volatility and/or liquidity issues. ***Restricted due to a potential conflict of interest.
Ratings Distribution*: CIBC World Markets' Coverage Universe
(as of 28 Sep 2006) Count Percent Inv. Banking Relationships Count Percent
Sector Outperformer (Buy) 321 40.1% Sector Outperformer (Buy) 165 51.4%
Sector Performer (Hold/Neutral) 397 49.6% Sector Performer (Hold/Neutral) 191 48.1%
Sector Underperformer (Sell) 63 7.9% Sector Underperformer (Sell) 27 42.9%
Restricted 15 1.9% Restricted 12 80.0%
Ratings Distribution: Paper & Forest Products Coverage Universe
(as of 28 Sep 2006) Count Percent Inv. Banking Relationships Count Percent
Sector Outperformer (Buy) 3 18.8% Sector Outperformer (Buy) 3 100.0%
Sector Performer (Hold/Neutral) 9 56.3% Sector Performer (Hold/Neutral) 6 66.7%
Sector Underperformer (Sell) 3 18.8% Sector Underperformer (Sell) 2 66.7%
Restricted 1 6.3% Restricted 1 100.0%
Paper & Forest Products Sector includes the following tickers: A, BOW, CAS, CFP, CFX.UN, CTL, DTC, FPS, IFP.A, IP, LPX, MERC, NBD, TBC, WFT, WY.
*Although the investment recommendations within the three-tiered, relative stock rating system utilized by CIBC World Markets do not correlate to buy, hold and sell recommendations, for the purposes of complying with NYSE and NASD rules, CIBC World Markets has assigned buy ratings to securities rated Sector Outperformer, hold ratings to securities rated Sector Performer, and sell ratings to securities rated Sector Underperformer without taking into consideration the analyst's sector weighting.
Important disclosures required by IDA Policy 11, including potential conflicts of interest information, our system for rating investment opportunities and our dissemination policy can be obtained by visiting CIBC World Markets on the web at http://research.cibcwm.com/res/Policies/Policies.html or by writing to CIBC World Markets Inc., BCE Place, 161 Bay Street, 4th Floor, Toronto, Ontario M5J 2S8, Attention: Research Disclosures Request.

Initiating Coverage On Our Preferred Pulp Play As Sector Outperformer - September 28, 2006
40
Legal Disclaimer
This report is issued and approved for distribution by (i) in Canada, CIBC World Markets Inc., a member of the Investment Dealers Association ("IDA"), the Toronto Stock Exchange, the TSX Venture Exchange and CIPF, (ii) in the United Kingdom, CIBC World Markets plc, which is regulated by the Financial Services Authority ("FSA"), and (iii) in Australia, CIBC World Markets Australia Limited, a member of the Australian Stock Exchange and regulated by the ASIC (collectively, "CIBC World Markets"). This report is distributed in the Unites States by CIBC World Markets Inc. and has not been reviewed or approved by CIBC World Markets Corp., a member of the New York Stock Exchange ("NYSE"), NASD and SIPC. This report is intended for distribution in the United States only to Major Institutional Investors (as such term is defined in SEC 15a-6 and Section 15 of the Securities Exchange Act of 1934, as amended) and is not intended for the use of any person or entity that is not a major institutional investor. Major Institutional Investors receiving this report should effect transactions in securities discussed in the report through CIBC World Markets Corp. This report is provided, for informational purposes only, to institutional investor and retail clients of CIBC World Markets in Canada, and does not constitute an offer or solicitation to buy or sell any securities discussed herein in any jurisdiction where such offer or solicitation would be prohibited. This document and any of the products and information contained herein are not intended for the use of private investors in the United Kingdom. Such investors will not be able to enter into agreements or purchase products mentioned herein from CIBC World Markets plc. The comments and views expressed in this document are meant for the general interests of clients of CIBC World Markets Australia Limited. The securities mentioned in this report may not be suitable for all types of investors. This report does not take into account the investment objectives, financial situation or specific needs of any particular client of CIBC World Markets. Recipients should consider this report as only a single factor in making an investment decision and should not rely solely on investment recommendations contained herein, if any, as a substitution for the exercise of independent judgment of the merits and risks of investments. The analyst writing the report is not a person or company with actual, implied or apparent authority to act on behalf of any issuer mentioned in the report. Before making an investment decision with respect to any security recommended in this report, the recipient should consider whether such recommendation is appropriate given the recipient's particular investment needs, objectives and financial circumstances. CIBC World Markets suggests that, prior to acting on any of the recommendations herein, Canadian retail clients of CIBC World Markets contact one of our client advisers in your jurisdiction to discuss your particular circumstances. Non-client recipients of this report who are not institutional investor clients of CIBC World Markets should consult with an independent financial advisor prior to making any investment decision based on this report or for any necessary explanation of its contents. CIBC World Markets will not treat non-client recipients as its clients by virtue of their receiving this report. Past performance is not a guarantee of future results, and no representation or warranty, express or implied, is made regarding future performance of any security mentioned in this report. The price of the securities mentioned in this report and the income they produce may fluctuate and/or be adversely affected by exchange rates, and investors may realize losses on investments in such securities, including the loss of investment principal. CIBC World Markets accepts no liability for any loss arising from the use of information contained in this report, except to the extent that liability may arise under specific statutes or regulations applicable to CIBC World Markets. Information, opinions and statistical data contained in this report were obtained or derived from sources believed to be reliable, but CIBC World Markets does not represent that any such information, opinion or statistical data is accurate or complete (with the exception of information contained in the Important Disclosures section of this report provided by CIBC World Markets or individual research analysts), and they should not be relied upon as such. All estimates, opinions and recommendations expressed herein constitute judgments as of the date of this report and are subject to change without notice. Nothing in this report constitutes legal, accounting or tax advice. Since the levels and bases of taxation can change, any reference in this report to the impact of taxation should not be construed as offering tax advice on the tax consequences of investments. As with any investment having potential tax implications, clients should consult with their own independent tax adviser. This report may provide addresses of, or contain hyperlinks to, Internet web sites. CIBC World Markets has not reviewed the linked Internet web site of any third party and takes no responsibility for the contents thereof. Each such address or hyperlink is provided solely for the recipient's convenience and information, and the content of linked third-party web sites is not in any way incorporated into this document. Recipients who choose to access such third-party web sites or follow such hyperlinks do so at their own risk. Although each company issuing this report is a wholly owned subsidiary of Canadian Imperial Bank of Commerce ("CIBC"), each is solely responsible for its contractual obligations and commitments, and any securities products offered or recommended to or purchased or sold in any client accounts (i) will not be insured by the Federal Deposit Insurance Corporation ("FDIC"), the Canada Deposit Insurance Corporation or other similar deposit insurance, (ii) will not be deposits or other obligations of CIBC, (iii) will not be endorsed or guaranteed by CIBC, and (iv) will be subject to investment risks, including possible loss of the principal invested. The CIBC trademark is used under license. © 2006 CIBC World Markets Inc. All rights reserved. Unauthorized use, distribution, duplication or disclosure without the prior written permission of CIBC World Markets is prohibited by law and may result in prosecution.