Embed Size (px)
Citation preview

2018
SH&E Industry Salary Survey

SH&E Industry
2018 Salary Survey
CONTENTS
Survey Details ..................................................................................................................... 1
About Readex Research ...................................................................................................... 2
Findings
Compensation
Base Salary ......................................................................................................... 3
Base Salary by Licenses/Certifications Held & by Education ........................... 4
Base Salary by Other Segments Analyzed ......................................................... 5
Change in Base Salary ........................................................................................ 6
Other Cash Compensation .................................................................................. 7
Benefits
Number of Weeks of Paid Time Off .................................................................. 8
Other Benefits Offered ....................................................................................... 9
Organization Profile
Size of Organization ......................................................................................... 10
SH&E Department ........................................................................................... 11
Nature of Organization ..................................................................................... 12
Organization’s NAICS Classification .............................................................. 12
About Their Work
Level in Organization ....................................................................................... 13
Job Title ............................................................................................................ 13
Proportion Who Directly Supervise Staff......................................................... 14
Number of People Directly Supervised by Type .............................................. 14
Number of Hours Worked [If Full Time] ......................................................... 15
Proportion of Work Time Devoted to Functions .............................................. 16
Proportion of Time Traveling for Job .............................................................. 16
Primary Work Environment ............................................................................. 17
Primary Work Location .................................................................................... 17
Number of Locations/Clients/Serviced/Supported ........................................... 18
Locations Supported Outside the U.S. ............................................................. 19
Professional Profile
SH&E Industry Tenure ..................................................................................... 20
First Entrance Into SH&E Practice .................................................................. 20
Licenses/Certifications Held ............................................................................ 21
Reasons for Pursuing Certification ................................................................... 22
Memberships Held ........................................................................................... 23
Demographics
Education .......................................................................................................... 24
Location Where Degree/Diploma Earned ........................................................ 24
Gender .............................................................................................................. 25
Age ................................................................................................................... 25
© 2018 Readex Research
1
SH&E Industry
2018 Salary Survey
SURVEY DETAILS
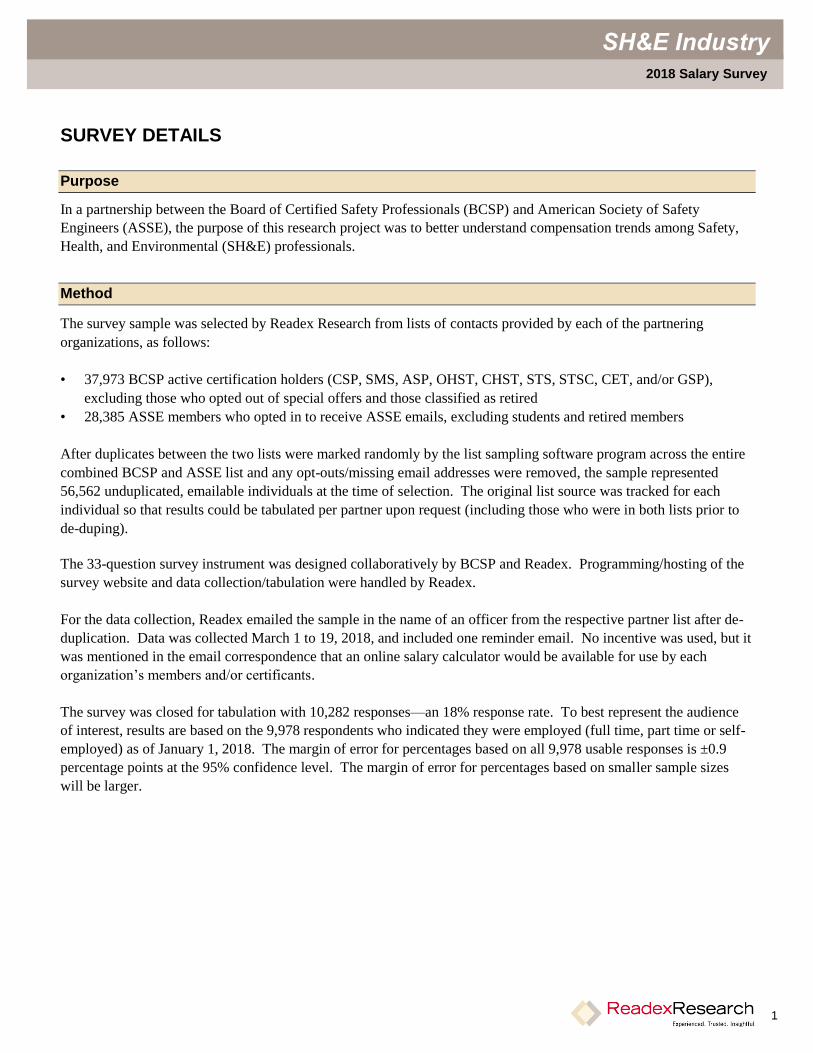
Purpose
In a partnership between the Board of Certified Safety Professionals (BCSP) and American Society of Safety
Engineers (ASSE), the purpose of this research project was to better understand compensation trends among Safety,
Health, and Environmental (SH&E) professionals.
Method
The survey sample was selected by Readex Research from lists of contacts provided by each of the partnering
organizations, as follows:
• 37,973 BCSP active certification holders (CSP, SMS, ASP, OHST, CHST, STS, STSC, CET, and/or GSP),
excluding those who opted out of special offers and those classified as retired
• 28,385 ASSE members who opted in to receive ASSE emails, excluding students and retired members
After duplicates between the two lists were marked randomly by the list sampling software program across the entire
combined BCSP and ASSE list and any opt-outs/missing email addresses were removed, the sample represented
56,562 unduplicated, emailable individuals at the time of selection. The original list source was tracked for each
individual so that results could be tabulated per partner upon request (including those who were in both lists prior to
de-duping).
The 33-question survey instrument was designed collaboratively by BCSP and Readex. Programming/hosting of the
survey website and data collection/tabulation were handled by Readex.
For the data collection, Readex emailed the sample in the name of an officer from the respective partner list after de-
duplication. Data was collected March 1 to 19, 2018, and included one reminder email. No incentive was used, but it
was mentioned in the email correspondence that an online salary calculator would be available for use by each
organization’s members and/or certificants.
The survey was closed for tabulation with 10,282 responses—an 18% response rate. To best represent the audience
of interest, results are based on the 9,978 respondents who indicated they were employed (full time, part time or self-
employed) as of January 1, 2018. The margin of error for percentages based on all 9,978 usable responses is ±0.9
percentage points at the 95% confidence level. The margin of error for percentages based on smaller sample sizes
will be larger.
2
SH&E Industry
2018 Salary Survey
ABOUT READEX RESEARCH
Readex Research is a nationally recognized independent research company located in Stillwater, Minnesota. Its roots
are in survey research for the magazine publishing industry, but specialization in conducting high-quality survey
research (by mail and/or the Internet) has brought clients from many other markets, including associations, corporate
marketers and communicators, and government agencies. Since its founding in 1947, Readex has completed
thousands of surveys for a lengthy and diverse list of clients.
As a full-service survey research supplier, Readex provides in-house processing of all phases of each project
(traditional mailing, broadcast emailing, and data processing) to ensure complete control over project quality and
schedule. Analytical capabilities include a range of multivariate statistics and modeling techniques, in addition to the
more traditional stub-and-banner tabulations.
This survey was conducted and this report was prepared by Readex in accordance with accepted research standards
and practices.
3
SH&E Industry
2018 Salary Survey
FINDINGS: Compensation
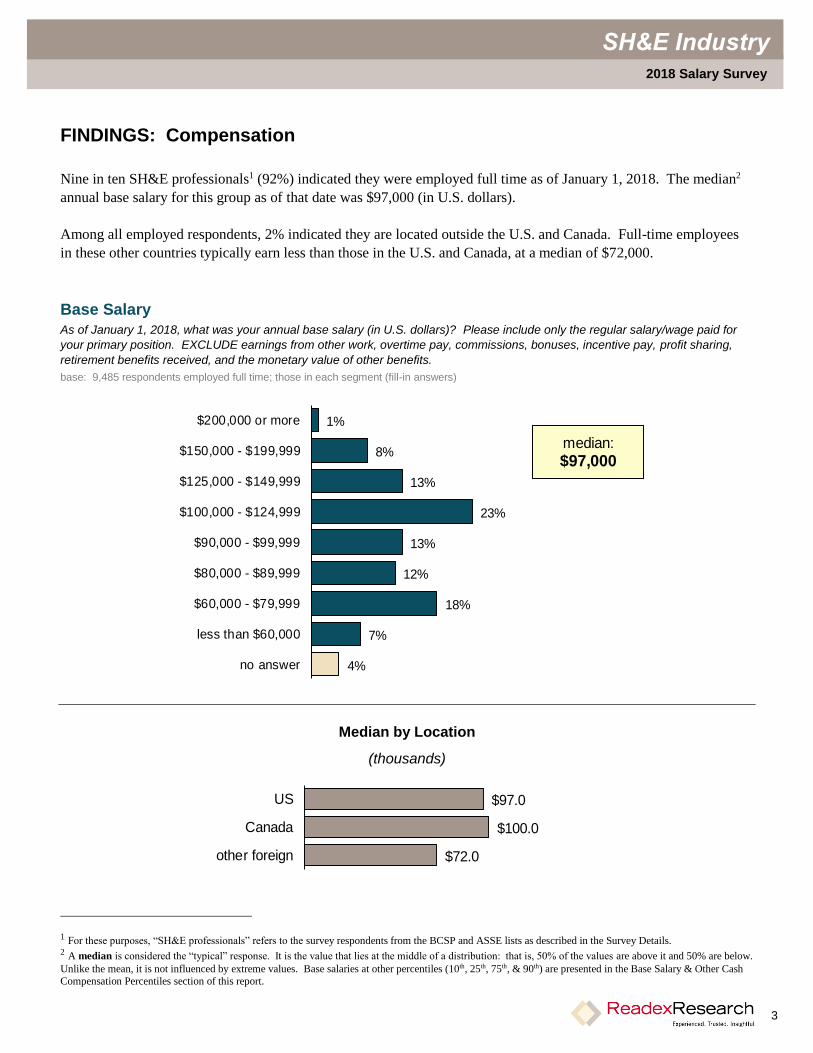
Nine in ten SH&E professionals1 (92%) indicated they were employed full time as of January 1, 2018. The median2
annual base salary for this group as of that date was $97,000 (in U.S. dollars).
Among all employed respondents, 2% indicated they are located outside the U.S. and Canada. Full-time employees
in these other countries typically earn less than those in the U.S. and Canada, at a median of $72,000.
Base Salary
As of January 1, 2018, what was your annual base salary (in U.S. dollars)? Please include only the regular salary/wage paid for
your primary position. EXCLUDE earnings from other work, overtime pay, commissions, bonuses, incentive pay, profit sharing,
retirement benefits received, and the monetary value of other benefits.
base: 9,485 respondents employed full time; those in each segment (fill-in answers)
1%
8%
13%
23%
13%
12%
18%
7%
4%
$200,000 or more
$150,000 - $199,999
$125,000 - $149,999
$100,000 - $124,999
$90,000 - $99,999
$80,000 - $89,999
$60,000 - $79,999
less than $60,000
no answer
median:
$97,000
Median by Location
(thousands)
$97.0
$100.0
$72.0
US
Canada
other foreign
1 For these purposes, “SH&E professionals” refers to the survey respondents from the BCSP and ASSE lists as described in the Survey Details. 2 A median is considered the “typical” response. It is the value that lies at the middle of a distribution: that is, 50% of the values are above it and 50% are below.
Unlike the mean, it is not influenced by extreme values. Base salaries at other percentiles (10th, 25th, 75th, & 90th) are presented in the Base Salary & Other Cash
Compensation Percentiles section of this report.

4
SH&E Industry
2018 Salary Survey
FINDINGS: Compensation
Full-time SH&E professionals with at least one of 12 licenses/certifications (ASP, CDGP, CET, CHMM, CHMP,
CHST, CIH, CSP, OHST, SMS, STSC, and/or STS) typically earn $20,000 more per year than those with none of
these licenses/certifications ($100,000 versus $80,000).
BCSP’s CSP certification adds $13,000 to the median base salary for all full-time SH&E professionals, and it adds
$30,000 to the median compared with the salaries of those who have none of the 12 licenses/certifications.
Similar to certification, formal education also correlates positively with base salary. For example, those with a
Doctoral degree typically earn $16,000 more annually than those with a Bachelor’s degree and $20,000 more than
those with an Associate degree.
Base Salary by Licenses/Certifications Held & by Education
As of January 1, 2018, what was your annual base salary (in U.S. dollars)?
base: 9,485 respondents employed full time; those in each segment (fill-in answers)
$97.0
$119.8
$110.0
$112.0
$106.7
$94.0
$80.0
$100.0
$110.0
$105.0
$94.0
$90.0
$100.7
$91.0
ALL FULL-TIME
CIH
CSP
CHMM
other IHMM
other BCSP
none of the above
at least one of the above
Doctoral
Master's
Bachelor's
Associate
diploma program
<secondary degree
median (thousands)

5
SH&E Industry
2018 Salary Survey
FINDINGS: Compensation
As might be expected, the median base salary correlates positively with industry tenure and size of organization.
Additionally, those with titles of director, manager, chief, or department head typically earn $9,000 more annually
than those employed as branch/division/area/regional managers or supervisors, who earn at least $11,000 more than
professionals or consultants.
There is also a discrepancy in median base salary by gender, with males earning $9,000 more annually than females.
However, their profiles may help explain at least some of the difference. Males tend to have longer industry tenure,
hold higher level positions in their organizations, and/or are more likely to directly supervise other staff. Each of
these characteristics is likely to translate to a higher salary based on the survey results.
Base Salary by Other Segments Analyzed
As of January 1, 2018, what was your annual base salary (in U.S. dollars)?
base: 9,485 respondents employed full time; those in each segment (fill-in answers); employed respondents for Differences in Profile by Gender
$97.0
$118.0$105.0
$90.0$68.2
$108.0$99.8
$90.0$85.0
$110.0$101.0
$87.0$90.0
$99.0$90.0
ALL FULL-TIME
INDUSTRY TENURE: 25+ years15 - 24 years5 - 14 years
<5 years
SH&E EMPLOYEES IN ORG: 51+11 -502 - 10
1
JOB TITLE: director/mgr/etc.branch/division/etc. mgr/supv
professionalconsultant
malefemale
median (thousands)
Differences in Profile by Gender male female
industry tenure (median) 16 years 14 years
director/manager/chief/department head 29% 23%
professional 35% 41%
directly supervise other staff 50% 36%

6
SH&E Industry
2018 Salary Survey
FINDINGS: Compensation
Compared with one year previous, the typical SH&E professional who was employed full time saw a 3% increase in
base salary as of January 1, 2018. Only 2% reported a decrease in their base salary; 72% reported an increase; 17%
no change. Because they couldn’t compare, those who were not in the same position one year ago were not included
in the median calculation.
Change in Base Salary
Compared to one year previous, how has that base salary changed?
base: 9,485 respondents employed full time (fill-in answers)
72%
10%
12%
6%
22%
16%
5%
1%
17%
2%
10%
INCREASED:
by 10% or more
by 5% - 9%
by 4%
by 3%
by 2%
by less than 2%
increase not specified
NO CHANGE
DECREASED
not comparable/no answer
median % change:
+3%

7
SH&E Industry
2018 Salary Survey
FINDINGS: Compensation
Approximately two in three SH&E professional employed full time (66%) were eligible to receive other cash
compensation beyond a base salary in the 12 months prior to January 1, 2018. Among those who were eligible, the
median value received was $9,000. Considering all full-time respondents (not just those eligible), the median drops to
$4,000.
Eligible SH&E professional at larger organizations (in terms of the number of SH&E employees) typically received
higher amounts of additional cash than those at smaller organizations. And, job title also makes a difference in additional
cash received, with directors/managers/chiefs/department heads and branch/division/area/regional managers/supervisors
typically receiving more than professionals and consultants.
Other Cash Compensation
Whether or not you received any, were you eligible to receive other cash compensation beyond your salary in the 12 months prior
to January 1, 2018? Other cash compensation would include bonuses, commission, incentive pay, overtime, profit sharing,
deferred compensation, and cash retirement benefits received.
base: those employed full time who were eligible to receive other cash compensation; those in each segment (fill-in answers)
$9.0
$10.0
$10.0
$7.5
$5.6
$10.0
$10.0
$6.1
$5.0
ALL ELIGIBLE (FULL-TIME)
SH&E EMPLOYEES IN ORG: 51+
11 -50
2 - 10
1
JOB TITLE: director/mgr/etc.
branch/division/etc. mgr/supv
professional
consultant
median (thousands)
Among all full-time(not just those eligible),
the median =
$4,000

8
SH&E Industry
2018 Salary Survey
FINDINGS: Benefits
The typical full-time SH&E professional qualified for 4 weeks of paid time off (vacation and sick time or PTO)
annually as of January 1, 2018.
As would be expected, the average number of weeks of paid time off increases with industry tenure.
Number of Weeks Paid Time Off
As of January 1, 2018, how many weeks of paid time off (vacation and sick time or PTO) do you qualify for?
base: 9,485 respondents employed full time: those in each segment
9%8%
15%
24%26%
13%
2%3%
7+654321none
median: 4 weeks
Number of Weeks Paid Time Off
<5 5 - 14 15 -24 25+
7 or more 6% 8% 9% 14%
6 3% 6% 8% 12%
5 8% 11% 17% 21%
4 15% 24% 28% 26%
3 28% 30% 26% 18%
2 30% 16% 9% 6%
1 5% 2% 1% 1%
none 5% 4% 2% 2%
mean 3.1 3.6 4.1 4.4
median 3 3 4 4
INDUSTRY TENURE (YEARS)

9
SH&E Industry
2018 Salary Survey
FINDINGS: Benefits
Full-time SH&E professionals are offered a variety of benefits by their employers. Health insurance is the most
commonly offered (90%). About four in five are offered dental insurance (83%), retirement savings plans (80%),
and/or vision care (78%).
Benefits packages differ by the size of the organization, with the odds of each benefit being offered higher for those at
larger organizations, generally.
Other Benefits Offered
Which of the following other benefits does your employer offer (whether you make use of it or not)?
base: 9,485 respondents employed full time; those in each segment (multiple answers)
TOTAL 1 2-10 11-50 51+
health care insurance 90% 87% 89% 91% 92%
dental insurance 83% 78% 80% 85% 86%
retirement savings plan (e.g., 401(k)) 80% 73% 78% 82% 85%
vision care 78% 67% 75% 80% 84%
group life insurance 71% 60% 68% 72% 78%
short-term disability 70% 60% 66% 71% 77%
sick leave 68% 60% 65% 69% 73%
long-term disability 67% 53% 63% 68% 76%
employee assistance program (EAP) 67% 55% 61% 70% 75%
bonus 66% 56% 63% 67% 73%
professional development opportunities 65% 51% 62% 67% 72%
tuition reimbursement 61% 45% 55% 65% 71%
association dues reimbursement 60% 52% 56% 62% 66%
flexible spending plan 51% 38% 46% 52% 59%
flex time/schedule 47% 39% 44% 46% 54%
maternity/paternity benefits 44% 27% 38% 45% 54%
pension 28% 19% 23% 28% 38%
voluntary benefits (AFLAC, prepaid legal, etc.) 28% 22% 26% 27% 33%
car allowance 26% 22% 27% 27% 25%
long-term care 25% 13% 21% 26% 35%
profit sharing 24% 20% 23% 25% 24%
health club membership 23% 16% 21% 25% 27%
stock options 21% 9% 14% 22% 33%
incentive compensation 20% 11% 16% 20% 28%
retiree medical 13% 8% 10% 13% 21%
cafeteria plan 11% 10% 11% 10% 11%
onsite childcare 3% 1% 2% 3% 5%
NUMBER OF SH&E EMPLOYEES
=80%+ =60% - 79% =30% - 59%

10
SH&E Industry
2018 Salary Survey
FINDINGS: Organization Profile
SH&E professionals work for a wide range of organization sizes. The typical employed respondent works for an
organization with 1,830 employees, including 14 SH&E professionals. The mean numbers for each are much higher
due to some large reports (10,500 and 95.6, respectively).
Size of Organization
How many employees are in your organization? Including yourself, how many SH&E professionals does your organization employ?
base: 9,978 employed respondents
10%
2%
3%
2%
9%
8%
10%
11%
10%
11%
9%
5%
3%
2%
3%
2%
more than 50,000
40,001 - 50,000
30,001 - 40,000
25,001 - 30,000
10,001 - 25,000
5,001 - 10,000
2,501 - 5,000
1,001 - 2,500
501 - 1,000
251 - 500
101 - 250
51 - 100
26 - 50
11 - 25
2 - 10
1
Number of Employees
mean: 10,500median: 1,830
3%
3%
5%
8%
10%
11%
14%
12%
9%
13%
12%
more than 1,000
501 - 1,000
251 - 500
101 - 250
51 - 100
26 - 50
11 - 25
6 - 10
4 - 5
2 - 3
1
Number of SH&E Professionals
mean: 95.6median: 14

11
SH&E Industry
2018 Salary Survey
FINDINGS: Organization Profile
The SH&E function is housed in various departments across employed respondents’ organizations. Operations/production
is the most common department in which the SH&E function resides, at 24%, followed by risk management (17%) and
human resources/administration (12%).
SH&E Department
In what department is the SH&E function located in your organization?
base: 9,978 employed respondents
24%
17%
12%
4%
3%
2%
23%
14%
operations/production
risk management
HR/administration
engineering
regulatory affairs
legal
other department
multiple departments

12
SH&E Industry
2018 Salary Survey
FINDINGS: Organization Profile
About half of employed SH&E professionals (48%) work for organizations that are privately owned, 32% work for
publicly traded companies, 13% are government employees. Very few work for non-profits (3%) or academic institutions
(2%).
The NAICS classification for their organizations varies widely, with no more than 9% indicating each.
Nature of Organization
Which of these best describes the nature of your organization?
base: 9,978 employed respondents
privately owned48%
publicly traded ownership
32%
government13%not-for-profit
3%
academic2%
other2%
Organization's NAICS Classification
What is the primary NAICS classification for the organization at which you worked as of January 1, 2018?
base: 9,978 employed respondents
23 Construction (general) 9%
31-33 Manufacturing 9%
524 Insurance carriers and related activities 6%
237 Heavy and civil engineering construction 5%
236 Construction of buildings 5%
211 Oil and gas extraction 5%
325 Chemical manufacturing 4%
5416 Mgmt, scientific, and technical consulting services (including SH&E) 3%
92 Public Administration 3%
2211 Electric power generation, transmission and distribution 3%
6113 Colleges, universities, and professional schools 3%
238 Specialty trade contractors 3%
Top Mentions

13
SH&E Industry
2018 Salary Survey
FINDINGS: About Their Work
About a third of employed SH&E professionals (31%) work at the corporate/highest level of their organization. Only 5%
are executives (president/CEO/owner/VP/GM); the largest segment (36%) falls into the professional job title category.
Level in Organization
At what level within your organization do you work?
base: 9,978 employed respondents
31%
21%
23%
19%
3%
3%
corporate/highest level
regional level
department level
specific plant or operating unit
self-employed
other
Job Title
Which of the following best characterizes your job title?
base: 9,978 employed respondents
5%
28%
15%
9%
2%
2%
19%
10%
6%
1%
2%
36%
21%
5%
4%
3%
3%
9%
4%
4%
1%
3%
PRES/CEO/OWNER/VP/GM
DIR/MGR/CHIEF/DEPT HEAD:
SH&E
safety
risk management/loss control
other
BRANCH/DIV/REG'L MGR/SUPV:
SH&E
safety
risk management/loss control
other
PROFESSIONAL:
safety professional
safety coordinator
safety engineer
industrial hygienists
other
CONSULTANT:
SH&E
safety
other
OTHER

14
SH&E Industry
2018 Salary Survey
FINDINGS: About Their Work
About half (47%) of employed SH&E professionals directly supervise other staff. Among those who do, the average
number of staff supervised is 20.6. Close to one-third of that staff (6.3) specializes in SH&E, on average.
Proportion Who Directly Supervise Staff
Do you directly supervise other staff?
base: 9,978 employed respondents
directly supervise others
47%
do not52%
Number of People Directly Supervised by Type
[If you supervise others] How many of the people you directly supervise are in each of these categories?
base: 4,618 respondents who directly supervise other staff answering (fill-in answers)
do not14.3
specialize in SH&E
6.3
mean summary
20.6
TOTAL

15
SH&E Industry
2018 Salary Survey
FINDINGS: About Their Work
The typical SH&E professional who works full time works 46 hours per week. 6% indicated they work 60 or more hours.
Those with higher-level job titles tend to work slightly more hours than professionals and consultants.
Number of Hours Worked [If Full Time]
About how many hours do you work in a typical week?
base: 9,485 respondents employed full time; those in each segment
6%7%
16%
27%
21%20%
2%
60+55 - 5950 - 5445 - 4941 - 444035 - 39
median: 46 hours
by Job Title median #
of hours
director/manager/chief/department head 48
branch/division/area/regional manager/supervisor 47
professional 44
consultant 43
16
SH&E Industry
2018 Salary Survey
FINDINGS: About Their Work
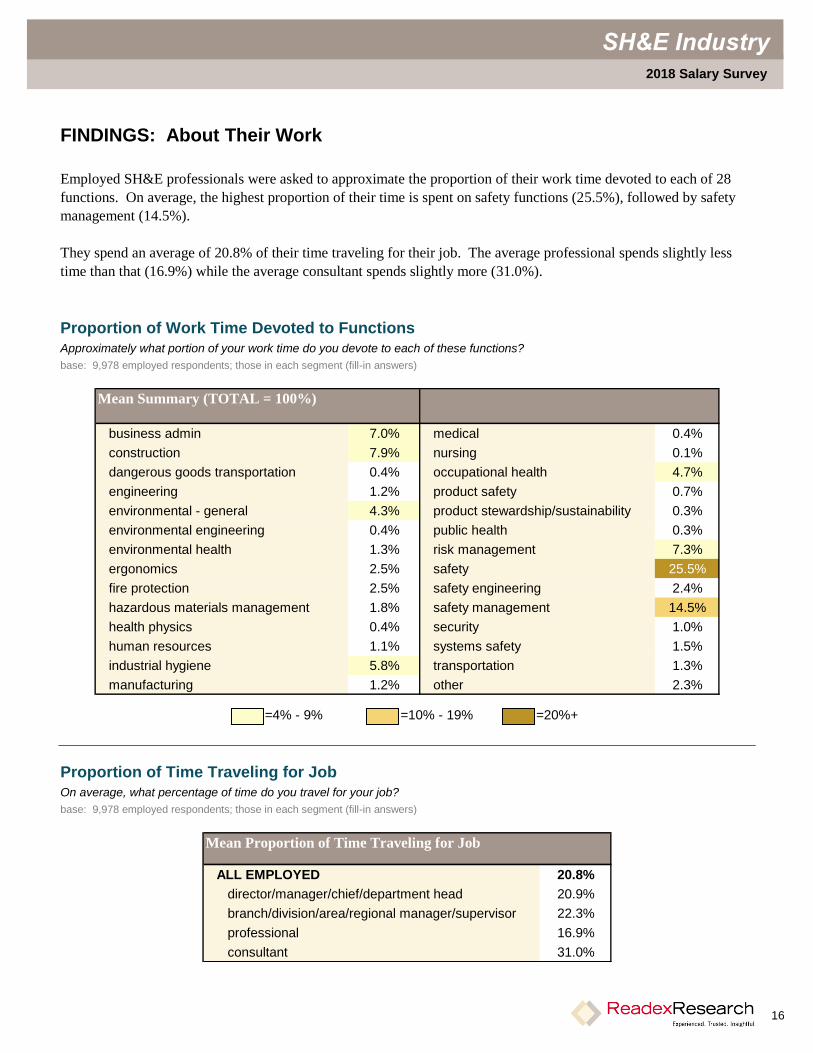
Employed SH&E professionals were asked to approximate the proportion of their work time devoted to each of 28
functions. On average, the highest proportion of their time is spent on safety functions (25.5%), followed by safety
management (14.5%).
They spend an average of 20.8% of their time traveling for their job. The average professional spends slightly less
time than that (16.9%) while the average consultant spends slightly more (31.0%).
Proportion of Work Time Devoted to Functions
Approximately what portion of your work time do you devote to each of these functions?
base: 9,978 employed respondents; those in each segment (fill-in answers)
Mean Summary (TOTAL = 100%)
business admin 7.0% medical 0.4%
construction 7.9% nursing 0.1%
dangerous goods transportation 0.4% occupational health 4.7%
engineering 1.2% product safety 0.7%
environmental - general 4.3% product stewardship/sustainability 0.3%
environmental engineering 0.4% public health 0.3%
environmental health 1.3% risk management 7.3%
ergonomics 2.5% safety 25.5%
fire protection 2.5% safety engineering 2.4%
hazardous materials management 1.8% safety management 14.5%
health physics 0.4% security 1.0%
human resources 1.1% systems safety 1.5%
industrial hygiene 5.8% transportation 1.3%
manufacturing 1.2% other 2.3%
Proportion of Time Traveling for Job
On average, what percentage of time do you travel for your job?
base: 9,978 employed respondents; those in each segment (fill-in answers)
Mean Proportion of Time Traveling for Job
ALL EMPLOYED 20.8%
director/manager/chief/department head 20.9%
branch/division/area/regional manager/supervisor 22.3%
professional 16.9%
consultant 31.0%
=20%+ =10% - 19% =4% - 9%

17
SH&E Industry
2018 Salary Survey
FINDINGS: About Their Work
About half of employed SH&E professionals primarily work in their organizations’ facilities/offices (58%) versus in the
field (30%) or at a home office (12%). This varies somewhat by job title, with directors/managers/chiefs/department
heads most likely to be primarily located at their organizations’ facilities/offices and consultants more likely than others
to primarily work in the field or at home offices.
Among all employed SH&E professionals, 90% primarily work in the U.S, 3% outside the U.S., and 6% in both.
93% of those located in the U.S. primarily work in the U.S.; none work primarily outside the U.S. only, but 6%
indicated they primarily work both in and outside the country. 80% of Canadians and 93% of those in other foreign
countries primarily work outside the U.S.; none work primarily in the U.S. only.
Primary Work Environment
What is your primary work environment?
base: 9,978 employed respondents; those in each segment
TOTAL dir/mgr/etc
branch/div
mgr/supv
profes-
sional consultant
organization's facility/office 58% 73% 61% 56% 25%
in the field 30% 15% 28% 37% 50%
home office 12% 12% 10% 7% 25%
JOB TITLE
Primary Work Location
Where do you primarily work?
base: 9,978 employed respondents; those in each segment
TOTAL U.S. Canada other
in the U.S. 90% 93% 0% 0%
outside the U.S. 3% 0% 80% 93%
both in and outside the U.S. 6% 6% 17% 5%
RESPONDENT'S COUNTRY
=70%+ =50% - 69% =30% - 49%
=70%+ =50% - 69% =30% - 49%

18
SH&E Industry
2018 Salary Survey
FINDINGS: About Their Work
On average, employed respondents service or support 135 total locations as a SH&E professional (or total clients if an
SH&E consultant or self-employed).
With the high proportion of U.S. SH&E professionals, it’s not surprising that 127 of the 135 locations/clients they
service or support are in the U.S. Of course, the locations differ for Canadians and those in other non-U.S. countries,
with a much higher proportion of the whole outside the U.S. for each, on average.
Those outside the U.S. also average fewer locations/clients overall, with 46 among those in Canada and 21 among
those in other countries, compared with 135 for those in the U.S.
Number of Locations/Clients Serviced/Supported
How many locations do you service or support for your company as a SH&E professional? If you work as a SH&E consultant or
are self-employed, please indicate the number of clients you service or support.
base: 9,978 employed respondents; those in each segment (fill-in answers)
Mean Summary
TOTAL U.S. Canada other
in the U.S. 127 131 4 1
outside the U.S. 8 7 42 20
TOTAL 135 138 46 21
RESPONDENT'S COUNTRY

19
SH&E Industry
2018 Salary Survey
FINDINGS: About Their Work
Among those who support locations outside the U.S., 63% of those in the U.S. indicated their non-U.S.
locations/clients are in North America. Other common locations supported by those in the U.S. include Europe
(49%), Asia (41%), and South America (36%).
Canadian SH&E professionals who support locations outside the U.S. are far less likely than those in the U.S. to
support locations outside of North America. 79% indicated their non-U.S. locations/clients are in North America, and
no more than 4% indicated each listed region other than North America.
The locations outside the U.S. supported by those who are located outside the U.S and Canada are most commonly
Asia (41%) and the Middle East (47%).
Locations Supported Outside the U.S.
If you support locations outside the U.S., what areas of the world do they include?
base: employed respondents in each segment who support locations outside the U.S. (multiple answers)
63%
49%
41%
36%
20%
23%
20%
15%
8%
79%
4%
3%
2%
4%
2%
3%
2%
14%
5%
9%
41%
6%
47%
3%
7%
13%
4%
North America
Europe
Asia
South America
Middle East
Central America
Australia/New Zealand
Africa
other
U.S.
Canada
other countries
Respondents in:

20
SH&E Industry
2018 Salary Survey
FINDINGS: Professional Profile
The typical employed respondent has worked as a SH&E professional for 16 years.
When asked how they first entered the SH&E practice, the largest proportion of employed SH&E professionals
indicated they entered after getting a degree in the field (31%).
SH&E Industry Tenure
How many years have you worked as a Safety, Health, & Environment (SH&E) professional?
base: 9,978 employed respondents
3%
11%12%12%14%
17%17%
13%
40+years
30 - 39years
25 - 29years
20 - 24years
15 - 19years
10 - 14years
5 - 9years
<5years
median:
16 Years
First Entrance Into SH&E Practice
Which of the following best characterizes how you first entered the SH&E practice?
base: 9,978 employed respondents
I entered SH&E practice after getting a degree in the field 31%
My employer/supervisor asked me to handle SH&E matters 11%
My employer had a SH&E position open and I applied for it without much experience 9%
I started in another safety related role (ergonomics, fire protection, etc.) and expanded to SH&E 8%
My employer/supervisor needed someone to handle SH&E matters and I volunteered 7%
I started in environmental and expanded to SH&E 7%
A friend/colleague worked in SH&E and encouraged me to pursue this field 6%
I started in industrial hygiene and expanded to SH&E 4%
I started in engineering and got assignments related to SH&E 4%
I served on a SH&E committee for my employer and became interested in SH&E 2%
I started in HR and got more involved in SH&E 1%
other 10%

21
SH&E Industry
2018 Salary Survey
FINDINGS: Professional Profile
Three in four employed SH&E professionals (74%) have at least one of the eight BCSP licenses or certifications,
most commonly a CSP (46%). Among the list of 71 other licenses/certifications, no single license/certification is held
by more than 7% of employed respondents.
86% of employed SH&E professionals have at least one license/certification; 26% have multiple.
Licenses/Certifications Held
Which licenses or certifications do you hold?
base: 9,978 employed respondents (multiple answers)
top mentions
46%
15%
15%
7%
6%
5%
5%
4%
4%
3%
3%
2%
2%
2%
CSP
CHST
ASP
CIH
STSC
OHST
CHMM
ARM
STS
SMS
EMT
CET
PE
OSHA
BCSP: 74% (NET)
Number of Licenses/Certifications
Held
AT LEAST ONE 86%
2 or more 26%
1 49%
none 21%
no answer 4%
mean # held 1.1
median 1
22
SH&E Industry
2018 Salary Survey
FINDINGS: Professional Profile
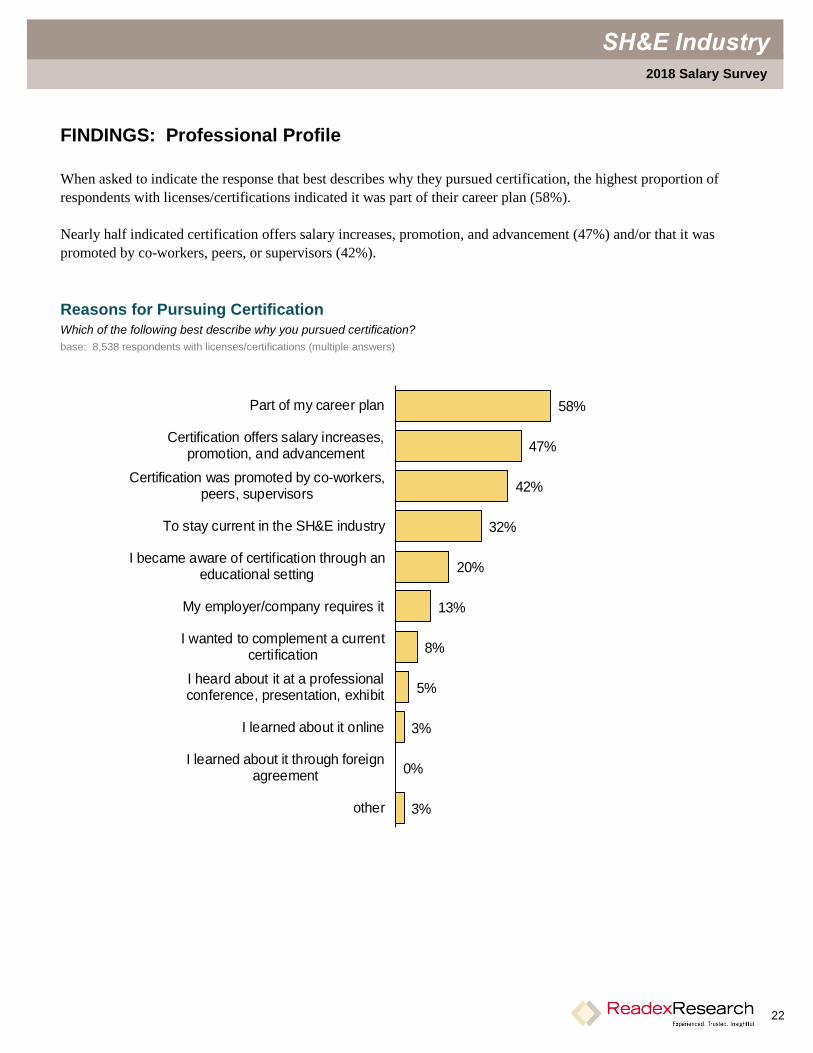
When asked to indicate the response that best describes why they pursued certification, the highest proportion of
respondents with licenses/certifications indicated it was part of their career plan (58%).
Nearly half indicated certification offers salary increases, promotion, and advancement (47%) and/or that it was
promoted by co-workers, peers, or supervisors (42%).
Reasons for Pursuing Certification
Which of the following best describe why you pursued certification?
base: 8,538 respondents with licenses/certifications (multiple answers)
58%
47%
42%
32%
20%
13%
8%
5%
3%
0%
3%
Part of my career plan
Certification offers salary increases,promotion, and advancement
Certification was promoted by co-workers,peers, supervisors
To stay current in the SH&E industry
I became aware of certification through aneducational setting
My employer/company requires it
I wanted to complement a currentcertification
I heard about it at a professionalconference, presentation, exhibit
I learned about it online
I learned about it through foreignagreement
other

23
SH&E Industry
2018 Salary Survey
FINDINGS: Professional Profile
Of the 58 membership organizations listed, ASSE (American Society of Safety Engineers) has the highest proportion
of members among employed SH&E professionals (66%). NCS (National Safety Council) is the next highest, at
14%. No other organization was indicated by more 9%.
Memberships Held
With which of the following organizations do you hold membership?
base: 9,978 employed respondents (multiple answers)
top mentions
66%
14%
9%
9%
3%
3%
3%
2%
ASSE -American Society of SafetyEngineers
NSC -National Safety Council
AIHA -American Industrial HygieneAssociation
NFPA -National Fire ProtectionAssociation
AGC -Associated General Contractors
ACGIH -American Conference ofIndustrial Hygienists
IHMM -Institute of Hazardous MaterialsManagement
ABC -Associated Builders andContractors

24
SH&E Industry
2018 Salary Survey
FINDINGS: Demographics
Four in five employed SH&E professionals (81%) have a Bachelor’s degree or higher, including 33% with a Master’s
and 2% with a Doctoral degree.
Nine in ten of those with an Associate degree or higher earned their highest degree/diploma in the U.S. (96%). By
country, 99% of those in the U.S., 11% of those in Canada, and 31% of those in other countries earned their highest
degree/diploma in the U.S.
Education
What is your highest level of education?
base: 9,978 employed respondents
2%
33%
46%
6%
0%
10%
3%
Doctoral degree
Master's degree
Bachelor's degree
Associate degree
diploma program
some college, but no degree
high school diploma/GED
Location Where Degree/Diploma Earned
Where was this degree/diploma earned?
base: 8,646 employed respondents with an Associate degree or higher; those in each segment
TOTAL U.S. Canada other
in the U.S. 96% 99% 11% 31%
outside the U.S. 4% 1% 89% 69%
RESPONDENT'S COUNTRY

25
SH&E Industry
2018 Salary Survey
FINDINGS: Demographics
Male employed SH&E professionals outnumber females four to one. The typical age is 47, but a broad range of ages
are represented.
Gender
What is your gender?
base: 9,978 employed respondents
male82%
female18%
Age
What is your age?
base: 9,978 employed respondents
5%
10%
13%
14%
14%
12%
11%
11%
7%
2%
65 or over
60 - 64
55 - 59
50 - 54
45 - 49
40 - 44
35 - 39
30 - 34
25 - 29
under 25
mean: 46.7median: 47