Embed Size (px)
Citation preview
HAL Id: halshs-00872477https://halshs.archives-ouvertes.fr/halshs-00872477
Preprint submitted on 13 Oct 2013
HAL is a multi-disciplinary open accessarchive for the deposit and dissemination of sci-entific research documents, whether they are pub-lished or not. The documents may come fromteaching and research institutions in France orabroad, or from public or private research centers.
L’archive ouverte pluridisciplinaire HAL, estdestinée au dépôt et à la diffusion de documentsscientifiques de niveau recherche, publiés ou non,émanant des établissements d’enseignement et derecherche français ou étrangers, des laboratoirespublics ou privés.
Shifting on prices of per unit and ad valoremconsumption taxes
Clément Carbonnier
To cite this version:Clément Carbonnier. Shifting on prices of per unit and ad valorem consumption taxes: estimation onprices of alcoholic beverages in France. 2011. �halshs-00872477�
Thema Working Paper n°2011-20 Université de Cergy Pontoise, France
Shifting on prices of per unit and ad valorem consumption taxes, estimation on prices of alcoholic beverages in France
Clément Carbonnier
July, 2011
Shifting on prices of per unit and ad valorem consumption taxes,estimation on prices of alcoholic beverages in France
Clement Carbonnier1
July 2011
Abstract
Economic theory states that on market with imperfect competition, per unit consumption taxes should
induce a larger increase of prices than ad valorem consumption taxes. It implies that consumers bear a
larger share of the tax burden for per unit consumption taxes than for ad valorem consumption taxes. The
present paper aims at testing empirically this theoretical result. It uses the French market for alcoholic
beverages, which is submitted to both per unit (excise taxes) and ad valorem (VAT) consumption taxes.
Econometrics is implemented on two reforms of consumption taxes affecting two French market for alco-
holic beverages, beers and aperitifs. In 1995, the full rate of VAT increased from 18,6% to 20,6%; excise
taxes on alcoholic beverages increased heterogeneously in 1997. Graphical evidence and econometrical re-
sults confirm the statements of economic theory. For both classes of alcoholic beverages - beers and aperitifs
- the shifting on prices of per unit excise taxes was significantly larger than the shifting of ad valorem VAT.
Key words: tax incidence, VAT, excise taxes, alcoholic beverages, imperfect competition
JEL codes: H22; H25; D43.
1Universite de Cergy-Pontoise - THEMA, 33 boulevard du port, 95000 Cergy-Pontoise cedex, France
1
1 Introduction
The present paper aims at estimating the difference between shifting on prices of per unit and ad valorem
consumption taxes, and shows that per unit consumption taxes induce a significantly larger increase of
prices than ad valorem consumption taxes. The recent economic crisis, that increases public deficits and
generate a new need for fiscal revenue, has reniewed the public debate about increasing consumption
taxes. Defenders of this kind of taxes argue that it is a simple way of collecting public revenue, with low
collection costs and generating little distortion on the markets. However, consumption taxes are distorting,
they induce decreases of production. Incidence of consumption taxes is not obvious either: the burden of
these taxes is shared between demanders and suppliers, and the share of suppliers is itself shared between
employees and owners of the firms.
Under perfect competition, the shares of suppliers and consumers depend on price elasticities of the
demand and the supply; both parts support a share of the tax burden, generally a larger share for the
consumers. Imperfect competition changes the sharing of consumption taxes, the consumer share may be
lower or larger than under perfect competition, it may even be larger than 100%, which means that the
before tax price increases with respect to consumption taxes. This result is very robust as it is valid in
the wide range of imperfect competition models (Katz & Rosen 1985, Stern 1987 and Besley 1989 in the
Cournot oligopoly model with conjectural variations of Seade (1980); Aderson et al. 2001 in the Bertrand
oligopoly model with differentiated goods) and it is confirmed by the few empirical studies testing it
(Besley & Rosen 1999 and Carbonnier 2007).
Not only competition has an influence on the sharing of the tax burden between consumers and
suppliers. Carbonnier (2008) studied the difference between shifting on prices of tax increases and tax
decreases, and empirically confirmed his theoretical results. The way consumption taxes are implemented
may also matters, and a large number of authors compare value-added taxes (VAT) to sales taxes (e.g.:
Dungan et al. 2008, Smart & Bird 2009, Keen & Lockwood 2010 and Whalley & Kononova 2010).
The present paper aims at understanding the difference of shifting on prices between per unit consump-
tion taxes and ad valorem consumption taxes. Under perfect competition, there should be no difference
between both kinds of taxes, but the tax burden is shared differently under imperfect competition. This
issue has been studied for a long time on a theoretical point of view. Cournot (1838) already found that
per unit and ad valorem consumption taxes operate differently under monopoly: he stated that per unit
taxes are always over-shifted on prices as ad valorem taxes may either be over-shifted or under-shifted.
Wicksell (1896) also noted the difference between both kinds of taxes under monopoly and found that ad
valorem taxes Pareto dominate per unit taxes. Suits & Musgrave (1953) studied monopoly and stated that
ad valorem consumption taxes Pareto dominate per unit consumption taxes because tax shifting on prices
is larger for per unit than for ad valorem consumption taxes. This last result is confirmed in Cournot
oligopoly by Delipalla & Keen (1992). Other authors found the same results using different models of
imperfect competition ( e.g.: Skeath & Trandel 1994, Denicolo & Matteuzzi 2000 and Grazzini 2006).
2
All these models also found that ad valorem taxes Pareto dominate per unit taxes. The reason is that
the prices are lower with ad valorem taxes for the same tax revenue, and therefore global output is larger.
However, all these studies were done under partial equilibrium. Pareto dominance is contradicted if con-
sidering general equilibrium (Blackorby & Murty 2007). Myles (1996) calculated an optimal combinaison
of both kinds of taxes. In the case of environmental issues, the purpose of a green tax may be to generate
a large decrease of the output, and therefore per unit taxes may be prefered to ad valorem taxes (Droge
& Schroder 2009). Nevertheless, if these papers contested the Pareto dominance of ad valorem taxes over
per unit taxes, they confirmed that tax shifting on prices of per unit taxes is larger than tax shifting of
ad valorem taxes.
One intuitive explanation may be that with imperfect competition, firms own a market power: not
only they know the actual demand but also they could anticipate what would be the demand with higher
or lower prices. Yet, if they decrease the before tax price after an increase of consumption taxes, it does
not change the tax at all if it is per unit but it decreases the tax if it is ad valorem. Therefore, they are
more likely to bear a share of the tax burden - by decreasing the before tax price - if it could decrease
the proportinal tax, and consequently decrease even more the after tax price than if it is a per unit
consumption tax. A modelization of this intuition is presented in section 2.
This result, whose intuition is presented above, is well established in the litterature. Even so, few
empirical studies has been implemented in order to test it. Delipalla & O’Donnell (2001) looked at the
European tabacco market, comparing ad valorem VAT and excise taxes that are supposed to be per unit
consumption taxes. However, the European system of Excise taxes on tabacco is complicated. Some
European countries - France for exemple, that is considered in their panel - settle per unit excise taxes
for main brands of cigarettes as the amount of ad valorem taxes on the brand of cigarettes leading the
market. Therefore, excise taxes on tabacoo are not exactly per unit consumption taxes. Furthermore,
addiction changes fundamentally the behavior of consumers and therefore the pricing of suppliers (e.g.:
Barnet et al. 1995).
The present paper focuses on the case of alcoholic beverages in France. Alcoholic beverages are of the
few markets (with oil and tobacco) on which is collected both ad valorem (VAT) and per unit (special excise
duties) consumption taxes. Furthermore, they are sold in a market with imperfect competition: Young
& Bielinska-Kwapsisz (2002) studied the market for alcoholic beverages in Washington D.C. and found
the taxes over-shifted on prices. The methodolgy consists in comparing responce of prices to two different
reforms of consumption taxes for alcoholic beverages. The full rate of VAT (ad valorem consumption tax)
increased in 1995 and special excise duties on alcohol (per unit consumption taxes) increased in 1997.
The remainder of the paper is organized as follows. Section 2 presents the theoretical background,
defining the parameters that should be estimated, giving the intuition for the theoretical result and
explaining the econometrical stategy. Section 3 presents the data: the indirect tax system on alcoholic
beverages in France, the reforms used for the econometrics, the times series and graphical evidences.
Section 4 presents the results of the estimations. Section 5 concludes.
3
2 Econometrical framework and methodology
2.1 Intuition of the difference of shifting of per unit and ad valorem taxes
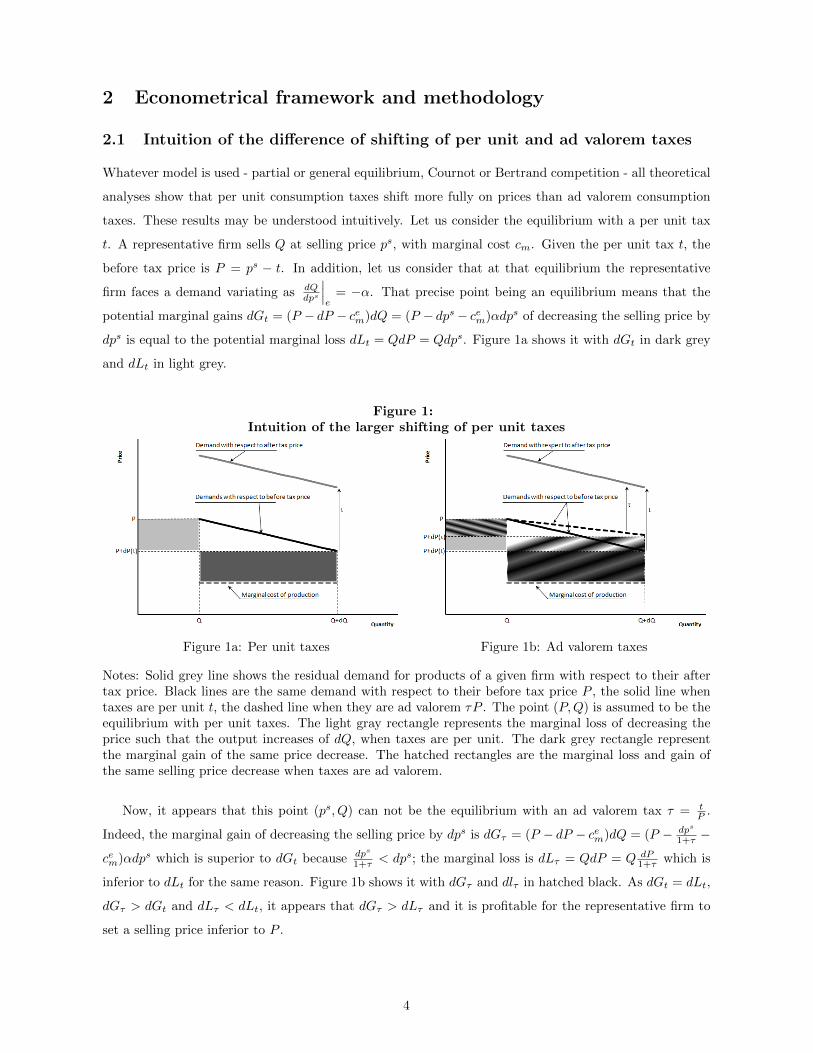
Whatever model is used - partial or general equilibrium, Cournot or Bertrand competition - all theoretical
analyses show that per unit consumption taxes shift more fully on prices than ad valorem consumption
taxes. These results may be understood intuitively. Let us consider the equilibrium with a per unit tax
t. A representative firm sells Q at selling price ps, with marginal cost cm. Given the per unit tax t, the
before tax price is P = ps − t. In addition, let us consider that at that equilibrium the representative
firm faces a demand variating as dQdps
∣∣∣e
= −α. That precise point being an equilibrium means that the
potential marginal gains dGt = (P − dP − cem)dQ = (P − dps− cem)αdps of decreasing the selling price by
dps is equal to the potential marginal loss dLt = QdP = Qdps. Figure 1a shows it with dGt in dark grey
and dLt in light grey.
Figure 1:Intuition of the larger shifting of per unit taxes
Figure 1a: Per unit taxes Figure 1b: Ad valorem taxes
Notes: Solid grey line shows the residual demand for products of a given firm with respect to their aftertax price. Black lines are the same demand with respect to their before tax price P , the solid line whentaxes are per unit t, the dashed line when they are ad valorem τP . The point (P,Q) is assumed to be theequilibrium with per unit taxes. The light gray rectangle represents the marginal loss of decreasing theprice such that the output increases of dQ, when taxes are per unit. The dark grey rectangle representthe marginal gain of the same price decrease. The hatched rectangles are the marginal loss and gain ofthe same selling price decrease when taxes are ad valorem.
Now, it appears that this point (ps, Q) can not be the equilibrium with an ad valorem tax τ = tP .
Indeed, the marginal gain of decreasing the selling price by dps is dGτ = (P − dP − cem)dQ = (P − dps
1+τ −
cem)αdps which is superior to dGt because dps
1+τ < dps; the marginal loss is dLτ = QdP = Q dP1+τ which is
inferior to dLt for the same reason. Figure 1b shows it with dGτ and dlτ in hatched black. As dGt = dLt,
dGτ > dGt and dLτ < dLt, it appears that dGτ > dLτ and it is profitable for the representative firm to
set a selling price inferior to P .
4
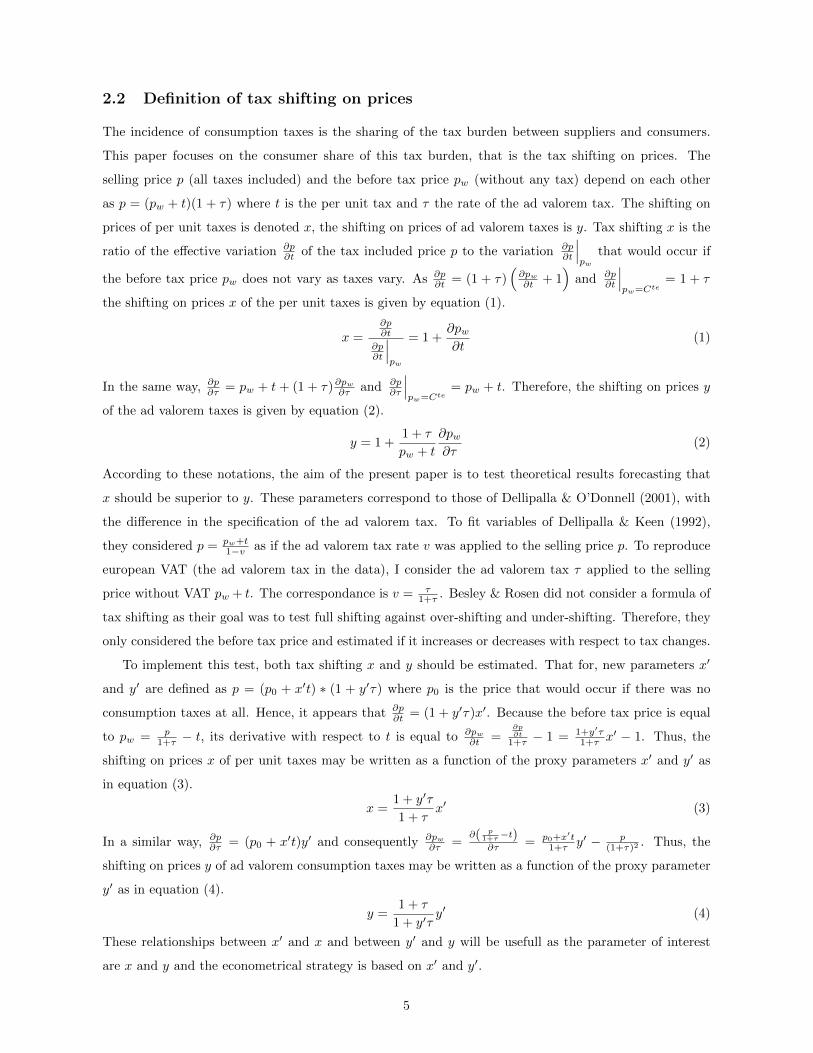
2.2 Definition of tax shifting on prices
The incidence of consumption taxes is the sharing of the tax burden between suppliers and consumers.
This paper focuses on the consumer share of this tax burden, that is the tax shifting on prices. The
selling price p (all taxes included) and the before tax price pw (without any tax) depend on each other
as p = (pw + t)(1 + τ) where t is the per unit tax and τ the rate of the ad valorem tax. The shifting on
prices of per unit taxes is denoted x, the shifting on prices of ad valorem taxes is y. Tax shifting x is the
ratio of the effective variation ∂p∂t of the tax included price p to the variation ∂p
∂t
∣∣∣pw
that would occur if
the before tax price pw does not vary as taxes vary. As ∂p∂t = (1 + τ)
(∂pw∂t + 1
)and ∂p
∂t
∣∣∣pw=Cte
= 1 + τ
the shifting on prices x of the per unit taxes is given by equation (1).
x =∂p∂t
∂p∂t
∣∣∣pw
= 1 +∂pw∂t
(1)
In the same way, ∂p∂τ = pw + t + (1 + τ)∂pw∂τ and ∂p
∂τ
∣∣∣pw=Cte
= pw + t. Therefore, the shifting on prices y
of the ad valorem taxes is given by equation (2).
y = 1 +1 + τ
pw + t
∂pw∂τ
(2)
According to these notations, the aim of the present paper is to test theoretical results forecasting that
x should be superior to y. These parameters correspond to those of Dellipalla & O’Donnell (2001), with
the difference in the specification of the ad valorem tax. To fit variables of Dellipalla & Keen (1992),
they considered p = pw+t1−v as if the ad valorem tax rate v was applied to the selling price p. To reproduce
european VAT (the ad valorem tax in the data), I consider the ad valorem tax τ applied to the selling
price without VAT pw + t. The correspondance is v = τ1+τ . Besley & Rosen did not consider a formula of
tax shifting as their goal was to test full shifting against over-shifting and under-shifting. Therefore, they
only considered the before tax price and estimated if it increases or decreases with respect to tax changes.
To implement this test, both tax shifting x and y should be estimated. That for, new parameters x′
and y′ are defined as p = (p0 + x′t) ∗ (1 + y′τ) where p0 is the price that would occur if there was no
consumption taxes at all. Hence, it appears that ∂p∂t = (1 + y′τ)x′. Because the before tax price is equal
to pw = p1+τ − t, its derivative with respect to t is equal to ∂pw
∂t =∂p∂t
1+τ − 1 = 1+y′τ1+τ x
′ − 1. Thus, the
shifting on prices x of per unit taxes may be written as a function of the proxy parameters x′ and y′ as
in equation (3).
x =1 + y′τ
1 + τx′ (3)
In a similar way, ∂p∂τ = (p0 + x′t)y′ and consequently ∂pw
∂τ =∂( p
1+τ−t)∂τ = p0+x
′t1+τ y′ − p
(1+τ)2 . Thus, the
shifting on prices y of ad valorem consumption taxes may be written as a function of the proxy parameter
y′ as in equation (4).
y =1 + τ
1 + y′τy′ (4)
These relationships between x′ and x and between y′ and y will be usefull as the parameter of interest
are x and y and the econometrical strategy is based on x′ and y′.
5
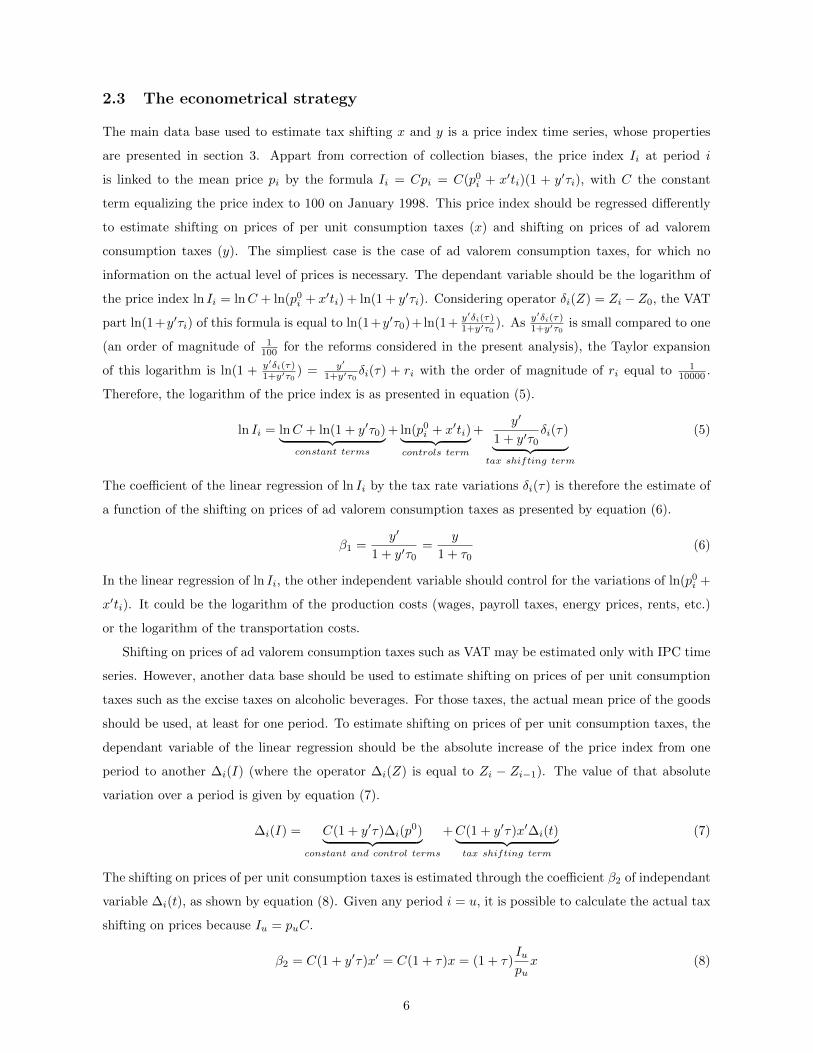
2.3 The econometrical strategy
The main data base used to estimate tax shifting x and y is a price index time series, whose properties
are presented in section 3. Appart from correction of collection biases, the price index Ii at period i
is linked to the mean price pi by the formula Ii = Cpi = C(p0i + x′ti)(1 + y′τi), with C the constant
term equalizing the price index to 100 on January 1998. This price index should be regressed differently
to estimate shifting on prices of per unit consumption taxes (x) and shifting on prices of ad valorem
consumption taxes (y). The simpliest case is the case of ad valorem consumption taxes, for which no
information on the actual level of prices is necessary. The dependant variable should be the logarithm of
the price index ln Ii = lnC + ln(p0i + x′ti) + ln(1 + y′τi). Considering operator δi(Z) = Zi − Z0, the VAT
part ln(1+y′τi) of this formula is equal to ln(1+y′τ0)+ln(1+ y′δi(τ)1+y′τ0
). As y′δi(τ)1+y′τ0
is small compared to one
(an order of magnitude of 1100 for the reforms considered in the present analysis), the Taylor expansion
of this logarithm is ln(1 + y′δi(τ)1+y′τ0
) = y′
1+y′τ0δi(τ) + ri with the order of magnitude of ri equal to 1
10000 .
Therefore, the logarithm of the price index is as presented in equation (5).
ln Ii = lnC + ln(1 + y′τ0)︸ ︷︷ ︸constant terms
+ ln(p0i + x′ti)︸ ︷︷ ︸controls term
+y′
1 + y′τ0δi(τ)︸ ︷︷ ︸
tax shifting term
(5)
The coefficient of the linear regression of ln Ii by the tax rate variations δi(τ) is therefore the estimate of
a function of the shifting on prices of ad valorem consumption taxes as presented by equation (6).
β1 =y′
1 + y′τ0=
y
1 + τ0(6)
In the linear regression of ln Ii, the other independent variable should control for the variations of ln(p0i +
x′ti). It could be the logarithm of the production costs (wages, payroll taxes, energy prices, rents, etc.)
or the logarithm of the transportation costs.
Shifting on prices of ad valorem consumption taxes such as VAT may be estimated only with IPC time
series. However, another data base should be used to estimate shifting on prices of per unit consumption
taxes such as the excise taxes on alcoholic beverages. For those taxes, the actual mean price of the goods
should be used, at least for one period. To estimate shifting on prices of per unit consumption taxes, the
dependant variable of the linear regression should be the absolute increase of the price index from one
period to another ∆i(I) (where the operator ∆i(Z) is equal to Zi − Zi−1). The value of that absolute
variation over a period is given by equation (7).
∆i(I) = C(1 + y′τ)∆i(p0)︸ ︷︷ ︸
constant and control terms
+C(1 + y′τ)x′∆i(t)︸ ︷︷ ︸tax shifting term
(7)
The shifting on prices of per unit consumption taxes is estimated through the coefficient β2 of independant
variable ∆i(t), as shown by equation (8). Given any period i = u, it is possible to calculate the actual tax
shifting on prices because Iu = puC.
β2 = C(1 + y′τ)x′ = C(1 + τ)x = (1 + τ)Iupux (8)
6
In the actual estimation, the period u is chosen as the last period before the reform of the excise taxes.
Furthermore, delays of independant variables ∆i−1(t), ∆i−2(t) and ∆i−3(t) are added as regressors to take
into account the delays in the tax shifting. I tested similar regressions with more delays and chose to limit
to three months delay because no tax shifting appears in regressions later than three months after the
reform. As for the ad valorem tax shifting estimation, independant variables are added in to control for
∆i(p0): it could be the absolute variation over one period of the production costs (wages, payroll taxes,
energy prices, rents, etc.) or the absolute variation over one period of the transportation costs. Given
the results of these two linear regressions, the comparison of shifting on prices of per unit and ad valorem
consumption taxes may be done by comparing the estimated tax shifting x = β2pu(1+τ)Iu
and y = β1
1+τ0.
3 Data
3.1 The time series
Different data sources are used to implement these regressions. First of all, the fiscal legislation gives
the rates τi of ad valorem consumption taxes (actually, it is the full-rate of VAT, a value added tax) for
each period. Furthermore, alcoholic beverages are submitted in France to per unit excise taxes, which
constitute the tax ti for each period. Concerning the prices, two data bases are used, both provided by
INSEE, the French statistical agency. The main one is IPC2, the second one is time series of mean prices.
IPC is a monthly price index time series harmonized at the european level. The classification of goods
is based on the international standard COICOP (Classification of Individual Consumption According to
Purpose), with some more details. Consumption goods are classified in twelve divisions, 86 groups and
161 classes. Montlhy price indexes are calculated from the monthly collection of the actual prices of 1000
different goods in 2000 different selling points in 106 cities of more than 2000 inhabitants. Indexes are
calculated as a linked chain of Laspeyres. This IPC time series is more accurate and corrected from
collection biases than the mean prices time series, and is therefore used for the regressions. However, the
mean prices are also needed to calibrate the estimation of the shifting on prices of per unit consumption
taxes, as presented in section 2.3: only the value at one period - the last period before the reform - is
used.
Two alcoholic beverages are chosen among the categories for which the French IPC time series gives
a specific monthly price index. From the different price indexes for classes of alcoholic beverages, the one
called brandy and liquors has been rejected from the empirical study. The beverages whose prices are
collected to built this price index are very different in terms of consumption as in terms of excise taxes.
In particular, it is not possible to calculate a global excise tax for those kind of alcoholic beverages. The
index called champagne, sparkling wine and ciders has been rejected for the same reasons, so as the rhum
price index. Rhum beverages are submitted to different legislations depending mainly on two facts: the
2Indice des prix a la consommation: consumption price index
7
region of production - there is smaller excise taxes for rhum produced in the French antilles or in the
Reunion island - and the quantity imported in continental France. Last, wine index has been rejected:
this index collects prices of actual wine, but also of different beverages made of wine - fortified wine for
exemple - that are submitted to different excise taxes. Furthermore, less reforms occured on wine excise
taxes.
The remaining two time series of price indexes are studied to compare incidence of ad valorem VAT
and per unit excise taxes. First of all, the beer index corresponds to usual blond beers, sold in pack of
6*33 centillitres (a little more than 6*11oz) for a total of two litres (a little less than 68oz). They are
beers with a low degree of alcohol (inferior to 4.5% in volume). As excise taxes on beers are proportional
to the degree of alcohol, over-estimating the degree of alcohol leads to an over-estimation of excise taxes
and an under-estimation of the excise tax shifting on prices. As the purpose of this paper is to test if
excise tax shifting is indeed larger than VAT shifting on prices, a safety margin is taken to be sure not to
over-estimate excise tax shifting, and that for not to under-estimate excise taxes and degree of alcohol.
Hence, the maximal degree of alcohol of 4.5% in volume is considered for beers.
Second, the time series of price index called aperitif is used for the econometrics. It consisted in the
index of prices of anise aperitif and whisky. Those beverages are quite different the one from the other.
However, they are submitted to similar excise taxes. For both beverages, the same excise tax is settled
by hectolitre of pure alcohol. The degree of alcohol of anise aperitif is 45% in volume, and the collected
prices are for bottles of one litre. The degrees of alcohol of whiskies depend on the brands, but are close
from one brand to another and close to the degree of alcohol of anise aperitif (a degree of alcohol of 42%
in volume is considered for the econometrics). INSEE collects prices of bottles of 75 centilitres. Figure 2
shows the price index of both kinds of goods all along the global period considered.
Another time series data base is available at INSEE, which gives each month the mean prices instead
of price indexes. Only one value of these time series is used for each kind of beverages. Whatever month
may be used to calibrate the IPC time series; actually, the last month before reform is chosen. This unique
value is used to measure the value of the variation of excise taxes due to the reform proportionally to the
actual price of the good. Three time series are used: on one hand time series for beer is used to calibrate
price index for beer, on the other hand both times series for anise aperitif and whisky are used to calibate
price index for aperitif. If the calibration of the excise tax reform for beer is done exactly by the beer mean
price series, it is more complicated for aperitif. As I can not know the proportion of prices of whisky and
anise aperitif in the aperitif IPC time series, I use two calibrations to bound the actual excise tax reform.
The lower bound of the excise tax variation - and consequently the upper bound of the tax shifting - is
calculated with the whisky mean price. The upper bound of the excise tax variation - and consequently
the lower bound of the tax shifting - is calculated with the anise aperitif mean price. Indeed, whisky and
anise aperitif are submitted to the same excise tax, calculated by hectolitre of pure alcohol, and bottles
of anise aperitif contain more alcohol than bottles of whisky : IPC times series collects prices of one liter
bottles of anise aperitif with a degree of alcohol of 45% in volume - that is bottles containing 45 centiliter
8
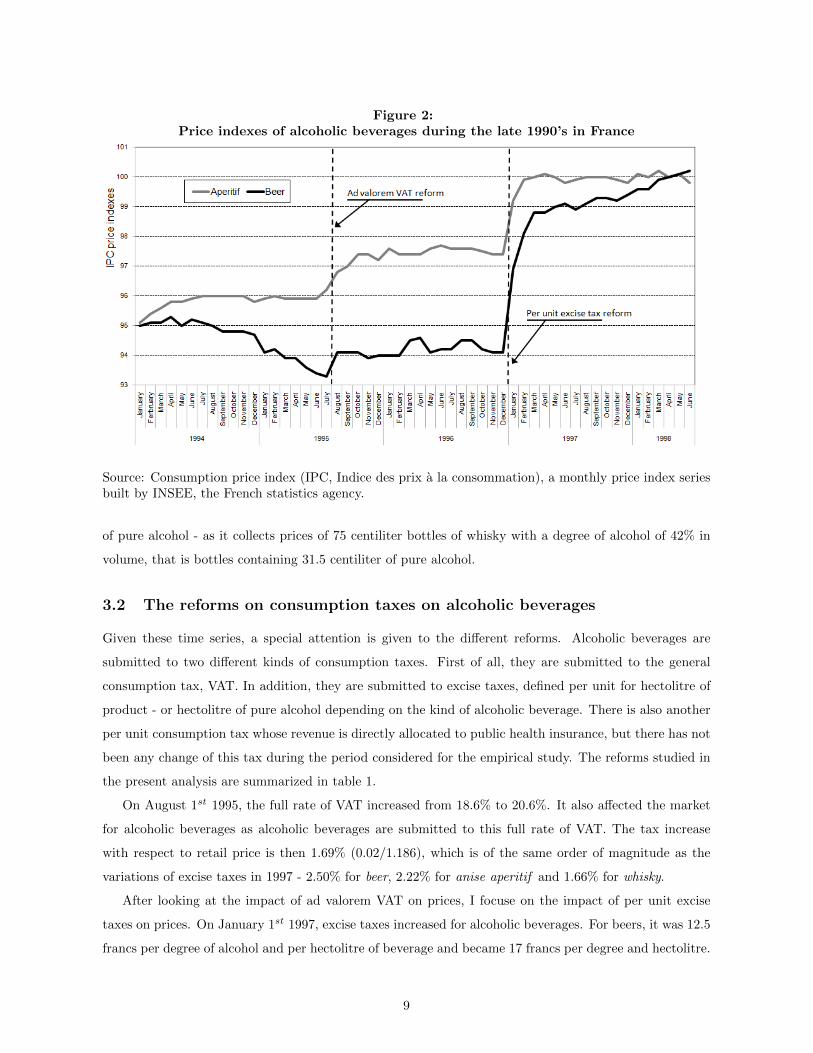
Figure 2:Price indexes of alcoholic beverages during the late 1990’s in France
Source: Consumption price index (IPC, Indice des prix a la consommation), a monthly price index seriesbuilt by INSEE, the French statistics agency.
of pure alcohol - as it collects prices of 75 centiliter bottles of whisky with a degree of alcohol of 42% in
volume, that is bottles containing 31.5 centiliter of pure alcohol.
3.2 The reforms on consumption taxes on alcoholic beverages
Given these time series, a special attention is given to the different reforms. Alcoholic beverages are
submitted to two different kinds of consumption taxes. First of all, they are submitted to the general
consumption tax, VAT. In addition, they are submitted to excise taxes, defined per unit for hectolitre of
product - or hectolitre of pure alcohol depending on the kind of alcoholic beverage. There is also another
per unit consumption tax whose revenue is directly allocated to public health insurance, but there has not
been any change of this tax during the period considered for the empirical study. The reforms studied in
the present analysis are summarized in table 1.
On August 1st 1995, the full rate of VAT increased from 18.6% to 20.6%. It also affected the market
for alcoholic beverages as alcoholic beverages are submitted to this full rate of VAT. The tax increase
with respect to retail price is then 1.69% (0.02/1.186), which is of the same order of magnitude as the
variations of excise taxes in 1997 - 2.50% for beer, 2.22% for anise aperitif and 1.66% for whisky.
After looking at the impact of ad valorem VAT on prices, I focuse on the impact of per unit excise
taxes on prices. On January 1st 1997, excise taxes increased for alcoholic beverages. For beers, it was 12.5
francs per degree of alcohol and per hectolitre of beverage and became 17 francs per degree and hectolitre.
9
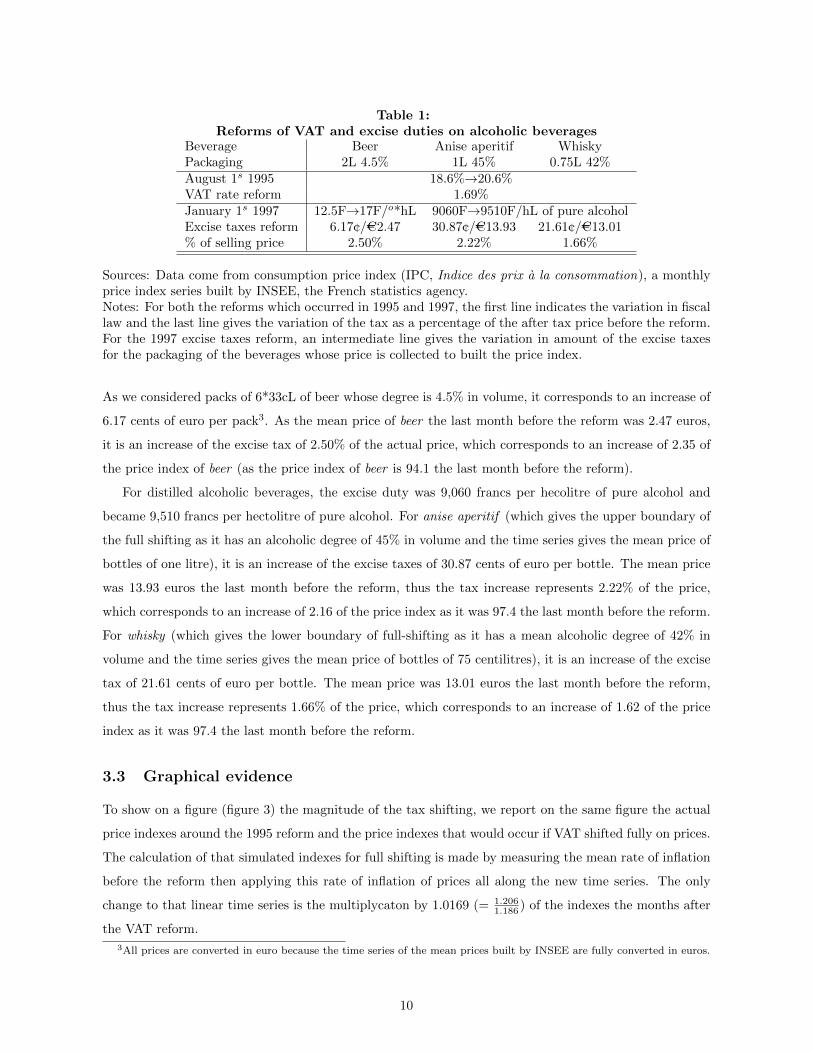
Table 1:Reforms of VAT and excise duties on alcoholic beverages
Beverage Beer Anise aperitif WhiskyPackaging 2L 4.5% 1L 45% 0.75L 42%August 1s 1995 18.6%→20.6%VAT rate reform 1.69%January 1s 1997 12.5F→17F/o*hL 9060F→9510F/hL of pure alcoholExcise taxes reform 6.17¢/AC2.47 30.87¢/AC13.93 21.61¢/AC13.01% of selling price 2.50% 2.22% 1.66%
Sources: Data come from consumption price index (IPC, Indice des prix a la consommation), a monthlyprice index series built by INSEE, the French statistics agency.Notes: For both the reforms which occurred in 1995 and 1997, the first line indicates the variation in fiscallaw and the last line gives the variation of the tax as a percentage of the after tax price before the reform.For the 1997 excise taxes reform, an intermediate line gives the variation in amount of the excise taxesfor the packaging of the beverages whose price is collected to built the price index.
As we considered packs of 6*33cL of beer whose degree is 4.5% in volume, it corresponds to an increase of
6.17 cents of euro per pack3. As the mean price of beer the last month before the reform was 2.47 euros,
it is an increase of the excise tax of 2.50% of the actual price, which corresponds to an increase of 2.35 of
the price index of beer (as the price index of beer is 94.1 the last month before the reform).
For distilled alcoholic beverages, the excise duty was 9,060 francs per hecolitre of pure alcohol and
became 9,510 francs per hectolitre of pure alcohol. For anise aperitif (which gives the upper boundary of
the full shifting as it has an alcoholic degree of 45% in volume and the time series gives the mean price of
bottles of one litre), it is an increase of the excise taxes of 30.87 cents of euro per bottle. The mean price
was 13.93 euros the last month before the reform, thus the tax increase represents 2.22% of the price,
which corresponds to an increase of 2.16 of the price index as it was 97.4 the last month before the reform.
For whisky (which gives the lower boundary of full-shifting as it has a mean alcoholic degree of 42% in
volume and the time series gives the mean price of bottles of 75 centilitres), it is an increase of the excise
tax of 21.61 cents of euro per bottle. The mean price was 13.01 euros the last month before the reform,
thus the tax increase represents 1.66% of the price, which corresponds to an increase of 1.62 of the price
index as it was 97.4 the last month before the reform.
3.3 Graphical evidence
To show on a figure (figure 3) the magnitude of the tax shifting, we report on the same figure the actual
price indexes around the 1995 reform and the price indexes that would occur if VAT shifted fully on prices.
The calculation of that simulated indexes for full shifting is made by measuring the mean rate of inflation
before the reform then applying this rate of inflation of prices all along the new time series. The only
change to that linear time series is the multiplycaton by 1.0169 (= 1.2061.186 ) of the indexes the months after
the VAT reform.
3All prices are converted in euro because the time series of the mean prices built by INSEE are fully converted in euros.
10
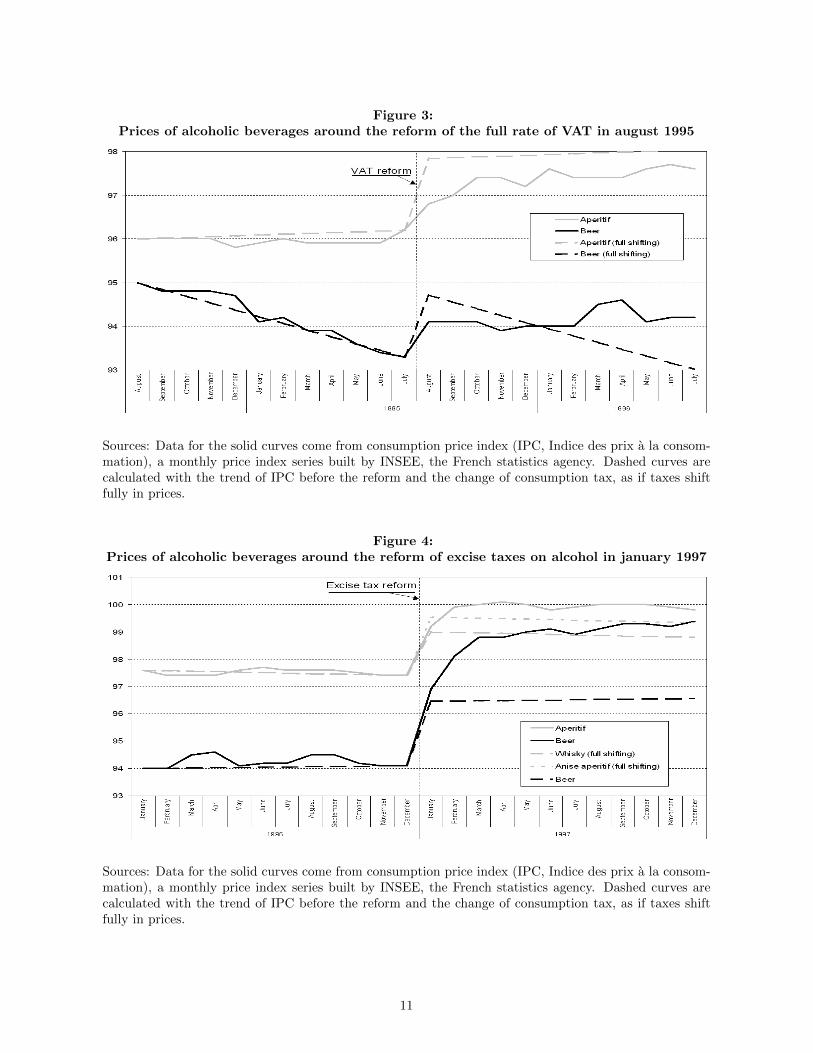
Figure 3:Prices of alcoholic beverages around the reform of the full rate of VAT in august 1995
Sources: Data for the solid curves come from consumption price index (IPC, Indice des prix a la consom-mation), a monthly price index series built by INSEE, the French statistics agency. Dashed curves arecalculated with the trend of IPC before the reform and the change of consumption tax, as if taxes shiftfully in prices.
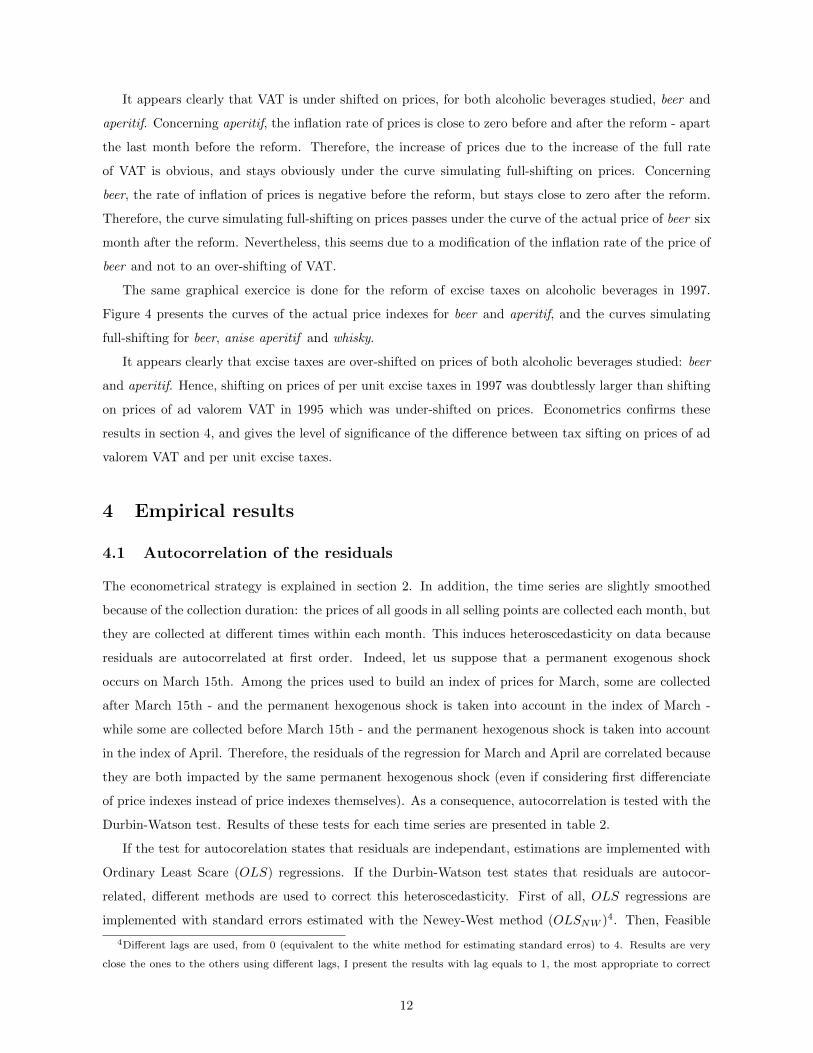
Figure 4:Prices of alcoholic beverages around the reform of excise taxes on alcohol in january 1997
Sources: Data for the solid curves come from consumption price index (IPC, Indice des prix a la consom-mation), a monthly price index series built by INSEE, the French statistics agency. Dashed curves arecalculated with the trend of IPC before the reform and the change of consumption tax, as if taxes shiftfully in prices.
11
It appears clearly that VAT is under shifted on prices, for both alcoholic beverages studied, beer and
aperitif. Concerning aperitif, the inflation rate of prices is close to zero before and after the reform - apart
the last month before the reform. Therefore, the increase of prices due to the increase of the full rate
of VAT is obvious, and stays obviously under the curve simulating full-shifting on prices. Concerning
beer, the rate of inflation of prices is negative before the reform, but stays close to zero after the reform.
Therefore, the curve simulating full-shifting on prices passes under the curve of the actual price of beer six
month after the reform. Nevertheless, this seems due to a modification of the inflation rate of the price of
beer and not to an over-shifting of VAT.
The same graphical exercice is done for the reform of excise taxes on alcoholic beverages in 1997.
Figure 4 presents the curves of the actual price indexes for beer and aperitif, and the curves simulating
full-shifting for beer, anise aperitif and whisky.
It appears clearly that excise taxes are over-shifted on prices of both alcoholic beverages studied: beer
and aperitif. Hence, shifting on prices of per unit excise taxes in 1997 was doubtlessly larger than shifting
on prices of ad valorem VAT in 1995 which was under-shifted on prices. Econometrics confirms these
results in section 4, and gives the level of significance of the difference between tax sifting on prices of ad
valorem VAT and per unit excise taxes.
4 Empirical results
4.1 Autocorrelation of the residuals
The econometrical strategy is explained in section 2. In addition, the time series are slightly smoothed
because of the collection duration: the prices of all goods in all selling points are collected each month, but
they are collected at different times within each month. This induces heteroscedasticity on data because
residuals are autocorrelated at first order. Indeed, let us suppose that a permanent exogenous shock
occurs on March 15th. Among the prices used to build an index of prices for March, some are collected
after March 15th - and the permanent hexogenous shock is taken into account in the index of March -
while some are collected before March 15th - and the permanent hexogenous shock is taken into account
in the index of April. Therefore, the residuals of the regression for March and April are correlated because
they are both impacted by the same permanent hexogenous shock (even if considering first differenciate
of price indexes instead of price indexes themselves). As a consequence, autocorrelation is tested with the
Durbin-Watson test. Results of these tests for each time series are presented in table 2.
If the test for autocorelation states that residuals are independant, estimations are implemented with
Ordinary Least Scare (OLS) regressions. If the Durbin-Watson test states that residuals are autocor-
related, different methods are used to correct this heteroscedasticity. First of all, OLS regressions are
implemented with standard errors estimated with the Newey-West method (OLSNW )4. Then, Feasible
4Different lags are used, from 0 (equivalent to the white method for estimating standard erros) to 4. Results are very
close the ones to the others using different lags, I present the results with lag equals to 1, the most appropriate to correct
12
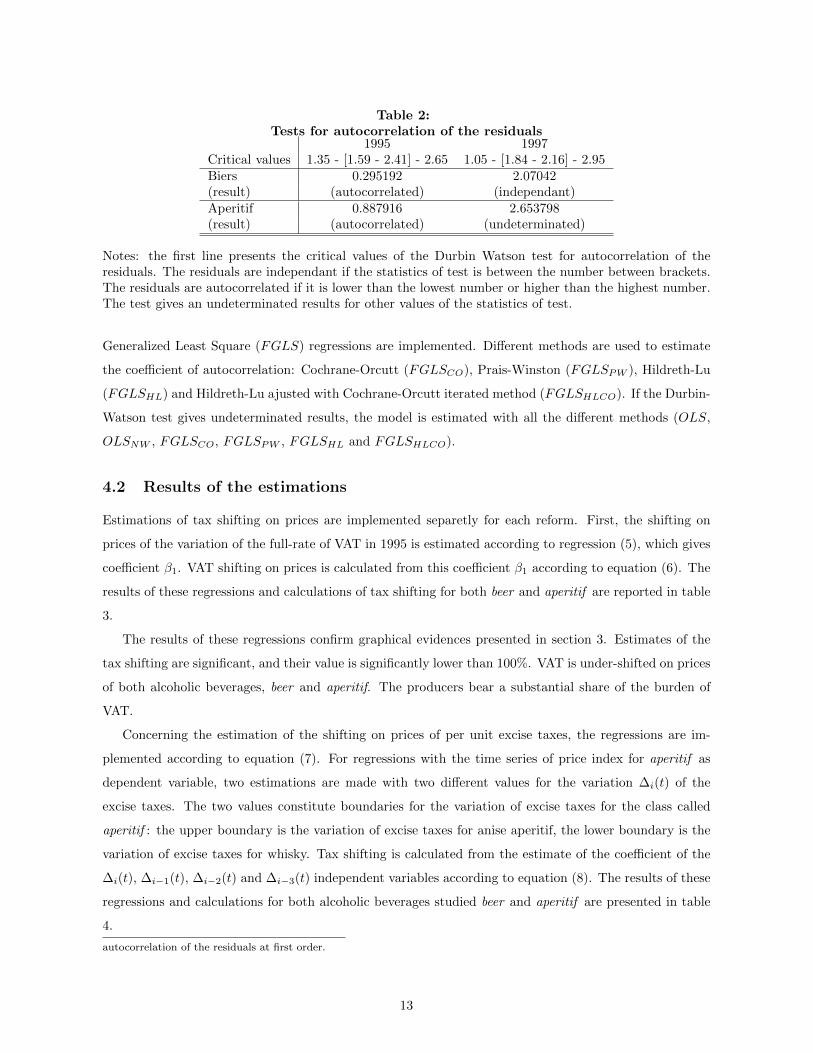
Table 2:Tests for autocorrelation of the residuals
1995 1997Critical values 1.35 - [1.59 - 2.41] - 2.65 1.05 - [1.84 - 2.16] - 2.95Biers 0.295192 2.07042(result) (autocorrelated) (independant)Aperitif 0.887916 2.653798(result) (autocorrelated) (undeterminated)
Notes: the first line presents the critical values of the Durbin Watson test for autocorrelation of theresiduals. The residuals are independant if the statistics of test is between the number between brackets.The residuals are autocorrelated if it is lower than the lowest number or higher than the highest number.The test gives an undeterminated results for other values of the statistics of test.
Generalized Least Square (FGLS) regressions are implemented. Different methods are used to estimate
the coefficient of autocorrelation: Cochrane-Orcutt (FGLSCO), Prais-Winston (FGLSPW ), Hildreth-Lu
(FGLSHL) and Hildreth-Lu ajusted with Cochrane-Orcutt iterated method (FGLSHLCO). If the Durbin-
Watson test gives undeterminated results, the model is estimated with all the different methods (OLS,
OLSNW , FGLSCO, FGLSPW , FGLSHL and FGLSHLCO).
4.2 Results of the estimations
Estimations of tax shifting on prices are implemented separetly for each reform. First, the shifting on
prices of the variation of the full-rate of VAT in 1995 is estimated according to regression (5), which gives
coefficient β1. VAT shifting on prices is calculated from this coefficient β1 according to equation (6). The
results of these regressions and calculations of tax shifting for both beer and aperitif are reported in table
3.
The results of these regressions confirm graphical evidences presented in section 3. Estimates of the
tax shifting are significant, and their value is significantly lower than 100%. VAT is under-shifted on prices
of both alcoholic beverages, beer and aperitif. The producers bear a substantial share of the burden of
VAT.
Concerning the estimation of the shifting on prices of per unit excise taxes, the regressions are im-
plemented according to equation (7). For regressions with the time series of price index for aperitif as
dependent variable, two estimations are made with two different values for the variation ∆i(t) of the
excise taxes. The two values constitute boundaries for the variation of excise taxes for the class called
aperitif : the upper boundary is the variation of excise taxes for anise aperitif, the lower boundary is the
variation of excise taxes for whisky. Tax shifting is calculated from the estimate of the coefficient of the
∆i(t), ∆i−1(t), ∆i−2(t) and ∆i−3(t) independent variables according to equation (8). The results of these
regressions and calculations for both alcoholic beverages studied beer and aperitif are presented in table
4.
autocorrelation of the residuals at first order.
13
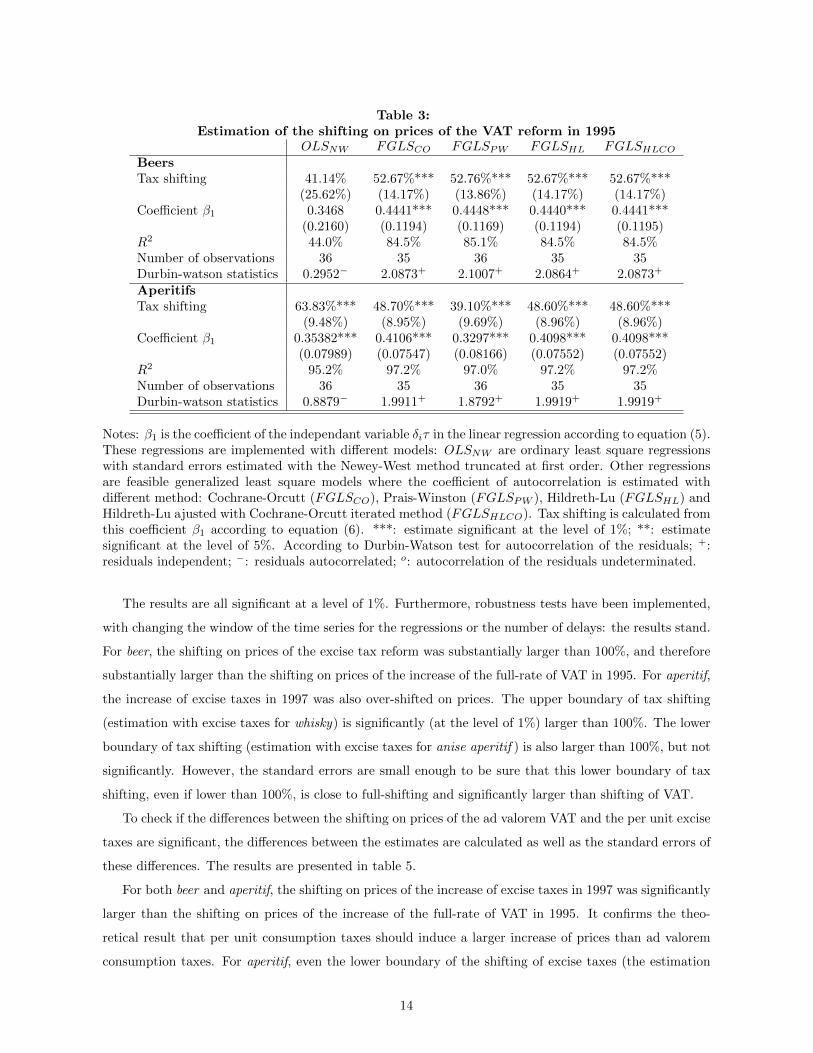
Table 3:Estimation of the shifting on prices of the VAT reform in 1995
OLSNW FGLSCO FGLSPW FGLSHL FGLSHLCOBeersTax shifting 41.14% 52.67%*** 52.76%*** 52.67%*** 52.67%***
(25.62%) (14.17%) (13.86%) (14.17%) (14.17%)Coefficient β1 0.3468 0.4441*** 0.4448*** 0.4440*** 0.4441***
(0.2160) (0.1194) (0.1169) (0.1194) (0.1195)R2 44.0% 84.5% 85.1% 84.5% 84.5%Number of observations 36 35 36 35 35Durbin-watson statistics 0.2952− 2.0873+ 2.1007+ 2.0864+ 2.0873+
AperitifsTax shifting 63.83%*** 48.70%*** 39.10%*** 48.60%*** 48.60%***
(9.48%) (8.95%) (9.69%) (8.96%) (8.96%)Coefficient β1 0.35382*** 0.4106*** 0.3297*** 0.4098*** 0.4098***
(0.07989) (0.07547) (0.08166) (0.07552) (0.07552)R2 95.2% 97.2% 97.0% 97.2% 97.2%Number of observations 36 35 36 35 35Durbin-watson statistics 0.8879− 1.9911+ 1.8792+ 1.9919+ 1.9919+
Notes: β1 is the coefficient of the independant variable δiτ in the linear regression according to equation (5).These regressions are implemented with different models: OLSNW are ordinary least square regressionswith standard errors estimated with the Newey-West method truncated at first order. Other regressionsare feasible generalized least square models where the coefficient of autocorrelation is estimated withdifferent method: Cochrane-Orcutt (FGLSCO), Prais-Winston (FGLSPW ), Hildreth-Lu (FGLSHL) andHildreth-Lu ajusted with Cochrane-Orcutt iterated method (FGLSHLCO). Tax shifting is calculated fromthis coefficient β1 according to equation (6). ***: estimate significant at the level of 1%; **: estimatesignificant at the level of 5%. According to Durbin-Watson test for autocorrelation of the residuals; +:residuals independent; −: residuals autocorrelated; o: autocorrelation of the residuals undeterminated.
The results are all significant at a level of 1%. Furthermore, robustness tests have been implemented,
with changing the window of the time series for the regressions or the number of delays: the results stand.
For beer, the shifting on prices of the excise tax reform was substantially larger than 100%, and therefore
substantially larger than the shifting on prices of the increase of the full-rate of VAT in 1995. For aperitif,
the increase of excise taxes in 1997 was also over-shifted on prices. The upper boundary of tax shifting
(estimation with excise taxes for whisky) is significantly (at the level of 1%) larger than 100%. The lower
boundary of tax shifting (estimation with excise taxes for anise aperitif ) is also larger than 100%, but not
significantly. However, the standard errors are small enough to be sure that this lower boundary of tax
shifting, even if lower than 100%, is close to full-shifting and significantly larger than shifting of VAT.
To check if the differences between the shifting on prices of the ad valorem VAT and the per unit excise
taxes are significant, the differences between the estimates are calculated as well as the standard errors of
these differences. The results are presented in table 5.
For both beer and aperitif, the shifting on prices of the increase of excise taxes in 1997 was significantly
larger than the shifting on prices of the increase of the full-rate of VAT in 1995. It confirms the theo-
retical result that per unit consumption taxes should induce a larger increase of prices than ad valorem
consumption taxes. For aperitif, even the lower boundary of the shifting of excise taxes (the estimation
14
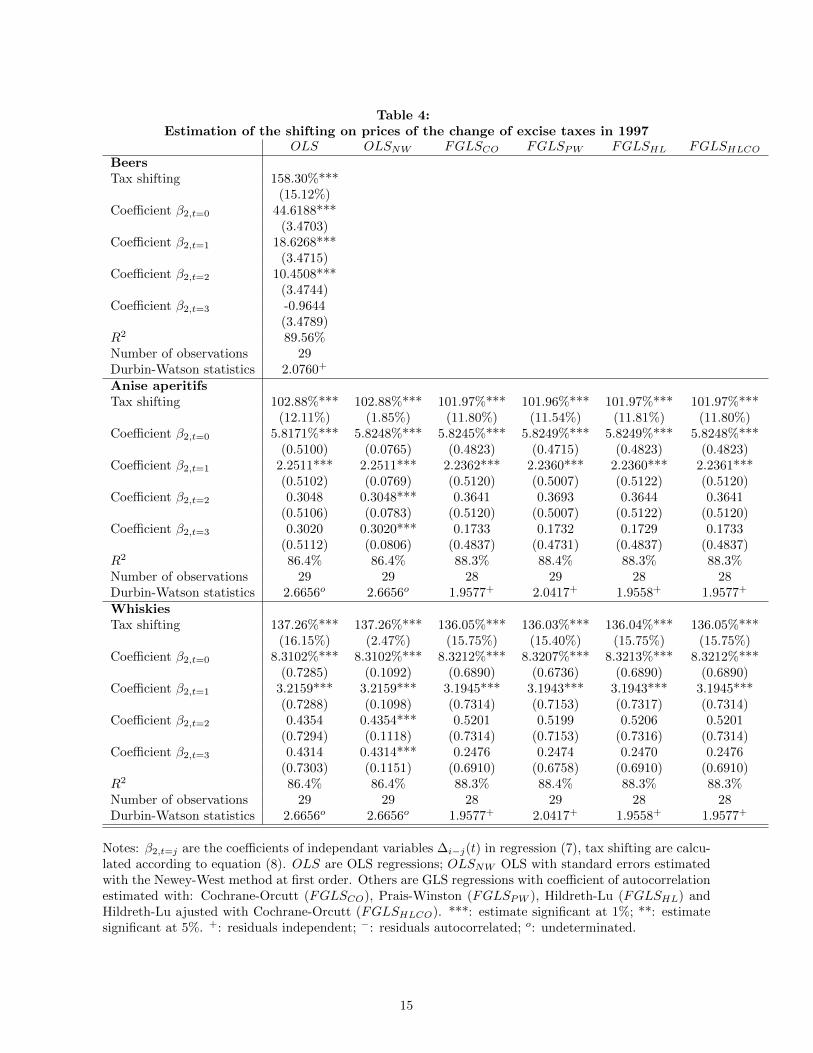
Table 4:Estimation of the shifting on prices of the change of excise taxes in 1997
OLS OLSNW FGLSCO FGLSPW FGLSHL FGLSHLCOBeersTax shifting 158.30%***
(15.12%)Coefficient β2,t=0 44.6188***
(3.4703)Coefficient β2,t=1 18.6268***
(3.4715)Coefficient β2,t=2 10.4508***
(3.4744)Coefficient β2,t=3 -0.9644
(3.4789)R2 89.56%Number of observations 29Durbin-Watson statistics 2.0760+
Anise aperitifsTax shifting 102.88%*** 102.88%*** 101.97%*** 101.96%*** 101.97%*** 101.97%***
(12.11%) (1.85%) (11.80%) (11.54%) (11.81%) (11.80%)Coefficient β2,t=0 5.8171%*** 5.8248%*** 5.8245%*** 5.8249%*** 5.8249%*** 5.8248%***
(0.5100) (0.0765) (0.4823) (0.4715) (0.4823) (0.4823)Coefficient β2,t=1 2.2511*** 2.2511*** 2.2362*** 2.2360*** 2.2360*** 2.2361***
(0.5102) (0.0769) (0.5120) (0.5007) (0.5122) (0.5120)Coefficient β2,t=2 0.3048 0.3048*** 0.3641 0.3693 0.3644 0.3641
(0.5106) (0.0783) (0.5120) (0.5007) (0.5122) (0.5120)Coefficient β2,t=3 0.3020 0.3020*** 0.1733 0.1732 0.1729 0.1733
(0.5112) (0.0806) (0.4837) (0.4731) (0.4837) (0.4837)R2 86.4% 86.4% 88.3% 88.4% 88.3% 88.3%Number of observations 29 29 28 29 28 28Durbin-Watson statistics 2.6656o 2.6656o 1.9577+ 2.0417+ 1.9558+ 1.9577+
WhiskiesTax shifting 137.26%*** 137.26%*** 136.05%*** 136.03%*** 136.04%*** 136.05%***
(16.15%) (2.47%) (15.75%) (15.40%) (15.75%) (15.75%)Coefficient β2,t=0 8.3102%*** 8.3102%*** 8.3212%*** 8.3207%*** 8.3213%*** 8.3212%***
(0.7285) (0.1092) (0.6890) (0.6736) (0.6890) (0.6890)Coefficient β2,t=1 3.2159*** 3.2159*** 3.1945*** 3.1943*** 3.1943*** 3.1945***
(0.7288) (0.1098) (0.7314) (0.7153) (0.7317) (0.7314)Coefficient β2,t=2 0.4354 0.4354*** 0.5201 0.5199 0.5206 0.5201
(0.7294) (0.1118) (0.7314) (0.7153) (0.7316) (0.7314)Coefficient β2,t=3 0.4314 0.4314*** 0.2476 0.2474 0.2470 0.2476
(0.7303) (0.1151) (0.6910) (0.6758) (0.6910) (0.6910)R2 86.4% 86.4% 88.3% 88.4% 88.3% 88.3%Number of observations 29 29 28 29 28 28Durbin-Watson statistics 2.6656o 2.6656o 1.9577+ 2.0417+ 1.9558+ 1.9577+
Notes: β2,t=j are the coefficients of independant variables ∆i−j(t) in regression (7), tax shifting are calcu-lated according to equation (8). OLS are OLS regressions; OLSNW OLS with standard errors estimatedwith the Newey-West method at first order. Others are GLS regressions with coefficient of autocorrelationestimated with: Cochrane-Orcutt (FGLSCO), Prais-Winston (FGLSPW ), Hildreth-Lu (FGLSHL) andHildreth-Lu ajusted with Cochrane-Orcutt (FGLSHLCO). ***: estimate significant at 1%; **: estimatesignificant at 5%. +: residuals independent; −: residuals autocorrelated; o: undeterminated.
15
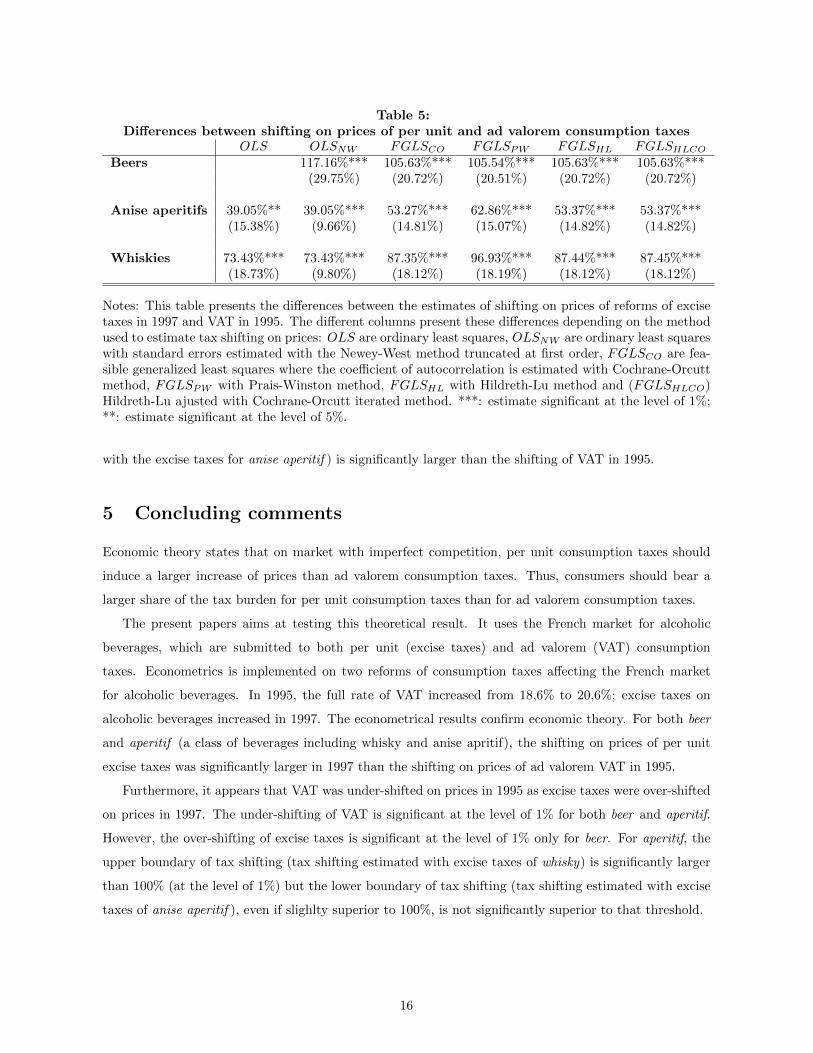
Table 5:Differences between shifting on prices of per unit and ad valorem consumption taxes
OLS OLSNW FGLSCO FGLSPW FGLSHL FGLSHLCOBeers 117.16%*** 105.63%*** 105.54%*** 105.63%*** 105.63%***
(29.75%) (20.72%) (20.51%) (20.72%) (20.72%)
Anise aperitifs 39.05%** 39.05%*** 53.27%*** 62.86%*** 53.37%*** 53.37%***(15.38%) (9.66%) (14.81%) (15.07%) (14.82%) (14.82%)
Whiskies 73.43%*** 73.43%*** 87.35%*** 96.93%*** 87.44%*** 87.45%***(18.73%) (9.80%) (18.12%) (18.19%) (18.12%) (18.12%)
Notes: This table presents the differences between the estimates of shifting on prices of reforms of excisetaxes in 1997 and VAT in 1995. The different columns present these differences depending on the methodused to estimate tax shifting on prices: OLS are ordinary least squares, OLSNW are ordinary least squareswith standard errors estimated with the Newey-West method truncated at first order, FGLSCO are fea-sible generalized least squares where the coefficient of autocorrelation is estimated with Cochrane-Orcuttmethod, FGLSPW with Prais-Winston method, FGLSHL with Hildreth-Lu method and (FGLSHLCO)Hildreth-Lu ajusted with Cochrane-Orcutt iterated method. ***: estimate significant at the level of 1%;**: estimate significant at the level of 5%.
with the excise taxes for anise aperitif ) is significantly larger than the shifting of VAT in 1995.
5 Concluding comments
Economic theory states that on market with imperfect competition, per unit consumption taxes should
induce a larger increase of prices than ad valorem consumption taxes. Thus, consumers should bear a
larger share of the tax burden for per unit consumption taxes than for ad valorem consumption taxes.
The present papers aims at testing this theoretical result. It uses the French market for alcoholic
beverages, which are submitted to both per unit (excise taxes) and ad valorem (VAT) consumption
taxes. Econometrics is implemented on two reforms of consumption taxes affecting the French market
for alcoholic beverages. In 1995, the full rate of VAT increased from 18,6% to 20,6%; excise taxes on
alcoholic beverages increased in 1997. The econometrical results confirm economic theory. For both beer
and aperitif (a class of beverages including whisky and anise apritif), the shifting on prices of per unit
excise taxes was significantly larger in 1997 than the shifting on prices of ad valorem VAT in 1995.
Furthermore, it appears that VAT was under-shifted on prices in 1995 as excise taxes were over-shifted
on prices in 1997. The under-shifting of VAT is significant at the level of 1% for both beer and aperitif.
However, the over-shifting of excise taxes is significant at the level of 1% only for beer. For aperitif, the
upper boundary of tax shifting (tax shifting estimated with excise taxes of whisky) is significantly larger
than 100% (at the level of 1%) but the lower boundary of tax shifting (tax shifting estimated with excise
taxes of anise aperitif ), even if slighlty superior to 100%, is not significantly superior to that threshold.
16
References
Anderson, S.P., de Palma, A., & Kreider, B., (2001). Tax incidence in differentiated product oligopoly.
Journal of Public Economics 81, 173-192.
Barnet, P.G., Keeler,T.E. & Hu, T., (1995). Oligopoly structure and the incidence of cigarette excise
taxes. Journal of Public Economics 57, 457-470.
Besley, T.J., (1989). Commodity Taxation and Imperfect Competition : a Note on the Effects of Entry.
Journal of Public Economics 40, 359-367.
Besley, T.J. & Rosen, H.S., (1999). Sales Taxes and Prices : an Empirical Analysis. National Tax
Journal 52, 157-178.
Blackorby, C. & Murty, S., (2007). Unit versus ad valorem taxes: Monopoly in general equilibrium.
Journal of Public economics 91, 817-822.
Carbonnier, C., (2007). Who Pays Sales Taxes ? Evidence From French VAT Reform, 1987-1999.
Journal of Public Economics 91, 1219-1229.
Carbonnier, C., (2008). Difference des ajustements de prix a des hausses ou baisses des taux de la
TVA : un examen empirique a partir des reformes francaises de 1995 et 2000. Economie et Statistique
413, 3-20.
Cournot, A.A., (1838). Recherches sur les principes mathematiques de la theorie des richesses. Œuvres
completes Tome VIII, C.N.R.S. and Librairie philosophique J. Vrin, Paris, 1980.
Delipalla, S. & Keen, M., (1992). The Comparison Between Ad Valorem and Specific Taxation Under
Imperfect Competition. Journal of Public Economics 49, 351-367.
Delipalla, S. & O’Donnell, O., (2001). Estimating Tax Incidence, Market Power and Market Conduct
: The European Cigarette Industry. International Journal of Industrial Organisation 19, 885-908.
Denicolo, V. & Matteuzzi, M., (2000). Specific and Ad Valorem Taxation in Asymmetric Cournot
Oligopolies. International Tax and Public Finance 7, 335-342.
Droge, S. & Schroder, P. (2009). The welfare comparison of corrective ad valorem and unit taxes under
monopolistic competition. International Tax and Public Finance 16, 164-175
Dungan, P., Mintz, J., Poschmann, F. & Wilson, T., (2008). Growth Oriented Sales Tax Reform
for Ontario: Replacing the Retail Sales Tax with a 7.5 Percent Value-Added Tax. C.D. Howe Institute
Commentary 273.
Grazzini, L., (2006). A Note on Ad Valorem and Per Unit Taxation in an Oligopoly Model. Journal
of Economics 89, 59-74.
Katz, M.L. & Rosen, H.S., (1985). Tax Analysis in an Oligopoly Model. Public Finance Quarterly 13,
3-19.
Keen, M. & Lockwood, B., (2010). The value added tax: Its causes and consequences. Journal of
Development Economics 92, 138-151.
Myles, G., (1996). Imperfect competition and the optimal combination of ad valorem and specific
17
taxation. International Tax and Public Finance 3, 29-44.
Seade, J.K., (1980). On the Effect of Entry. Econometrica 48, 479-490.
Skeath, S.E. & Trandel, G.A., (1994). A Pareto comparison of ad valorem and unit taxes in noncom-
petitive environments. Journal of Public Economics 53, 53-71.
Smart, M. & Bird, R.M., (2009). The Economic Incidence of Replacing a Retail Sales Tax with a
Value-Added Tax: Evidence from Canadian Experience. Canadian Public Policy 35, 85-97
Stern, N., (1987). The Effects of Taxation, Price Control and Government Contracts in Oligopoly and
Monopolistic Competition. Journal of Public Economics 32, 133-158.
Suits, D.B. & Musgrave, R.A., (1953). Ad valorem and unit taxes compared. Quarterly Journal of
Economics 67, 598-604.
Whalley, J. & Kononova, V. (2010). Recent Russian Debate on Moving from VAT to Sales Taxes and
Its Global Implications. Journal of Globalization and Development 1.
Wicksell, K., (1896). Finanztheoretische Untersuchungen nebst Darstellung and Kritik des Steuerwe-
sens Schwedens, Gustav Fisher, Jena. Trans: Taxation in the Monopoly Case. In: Musgrave, R. & Shoup,
C., (Eds.), Readings in the Economics of Taxation. Allen and Unwin, London, 1959.
Young, D., & Bielinska-Kwapsisz, A., (2002). Alcohol taxes and beverage prices. National Tax Journal
55, 57-74.
18