Embed Size (px)
Citation preview

In D. de Waard, K. Brookhuis, R. Wiczorek, F. di Nocera, R. Brouwer, P. Barham, C. Weikert, A. Kluge,
W. Gerbino, & A. Toffetti (Eds.) (2014). Proceedings of the Human Factors and Ergonomics Society Europe Chapter 2013 Annual Conference. ISSN 2333-4959 (online). Available from http://hfes-
europe.org
Ship voyage plan coordination in
the MONALISA project:
user tests of a prototype ship traffic management system
Thomas Porathe, Linda de Vries, & Johannes Prison
Maritime Human Factors, Chalmers University of Technology,
Sweden
Abstract
EU has promised to reduce emissions by 80 % by 2050. For the shipping industry
“slow steaming” for just-in-time arrival promises reductions of emissions. But a
rapid increase in the construction of offshore wind farms planned in the North Sea
may lead to ships facing a very complex and safety critical traffic environment in the
future. Both of these issues bring ship traffic management to attention. In the Baltic
Sea, the EU project MONALISA (Motorways & Electronic Navigation by
Intelligence at Sea) has been looking at a voyage plan coordination system where a
Ship Traffic Coordination Centre (STCC) handles a specific area, e.g. the Baltic Sea.
A prototype system was developed and tested in a full mission bridge simulator
environment for some simple scenarios. Qualitative data were collected; the main
aim was to test mariners’ acceptance of such a system. The participants were in
general positive to the tested system; younger somewhat more than older. Some
concern was expressed over risks of de-skilling and a common concern was the
importance of the final control of the vessel resting with the captain on-board.
Introduction
This paper will present work on ship voyage plan coordination done in the TEN-T
EU project MONALISA. Ship voyage plan coordination will be introduced from
three perspectives: an environmental, an efficiency and a safety perspective.
The environmental perspective
EU has promised to reduce greenhouse gas emissions by 80 % by 2050 (European
Commission, 2012). That is a substantial promise. The shipping industry is
responsible for about 4-5 % of all greenhouse gas emissions globally (Harrould-
Kolieb, 2008). That may not be much. But if the collective shipping industry was a
country, it would be the 6th
largest producer of greenhouse gas emissions. While
land transportation can drive on electricity produced by wind, water and fossil-free
fuels, these options are very limited for shipping. One large opportunity lies in what
is called slow steaming. By reducing the speed of a typical container vessel by 30 %,
a 50 % reduction in fuel consumption, and thereby also fuel costs and emissions, can

218 Porathe, de Vries, & Prison
be achieved (Cariou, 2011). This is, however, a complex issue, as slower speed also
means that more ships have to be engaged in order to maintain the transport
capacity. The bottom line is that slow steaming has a potential to reduce emissions
from the shipping industry. A study by Pierre Cariou (2011) shows that slow
steaming has the potential of reducing emissions by around 11%, looking at data
from 2 years back. This is close to the target of a 15% reduction by 2018 that was
proposed by the International Maritime Organisation’s Marine Environment
Protection Committee, 2009.
The efficiency perspective
Today, ports have a very close horizon. The harbour masters of Scandinavia’s
biggest port, Gothenburg, and Humber Ports, one of U.K.’s largest ports, reveal that
they do not know more than 2-3 hours beforehand whether a ship will arrive on time
or not (personal communication 2012 and 2013). This leads to ports operating on a
“first come, first served” basis which in turn leads to ships normally going full speed
ahead and then anchoring up, issuing their notice of readiness. If slow steaming is to
become a reality, a just-in-time, ship traffic management system with time slots has
to be put in place that allows ship arrivals and departures to become predictable.
This would in turn be beneficial to the entire transportation chain, on into the
hinterland. Another factor is the increased complexity of ship traffic. The North Sea
is an extremely busy shipping area and the English Channel the busiest strait in the
world (133,444 ship passages in 2012).
A study in another EU research project, ACCSEAS, predicts that this number will
increase to 200,000 by 2025 (ACCSEAS, 2013). To further complicate the picture,
there is a rapid exploitation of sea areas for wind energy. In the German Bight, for
instance, 10,000 wind turbines are currently being planned to replace German
nuclear power. And to achieve the EU goal of 80 % reduction mentioned above, sea-
based wind farms must keep expanding. In Figure 1 (left) the projected state of the
North Sea is shown, with the amount of ship traffic passing the red lines (and the
2012 figure in brackets). The dark blue polygons are areas where today there is open
sea, and tomorrow there will be wind mill farms. In Figure 1 (right) there is a close
up of the “windmill city” of the German Bight, where shipping risks being
conducted under more or less “street-like” conditions.
Figure 1. To the left, the predicted number of ships in the North Sea passing each red line in
2025 (the figures in brackets are the actual numbers in 2012). The blue areas are the planned
voyage plan coordination 219
wind farms. To the right is a close up of the German Bight area, with the planned wind farms
and shipping lanes (data from the ACCSEAS project, 2013).
However, if slow steaming is to be standard practice, a still larger increase in the
number of ships is needed to not only keep up, but increase transportation capacity.
Add to that the expected reduction in available sea space. Both these factors also
bring ship traffic management to attention.
The safety perspective
On the 31 May 2003, the 225 metre long Chinese bulk carrier M/V Fu Shan Hai
collided with the 100 metre long Cyprus registered container ship M/V Gdynia,
about 3 nautical miles north of the island of Bornholm, in the southern Baltic Sea.
The collision was the result of a failed avoidance manoeuvre by Gdynia as the give-
way vessel. The collision ripped open a hole in the forward part of Fu Shan Hai
which subsequently sank. The crew of 27 were all rescued (DMA, 2003).
Fu Shan Hai had departed from Ventspils, in Latvia, on 30 May 2003 at 16:20 local
time on a voyage to China. Gdynia had departed from the port of Gdynia, in Poland,
the same evening at 23:25 on a voyage to Hull, England. The Fu Shan Hai and
Gdynia collision serves as an example of the 10-15 vessels every year that are totally
lost after a collision at sea (IUMI, 2012). Although there is a lot to be said about the
actions of the ships in the final stages before the collision, this paper will focus on
the fact that both ships happened to be at the same place at the same time, the
question being: could this have been avoided?
All larger, so-called SOLAS vessels are required to make a “berth-to-berth voyage
plan” before leaving port, according to Reg. 34 of SOLAS Chapter V and IMO
Resolution A.893(21) (IMO, 2010). When Fu Shan Hai left Ventspils, she had such
a plan for her voyage across the Baltic Sea, up through the Belt and on all the way to
China. Taking into account her service speed, the crew could calculate an estimated
time of arrival in China. The same would be true for any point on the voyage. Also,
Gdynia had such a voyage plan.
If these two plans could have been superimposed on top of each other in a central
coordination system, it would, knowing the service speed of both vessels, have been
possible to predict that they would be at some point at the same time. Then only a
very slight change of speed would lead to the avoidance of the close quarters
situation which occurred. However, sharing one’s voyage plan with a coordination
centre is a controversial issue, challenging the captain’s ultimate control of the
vessel. The presented study has been seeking to answer how the suggested
MONALISA voyage plan coordination system is perceived by Swedish mariners.
MONALISA and the concept of route exchange
MONALISA is a TEN-T EU project, started in 2010 and which will be finished in
2013. The project has been coordinated by the Swedish Maritime Administration.
Other partners in the project are Chalmers University of Technology, Sweden;
Danish Maritime Authority; Finnish Transport Agency; Gate House, Denmark;
SAAB Transponder Tech, Sweden; and SSPA Sweden AB. The MONALISA

220 Porathe, de Vries, & Prison
project deals with different maritime questions, but in this paper only the particular
issue of route exchange will be considered.
In order to avoid yet another system on the bridge, the route exchange system needs
to be integrated into the Electronic Chart and Display Information System (ECDIS)
that already is central on a ship’s bridge. ECDIS is a computerised information
system that contains electronic nautical charts, and will become mandatory on deep
sea vessels by 2018. The voyage plan is, for instance, made in the ECDIS and
resides in the navigation computer, and thus could easily be shared if relevant
infrastructure and standards were in place.
In order to test route exchange, a prototype “ECDIS-like” ship-based test platform
was developed to mimic a standard ECDIS, but which was equipped with
functionality to exchange routes. A corresponding shore-based station was also
developed where routes could be received and compared. A first set of user tests,
with simple cases of route exchange between only one ship and a shore centre, were
carried out in a simulator centre at Chalmers University of Technology, in Sweden,
with bridge officers and Vessel Traffic Service (VTS) operators.
The main research question was whether such a system would be accepted by the
professional participants. Secondary questions had to do with workload, changes in
procedures and usability improvements. Another major task was to look for
unintended consequences of change, as new technologies always carry an inherent
risk of new types of accidents.
Theory
The theories behind this type of system are well-known to all human factors
researchers. Donald Norman (1988) introduced the notion of knowledge in the head
and knowledge in the world. A nautical chart is a representation of the physical
world. It represents a crystallisation of knowledge from generations of
hydrographers and geographers. By drawing a pencil line representing an intended
voyage, knowledge is stored (in the form of checks for under keel clearance, risks
etc.), and cognition is downloaded during the voyage. The projection of the chart is
such that, by measuring the bearing of the intended path, the course to steer is
immediately clear. The nautical chart is used, here, as a cognitive tool in a process
of distributed cognition, investigated by Edwin Hutchins (1995). On a more general
level, this is all part of the area of Joint Cognitive Systems (Hollnagel & Woods,
2005), and earlier, Cognitive Systems Engineering (Rasmussen et al., 1994), to
mention just some important examples.
Method
In order to test ship traffic management in an ecologically valid way, route exchange
needed to be tested on a practical level in a ship and shore simulator. The first step
was to design a prototype application where captains and shore operators could
experience, first hand, the effects of such a system. Although much focus was put on
the conceptual level of acceptance within the maritime community, it was also
voyage plan coordination 221
necessary to ascertain that procedures on the bridge were not changed in such a way
that would increase workload or require more manning.
Information flow in route exchange
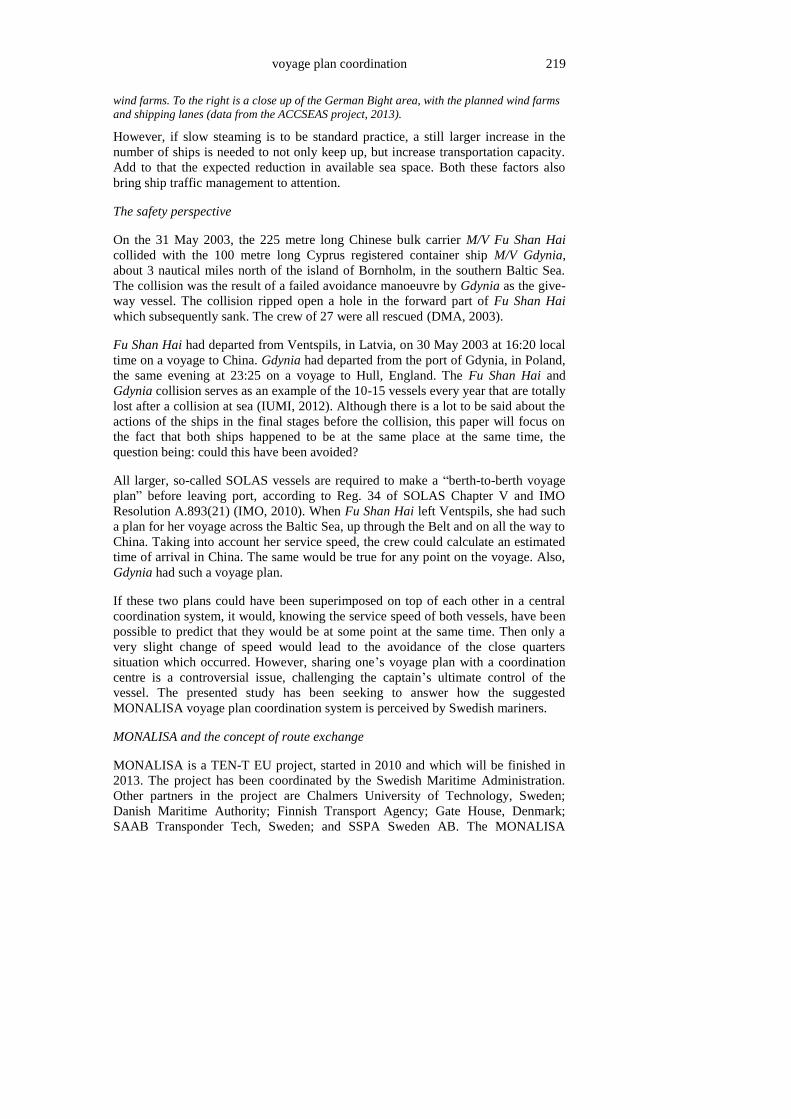
The information flow can, from a user perspective, be described as follows. The
voyage is planned on-board as usual (or maybe requested from a service provider,
e.g. a weather routing service or a route library). Once the route has been validated
(checked for under-keel clearance, and that it follows fairways and traffic separation
schemes), and departure and arrival times have been added, the route is sent to the
STCC. The route is now “pending” (signified by a yellow dashed pattern in the chart
systems). The STCC checks the route, (checks it for under keel clearance, violation
of NoGo areas and loss of separation, i.e. conflicts with other ships or traffic
congestions, not tested in this study). The STCC can now either “recommend” the
route as it is, or send the route back with suggested changes (signified in the charts
by green dashed/”recommended” and red dashed/”not recommended” routes). If the
STCC suggests changes, the ship can either accept or reject these changes, or
suggest another modification. Routes can be sent back and forward until an
agreement is reached and a final solid green/”agreed” route is reached (see Figure
2).
Service providers Ship
Ship plans route…
… or requests route from service provider
STCC
Ship sends route suggestion to STCC.
STCC checks route and recommends or suggests amendments…
Ship agrees recommended/ amended route
Ship rejects amended route and suggests new route…

222 Porathe, de Vries, & Prison
Figure 2. On top, is a simplified diagram of the information flow for the route exchange
process. To the bottom, is the symbology used in the electronic chart systems to signify (top) a
“pending” route sent from ship to shore, now awaiting optimisation, then a stage in a route
negotiation (middle) where a deviation is “recommended” (green) instead of the original
(red) segment. Finally (bottom), the “recommended” route has been “acknowledged” by the
ship and becomes green/”agreed”.
Two prototype systems were developed and tested during this study: one from
SAAB Transponder Tech and one from the Danish Maritime Authority. Both
systems had a ship and a shore display, and there were no significant differences
between them. In this paper, we will make no distinction between the two systems.
The prototype systems were set up in the full mission bridge simulator environment
at Chalmers University of Technology in Gothenburg, Sweden, using one bridge and
one shore station. AIS targets and routes were sent between ship and shore using
prototype protocols developed for the test. The technical details of these protocols
will later be presented through the MONALISA 2 project.
The first user tests with simple cases of route exchange between one ship and a
shore centre were carried out in two sessions, in May and September 2013, with 12
ship captains, 11 maritime academy 4th
year cadets and 5 VTS operators. This gave a
sample of subject matter experts: 25 male, 3 female; ages 27-66, mean age 42;
professional experience from none (cadets) to 40 years, the mean being 15.7 years of
professional experience (cadets excluded).
Each block of the study consisted of 4 scenarios where one captain and a cadet
manned the ship bridge and a VTS operator the STCC. Each such block took about 3
hours to conduct, including familiarisation with the prototype systems, the 4
scenarios and a debriefing session.
Scenario 1: Route planning initiated by ship. The ship is anchored outside Hirtshals
in the northern part of Denmark and the bridge crew plan a route from their present
position to Helsingborg in southern Sweden along the standard “T-route” (the deep
water route through Kattegat). Once planned, the route is sent to STCC. STCC

voyage plan coordination 223
checks the route and sends a “recommended” route back. The ship finally
“acknowledges” the route (see Figure 3, left).
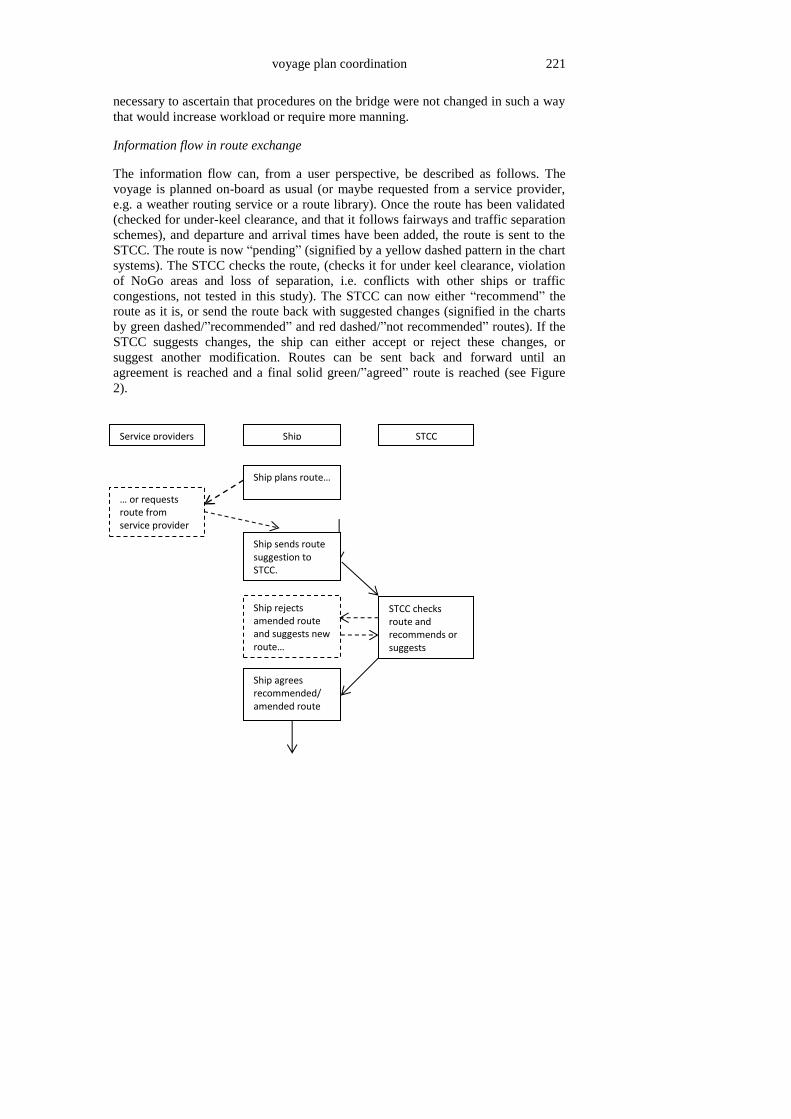
Figure 3. Three of the four test scenarios. Left scenario 1 with the route from Hirtshals to
Helsingborg that the bridge crew was to plan. Top right, scenario 2, a route change done en
route, initiated by the ship. Bottom right, scenario 4: drifting timber causing STCC to suggest
a route deviation. (The images are just scenario descriptions, not ECDIS with MONALISA
symbology).
Scenario 2: Route change initiated by ship. An hour later, the ship is en route to
Helsingborg on its agreed route, just north of Skaw, on the northern tip of Denmark.
The engine room calls and says they will need to do some repair in the engine room.
They ask if the bridge can provide calmer conditions. The captain decides to change
the route to the “B-route” (in the west part of Kattegat), in the sheltered waters along
the eastern shores of Denmark. The new route is planned and sent to STCC (see
Figure 3, top right).
Scenario 3: Route change initiated by STCC. There has been a delay in port
operations at Helsingborg, and a request to slow down is sent from STCC to the
ship. New ETAs (Estimated Times of Arrival) are suggested in the waypoints ahead.
The change is negotiated and finally agreed.
Scenario 4: Route change initiated by STCC. A ship ahead has lost part of its deck
cargo (timber), which is now floating in the water. An MSI (Maritime Safety
Information) is sent out and displayed in the chart (see Figure 3, lower right). STCC
suggests a route change around the dangerous area, which is negotiated and agreed
(see Figure 4).
224 Porathe, de Vries, & Prison
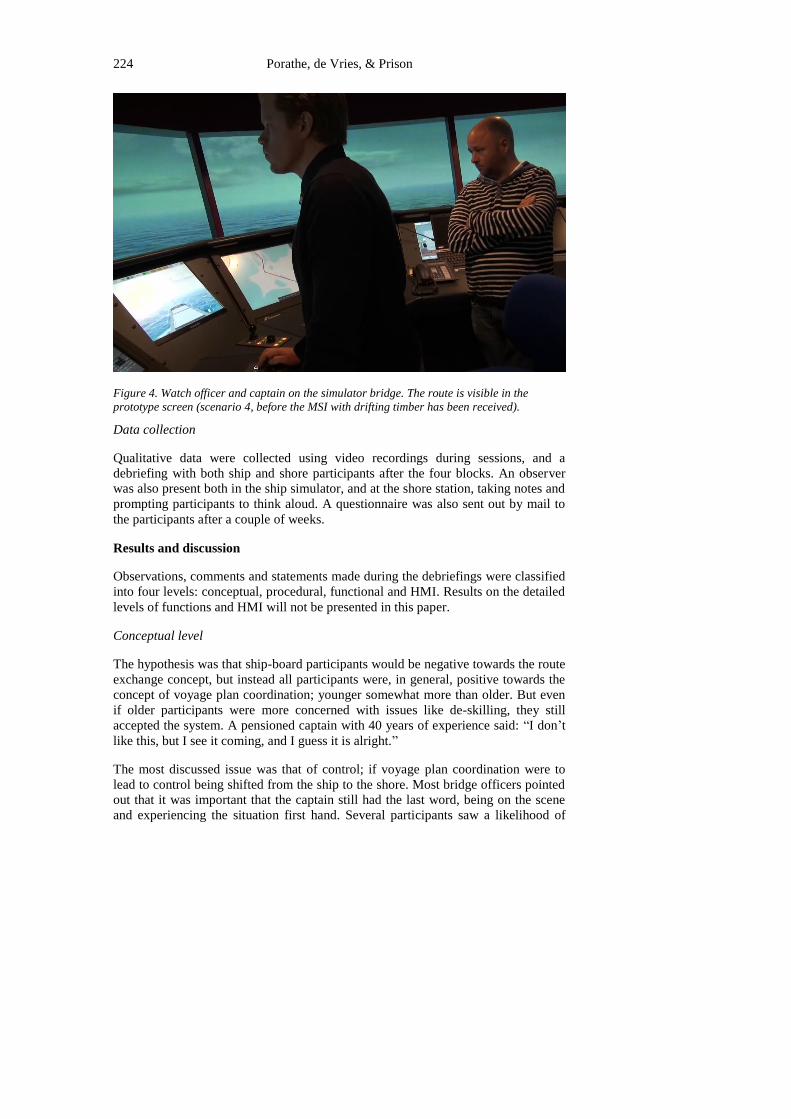
Figure 4. Watch officer and captain on the simulator bridge. The route is visible in the
prototype screen (scenario 4, before the MSI with drifting timber has been received).
Data collection
Qualitative data were collected using video recordings during sessions, and a
debriefing with both ship and shore participants after the four blocks. An observer
was also present both in the ship simulator, and at the shore station, taking notes and
prompting participants to think aloud. A questionnaire was also sent out by mail to
the participants after a couple of weeks.
Results and discussion
Observations, comments and statements made during the debriefings were classified
into four levels: conceptual, procedural, functional and HMI. Results on the detailed
levels of functions and HMI will not be presented in this paper.
Conceptual level
The hypothesis was that ship-board participants would be negative towards the route
exchange concept, but instead all participants were, in general, positive towards the
concept of voyage plan coordination; younger somewhat more than older. But even
if older participants were more concerned with issues like de-skilling, they still
accepted the system. A pensioned captain with 40 years of experience said: “I don’t
like this, but I see it coming, and I guess it is alright.”
The most discussed issue was that of control; if voyage plan coordination were to
lead to control being shifted from the ship to the shore. Most bridge officers pointed
out that it was important that the captain still had the last word, being on the scene
and experiencing the situation first hand. Several participants saw a likelihood of

voyage plan coordination 225
conflicts between the STCC and vessel on the issue of control, and between the
STCC and ship owners on the issue of costs.
From a shore perspective, the ability to check routes and see vessels’ intentions was
welcomed, but concerns were raised about workload when dealing with several
vessels in a heavy traffic or emergency situation.
On the question of whether a route exchange system has a future, comments ranged
from pointing out that it is inevitable, to stating that it may have a positive effect on
the quality of navigation if captains can learn to trust it. Some comments were to the
effect that it will never be accepted by captains and ship owners.
Procedural level
Participants in both vessel and STCC felt that new routines were involved in
operating the system, but within a familiar environment, so that, once they
understood what was expected of them, and how to do it, it was easy to get
accustomed.
All differentiated between the planning and monitoring functions of the system, and
the need for separate routines for each. In most cases, physical separation of the
functions, either separate screens or a separate workplace, were suggested. It was
pointed out that individual vessels have different routines for route planning, either
first using paper charts, or using the ECDIS straight away, which, depending on the
method currently employed, could lead to a change in routine.
With regard to vessel manning, some felt that an extra person may be needed on the
bridge in heavy traffic situations, to leave the on-watch officer free to navigate and
avoid collision. It was also felt by some that, depending on the degree of freedom
allowed to deviate from the planned course, implementation of such a system would
result in extra workload for the captain, who would be required to approve all
changes made.
Routines in the STCC, as opposed to the existing VTS stations, would depend on the
role of the STCC. Issues raised by the participants were workload, the capacity to
deal with heavy traffic, the ability to plan routes around obstructions and the time
constraints involved. Most participants felt that the role of the STCC in an MSI
situation should be limited to entering the area on the chart and sending to affected
vessels.
Survey
In a survey that was sent to the participants several weeks after they participated in
the study, the question What is your opinion about the tested route exchange
concept? was asked. Eighteen answers where received, out of 28, and 14 were
“positive” or “very positive”, and 4 “did not know”. No one was negative. On the
question Do you think a similar route exchange concept will become reality in the
future? 17 answered “probably” or “most probably” and only 1 answered “probably
not”.
226 Porathe, de Vries, & Prison
Conclusion and future studies
Most participants, both younger and older, were more or less positive towards the
ship traffic management concept.
Having said that, there was discussion on the yet undecided scope of the proposed
route exchange system and the role of the STCC; would it be monitoring, advisory,
assistance or full control? Would it involve a change to the established principle that
the captain is ultimately responsible for the vessel? Would the captain be required to
relinquish some degree of control of the vessel to the shore centre? Where would
responsibility and liability lie for delays, costs incurred, accidents etc.? Several
participants mentioned the likelihood of conflict between the STCC and vessel on
the issue of control, and between the STCC and ship-owners on the issue of costs.
All participants agreed that the final decision needed to stay with the captain on-
board.
One has to be aware of the limited validity of these findings, considering the small
number of participants and the cultural homogeneity (all Swedish). Also, the tested
scenarios only involved one ship, without the complexity of routing several ships.
Future studies will target both these limitations. Preparations for test-beds in other
parts of the world have started, and, in the MONALISA 2 project, complex
simulation involving more ships will be conducted.
Acknowledgements
This research has been possible thanks to funding from the European Union’s Seventh
Framework Programme for infrastructure TEN-T, and also from the Region Västra
Götaland.
References
ACCSEAS (2013). www.accseas.eu
Cariou P. (2011). Is slow steaming a sustainable means of reducing CO2 emissions
from container shipping? Elsevier, Transportation Research Part D: Transport
and Environment, 16 (3), 260–264
DMA, Danish Maritime Authority (2003). CASUALTY REPORT: Collision between
Chinese bulk carrier FU SHAN HAI and Cypriot container vessel GDYNIA.
http://www.dmaib.dk/Sider/Ulykkesrapporter.aspx
European Commission (2012). A Roadmap for moving to a competitive low carbon
economy in 2050. http://eur-
lex.europa.eu/LexUriServ/LexUriServ.do?uri=CELEX:52011DC0112:EN:
NOT
Harrould-Kolieb, E. (2008). Shipping impact on climate: a source with solutions.
Washington DC: Oceania.
Hollnagel, E., & Woods, D.D. (2005). Joint cognitive systems. Foundations of
cognitive systems engineering, Boca Raton, FL; London: Taylor & Francis
Hutchins, E. (1995). Cognition in the wild. Cambridge: MIT Press.
voyage plan coordination 227
Graham, P. (2012). Casualty and World Fleet, Statistics as at 01.01.2012. London:
IUMI (International Union of Marine insurance), Facts and figures
committee.
IMO, International Maritime Organization. (1974). International Convention for the
Safety of Life at Sea (SOLAS), 1974. Amended several times.
http://www.imo.org/About/Conventions/ListOfConventions/Pages/Internatio
nal-Convention-for-the-Safety-of-Life-at-Sea-(SOLAS),-1974.aspx
Marine Environment Protection Committee. (2009). Analysis on the Appropriate
Values of the Reduction Rates of the Required EDDI. 60/4/36 Submitted by
Japan, 15 January 2010.
Norman D.A.(1988). The psychology of everyday things. New York: Basic Books.
Rasmussen, J., Pejtersen, A.M., & Goodstein, L.P. (1994). Cognitive Systems
Engineering. New York: Wiley.