Embed Size (px)
Citation preview
©SHRM 2014
Workforce Planning: Aging and Employment Module 5: The Employer Perspective: Strategy
Barbara McIntosh, Ph.D., SPHR • 2014 The development of this content was made possible through the support from a grant from the Alfred P. Sloan Foundation.
©SHRM 2014 2
Module 5: Overview of the Employer Perspective
• Labor supply issues.• Business case for older workers.• Best-practice models.• Organizational strategy.• Implications for HR policies and practices.
©SHRM 2014 3
Employer Perspective: Demographics and Labor Supply
• More workers are ages 55 and older. Given supply and demand, this demographic will increase employer receptivity to older workers.
> In 2000, 13% of workers were ages 55 and older. Those between the ages of 55 and 64 are the fastest-growing segment.
> By 2015, 20% of workers will be ages 55 and older.
• Critical labor shortages are predicted in dominant, growing, skill-specific sectors, for example:
> Nursing and health care.> Energy.> Construction.
©SHRM 2014
Fortune 500 Companies and Age
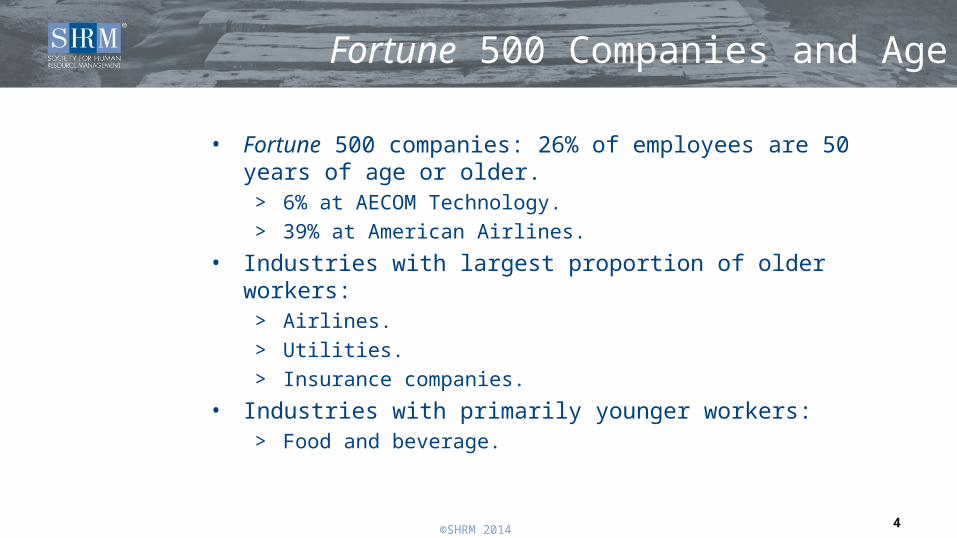
• Fortune 500 companies: 26% of employees are 50 years of age or older.
> 6% at AECOM Technology.> 39% at American Airlines.
• Industries with largest proportion of older workers:> Airlines.> Utilities.> Insurance companies.
• Industries with primarily younger workers:> Food and beverage.
4
©SHRM 2014
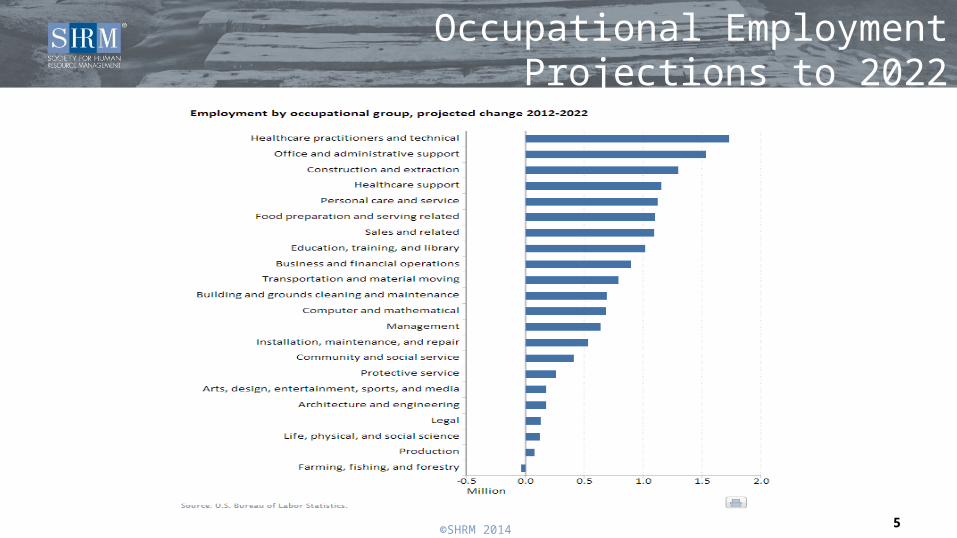
Occupational Employment Projections to 2022
5
©SHRM 2014 6
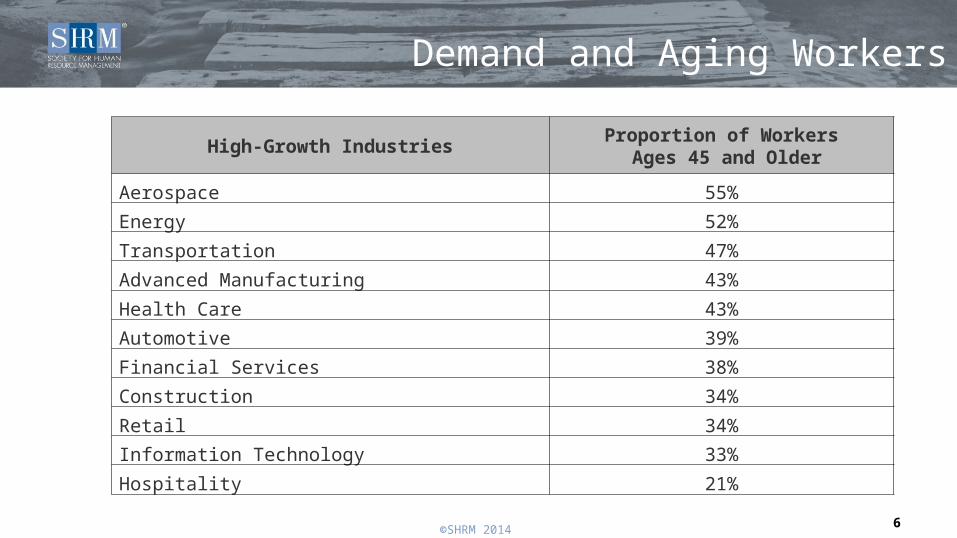
Demand and Aging Workers
High-Growth IndustriesProportion of Workers
Ages 45 and Older
Aerospace 55%
Energy 52%
Transportation 47%
Advanced Manufacturing 43%
Health Care 43%
Automotive 39%
Financial Services 38%
Construction 34%
Retail 34%
Information Technology 33%
Hospitality 21%
©SHRM 2014 7
Employer View: Surplus or Shortage?
• Labor surplus:> The recession resulted in layoffs. Are there implications for a firm’s age
distribution?> Changing industry mix means a shift in required skills.> Implications for older workers and employers?
• Labor shortage alternatives:> Other labor market segments?> Immigration?> Technology?> Current aging workers and retirees?
©SHRM 2014 8
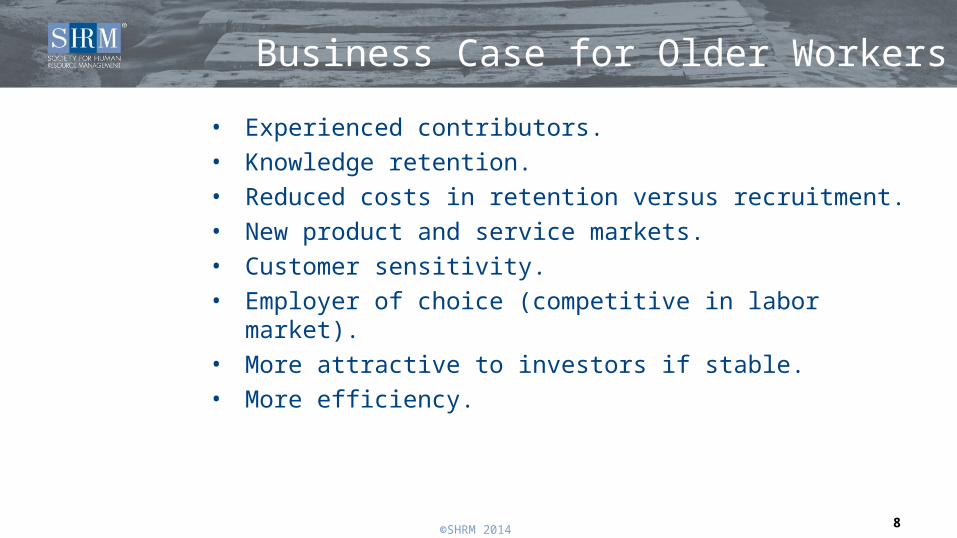
Business Case for Older Workers
• Experienced contributors.• Knowledge retention.• Reduced costs in retention versus recruitment.• New product and service markets.• Customer sensitivity.• Employer of choice (competitive in labor market).• More attractive to investors if stable.• More efficiency.
©SHRM 2014 9
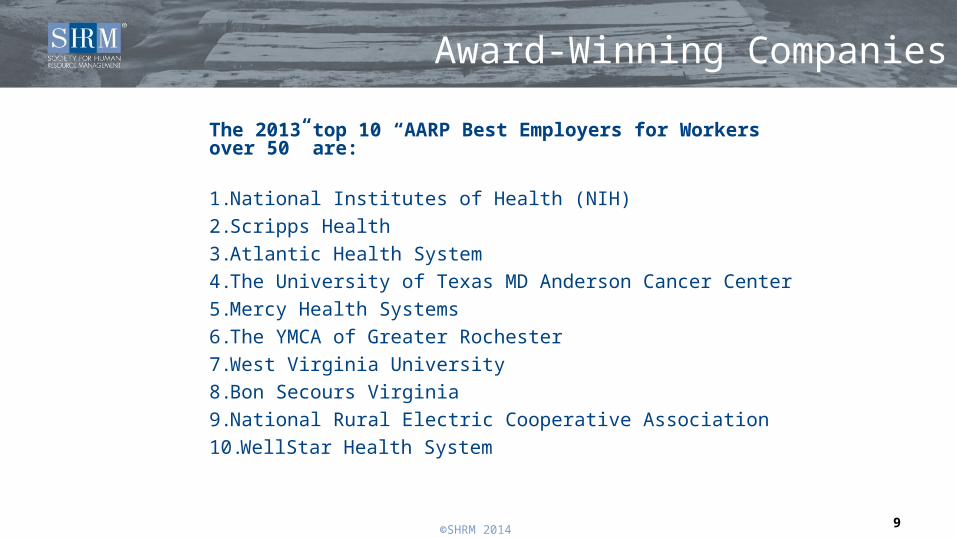
Award-Winning Companies
The 2013 top 10 “AARP Best Employers for Workers over 50” are:
1.National Institutes of Health (NIH)2.Scripps Health3.Atlantic Health System4.The University of Texas MD Anderson Cancer Center5.Mercy Health Systems6.The YMCA of Greater Rochester7.West Virginia University8.Bon Secours Virginia9.National Rural Electric Cooperative Association10.WellStar Health System
©SHRM 2014 10
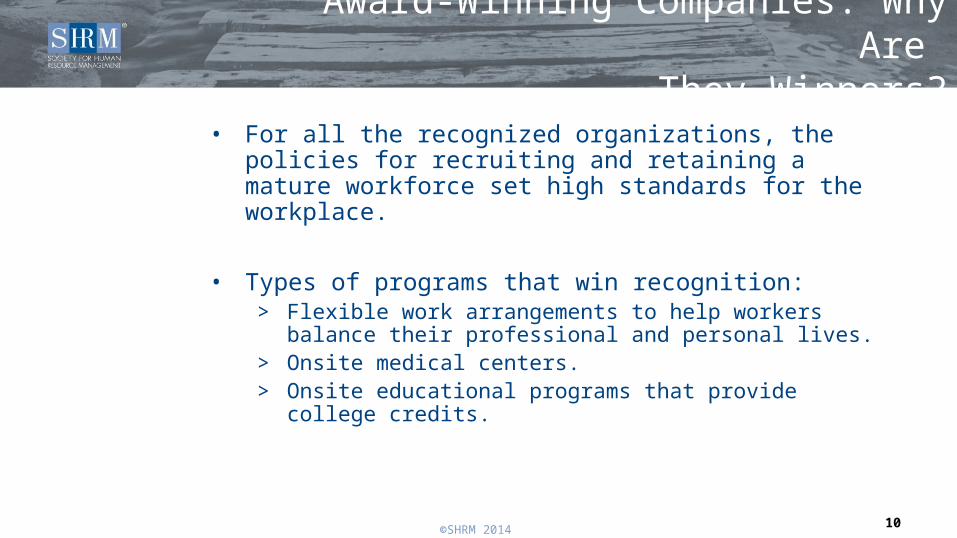
Award-Winning Companies: Why Are They Winners?
• For all the recognized organizations, the policies for recruiting and retaining a mature workforce set high standards for the workplace.
• Types of programs that win recognition:> Flexible work arrangements to help workers balance their
professional and personal lives.> Onsite medical centers.> Onsite educational programs that provide college credits.
©SHRM 2014 11
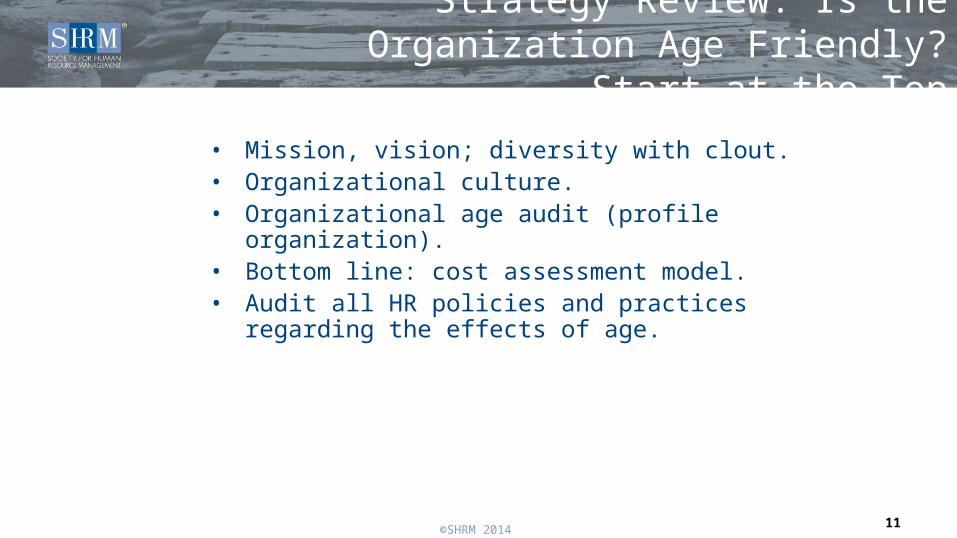
Strategy Review: Is the Organization Age Friendly? Start at the Top
• Mission, vision; diversity with clout.• Organizational culture.• Organizational age audit (profile organization).• Bottom line: cost assessment model.• Audit all HR policies and practices regarding the effects of age.

©SHRM 2014 12
Organization Culture: Mission, Vision and Diversity
An organization’s culture is a set of shared assumptions, values and norms that identifies what that organization considers important and how employees and managers should behave.
Kotter, J. (2012, September 27). The Key to changing organizational culture. Forbes. Retrieved from http://www.forbes.com/sites/johnkotter/2012/09/27/the-key-to-changing-organizational-culture/
Watkins, M. (2013, May 15). What is organizational culture? And why should we care? HBR Blog Network. Retrieved from http://blogs.hbr.org/2013/05/what-is-organizational-culture/
©SHRM 2014 13
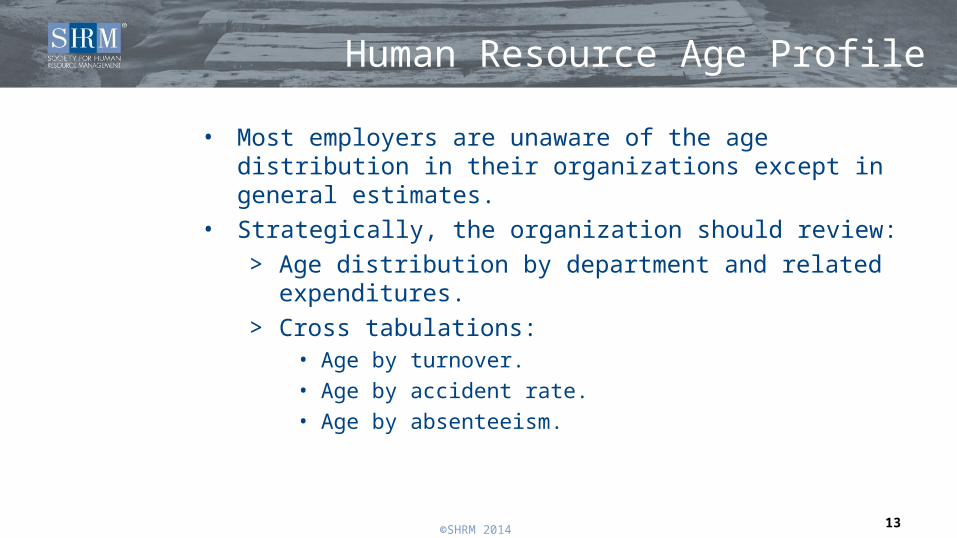
Human Resource Age Profile
• Most employers are unaware of the age distribution in their organizations except in general estimates.
• Strategically, the organization should review:> Age distribution by department and related expenditures.> Cross tabulations:
• Age by turnover.• Age by accident rate.• Age by absenteeism.
©SHRM 2014 14
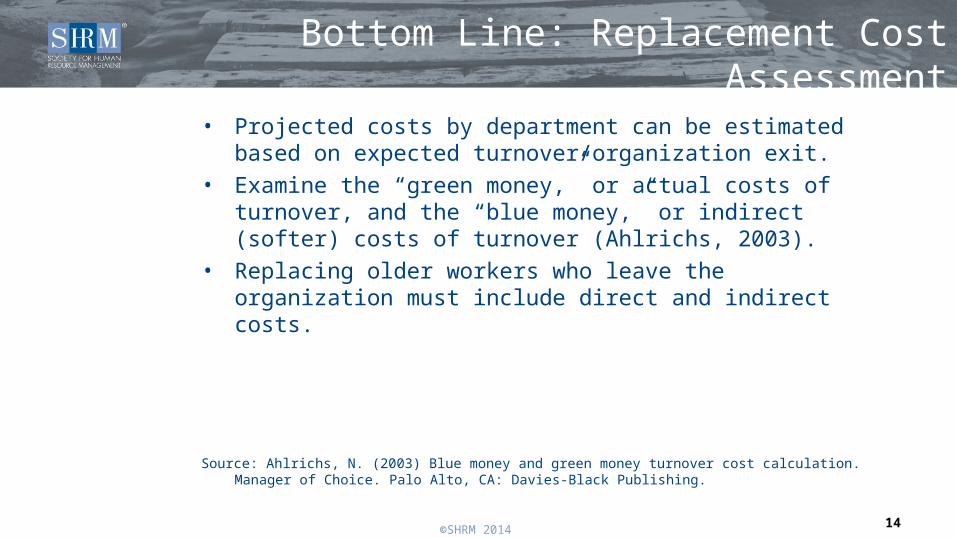
Bottom Line: Replacement Cost Assessment
• Projected costs by department can be estimated based on expected turnover/organization exit.
• Examine the “green money,” or actual costs of turnover, and the “blue money,” or indirect (softer) costs of turnover (Ahlrichs, 2003).
• Replacing older workers who leave the organization must include direct and indirect costs.
Source: Ahlrichs, N. (2003) Blue money and green money turnover cost calculation. Manager of Choice. Palo Alto, CA: Davies-Black Publishing.
©SHRM 2014 15
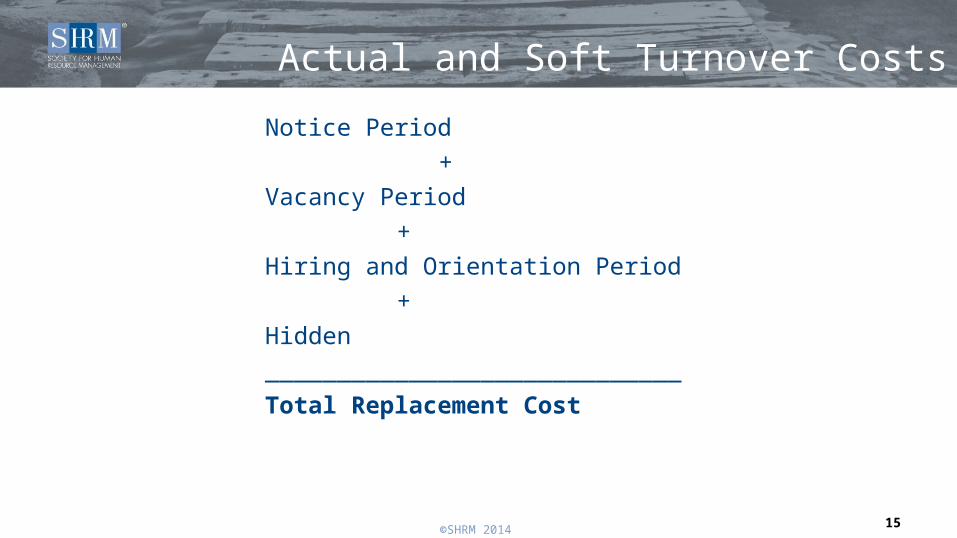
Actual and Soft Turnover Costs
Notice Period+
Vacancy Period+
Hiring and Orientation Period+
Hidden _____________________________Total Replacement Cost
©SHRM 2014 16
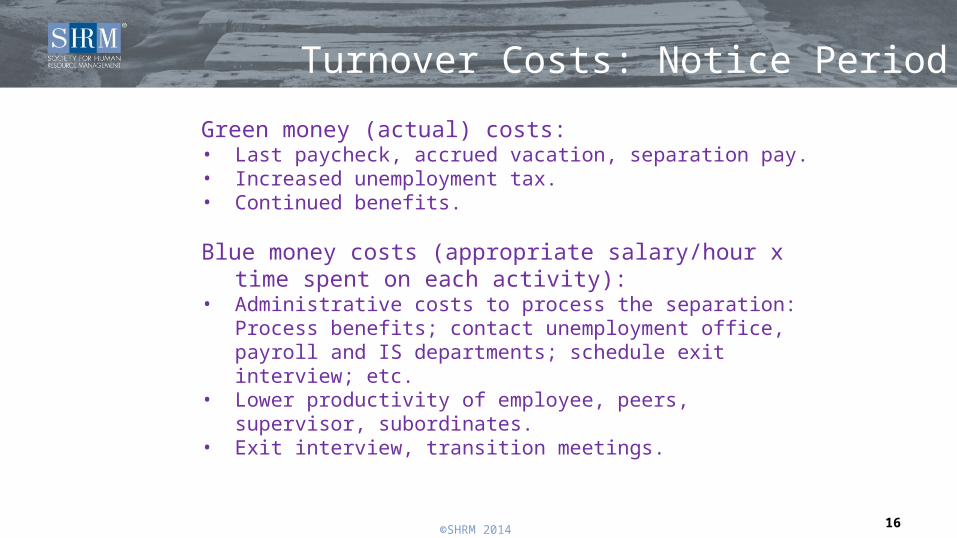
Turnover Costs: Notice Period
Green money (actual) costs:• Last paycheck, accrued vacation, separation pay.• Increased unemployment tax.• Continued benefits.
Blue money costs (appropriate salary/hour x time spent on each activity):
• Administrative costs to process the separation: Process benefits; contact unemployment office, payroll and IS departments; schedule exit interview; etc.
• Lower productivity of employee, peers, supervisor, subordinates.• Exit interview, transition meetings.
©SHRM 2014 17
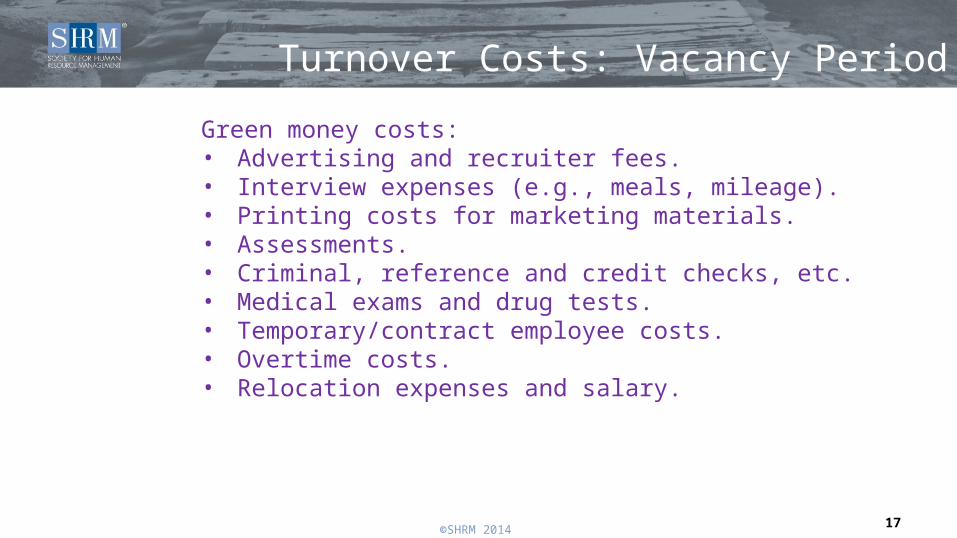
Turnover Costs: Vacancy Period
Green money costs:• Advertising and recruiter fees.• Interview expenses (e.g., meals, mileage).• Printing costs for marketing materials.• Assessments.• Criminal, reference and credit checks, etc.• Medical exams and drug tests.• Temporary/contract employee costs.• Overtime costs.• Relocation expenses and salary.
©SHRM 2014
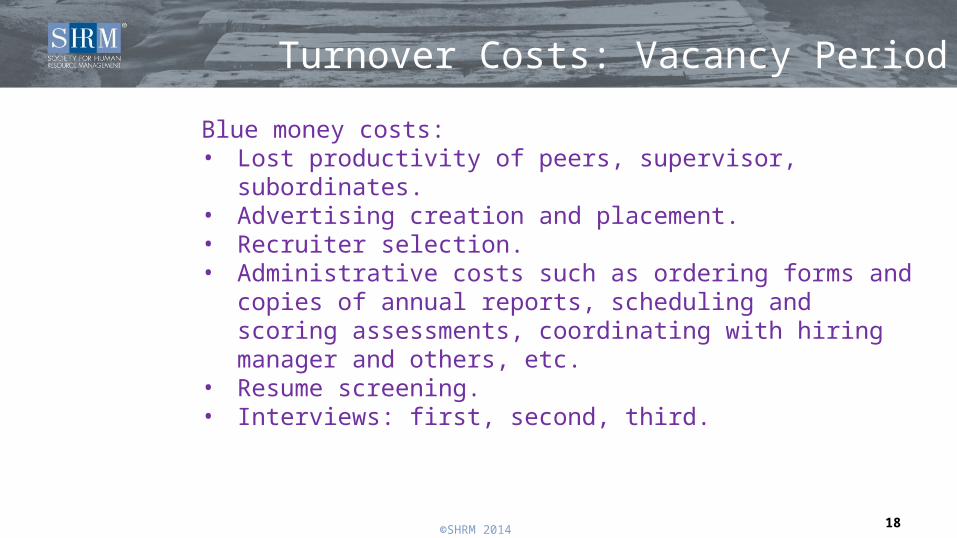
Turnover Costs: Vacancy Period
Blue money costs:• Lost productivity of peers, supervisor, subordinates.• Advertising creation and placement.• Recruiter selection.• Administrative costs such as ordering forms and copies of annual
reports, scheduling and scoring assessments, coordinating with hiring manager and others, etc.
• Resume screening.• Interviews: first, second, third.
18
©SHRM 2014 19
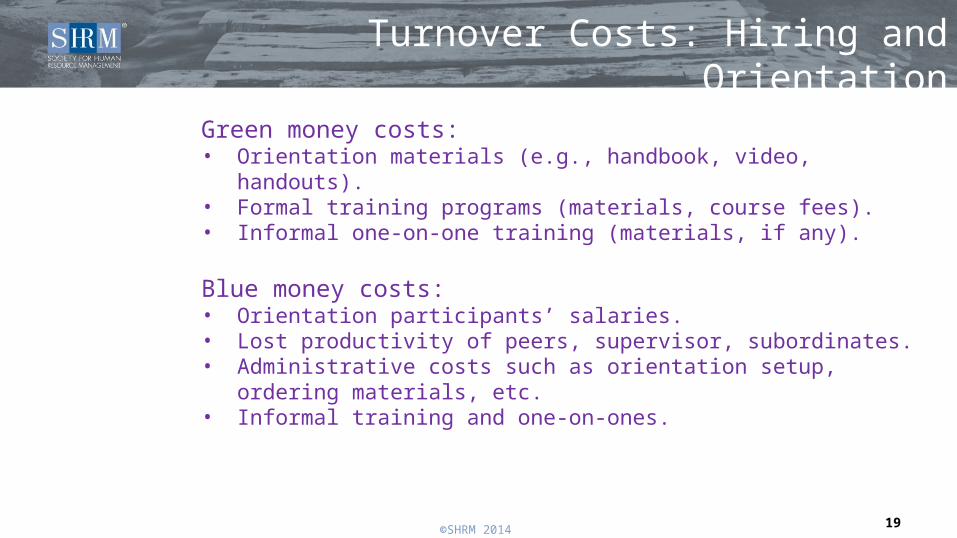
Turnover Costs: Hiring and Orientation
Green money costs:• Orientation materials (e.g., handbook, video, handouts).• Formal training programs (materials, course fees).• Informal one-on-one training (materials, if any).
Blue money costs:• Orientation participants’ salaries.• Lost productivity of peers, supervisor, subordinates.• Administrative costs such as orientation setup, ordering materials, etc.• Informal training and one-on-ones.
©SHRM 2014 20
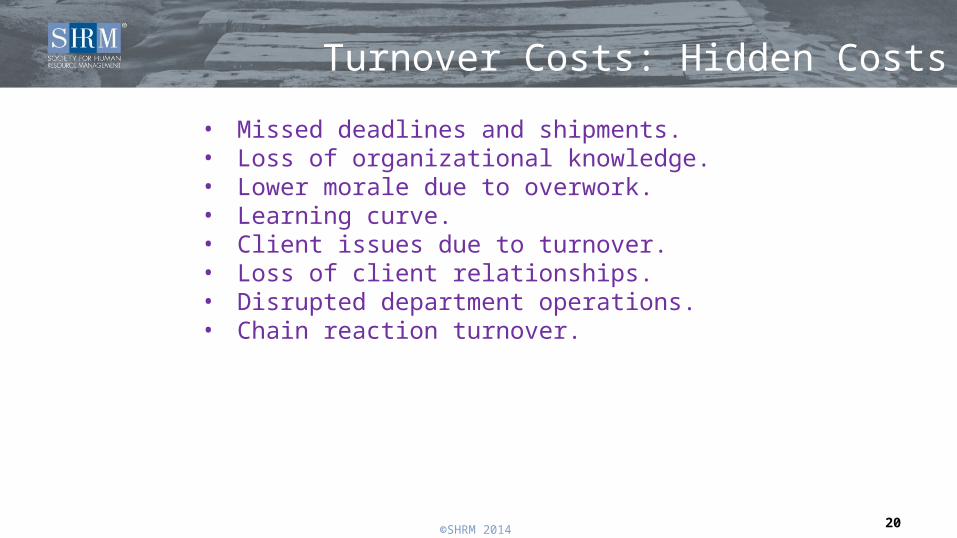
Turnover Costs: Hidden Costs
• Missed deadlines and shipments.• Loss of organizational knowledge.• Lower morale due to overwork.• Learning curve.• Client issues due to turnover.• Loss of client relationships.• Disrupted department operations.• Chain reaction turnover.
©SHRM 2014
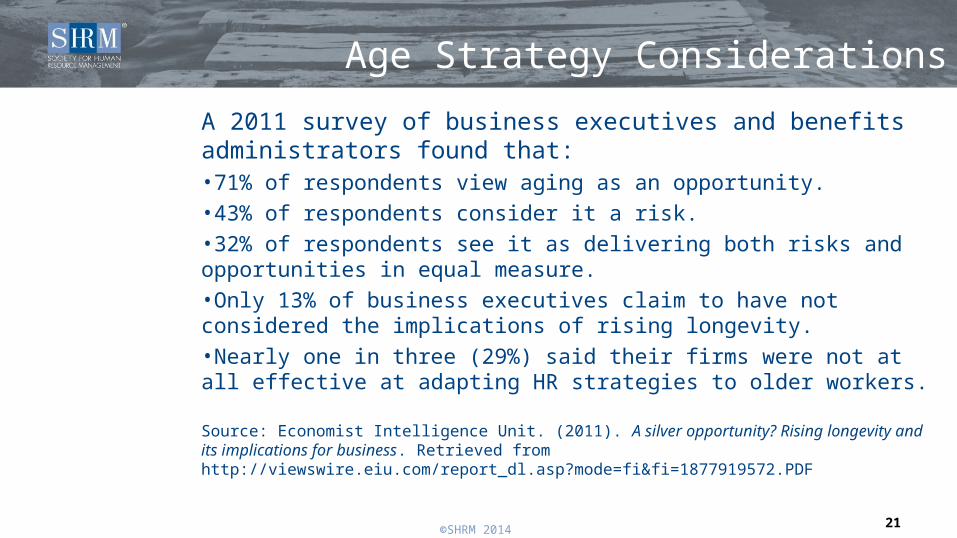
Age Strategy Considerations
A 2011 survey of business executives and benefits administrators found that: •71% of respondents view aging as an opportunity.•43% of respondents consider it a risk. •32% of respondents see it as delivering both risks and opportunities in equal measure. •Only 13% of business executives claim to have not considered the implications of rising longevity.•Nearly one in three (29%) said their firms were not at all effective at adapting HR strategies to older workers.
Source: Economist Intelligence Unit. (2011). A silver opportunity? Rising longevity and its implications for business. Retrieved from http://viewswire.eiu.com/report_dl.asp?mode=fi&fi=1877919572.PDF
21
©SHRM 2014
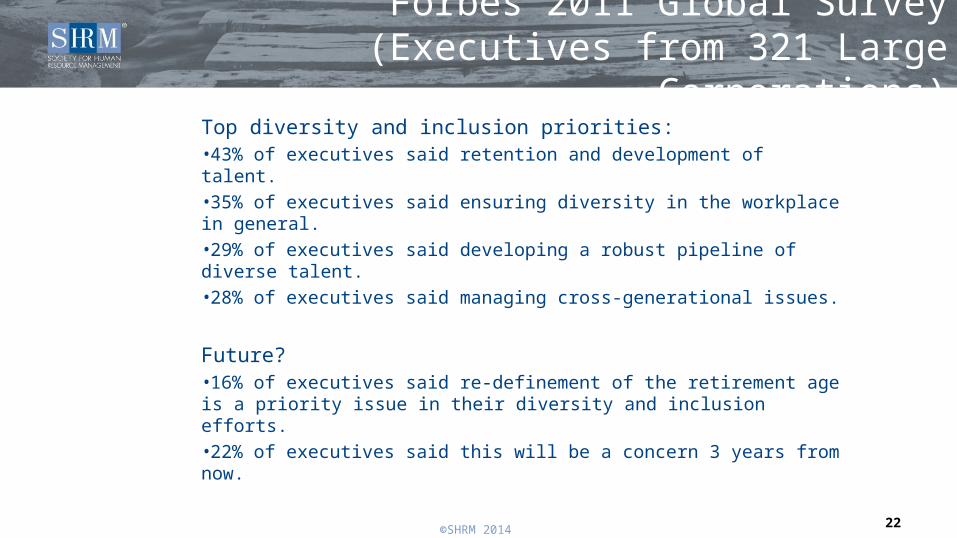
Forbes 2011 Global Survey (Executives from 321 Large Corporations)
Top diversity and inclusion priorities: •43% of executives said retention and development of talent.•35% of executives said ensuring diversity in the workplace in general.•29% of executives said developing a robust pipeline of diverse talent.•28% of executives said managing cross-generational issues.
Future?•16% of executives said re-definement of the retirement age is a priority issue in their diversity and inclusion efforts. •22% of executives said this will be a concern 3 years from now.
22
©SHRM 2014
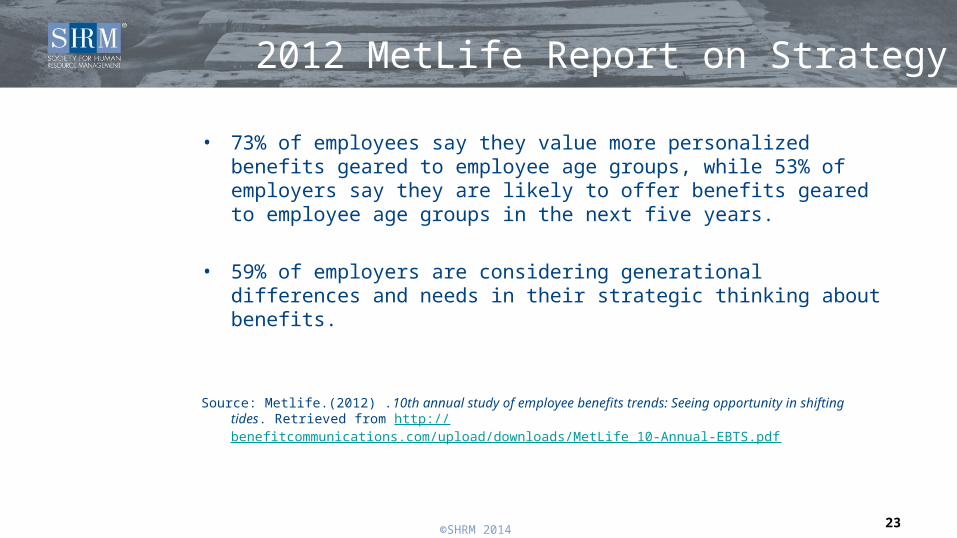
2012 MetLife Report on Strategy
• 73% of employees say they value more personalized benefits geared to employee age groups, while 53% of employers say they are likely to offer benefits geared to employee age groups in the next five years.
• 59% of employers are considering generational differences and needs in their strategic thinking about benefits.
Source: Metlife.(2012) .10th annual study of employee benefits trends: Seeing opportunity in shifting tides. Retrieved from http://benefitcommunications.com/upload/downloads/MetLife_10-Annual-EBTS.pdf
23
©SHRM 2014 24
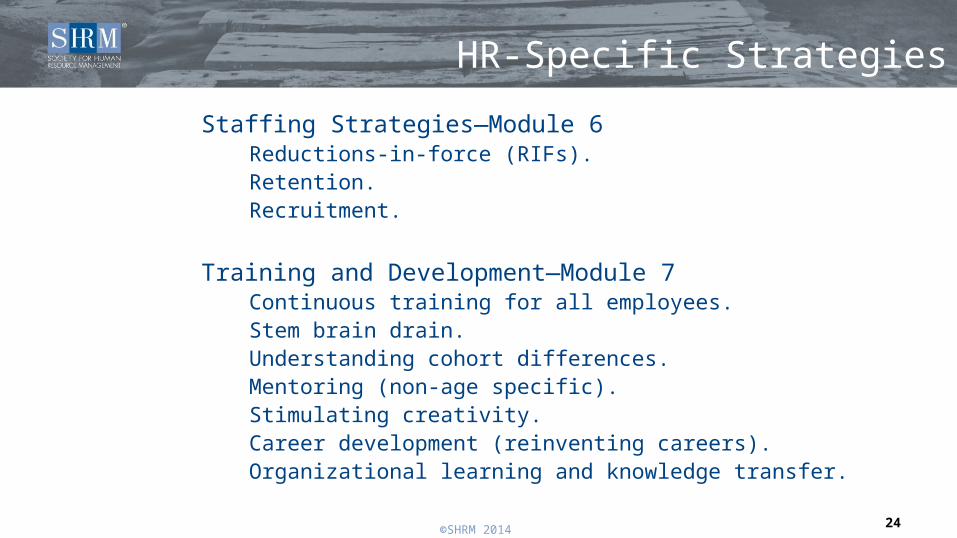
HR-Specific Strategies
Staffing Strategies—Module 6Reductions-in-force (RIFs).Retention.Recruitment.
Training and Development—Module 7 Continuous training for all employees.Stem brain drain.Understanding cohort differences.Mentoring (non-age specific).Stimulating creativity.Career development (reinventing careers).Organizational learning and knowledge transfer.
©SHRM 2014
HR-Specific Strategies (continued)Ability, Health & Performance Management—Module 8
Ability and health.Ergonomics.Safety.Job redesign/transfer.
Workplace/Hours of Work Strategies—Module 9Flextime.Reduced time (part time, part year).Flexible leave (to help meet caregiving obligations).Flex-careers (leaves, sabbaticals, rehearsal retirement).Flex-place (telecommuting, snowbird programs).
25
©SHRM 2014 26
Employer Perspective: Strategy Summary
We have covered the following topics in this module:
> Labor supply and demand pressures.> The “business case” for recruiting and retaining older workers.> Models of best practices.> Organization strategy and incorporating aging workforce
issues.> Implications for HR policies and practices.