Embed Size (px)
Citation preview
The accompanying notes form an integral part of these financial statements 1
SINGAPORE CONSORTIUM INVESTMENT MANAGEMENT LIMITED (Incorporated in Singapore) Company Registration No. 199607548K
SINGAPORE INDEX FUND
Unaudited financial statements for the half year ended 31 December 2009
SINGAPORE INDEX FUND (Constituted under a Trust Deed in the Republic of Singapore) The Board of Directors of Singapore Consortium Investment Management Limited (the “Managers”) wishes to announce the unaudited results of the Singapore Index Fund (the “Fund”) for the half year ended 31 December 2009. STATEMENT OF TOTAL RETURN For the half year ended 31 December 2009 (UNAUDITED)
Notes
For the half year ended
31 December 2009
For the half year ended
31 December 2008
$ $ Investment income Dividends 1,258,630 1,506,392 Less: Expenses Audit fee (19,671) (16,240) Bank charges (558) (552) Custody fees 10 (17,616) (14,012) Interest expense - (248) Management fees 10 (245,508) (239,425) Printing expenses (6,948) (11,352) Professional fees (3,529) (6,863) Registrar fees 10 (6,320) (42,794) Trustee fees 10 (24,682) (24,548) Miscellaneous expenses (15,622) (136) (340,454) (356,170)
Net income 918,176 1,150,222 Net gains or losses on value of investments Net realised gain/(loss) on investments 949,448 (1,754,254) Net change in fair value on investments 15,473,445 (32,262,291) Net foreign exchange (loss)/gain (21,487) 19,556 Net gains/(losses) on value of investments 16,401,406 (33,996,989) Total return/(deficit) for the period before
income tax 17,319,582 (32,846,767) Less : Income tax 3 (6,026) (8,133) Total return/(deficit) for the period 17,313,556 (32,854,900)
The accompanying notes form an integral part of these financial statements 2
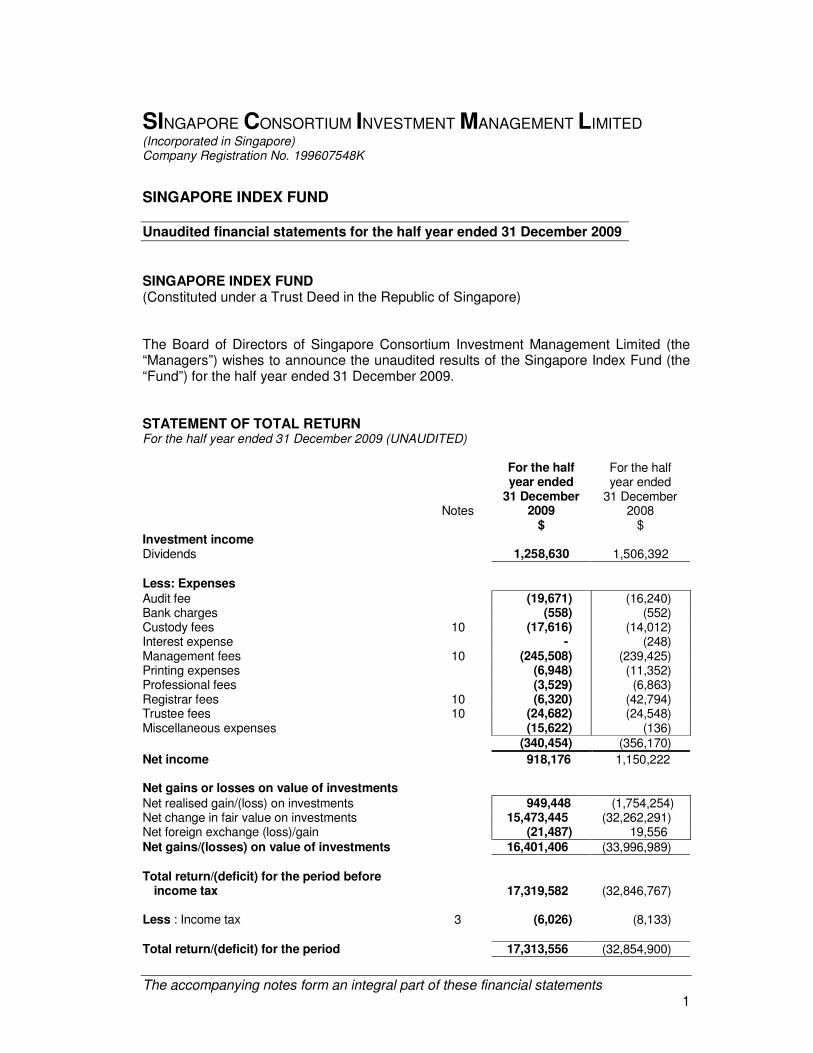
BALANCE SHEET As at 31 December 2009 (UNAUDITED)
Notes
As at 31 December
2009
As at 30 June
2009 $ $ ASSETS Portfolio of investments 84,284,938 67,427,895 Receivables 5 192,604 22,135 Cash and bank balances 1,588,894 2,478,190 Total Assets 86,066,436 69,928,220
LIABILITIES Payables 6 178,910 176,153
Net assets attributable to unitholders 7 85,887,526 69,752,067
Total Liabilities 86,066,436 69,928,220
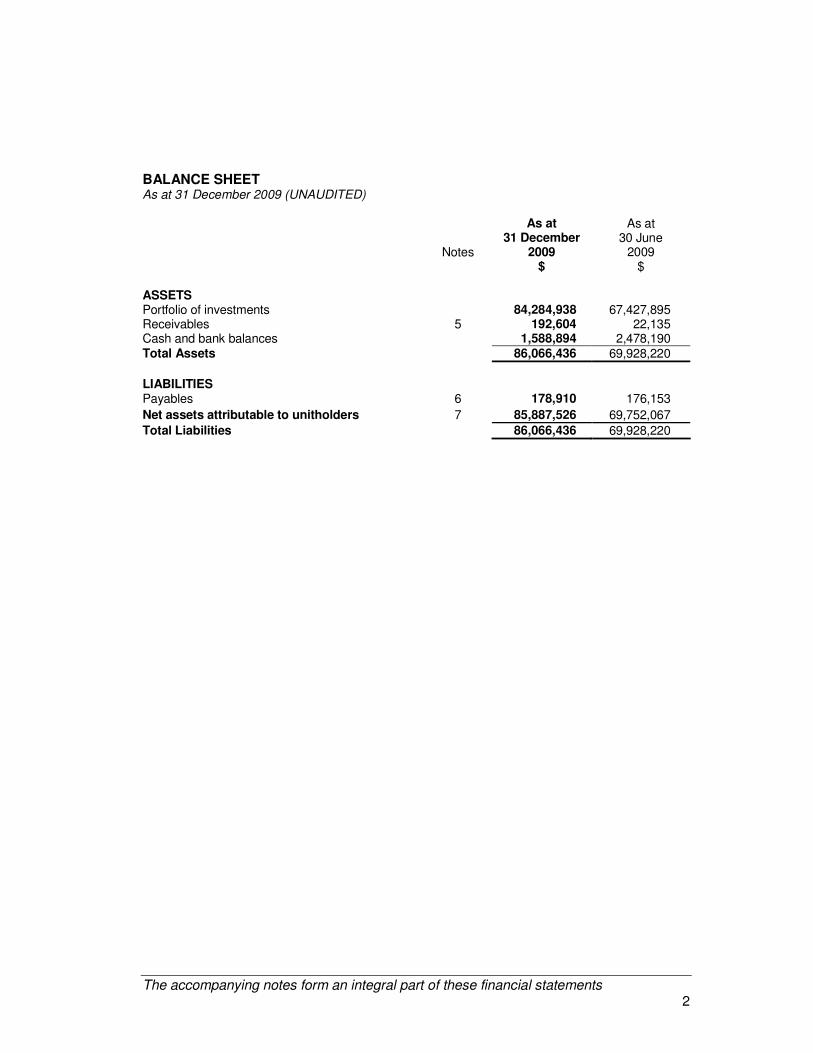
PORTFOLIO STATEMENT As at 31 December 2009 (Primary) (UNAUDITED)
The accompanying notes form an integral part of these financial statements 3
Holdings at Fair value at
Percentage of total net assets attributable to unitholders at
31 December
2009 31 December
2009 31 December
2009
$ %
By Industry (Primary)*
Quoted Equities
CONSUMER DISCRETIONARY
GENTING SINGAPORE PUBLIC LIMITED COMPANY 1,586,000 2,045,940 2.38
JARDINE CYCLE & CARRIAGE LIMITED 46,466 1,250,865 1.46
SINGAPORE PRESS HOLDINGS LIMITED 540,000 1,981,800 2.31
TOTAL 5,278,605 6.15
CONSUMER STAPLE
FRASER & NEAVE LIMITED 287,500 1,207,500 1.41
GOLDEN AGRI-RESOURCES LIMITED 3,085,632 1,558,244 1.81
OLAM INTERNATIONAL LIMITED 486,900 1,290,285 1.50
WILMAR INTERNATIONAL LIMITED 869,000 5,587,670 6.51
TOTAL 9,643,699 11.23
FINANCIALS
DBS GROUP HOLDINGS LIMITED 579,750 8,916,555 10.38
OVERSEA-CHINESE BANKING CORPORATION 830,196 7,546,482 8.79
SINGAPORE EXCHANGE LIMITED 363,500 3,024,320 3.52
UNITED OVERSEAS BANK LIMITED 391,780 7,710,230 8.98
TOTAL 27,197,587 31.67
INDUSTRIALS
COMFORTDELGRO CORPORATION LIMITED 690,000 1,124,700 1.31 COSCO CORPORATION (SINGAPORE) LIMITED 306,000 364,140 0.42
JARDINE MATHESON HOLDINGS LIMITED 83,200 3,478,561 4.05
JARDINE STRATEGIC HOLDINGS LIMITED 72,000 1,779,086 2.07
KEPPEL CORPORATION LIMITED 404,500 3,324,990 3.87 NEPTUNE ORIENT LINES LIMITED 350,750 578,738 0.67 NOBLE GROUP LIMITED 847,580 2,746,159 3.20
SEMCORP INDUSTRIES LIMITED 304,840 1,121,811 1.31
SEMCORP MARINE LIMITED 284,000 1,047,960 1.22
SIA ENGINEERING COMPANY LIMITED 71,000 235,720 0.27
SINGAPORE AIRLINES LIMITED 200,740 2,991,026 3.48
SINGAPORE TECHNOLOGIES ENGINEERING 512,500 1,660,500 1.93
SMRT CORPORATION LIMITED 200,000 382,000 0.44
TOTAL 20,835,391 24.24 *The industry classification is based upon Global Industry Classification Standard (GICS) developed by Morgan Stanley Capital International (MSCI).
PORTFOLIO STATEMENT As at 31 December 2009 (Primary) (UNAUDITED)
The accompanying notes form an integral part of these financial statements 4
Holdings at Fair value at
Percentage of total net assets attributable to unitholders at
31 December
2009 31 December
2009 31 December
2009
$ %
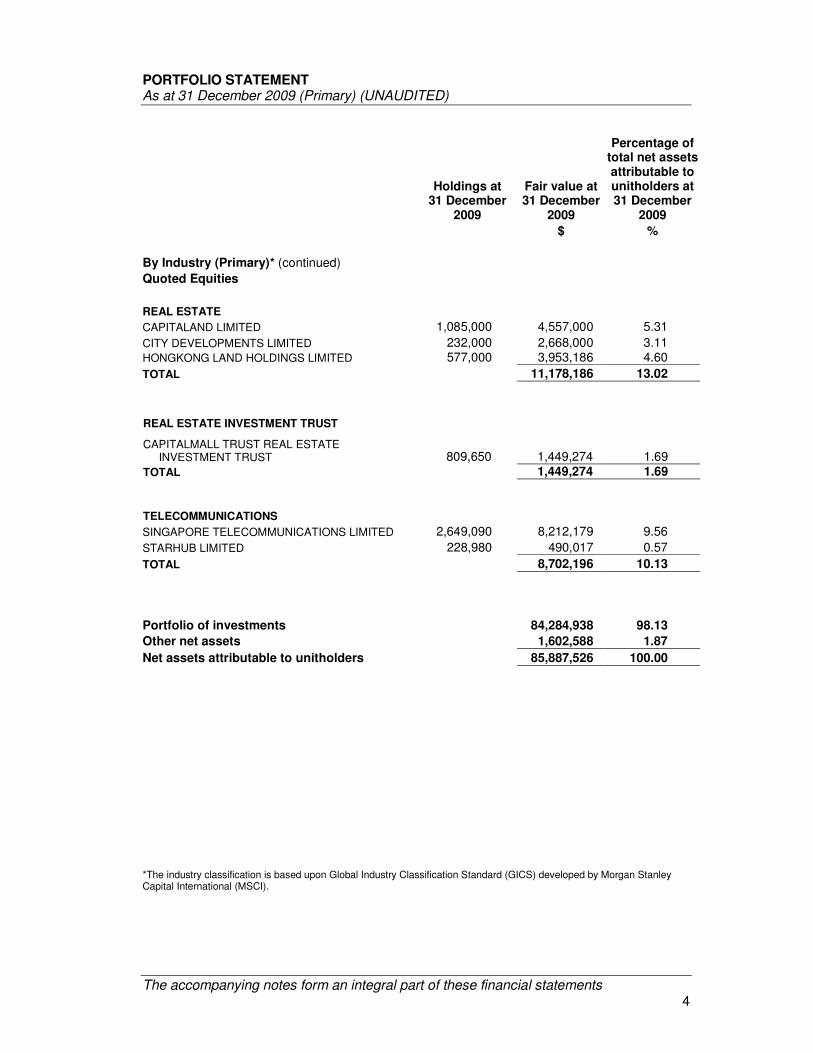
By Industry (Primary)* (continued)
Quoted Equities
REAL ESTATE
CAPITALAND LIMITED 1,085,000 4,557,000 5.31
CITY DEVELOPMENTS LIMITED 232,000 2,668,000 3.11 HONGKONG LAND HOLDINGS LIMITED 577,000 3,953,186 4.60
TOTAL 11,178,186 13.02
REAL ESTATE INVESTMENT TRUST
CAPITALMALL TRUST REAL ESTATE INVESTMENT TRUST 809,650 1,449,274 1.69 TOTAL 1,449,274 1.69
TELECOMMUNICATIONS
SINGAPORE TELECOMMUNICATIONS LIMITED 2,649,090 8,212,179 9.56
STARHUB LIMITED 228,980 490,017 0.57
TOTAL 8,702,196 10.13
Portfolio of investments 84,284,938 98.13
Other net assets 1,602,588 1.87
Net assets attributable to unitholders 85,887,526 100.00
*The industry classification is based upon Global Industry Classification Standard (GICS) developed by Morgan Stanley Capital International (MSCI).

PORTFOLIO STATEMENT As at 31 December 2009 (Primary) (UNAUDITED)
The accompanying notes form an integral part of these financial statements 5
Percentage of total net assets attributable to unitholders at
Percentage of total net assets attributable to unitholders at
31 December
2009 30 June
2009
% %
By Industry Primary (Summary) *
Quoted Equities
Consumer Discretionary 6.15 5.17
Consumer Staple 11.23 8.21
Financials 31.67 31.33
Industrials 24.24 23.58
Real Estate 13.02 13.62
Real Estate Investment Trust 1.69 1.72
Telecommunications 10.13 13.04
Portfolio of investments 98.13 96.67
Other net assets 1.87 3.33
Net assets attributable to unitholders 100.00 100.00
*The industry classification is based upon Global Industry Classification Standard (GICS) developed by Morgan Stanley Capital International (MSCI).
PORTFOLIO STATEMENT As at 31 December 2009 (Secondary) (UNAUDITED)
The accompanying notes form an integral part of these financial statements 6
Fair value at
Percentage of total net assets attributable to
unitholders
Percentage of total net assets attributable to
unitholders
31 December
2009 31 December
2009 30 June
2009
$ % %
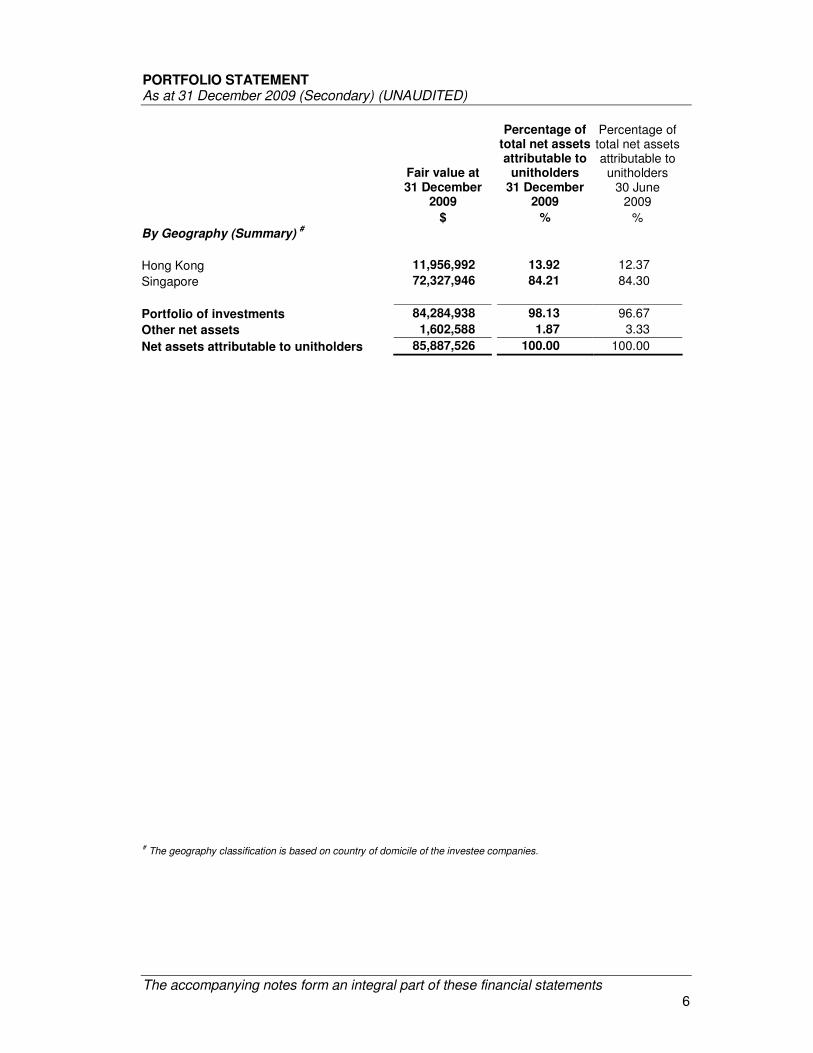
By Geography (Summary) #
Hong Kong 11,956,992 13.92 12.37
Singapore 72,327,946 84.21 84.30
Portfolio of investments 84,284,938 98.13 96.67
Other net assets 1,602,588 1.87 3.33
Net assets attributable to unitholders 85,887,526 100.00 100.00
# The geography classification is based on country of domicile of the investee companies.
NOTES TO THE FINANCIAL STATEMENTS For the half year ended 31 December 2009 (UNAUDITED)
7
These notes form an integral part of and should be read in conjunction with the accompanying financial statements 1. GENERAL Singapore Index Fund (the "Fund") is a Singapore registered trust fund constituted by a
Trust Deed dated 12 November 1996 together with its Supplemental Deeds thereon (thereafter referred to as "Trust Deed") between Singapore Consortium Investment Management Limited (the "Manager") and HSBC Institutional Trust Services (Singapore) Limited (the "Trustee"). The Trust Deed is governed by the laws of the Republic of Singapore.
The primary activity of the Fund is investment trading. The Fund's investment objective is to achieve medium to long term capital appreciation by investing in the component securities of the Straits Times Index (STI). While the Fund will aim to follow the STI as closely as possible, the Fund’s performance will not be able to exactly match the performance of the STI due to operating expenses.
2. SIGNIFICANT ACCOUNTING POLICIES (a) Basis of accounting
The financial statements have been prepared under the historical cost convention, modified by the revaluation of financial assets at fair value through profit or loss, and in accordance with the Statement of Recommended Accounting Practice 7 "Reporting Framework for Unit Trusts" ("RAP 7") issued by the Institute of Certified Public Accountants of Singapore. The financial statements are expressed in Singapore dollars.
(b) Recognition of income Dividend income is recognised when the right to receive payment is established. Interest
income is recognised on a time proportion basis using the effective interest method. (c) Investments
Investments are classified as financial assets at fair value through profit or loss. (i) Initial recognition
Purchase of investments are recognised on the trade date. Investments are recorded at fair value on initial recognition.
(ii) Subsequent measurement
Investments are subsequently carried at fair value. Net change in fair value on investments are included in the Statement of Total Return in the period in which they arise.
NOTES TO THE FINANCIAL STATEMENTS For the half year ended 31 December 2009 (UNAUDITED)
8
2. SIGNIFICANT ACCOUNTING POLICIES (continued) (c) Investments (continued)
(iii) Derecognition Investments are derecognised on the trade date of disposal. The resultant realised
gains and losses on the sale of investments are computed on the basis of the difference between the weighted average carrying amount and selling price net of transaction costs, and are taken up in the Statement of Total Return.
(d) Basis of valuation of investments
The fair value of financial instruments traded in active markets is based on quoted market prices at the balance sheet date. The quoted market price for these investments held by the Fund is the current market quoted bid price.
(e) Foreign currency translation
(i) Functional and presentation currency
The Fund operates from Singapore with the subscriptions and redemptions of the units denominated in Singapore dollars. The performance of the Fund is measured and reported to the investors in Singapore dollars. The Manager considers the Singapore dollars as the currency of the primary economic environment in which the Fund operates. The financial statements are presented in Singapore dollar, which is the Fund’s functional and presentation currency.
(ii) Transactions and balances Foreign currency transactions are translated into the functional currency using the
exchange rates prevailing at the dates of the transactions. Foreign exchange gains and losses resulting from the settlement of such transactions and from the translation at period-end exchange rates of monetary assets and liabilities denominated in foreign currencies are recognised in the Statement of Total Return. Non-monetary items that are measured at fair values in foreign currencies are translated using the exchange rates at the date when the fair values are determined. Currency translation differences on non-monetary items classified as financial assets at fair value through profit and loss are reported as part of the fair value gains or losses in the Statement of Total Return.
(f) Expenses charged to the Fund
All direct expenses relating to the Fund are charged directly to the Statement of Total Return. In addition, certain expenses shared by all unit trusts managed by the Manager are allocated to each fund based on the respective fund's net asset values.
NOTES TO THE FINANCIAL STATEMENTS For the half year ended 31 December 2009 (UNAUDITED)
9
2. SIGNIFICANT ACCOUNTING POLICIES (continued)
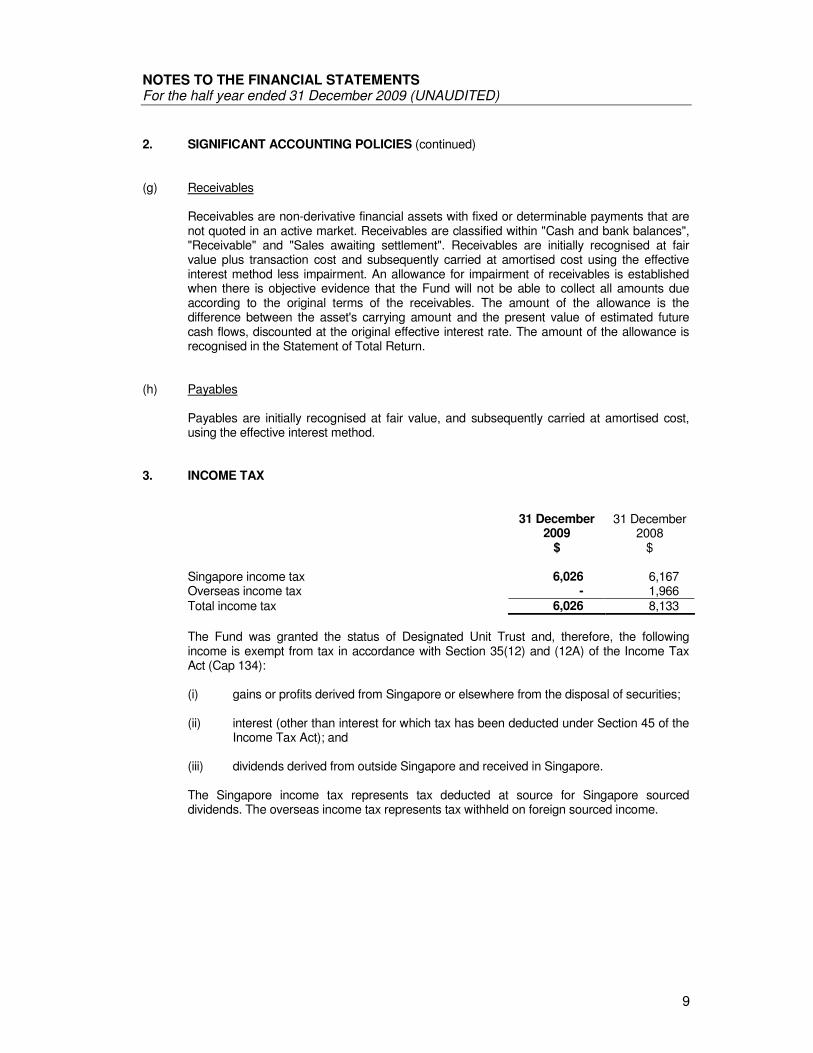
(g) Receivables
Receivables are non-derivative financial assets with fixed or determinable payments that are not quoted in an active market. Receivables are classified within "Cash and bank balances", "Receivable" and "Sales awaiting settlement". Receivables are initially recognised at fair value plus transaction cost and subsequently carried at amortised cost using the effective interest method less impairment. An allowance for impairment of receivables is established when there is objective evidence that the Fund will not be able to collect all amounts due according to the original terms of the receivables. The amount of the allowance is the difference between the asset's carrying amount and the present value of estimated future cash flows, discounted at the original effective interest rate. The amount of the allowance is recognised in the Statement of Total Return.
(h) Payables
Payables are initially recognised at fair value, and subsequently carried at amortised cost, using the effective interest method.
3. INCOME TAX 31 December
2009 $
31 December 2008
$ Singapore income tax 6,026 6,167 Overseas income tax - 1,966 Total income tax 6,026 8,133
The Fund was granted the status of Designated Unit Trust and, therefore, the following
income is exempt from tax in accordance with Section 35(12) and (12A) of the Income Tax Act (Cap 134):
(i) gains or profits derived from Singapore or elsewhere from the disposal of securities; (ii) interest (other than interest for which tax has been deducted under Section 45 of the
Income Tax Act); and
(iii) dividends derived from outside Singapore and received in Singapore. The Singapore income tax represents tax deducted at source for Singapore sourced
dividends. The overseas income tax represents tax withheld on foreign sourced income.
NOTES TO THE FINANCIAL STATEMENTS For the half year ended 31 December 2009 (UNAUDITED)
10
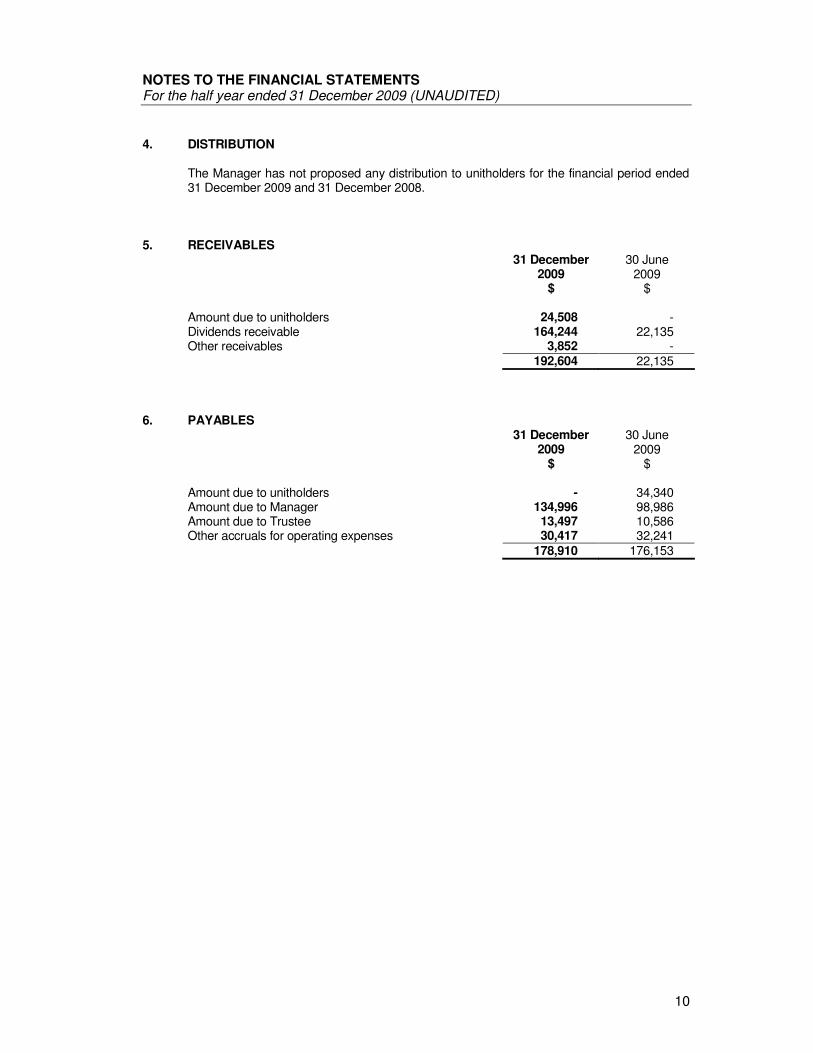
4. DISTRIBUTION The Manager has not proposed any distribution to unitholders for the financial period ended
31 December 2009 and 31 December 2008. 5. RECEIVABLES 31 December
2009 30 June
2009 $ $ Amount due to unitholders 24,508 - Dividends receivable 164,244 22,135 Other receivables 3,852 - 192,604 22,135
6. PAYABLES 31 December
2009 30 June
2009 $ $ Amount due to unitholders - 34,340 Amount due to Manager 134,996 98,986 Amount due to Trustee 13,497 10,586 Other accruals for operating expenses 30,417 32,241 178,910 176,153
NOTES TO THE FINANCIAL STATEMENTS For the half year ended 31 December 2009 (UNAUDITED)
11
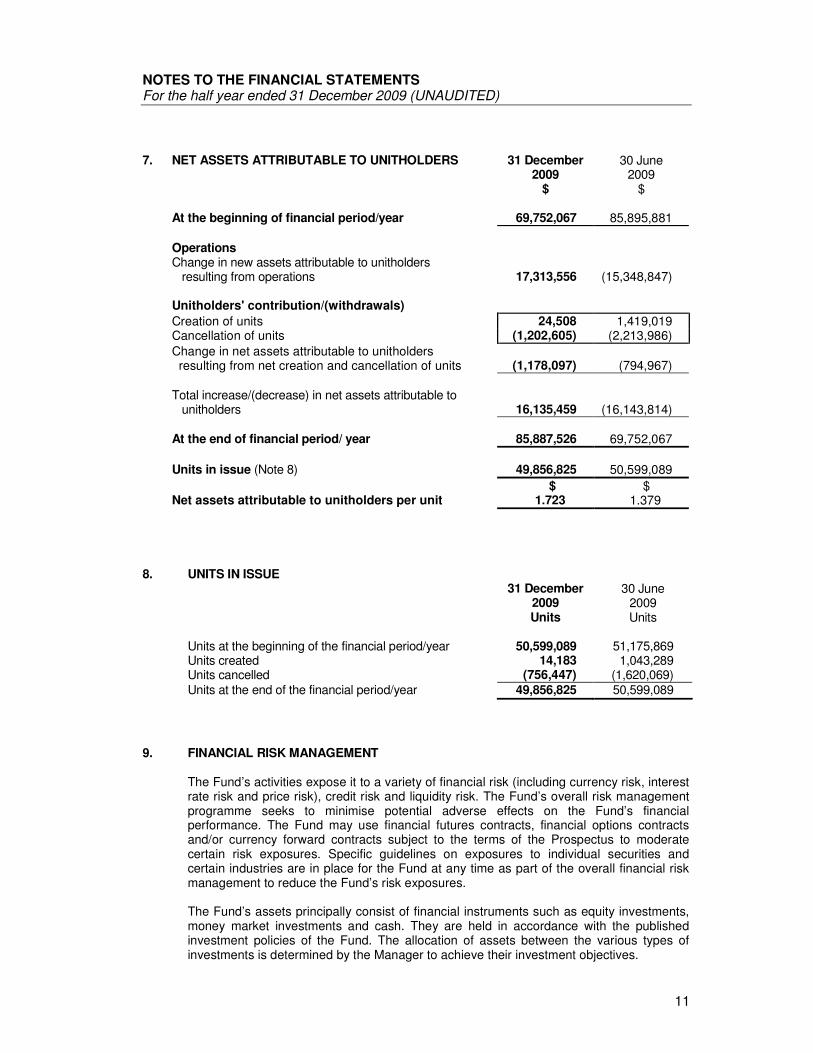
7. NET ASSETS ATTRIBUTABLE TO UNITHOLDERS 31 December
2009 $
30 June 2009
$ At the beginning of financial period/year 69,752,067 85,895,881
Operations Change in new assets attributable to unitholders
resulting from operations
17,313,556
(15,348,847) Unitholders' contribution/(withdrawals)
Creation of units 24,508 1,419,019 Cancellation of units (1,202,605) (2,213,986)
Change in net assets attributable to unitholders resulting from net creation and cancellation of units
(1,178,097) (794,967)
Total increase/(decrease) in net assets attributable to
unitholders
16,135,459
(16,143,814) At the end of financial period/ year 85,887,526 69,752,067
Units in issue (Note 8) 49,856,825 50,599,089
$ $ Net assets attributable to unitholders per unit 1.723 1.379
8. UNITS IN ISSUE 31 December
2009 30 June
2009 Units Units Units at the beginning of the financial period/year 50,599,089 51,175,869 Units created 14,183 1,043,289 Units cancelled (756,447) (1,620,069) Units at the end of the financial period/year 49,856,825 50,599,089
9. FINANCIAL RISK MANAGEMENT
The Fund’s activities expose it to a variety of financial risk (including currency risk, interest rate risk and price risk), credit risk and liquidity risk. The Fund’s overall risk management programme seeks to minimise potential adverse effects on the Fund’s financial performance. The Fund may use financial futures contracts, financial options contracts and/or currency forward contracts subject to the terms of the Prospectus to moderate certain risk exposures. Specific guidelines on exposures to individual securities and certain industries are in place for the Fund at any time as part of the overall financial risk management to reduce the Fund’s risk exposures. The Fund’s assets principally consist of financial instruments such as equity investments, money market investments and cash. They are held in accordance with the published investment policies of the Fund. The allocation of assets between the various types of investments is determined by the Manager to achieve their investment objectives.
NOTES TO THE FINANCIAL STATEMENTS For the half year ended 31 December 2009 (UNAUDITED)
12
9. FINANCIAL RISK MANAGEMENT (continued)
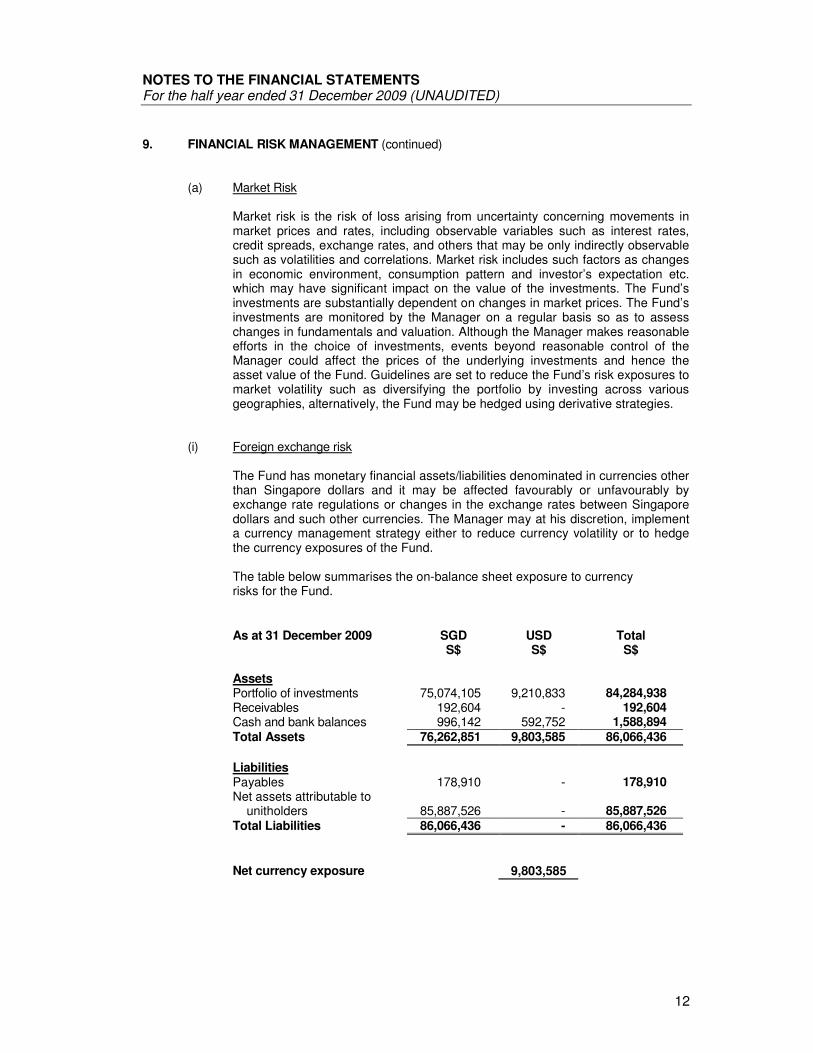
(a) Market Risk
Market risk is the risk of loss arising from uncertainty concerning movements in market prices and rates, including observable variables such as interest rates, credit spreads, exchange rates, and others that may be only indirectly observable such as volatilities and correlations. Market risk includes such factors as changes in economic environment, consumption pattern and investor’s expectation etc. which may have significant impact on the value of the investments. The Fund’s investments are substantially dependent on changes in market prices. The Fund’s investments are monitored by the Manager on a regular basis so as to assess changes in fundamentals and valuation. Although the Manager makes reasonable efforts in the choice of investments, events beyond reasonable control of the Manager could affect the prices of the underlying investments and hence the asset value of the Fund. Guidelines are set to reduce the Fund’s risk exposures to market volatility such as diversifying the portfolio by investing across various geographies, alternatively, the Fund may be hedged using derivative strategies.
(i) Foreign exchange risk
The Fund has monetary financial assets/liabilities denominated in currencies other than Singapore dollars and it may be affected favourably or unfavourably by exchange rate regulations or changes in the exchange rates between Singapore dollars and such other currencies. The Manager may at his discretion, implement a currency management strategy either to reduce currency volatility or to hedge the currency exposures of the Fund. The table below summarises the on-balance sheet exposure to currency risks for the Fund.
As at 31 December 2009 SGD USD Total S$ S$ S$ Assets Portfolio of investments 75,074,105 9,210,833 84,284,938 Receivables 192,604 - 192,604 Cash and bank balances 996,142 592,752 1,588,894 Total Assets 76,262,851 9,803,585 86,066,436
Liabilities Payables 178,910 - 178,910 Net assets attributable to unitholders
85,887,526
-
85,887,526
Total Liabilities 86,066,436 - 86,066,436
Net currency exposure
9,803,585
NOTES TO THE FINANCIAL STATEMENTS For the half year ended 31 December 2009 (UNAUDITED)
13
9. FINANCIAL RISK MANAGEMENT (continued)
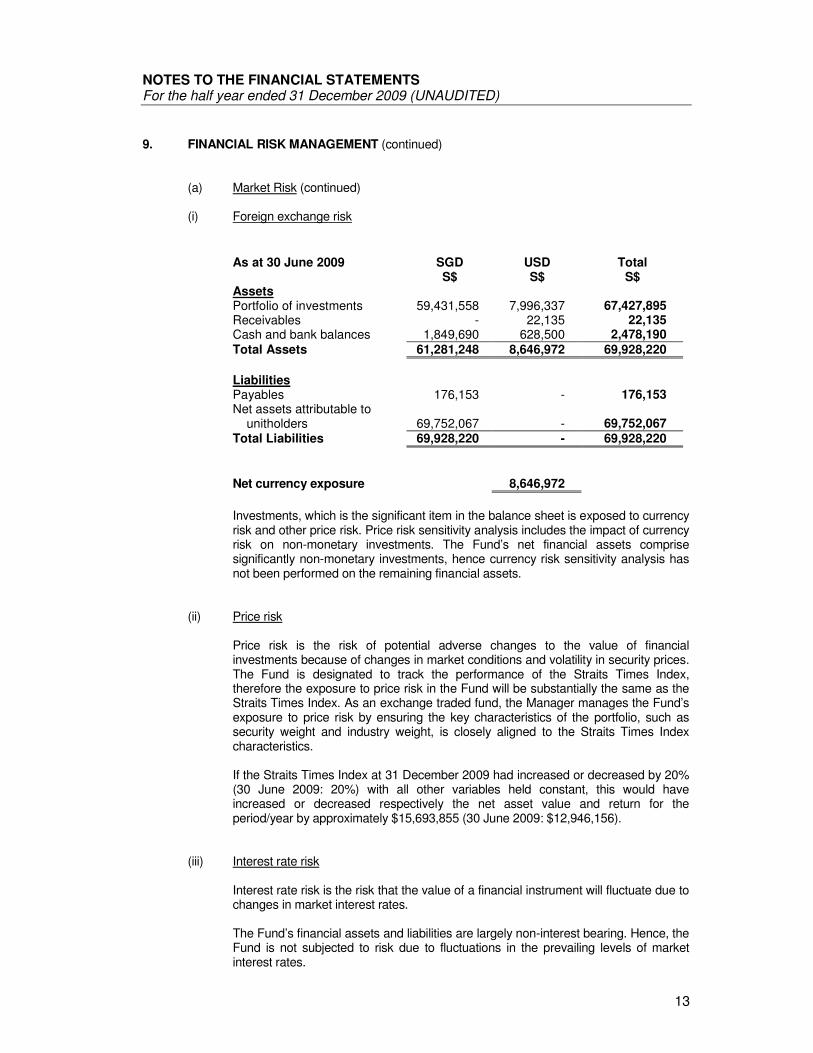
(a) Market Risk (continued) (i) Foreign exchange risk
As at 30 June 2009 SGD USD Total S$ S$ S$ Assets Portfolio of investments 59,431,558 7,996,337 67,427,895 Receivables - 22,135 22,135 Cash and bank balances 1,849,690 628,500 2,478,190 Total Assets 61,281,248 8,646,972 69,928,220
Liabilities Payables 176,153 - 176,153 Net assets attributable to unitholders 69,752,067 - 69,752,067 Total Liabilities 69,928,220 - 69,928,220
Net currency exposure
8,646,972
Investments, which is the significant item in the balance sheet is exposed to currency risk and other price risk. Price risk sensitivity analysis includes the impact of currency risk on non-monetary investments. The Fund’s net financial assets comprise significantly non-monetary investments, hence currency risk sensitivity analysis has not been performed on the remaining financial assets.
(ii) Price risk
Price risk is the risk of potential adverse changes to the value of financial investments because of changes in market conditions and volatility in security prices. The Fund is designated to track the performance of the Straits Times Index, therefore the exposure to price risk in the Fund will be substantially the same as the Straits Times Index. As an exchange traded fund, the Manager manages the Fund’s exposure to price risk by ensuring the key characteristics of the portfolio, such as security weight and industry weight, is closely aligned to the Straits Times Index characteristics. If the Straits Times Index at 31 December 2009 had increased or decreased by 20% (30 June 2009: 20%) with all other variables held constant, this would have increased or decreased respectively the net asset value and return for the period/year by approximately $15,693,855 (30 June 2009: $12,946,156).
(iii) Interest rate risk
Interest rate risk is the risk that the value of a financial instrument will fluctuate due to changes in market interest rates.
The Fund’s financial assets and liabilities are largely non-interest bearing. Hence, the Fund is not subjected to risk due to fluctuations in the prevailing levels of market interest rates.
NOTES TO THE FINANCIAL STATEMENTS For the half year ended 31 December 2009 (UNAUDITED)
14
9. FINANCIAL RISK MANAGEMENT (continued)
(b) Liquidity risk
The Fund is exposed to daily cash redemptions and disbursements for the settlements of purchases. The Manager therefore ensures that the Fund maintains sufficient cash and cash equivalents and that it is able to obtain cash from the sale of investments held to meet its liquidity requirements. Reasonable efforts will be taken to invest in securities which are traded in a relatively active market and which can be readily disposed of. The Fund’s investments in listed securities are considered to be readily realisable as they are listed on established regional Stock Exchange.
The Manager may from time to time employ derivatives to implement a portfolio strategy to reduce risk or for the purpose of efficient portfolio management. Market liquidity of complex derivatives are significantly less than traditional investment instruments and such positions may therefore require a longer time to reverse than what would be typically expected for traditional investment instruments. No such investments were held at the balance sheet date. The maturity profile of payables and net assets attributable to unitholders based on undiscounted cash flows is less than 1 year (30 June 2009: less than 1 year). The units are redeemable on demand at the holder's option subject to teams and conditions for redemption.
(c) Credit risk
The Fund takes on exposure to credit risk, which is the risk that a counterparty will be unable to pay amounts in full when due. The Fund’s credit risk is concentrated on cash and bank balances, and amounts or securities receivable on the sale and purchase of investments respectively. In order to mitigate exposure to credit risk, all transactions in listed securities are settled/paid for upon delivery and transacted with approved counterparties using an approved list of brokers that are regularly assessed and updated by the Manager. As the Fund does not hold any collateral, the maximum exposure to credit risk for each class of financial instruments is the carrying amount of that class of financial instruments presented on the balance sheet. The Fund’s financial assets are neither past due nor impaired, representing cash and bank balances and receivables. Bank deposits and all the investments are held with a bank and a custodian respectively, that are part of a HSBC Group with a credit rating assigned by Moody’s at 31 December 2009 is B+ (30 June 2009: B+). Receivables are substantially from companies with good collection track record with the Fund.
(d) Capital management
The Fund’s capital is represented by the net assets attributable to unitholders as the fund does not have any gearing. The Fund strives to invest the subscriptions of redeemable participating units in investments that meet the Fund’s investment objectives.
NOTES TO THE FINANCIAL STATEMENTS For the half year ended 31 December 2009 (UNAUDITED)
15
10. RELATED PARTY TRANSACTIONS
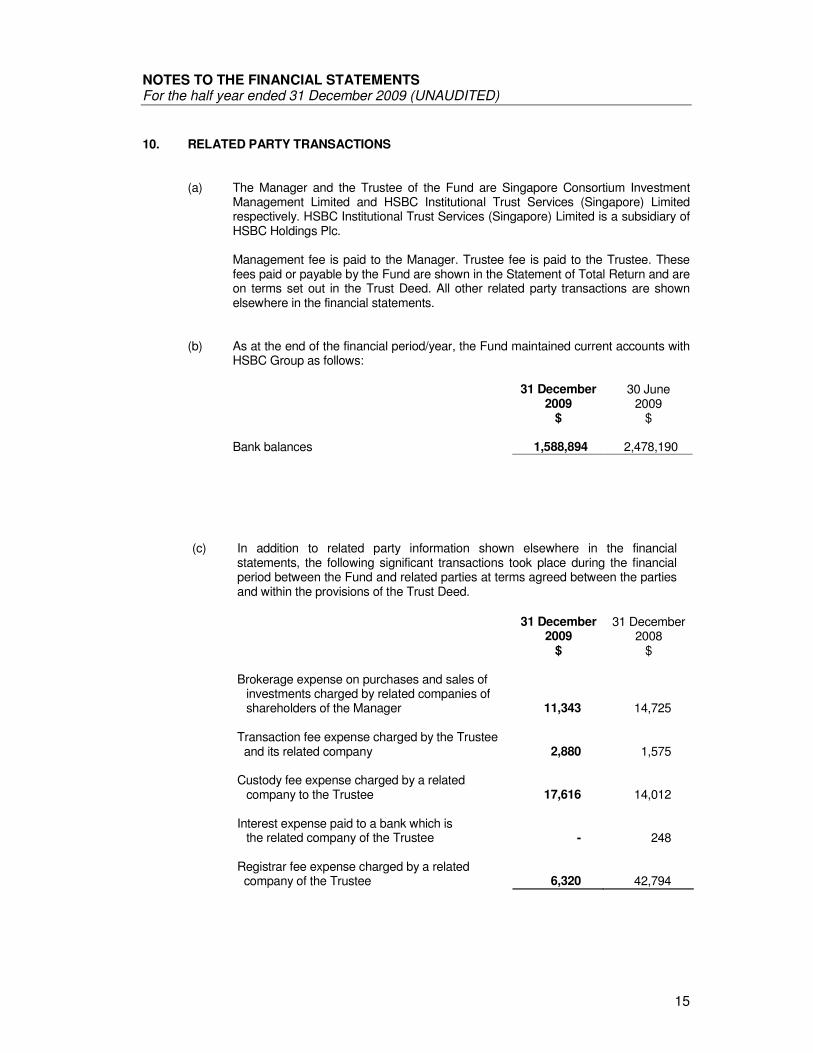
(a) The Manager and the Trustee of the Fund are Singapore Consortium Investment Management Limited and HSBC Institutional Trust Services (Singapore) Limited respectively. HSBC Institutional Trust Services (Singapore) Limited is a subsidiary of HSBC Holdings Plc.
Management fee is paid to the Manager. Trustee fee is paid to the Trustee. These fees paid or payable by the Fund are shown in the Statement of Total Return and are on terms set out in the Trust Deed. All other related party transactions are shown elsewhere in the financial statements.
(b) As at the end of the financial period/year, the Fund maintained current accounts with
HSBC Group as follows:
31 December
2009 30 June
2009 $ $ Bank balances 1,588,894 2,478,190
(c) In addition to related party information shown elsewhere in the financial statements, the following significant transactions took place during the financial period between the Fund and related parties at terms agreed between the parties and within the provisions of the Trust Deed.
31 December
2009 31 December
2008 $ $
Brokerage expense on purchases and sales of investments charged by related companies of shareholders of the Manager 11,343 14,725
Transaction fee expense charged by the Trustee and its related company 2,880 1,575
Custody fee expense charged by a related company to the Trustee 17,616 14,012
Interest expense paid to a bank which is the related company of the Trustee - 248
Registrar fee expense charged by a related company of the Trustee 6,320 42,794
NOTES TO THE FINANCIAL STATEMENTS For the half year ended 31 December 2009 (UNAUDITED)
16
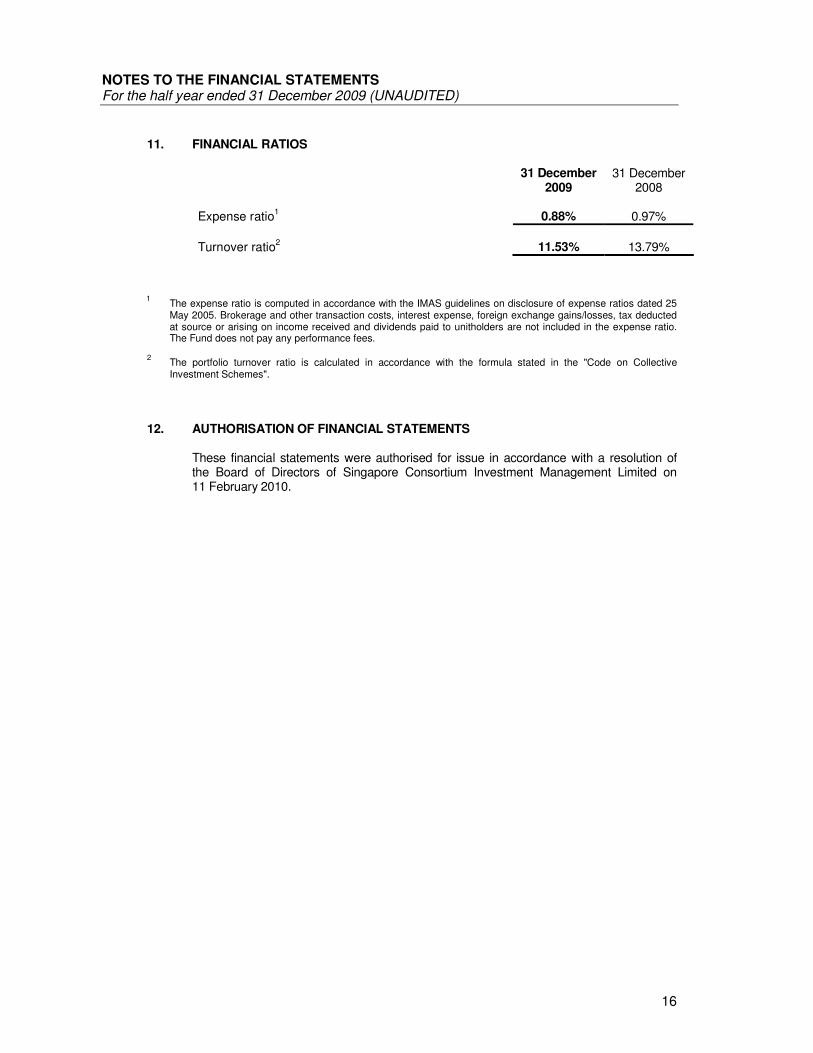
11. FINANCIAL RATIOS
31 December 2009
31 December 2008
Expense ratio
1 0.88% 0.97%
Turnover ratio
2 11.53% 13.79%
1 The expense ratio is computed in accordance with the IMAS guidelines on disclosure of expense ratios dated 25
May 2005. Brokerage and other transaction costs, interest expense, foreign exchange gains/losses, tax deducted at source or arising on income received and dividends paid to unitholders are not included in the expense ratio. The Fund does not pay any performance fees.
2 The portfolio turnover ratio is calculated in accordance with the formula stated in the "Code on Collective
Investment Schemes".
12. AUTHORISATION OF FINANCIAL STATEMENTS
These financial statements were authorised for issue in accordance with a resolution of the Board of Directors of Singapore Consortium Investment Management Limited on 11 February 2010.
17
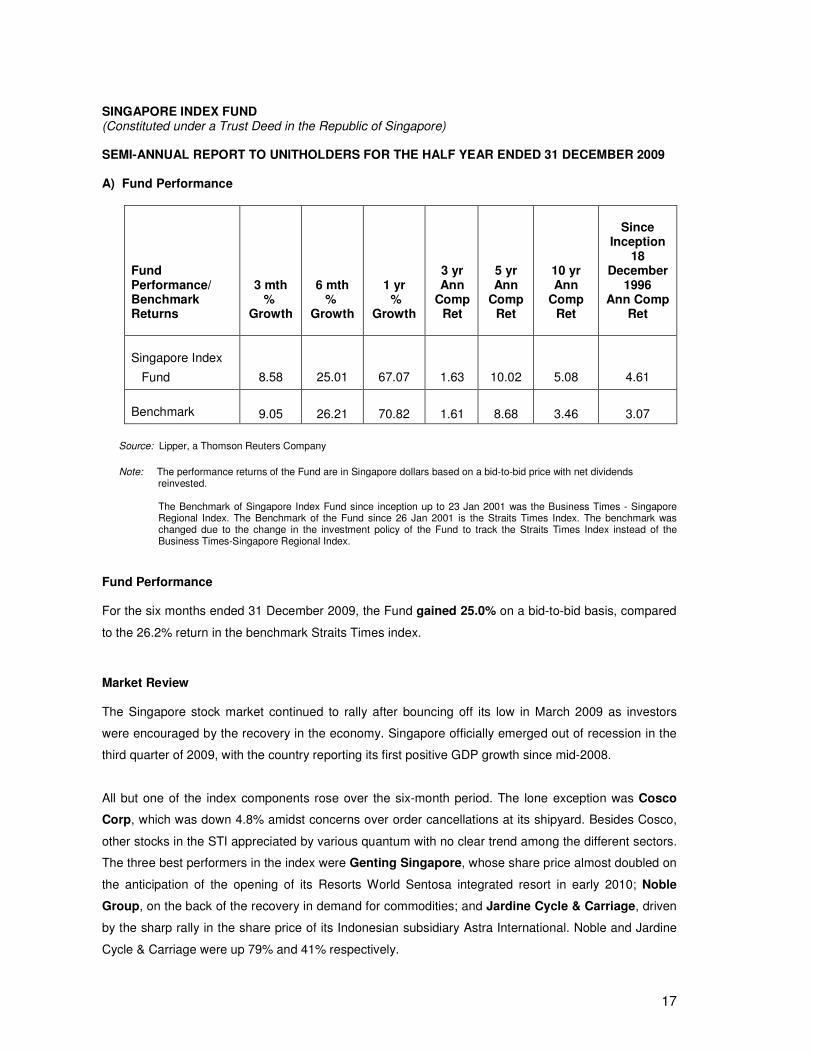
SINGAPORE INDEX FUND (Constituted under a Trust Deed in the Republic of Singapore) SEMI-ANNUAL REPORT TO UNITHOLDERS FOR THE HALF YEAR ENDED 31 DECEMBER 2009 A) Fund Performance
Fund Performance/ Benchmark Returns
3 mth %
Growth
6 mth %
Growth
1 yr %
Growth
3 yr Ann
Comp Ret
5 yr Ann
Comp Ret
10 yr Ann
Comp Ret
Since
Inception 18
December 1996
Ann Comp Ret
Singapore Index
Fund
8.58
25.01
67.07
1.63
10.02
5.08
4.61
Benchmark
9.05
26.21
70.82
1.61
8.68
3.46
3.07
Source: Lipper, a Thomson Reuters Company
Note: The performance returns of the Fund are in Singapore dollars based on a bid-to-bid price with net dividends reinvested.
The Benchmark of Singapore Index Fund since inception up to 23 Jan 2001 was the Business Times - Singapore Regional Index. The Benchmark of the Fund since 26 Jan 2001 is the Straits Times Index. The benchmark was changed due to the change in the investment policy of the Fund to track the Straits Times Index instead of the Business Times-Singapore Regional Index.
Fund Performance For the six months ended 31 December 2009, the Fund gained 25.0% on a bid-to-bid basis, compared
to the 26.2% return in the benchmark Straits Times index.
Market Review The Singapore stock market continued to rally after bouncing off its low in March 2009 as investors
were encouraged by the recovery in the economy. Singapore officially emerged out of recession in the
third quarter of 2009, with the country reporting its first positive GDP growth since mid-2008.
All but one of the index components rose over the six-month period. The lone exception was Cosco
Corp, which was down 4.8% amidst concerns over order cancellations at its shipyard. Besides Cosco,
other stocks in the STI appreciated by various quantum with no clear trend among the different sectors.
The three best performers in the index were Genting Singapore, whose share price almost doubled on
the anticipation of the opening of its Resorts World Sentosa integrated resort in early 2010; Noble
Group, on the back of the recovery in demand for commodities; and Jardine Cycle & Carriage, driven
by the sharp rally in the share price of its Indonesian subsidiary Astra International. Noble and Jardine
Cycle & Carriage were up 79% and 41% respectively.
18
Still, as much as investors were optimistic on the outlook for commodities, Olam International, the
other commodity play in the index, gained less than 10% to end as one of the laggards in the index.
Similarly, property stocks saw disparate performances. After a strong recovery in the physical property
market, the government imposed cooling measures such as removing the deferred payment scheme,
disallowing interest only mortgages and increasing the supply of land through its government land sale
programme. The moves jolted investors’ confidence on property companies. As a result, Fraser &
Neave and CapitaLand, which gained 8% and 13% respectively, were among the worst performers.
On the other hand, City Developments, another major property company, saw its share price
appreciate 35% amidst expectation of a recovery in the rental rate of its office property portfolio.
Telecom stocks underperformed the index with StarHub and Singapore Telecom gaining 0.5% and
4% respectively. The market was generally disinterested in the lack of growth in the telecom sector, but
was also concerned about the heated competition for content between the two telcos’ pay TV business.
In October, SingTel won the exclusive right to broadcast the English Premier League, which was one of
the most popular contents among StarHub’s subscribers. StarHub was subsequently sold off on
concerns over the possible exodus of its pay TV subscribers to SingTel.
On the economic front, although the Singapore government raised its GDP forecast from 4% to 6%
contraction for 2009 to between 2% and 2.5%, it was still worried enough on the prospects for 2010 to
extend its wage subsidy programme that was due to expire by the end of the year for another 6 months.
It projected economic growth of between 3% and 5% for 2010.
Market Outlook
The current cyclical bull market is past its 40th week and appears to be in a relative early stage
compared to the average 101 weeks seen in previous bull markets when Singapore emerged from
recessions. However, in terms of the returns from trough, the 99% gain from the March 2009 bottom
has already exceeded the average 88% 12-month returns from the trough seen in past bull markets. As
such, the market can be vulnerable to corrections given the sharp rebound of the market. The
continuing economic recovery and loose monetary policy should however provide downside support.
Valuations are no longer cheap but they are not expensive either. From a top-down perspective, based
on the long-term mean P/B of 1.75x, we see the FSSTI reaching 3,100 on mid-2010 book. Our bottom-
up approach derives an FSSTI fair value of 3,000. Although we do not expect the Fed to hike its policy
rate until well into 2010, one key risk to the market is the potential tightening by the Monetary Authority
of Singapore (MAS) in April 2010. Past tightening episodes have seen the FSSTI declining by 6% in
three months and 13% in six months following a tightening by the MAS.
19
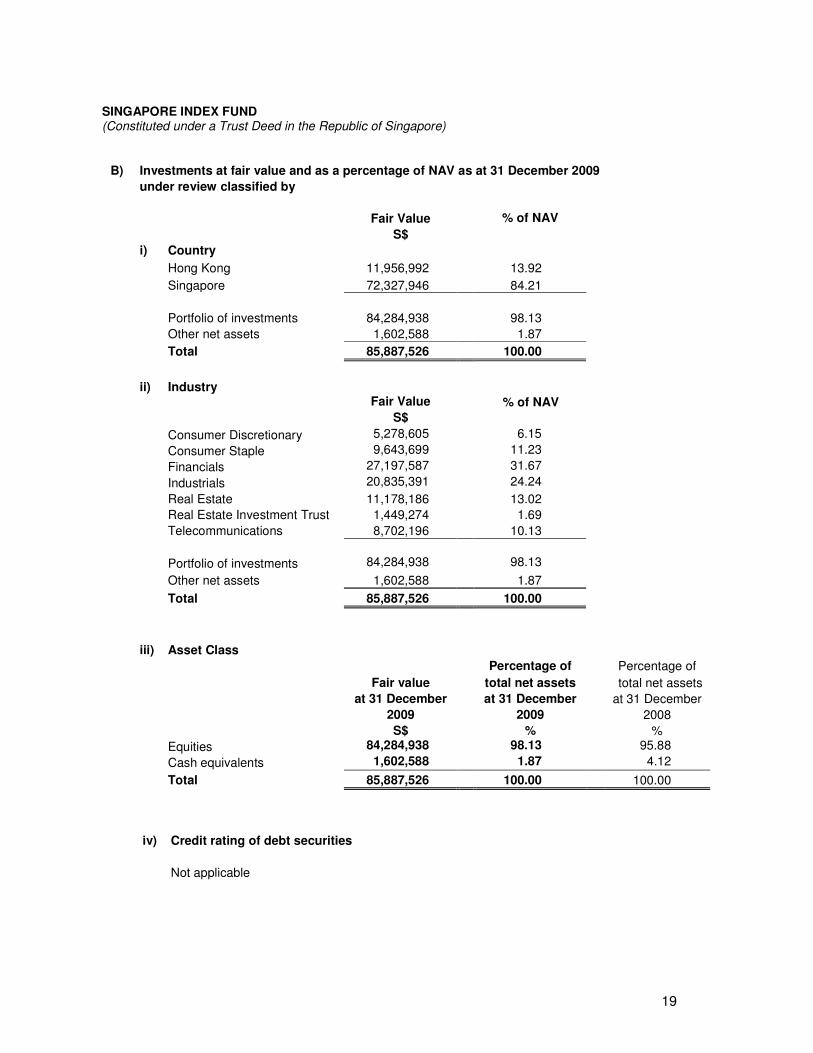
SINGAPORE INDEX FUND (Constituted under a Trust Deed in the Republic of Singapore)
B) Investments at fair value and as a percentage of NAV as at 31 December 2009
under review classified by
Fair Value % of NAV
S$
i) Country
Hong Kong 11,956,992 13.92
Singapore 72,327,946 84.21
Portfolio of investments 84,284,938 98.13
Other net assets 1,602,588 1.87
Total 85,887,526 100.00
ii) Industry
Fair Value % of NAV
S$
Consumer Discretionary 5,278,605 6.15
Consumer Staple 9,643,699 11.23
Financials 27,197,587 31.67
Industrials 20,835,391 24.24
Real Estate 11,178,186 13.02
Real Estate Investment Trust 1,449,274 1.69
Telecommunications 8,702,196 10.13
Portfolio of investments 84,284,938 98.13
Other net assets 1,602,588 1.87
Total 85,887,526 100.00
iii) Asset Class
Percentage of Percentage of
Fair value total net assets total net assets
at 31 December at 31 December at 31 December
2009 2009 2008
S$ % %
Equities 84,284,938 98.13 95.88
Cash equivalents 1,602,588 1.87 4.12
Total 85,887,526 100.00 100.00
iv)
Credit rating of debt securities
Not applicable
20
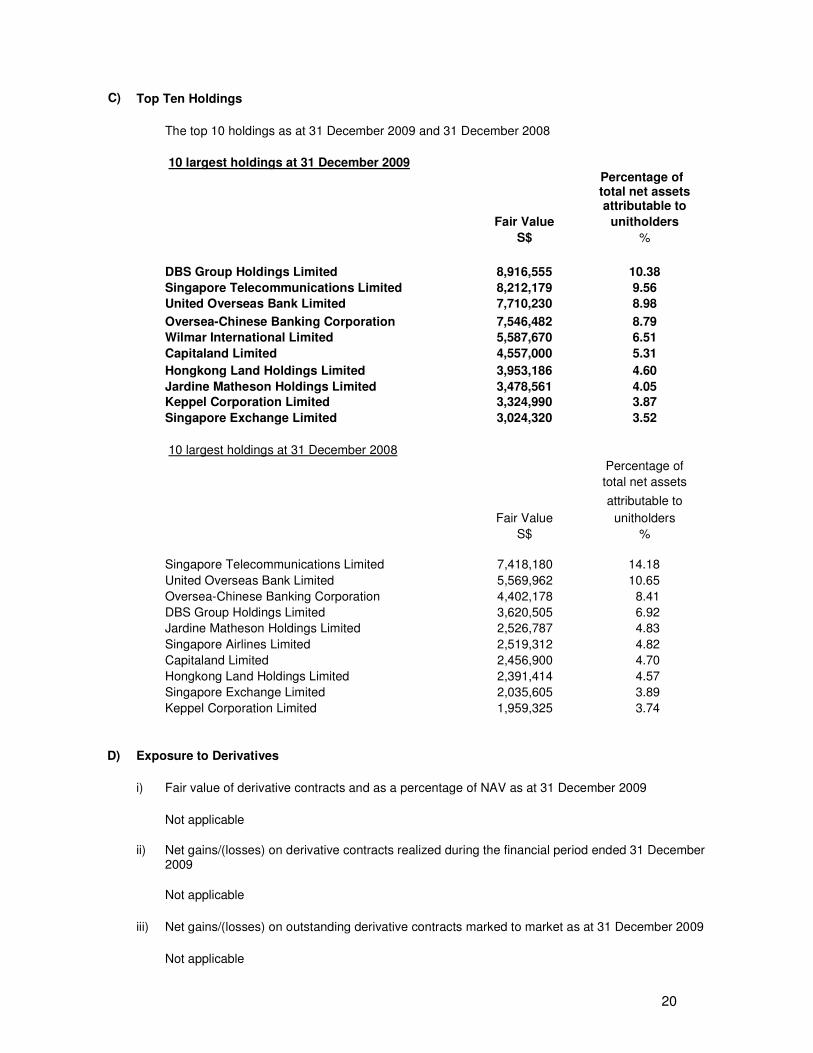
D) Exposure to Derivatives
i) Fair value of derivative contracts and as a percentage of NAV as at 31 December 2009
Not applicable
ii) Net gains/(losses) on derivative contracts realized during the financial period ended 31 December
2009
Not applicable
iii) Net gains/(losses) on outstanding derivative contracts marked to market as at 31 December 2009
Not applicable
C) Top Ten Holdings
The top 10 holdings as at 31 December 2009 and 31 December 2008
10 largest holdings at 31 December 2009 Percentage of total net assets attributable to
Fair Value unitholders
S$ %
DBS Group Holdings Limited 8,916,555 10.38
Singapore Telecommunications Limited 8,212,179 9.56
United Overseas Bank Limited 7,710,230 8.98
Oversea-Chinese Banking Corporation 7,546,482 8.79
Wilmar International Limited 5,587,670 6.51
Capitaland Limited 4,557,000 5.31
Hongkong Land Holdings Limited 3,953,186 4.60
Jardine Matheson Holdings Limited 3,478,561 4.05
Keppel Corporation Limited 3,324,990 3.87
Singapore Exchange Limited 3,024,320 3.52
10 largest holdings at 31 December 2008
Percentage of
total net assets
attributable to
Fair Value unitholders
S$ %
Singapore Telecommunications Limited 7,418,180 14.18
United Overseas Bank Limited 5,569,962 10.65
Oversea-Chinese Banking Corporation 4,402,178 8.41
DBS Group Holdings Limited 3,620,505 6.92
Jardine Matheson Holdings Limited 2,526,787 4.83
Singapore Airlines Limited 2,519,312 4.82
Capitaland Limited 2,456,900 4.70
Hongkong Land Holdings Limited 2,391,414 4.57
Singapore Exchange Limited 2,035,605 3.89
Keppel Corporation Limited 1,959,325 3.74
21
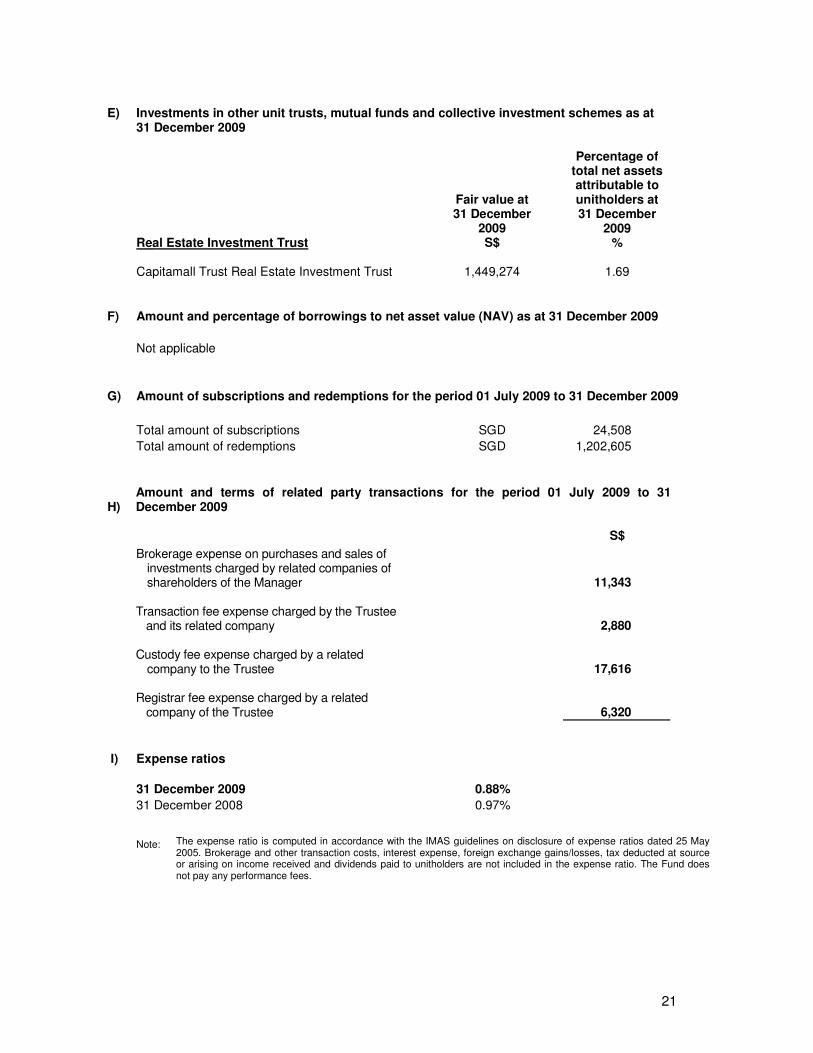
E) Investments in other unit trusts, mutual funds and collective investment schemes as at
31 December 2009
Real Estate Investment Trust
Fair value at 31 December
2009 S$
Percentage of total net assets attributable to unitholders at 31 December
2009 %
Capitamall Trust Real Estate Investment Trust 1,449,274 1.69
F) Amount and percentage of borrowings to net asset value (NAV) as at 31 December 2009
Not applicable
G) Amount of subscriptions and redemptions for the period 01 July 2009 to 31 December 2009
Total amount of subscriptions SGD 24,508
Total amount of redemptions SGD 1,202,605
H) Amount and terms of related party transactions for the period 01 July 2009 to 31December 2009
S$
Brokerage expense on purchases and sales of investments charged by related companies of shareholders of the Manager 11,343
Transaction fee expense charged by the Trustee and its related company 2,880
Custody fee expense charged by a related
company to the Trustee 17,616
Registrar fee expense charged by a related
company of the Trustee 6,320
I) Expense ratios
31 December 2009 0.88%
31 December 2008 0.97%
Note:
The expense ratio is computed in accordance with the IMAS guidelines on disclosure of expense ratios dated 25 May 2005. Brokerage and other transaction costs, interest expense, foreign exchange gains/losses, tax deducted at source or arising on income received and dividends paid to unitholders are not included in the expense ratio. The Fund does not pay any performance fees.
22
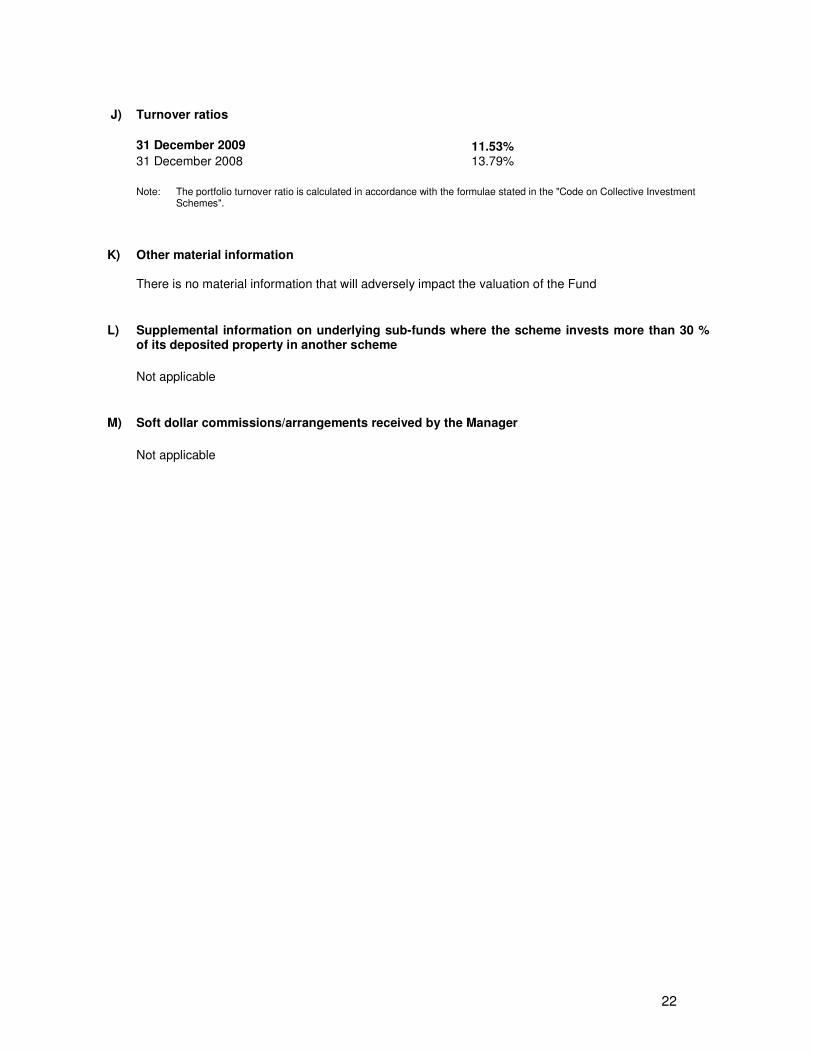
J) Turnover ratios
31 December 2009 11.53%
31 December 2008 13.79%
Note:
The portfolio turnover ratio is calculated in accordance with the formulae stated in the "Code on Collective Investment Schemes".
K) Other material information There is no material information that will adversely impact the valuation of the Fund
L) Supplemental information on underlying sub-funds where the scheme invests more than 30 %
of its deposited property in another scheme
Not applicable
M) Soft dollar commissions/arrangements received by the Manager
Not applicable
23
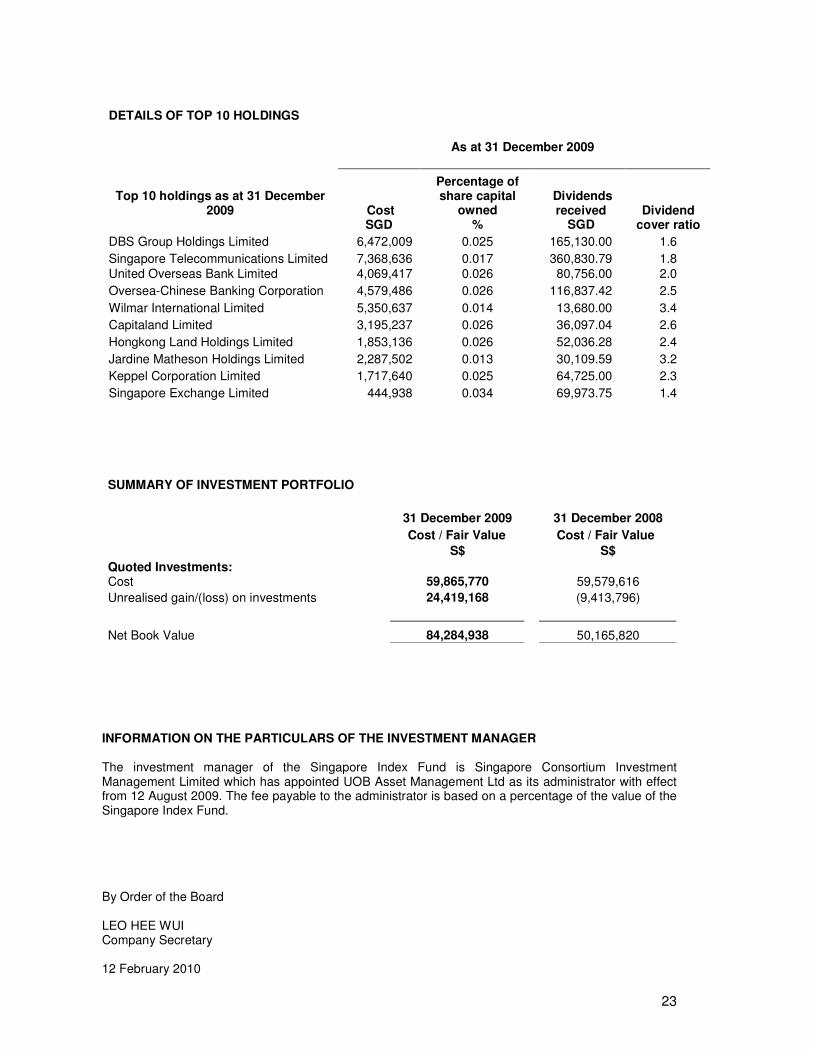
DETAILS OF TOP 10 HOLDINGS
As at 31 December 2009
Top 10 holdings as at 31 December 2009
Cost SGD
Percentage of share capital
owned %
Dividends received
SGD Dividend
cover ratio
DBS Group Holdings Limited 6,472,009 0.025 165,130.00 1.6
Singapore Telecommunications Limited 7,368,636 0.017 360,830.79 1.8 United Overseas Bank Limited 4,069,417 0.026 80,756.00 2.0
Oversea-Chinese Banking Corporation 4,579,486 0.026 116,837.42 2.5
Wilmar International Limited 5,350,637 0.014 13,680.00 3.4
Capitaland Limited 3,195,237 0.026 36,097.04 2.6
Hongkong Land Holdings Limited 1,853,136 0.026 52,036.28 2.4
Jardine Matheson Holdings Limited 2,287,502 0.013 30,109.59 3.2
Keppel Corporation Limited 1,717,640 0.025 64,725.00 2.3
Singapore Exchange Limited 444,938 0.034 69,973.75 1.4
SUMMARY OF INVESTMENT PORTFOLIO
31 December 2009 31 December 2008
Cost / Fair Value Cost / Fair Value
S$ S$
Quoted Investments: Cost 59,865,770 59,579,616
Unrealised gain/(loss) on investments 24,419,168 (9,413,796)
Net Book Value 84,284,938 50,165,820
INFORMATION ON THE PARTICULARS OF THE INVESTMENT MANAGER The investment manager of the Singapore Index Fund is Singapore Consortium Investment Management Limited which has appointed UOB Asset Management Ltd as its administrator with effect from 12 August 2009. The fee payable to the administrator is based on a percentage of the value of the Singapore Index Fund. By Order of the Board LEO HEE WUI Company Secretary 12 February 2010


![The importance of vessel factors for stent …of which about 382,000 cases involved the deployment of stents [1]. The worldwide coronary stent market is worth over $7 billion and forecast](https://img.pdfslide.net/doc/110x75/5f089c7f7e708231d422dd53/the-importance-of-vessel-factors-for-stent-of-which-about-382000-cases-involved.jpg)