Embed Size (px)
Citation preview
Columbia UniversityMechanical Engineering
Control Lab Signal Processing Lab1
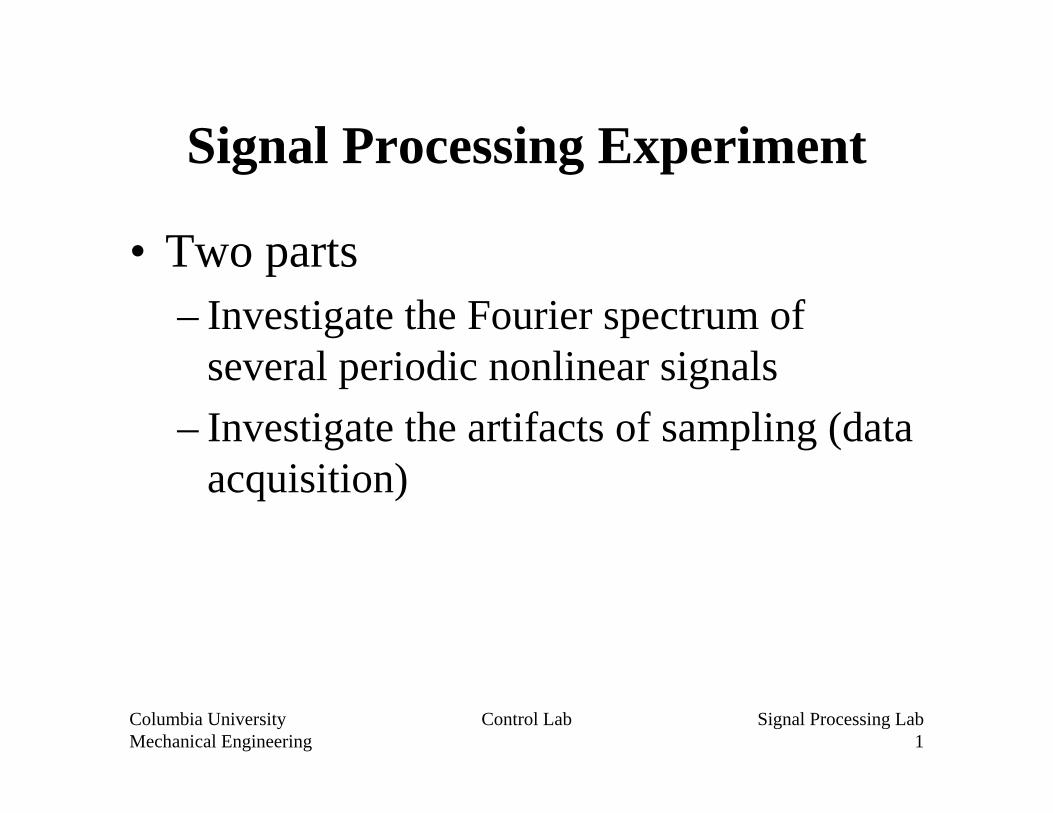
Signal Processing Experiment
• Two parts– Investigate the Fourier spectrum of
several periodic nonlinear signals– Investigate the artifacts of sampling (data
acquisition)
Columbia UniversityMechanical Engineering
Control Lab Signal Processing Lab2
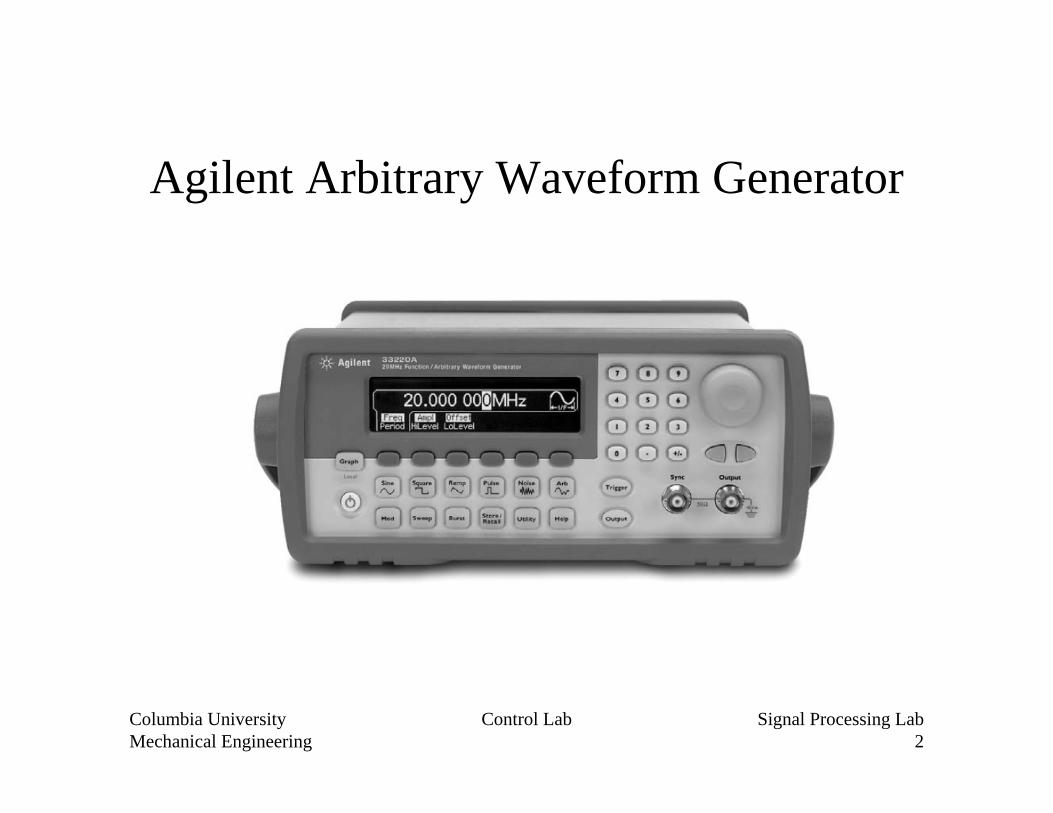
Agilent Arbitrary Waveform Generator
Columbia UniversityMechanical Engineering
Control Lab Signal Processing Lab3
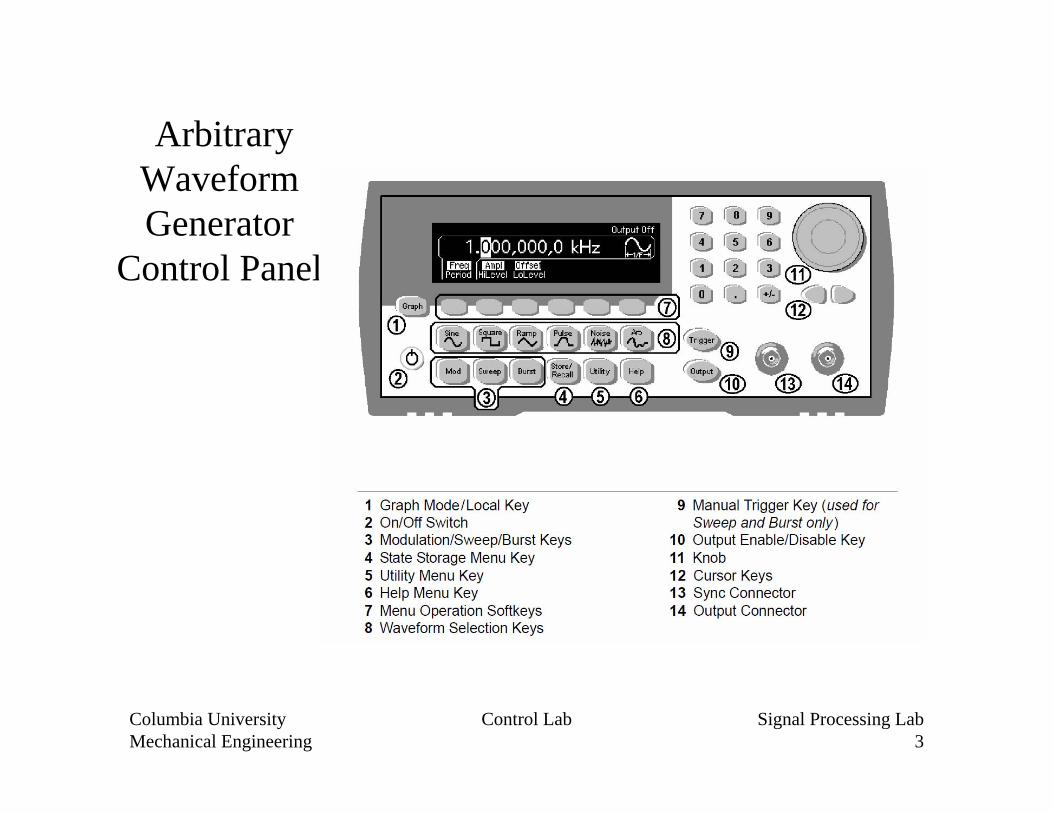
Arbitrary Waveform Generator
Control Panel
Columbia UniversityMechanical Engineering
Control Lab Signal Processing Lab4
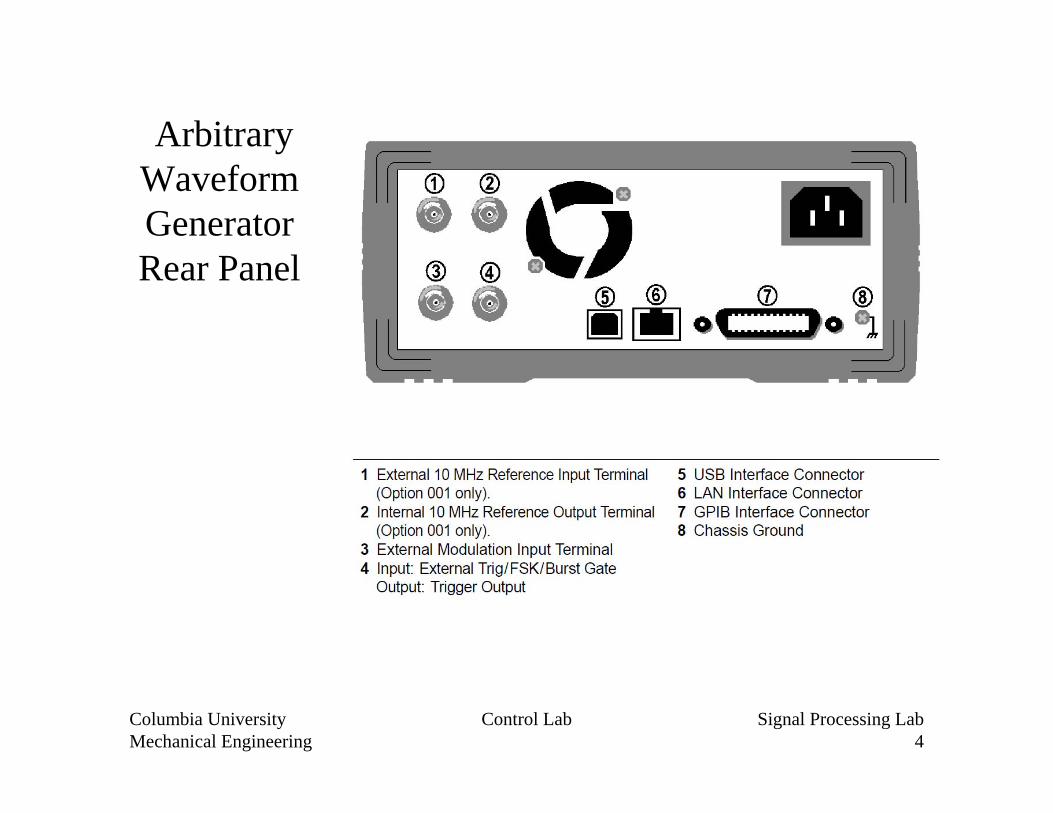
Arbitrary Waveform GeneratorRear Panel
Columbia UniversityMechanical Engineering
Control Lab Signal Processing Lab5
Programming• Use LabVIEW program to take analog signals from the
Arbitrary Waveform Generator• Display analog data vs. time (compare to oscilloscope)• Display analog data vs. frequency (program spectrum
analyzer)
• Open Intuilink software to communicate with the Arbitrary Waveform Generator
• Program generator waveform• Start Generator (continuous waveform)• Start data acquisition
Columbia UniversityMechanical Engineering
Control Lab Signal Processing Lab6
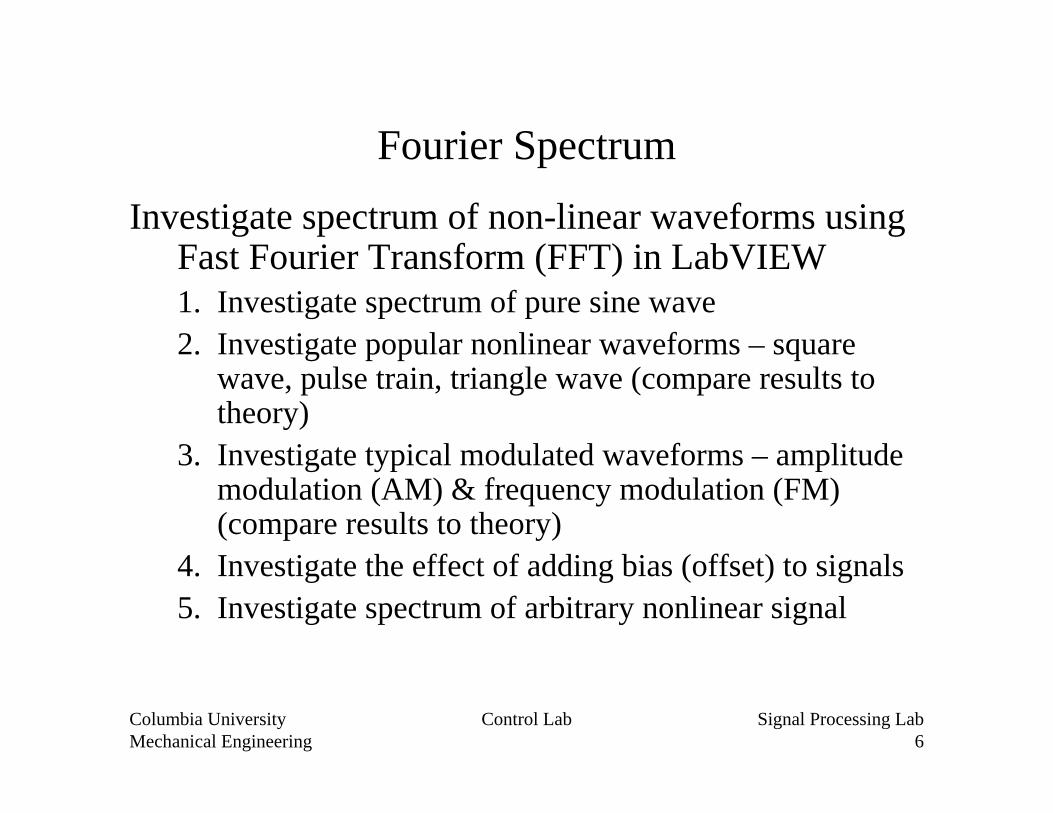
Fourier SpectrumInvestigate spectrum of non-linear waveforms using
Fast Fourier Transform (FFT) in LabVIEW1. Investigate spectrum of pure sine wave2. Investigate popular nonlinear waveforms – square
wave, pulse train, triangle wave (compare results to theory)
3. Investigate typical modulated waveforms – amplitude modulation (AM) & frequency modulation (FM) (compare results to theory)
4. Investigate the effect of adding bias (offset) to signals5. Investigate spectrum of arbitrary nonlinear signal
Columbia UniversityMechanical Engineering
Control Lab Signal Processing Lab7
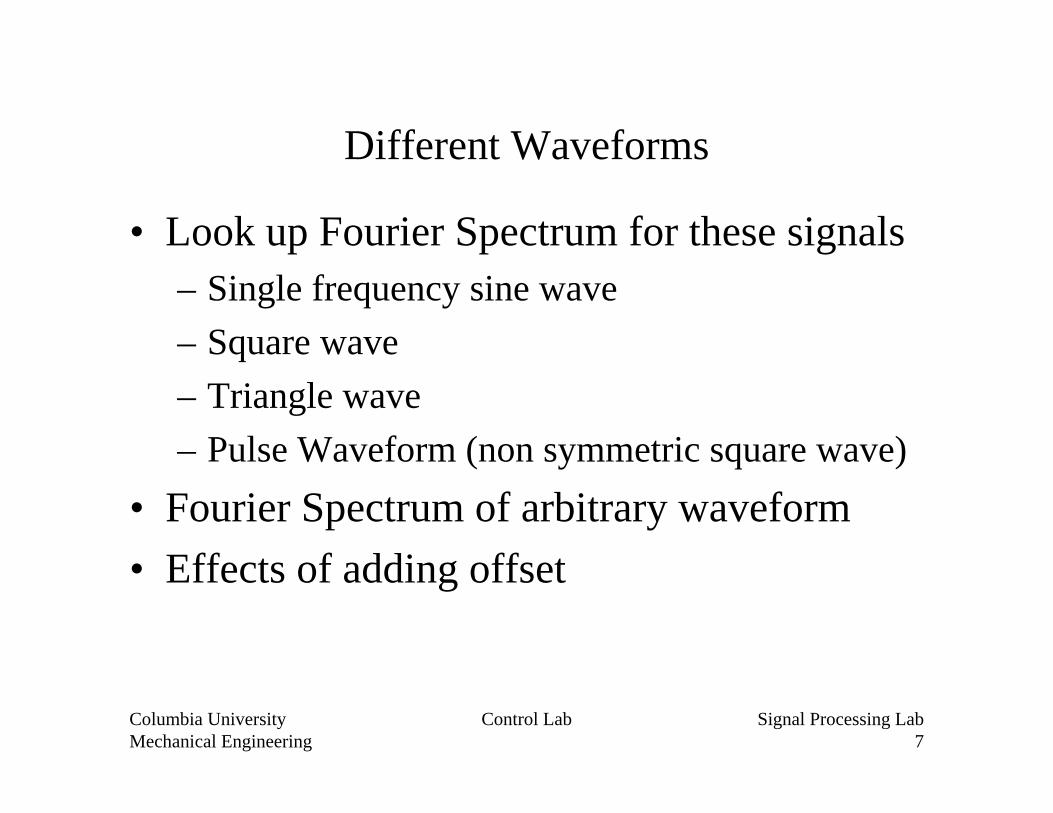
Different Waveforms
• Look up Fourier Spectrum for these signals– Single frequency sine wave– Square wave– Triangle wave– Pulse Waveform (non symmetric square wave)
• Fourier Spectrum of arbitrary waveform• Effects of adding offset
Columbia UniversityMechanical Engineering
Control Lab Signal Processing Lab8
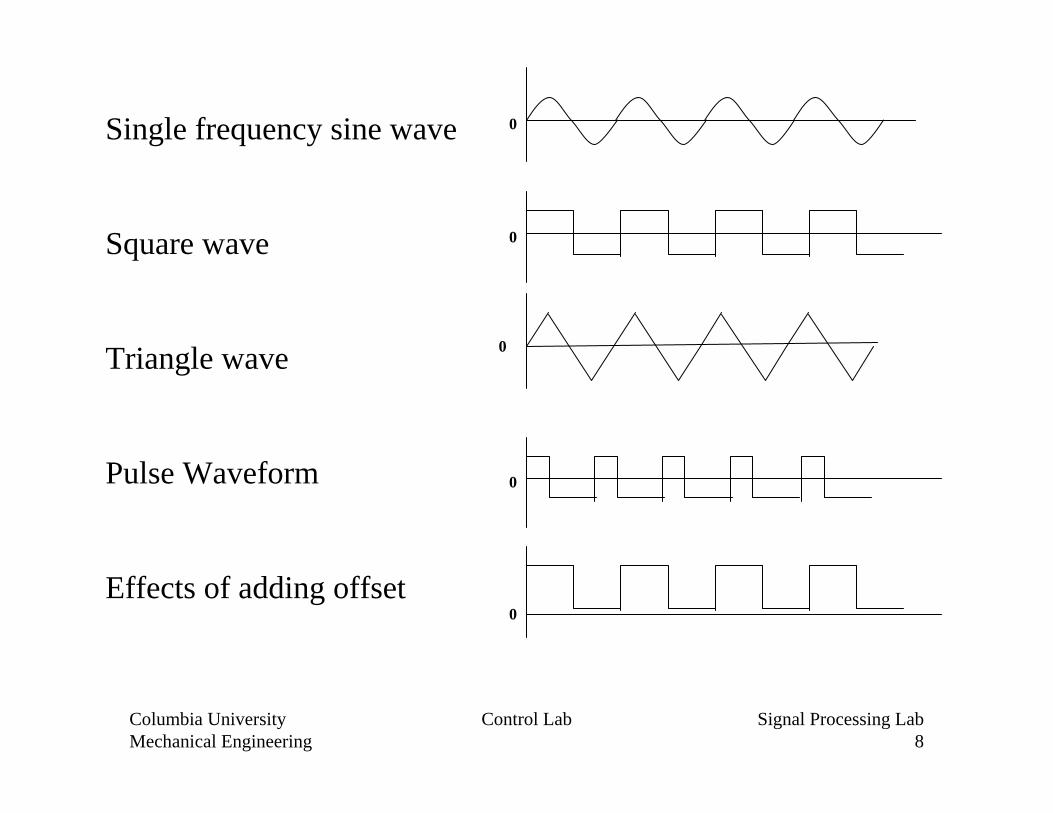
Single frequency sine wave
Square wave
Triangle wave
Pulse Waveform
Effects of adding offset
0
0
0
0
0
Columbia UniversityMechanical Engineering
Control Lab Signal Processing Lab9
Arbitrary Waveform
• Free-hand draw some arbitrary waveform
• Provide the waveform (vs. time) and the spectrum (vs. frequency) in report
Columbia UniversityMechanical Engineering
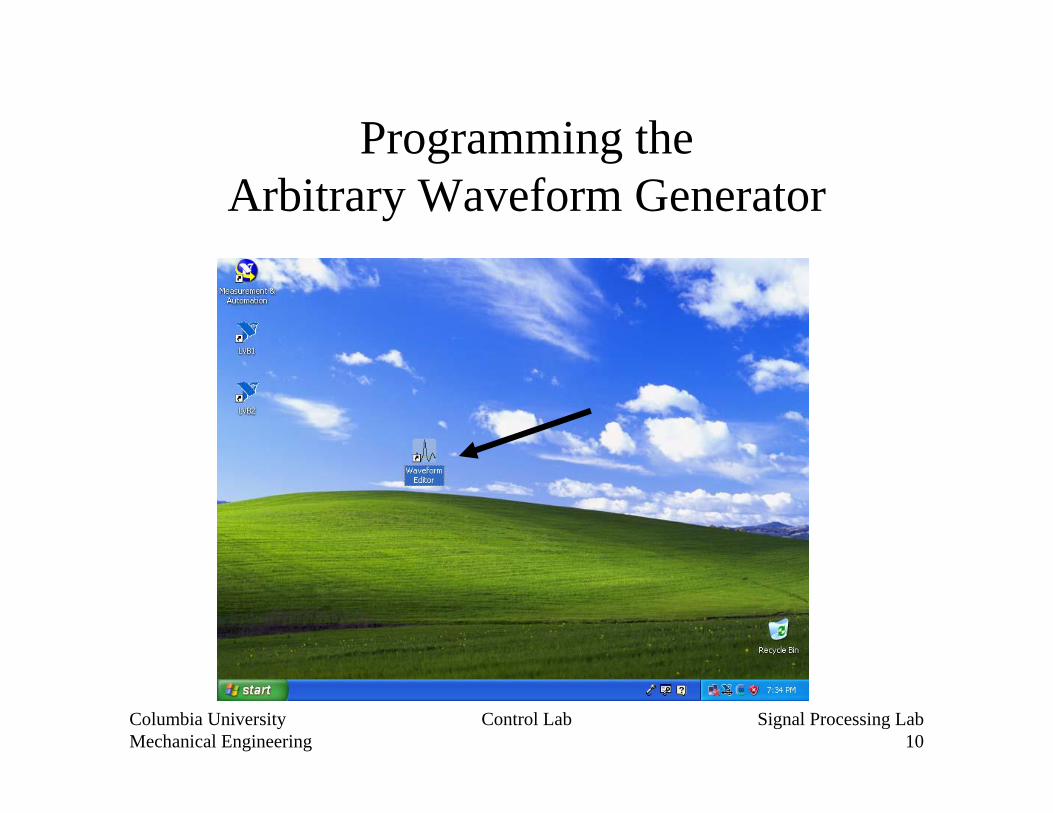
Control Lab Signal Processing Lab10
Programming theArbitrary Waveform Generator
Columbia UniversityMechanical Engineering
Control Lab Signal Processing Lab11
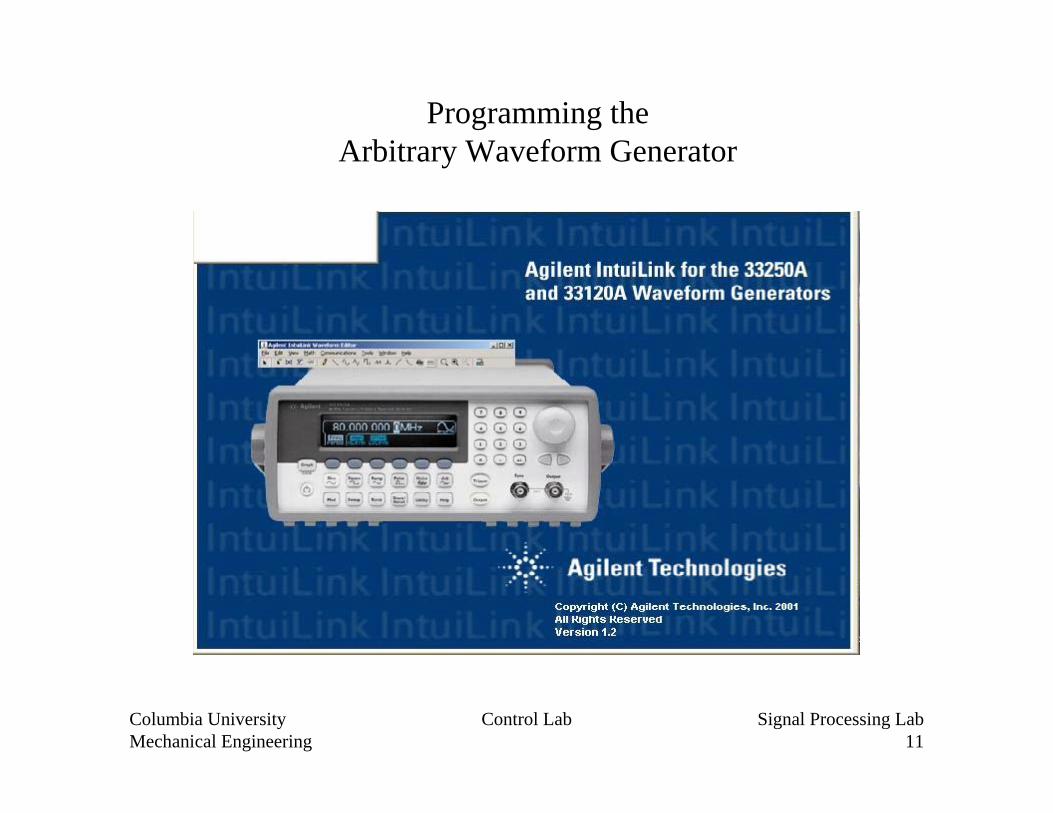
Programming theArbitrary Waveform Generator
Columbia UniversityMechanical Engineering
Control Lab Signal Processing Lab12
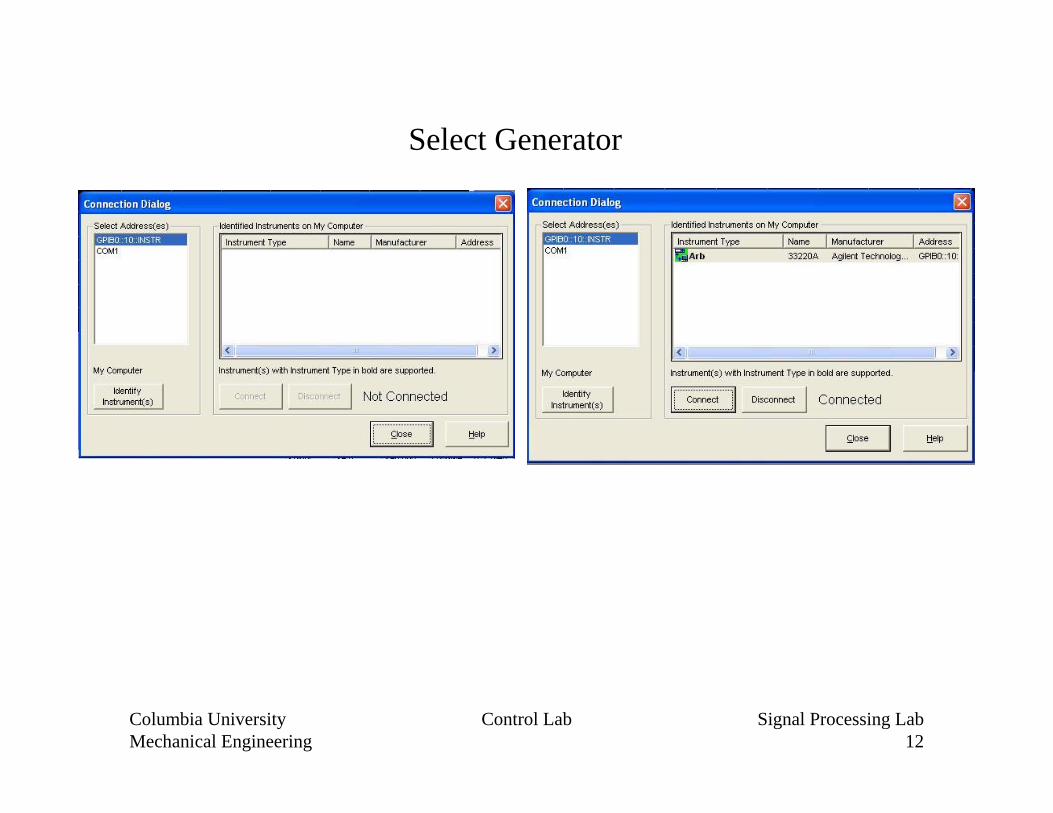
Select Generator
Columbia UniversityMechanical Engineering
Control Lab Signal Processing Lab13
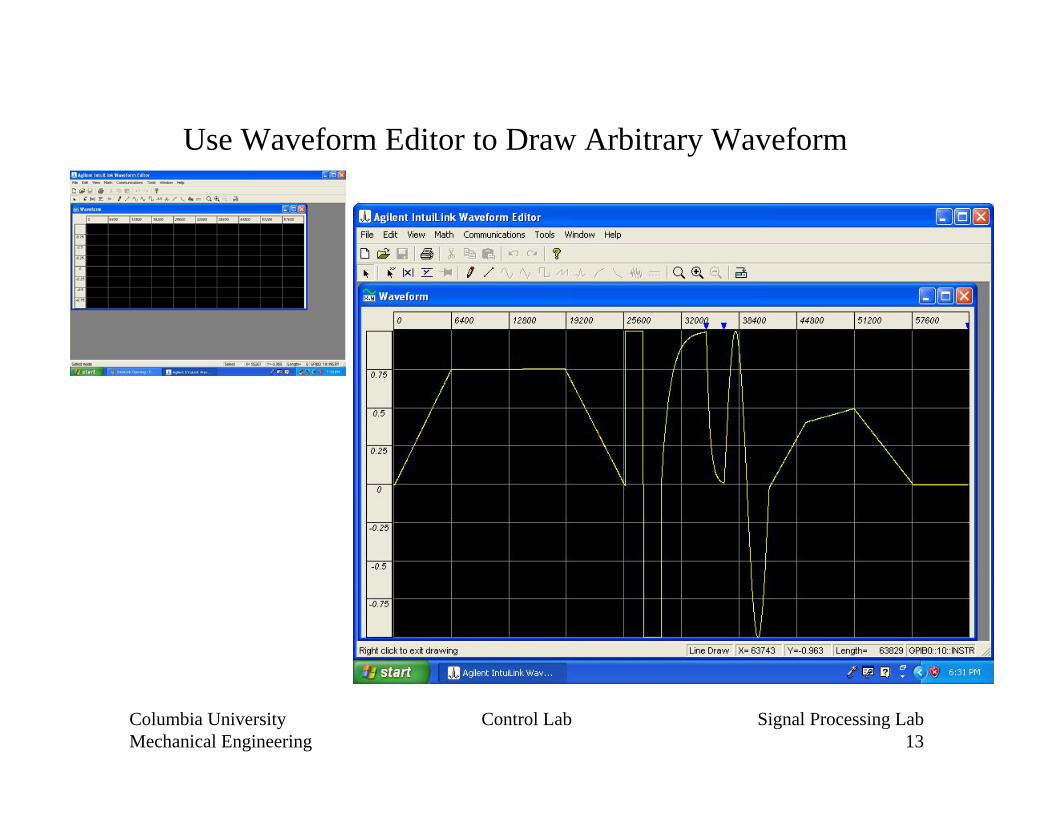
Use Waveform Editor to Draw Arbitrary Waveform
Columbia UniversityMechanical Engineering
Control Lab Signal Processing Lab14
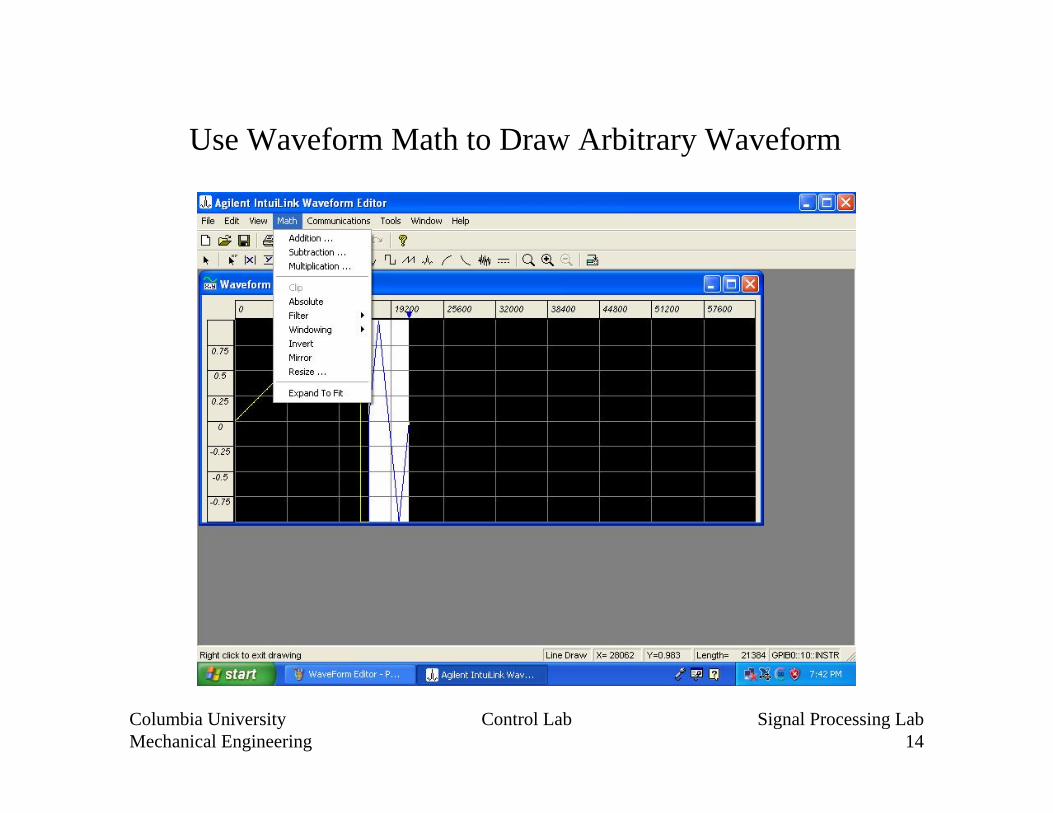
Use Waveform Math to Draw Arbitrary Waveform
Columbia UniversityMechanical Engineering
Control Lab Signal Processing Lab15
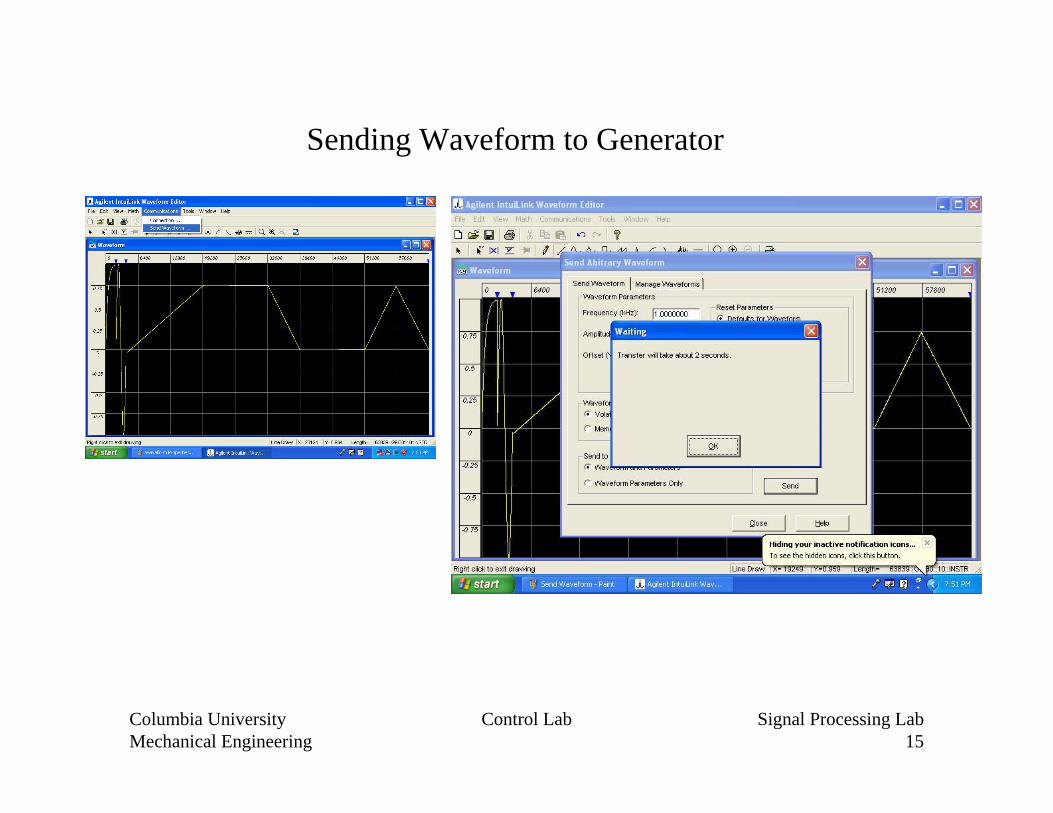
Sending Waveform to Generator
Columbia UniversityMechanical Engineering
Control Lab Signal Processing Lab16
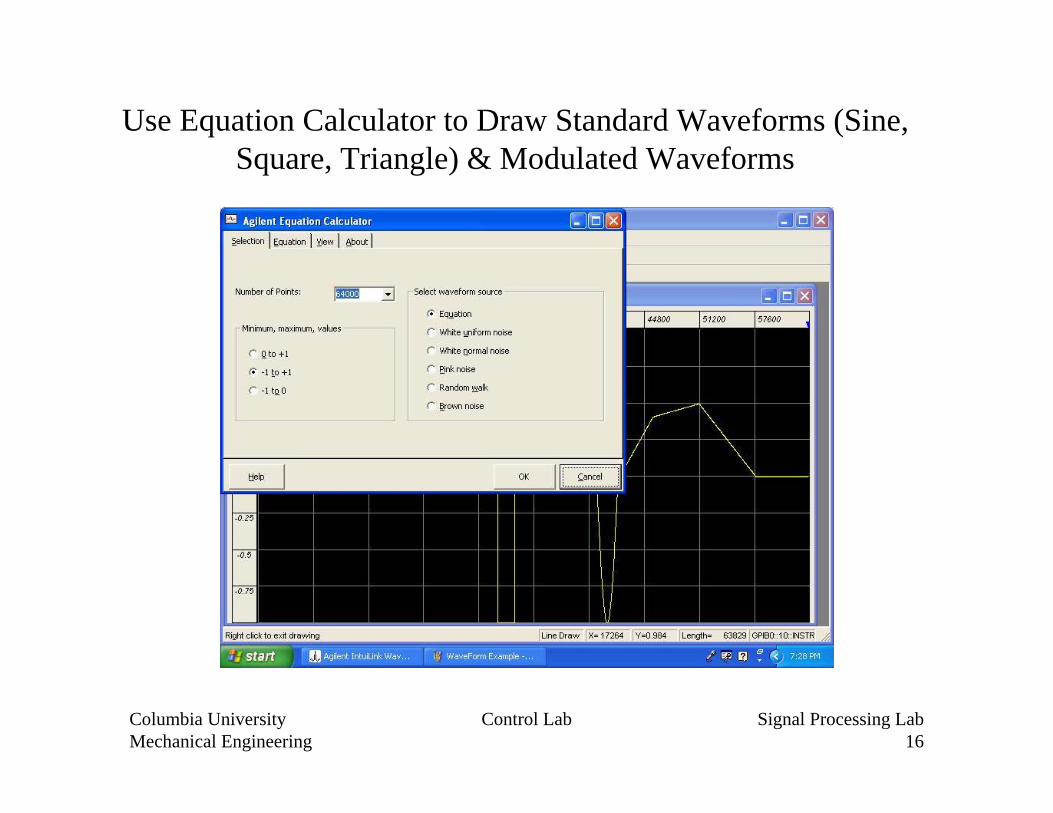
Use Equation Calculator to Draw Standard Waveforms (Sine, Square, Triangle) & Modulated Waveforms
Columbia UniversityMechanical Engineering
Control Lab Signal Processing Lab17
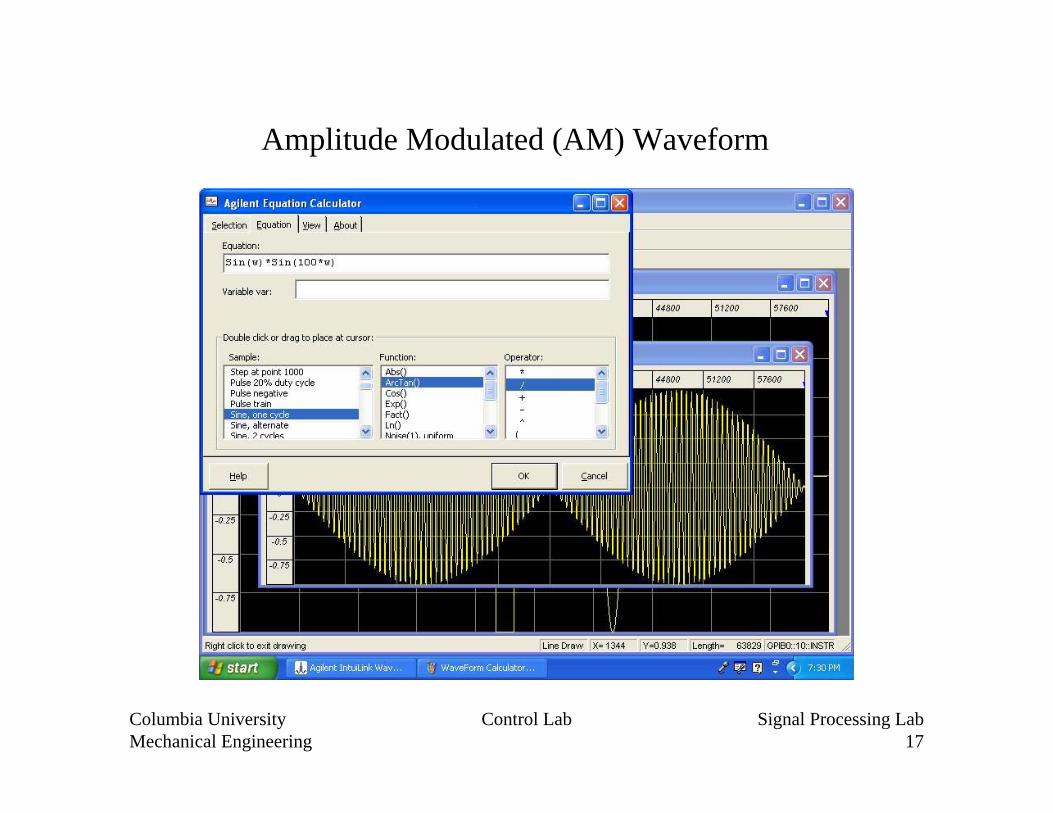
Amplitude Modulated (AM) Waveform
Columbia UniversityMechanical Engineering
Control Lab Signal Processing Lab18
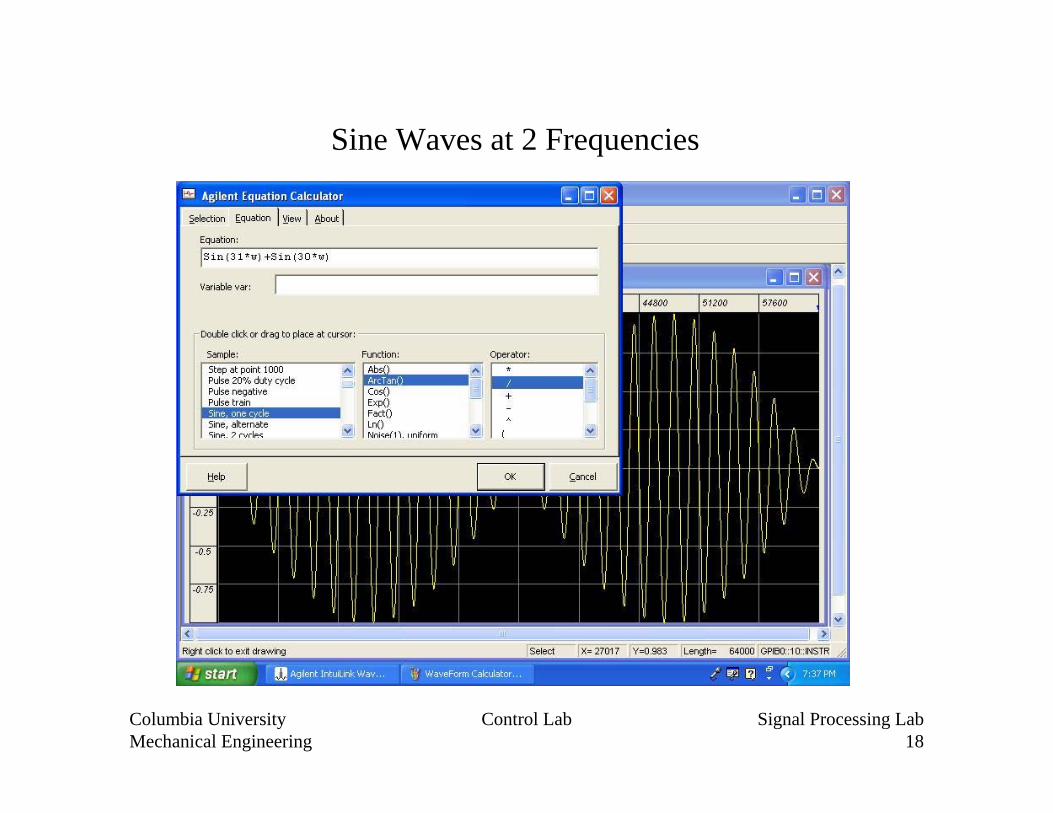
Sine Waves at 2 Frequencies
Columbia UniversityMechanical Engineering
Control Lab Signal Processing Lab19
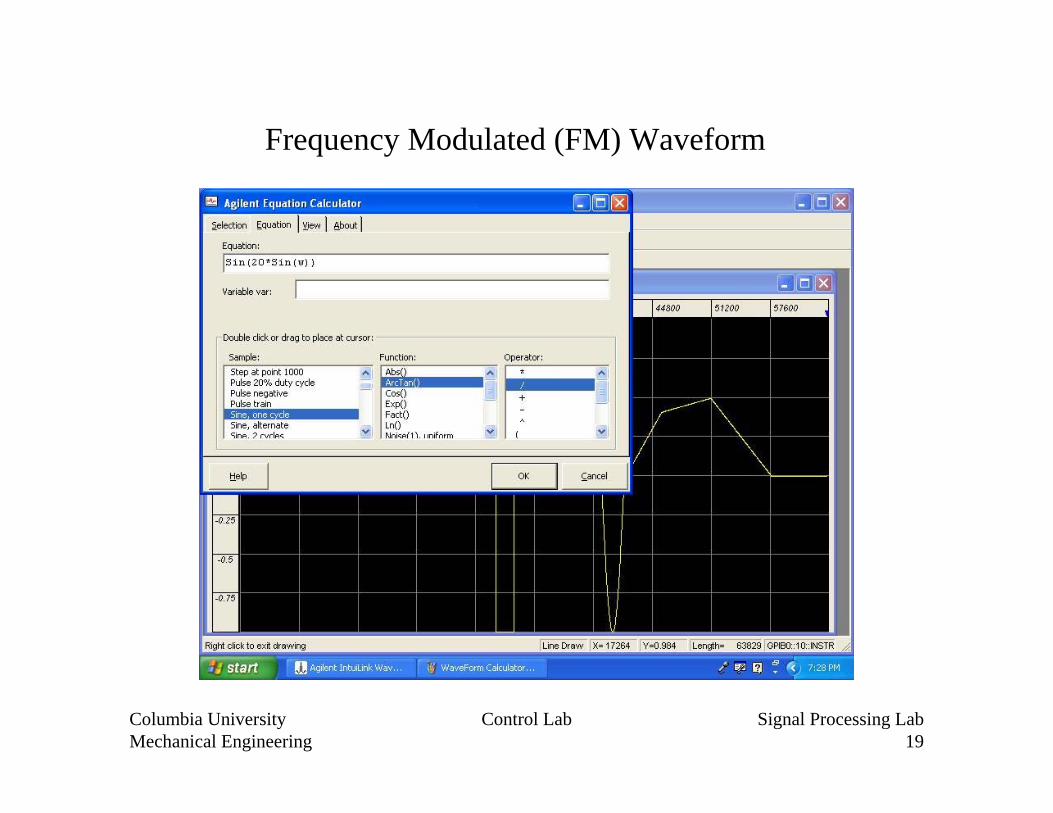
Frequency Modulated (FM) Waveform
Columbia UniversityMechanical Engineering
Control Lab Signal Processing Lab20
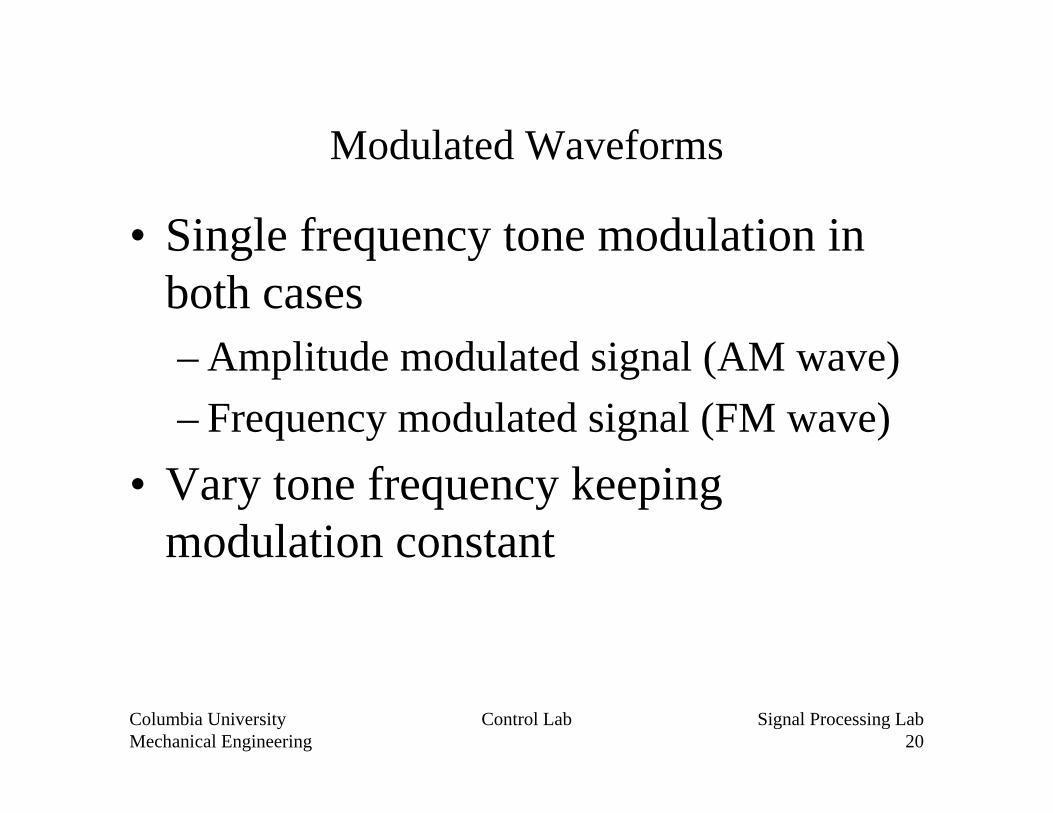
Modulated Waveforms
• Single frequency tone modulation in both cases– Amplitude modulated signal (AM wave)– Frequency modulated signal (FM wave)
• Vary tone frequency keeping modulation constant
Columbia UniversityMechanical Engineering
Control Lab Signal Processing Lab21
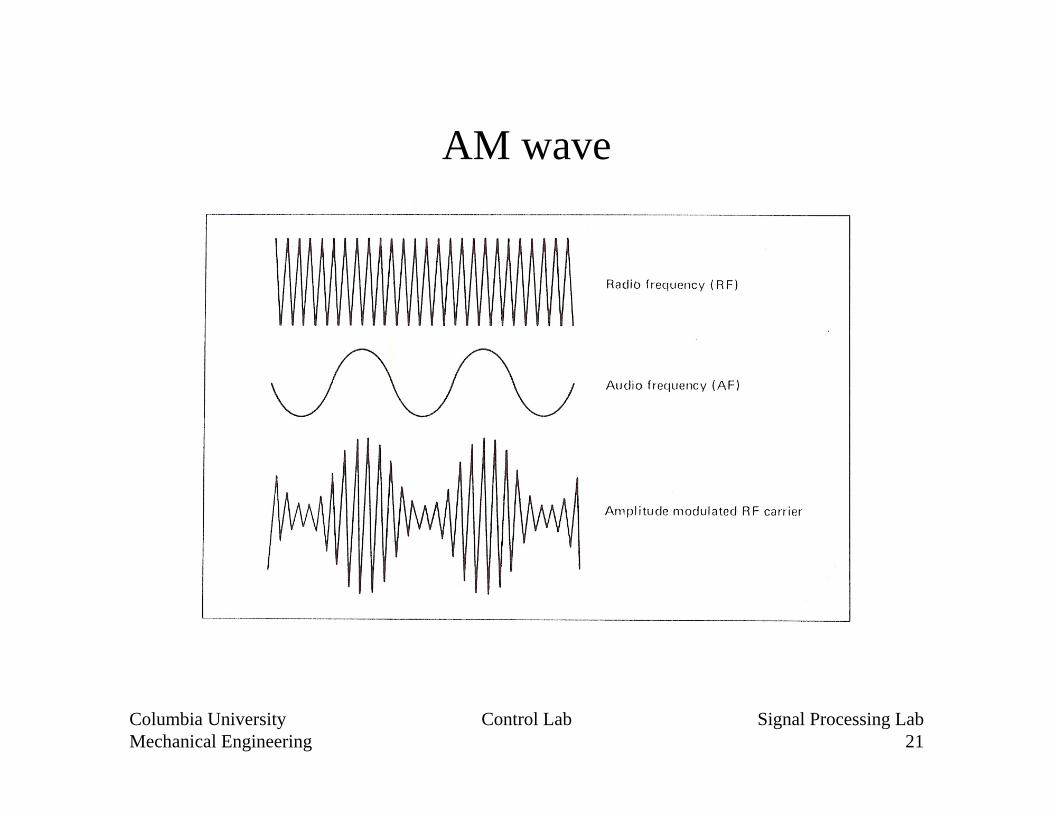
AM wave
Columbia UniversityMechanical Engineering
Control Lab Signal Processing Lab22
AM spectrum
Columbia UniversityMechanical Engineering
Control Lab Signal Processing Lab23
FM wave
Columbia UniversityMechanical Engineering
Control Lab Signal Processing Lab24
FM spectrum
Columbia UniversityMechanical Engineering
Control Lab Signal Processing Lab25
Part 2 – Sampling Artifacts
• Signal-to-Noise Ratio– Signal Detection– Effects of Quantization
• Discrimination & Dynamic Range (sample size)
• Aliasing & Bandwidth (sampling frequency)
Columbia UniversityMechanical Engineering
Control Lab Signal Processing Lab26
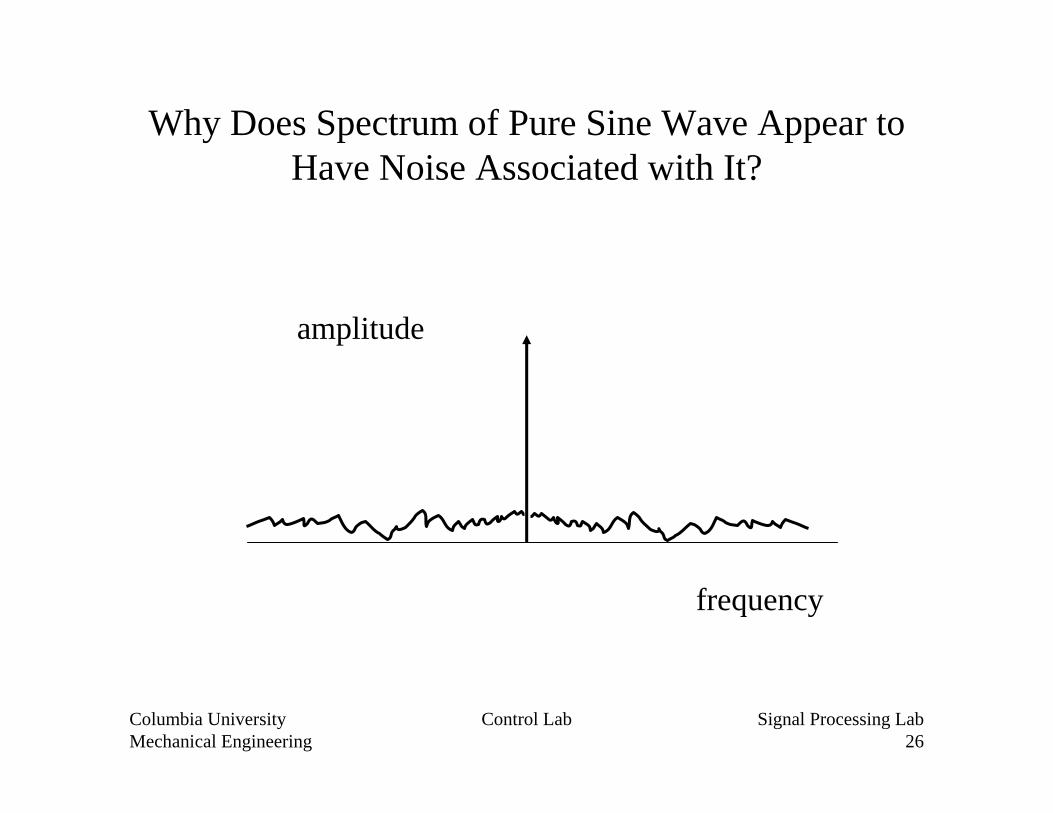
Why Does Spectrum of Pure Sine Wave Appear to Have Noise Associated with It?
frequency
amplitude
Columbia UniversityMechanical Engineering
Control Lab Signal Processing Lab27
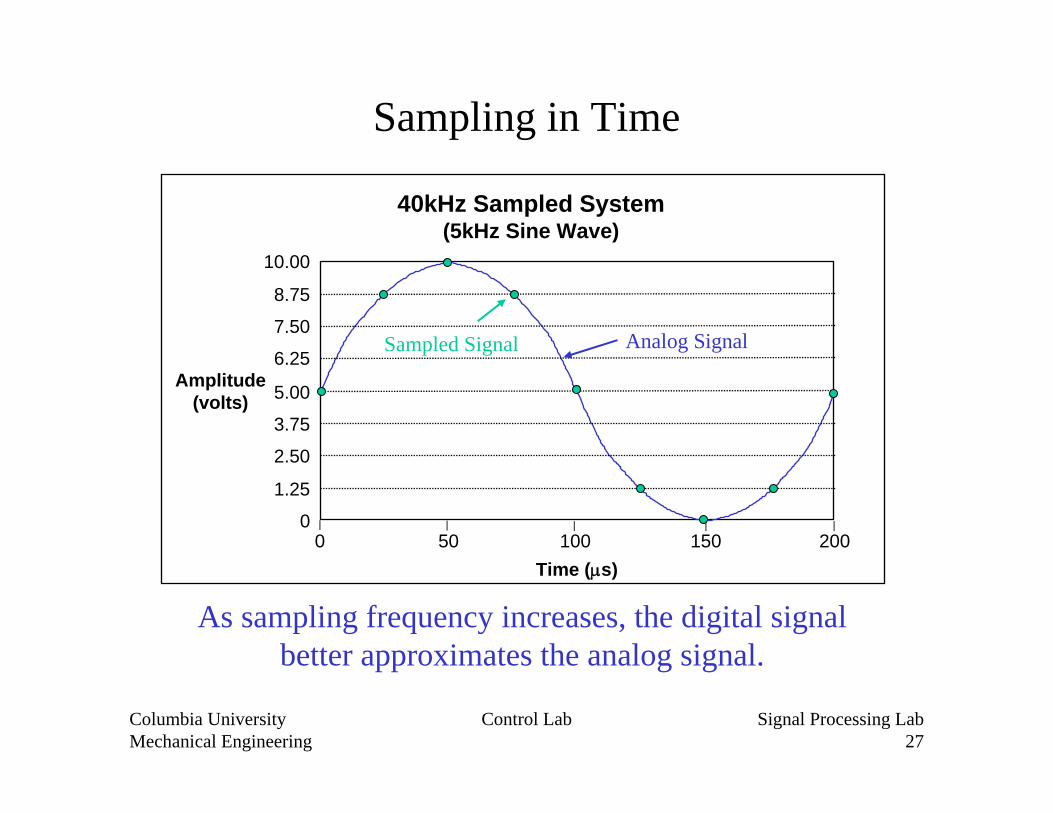
Sampling in Time
100 200150500Time (s)
0
1.25
5.00
2.50
3.75
6.25
7.50
8.75
10.00
Amplitude(volts)
40kHz Sampled System(5kHz Sine Wave)
| ||||
Analog SignalSampled Signal
As sampling frequency increases, the digital signal better approximates the analog signal.
Columbia UniversityMechanical Engineering
Control Lab Signal Processing Lab28
Quantization in Amplitude
100 200150500Time (s)
0
1.25
5.00
2.50
3.75
6.25
7.50
8.75
10.00
Amplitude(volts)
16 Bit Versus 3 Bit Resolution(5kHz Sine Wave)
16-bit
3-bit
000
001
010
011
100
101
110
111
| ||||
As resolution increases, the digital signal better approximates the analog signal.
The maximum quantization error is ½ the increment size.
Columbia UniversityMechanical Engineering
Control Lab Signal Processing Lab29
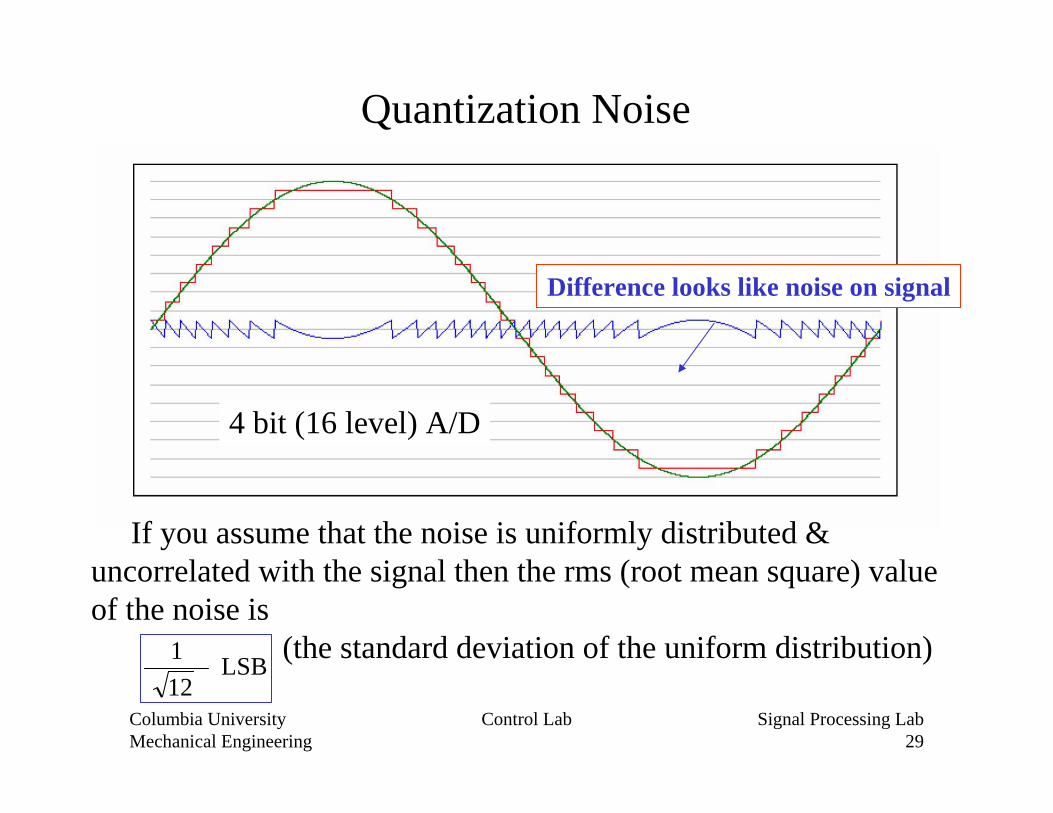
Quantization Noise
4 bit (16 level) A/D
Difference looks like noise on signal
If you assume that the noise is uniformly distributed & uncorrelated with the signal then the rms (root mean square) value of the noise is
(the standard deviation of the uniform distribution) LSB
12 1
Columbia UniversityMechanical Engineering
Control Lab Signal Processing Lab30
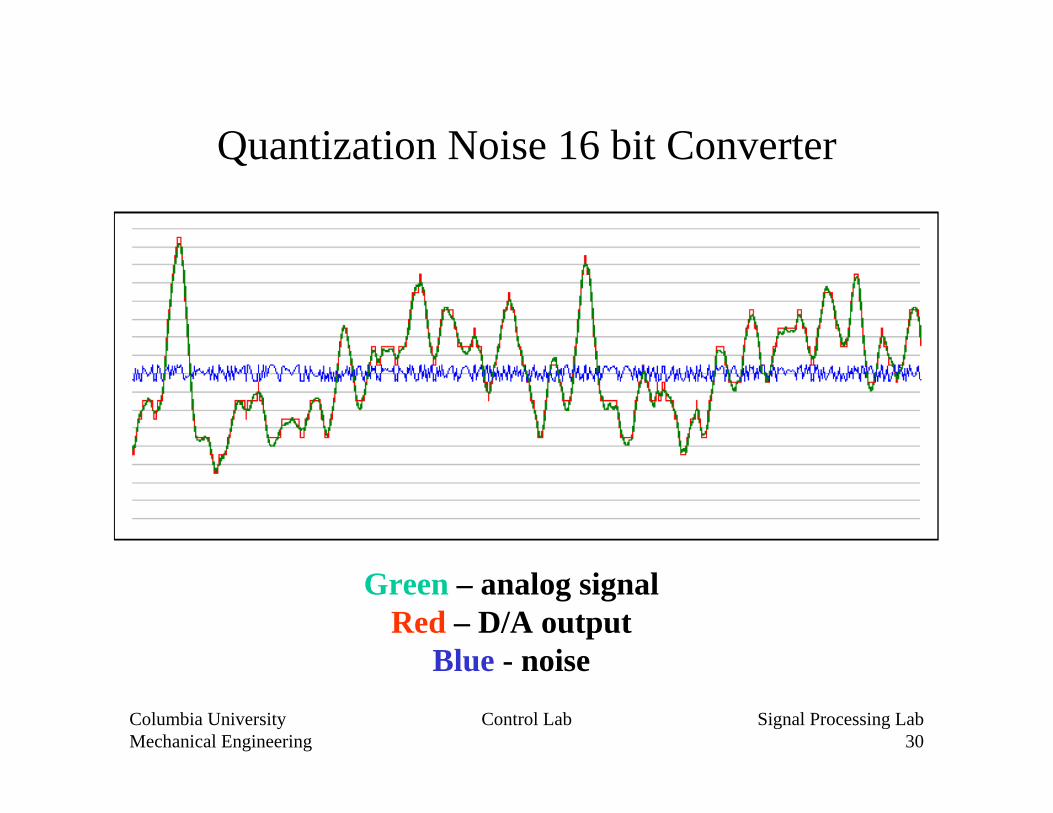
Quantization Noise 16 bit Converter
Green – analog signalRed – D/A output
Blue - noise
Columbia UniversityMechanical Engineering
Control Lab Signal Processing Lab31
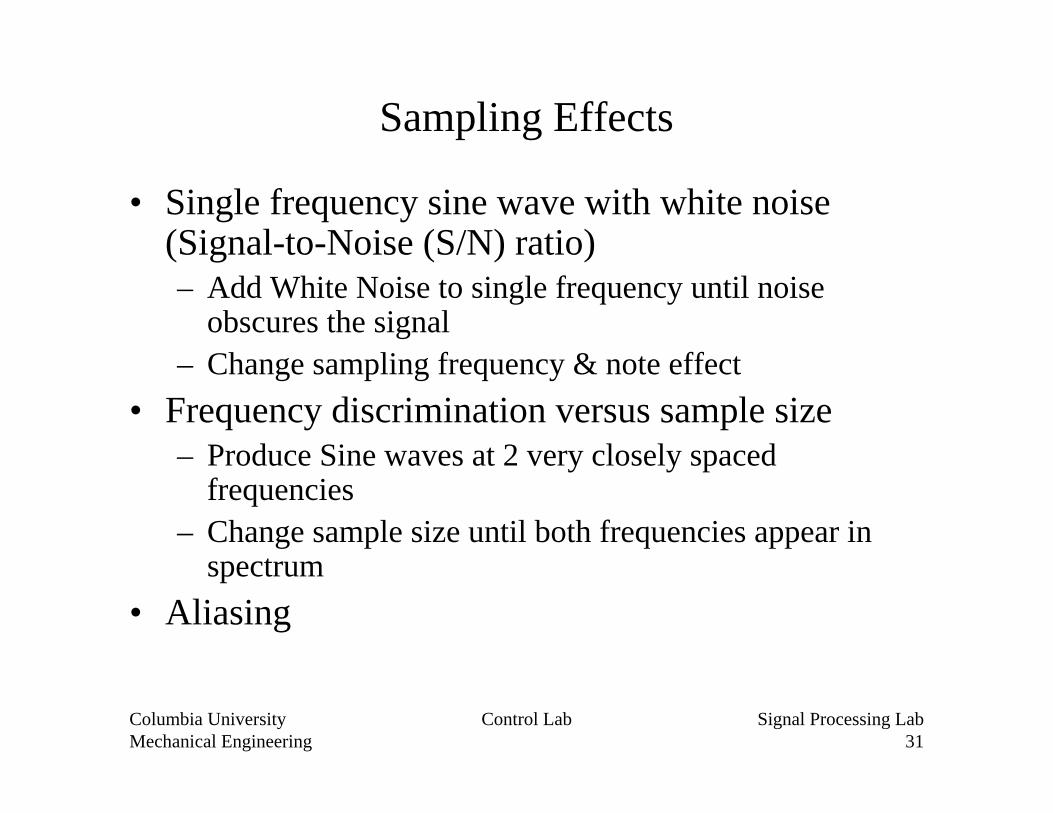
Sampling Effects
• Single frequency sine wave with white noise (Signal-to-Noise (S/N) ratio)– Add White Noise to single frequency until noise
obscures the signal– Change sampling frequency & note effect
• Frequency discrimination versus sample size– Produce Sine waves at 2 very closely spaced
frequencies– Change sample size until both frequencies appear in
spectrum• Aliasing
Columbia UniversityMechanical Engineering
Control Lab Signal Processing Lab32
Aliasing• Nyquist Theorem – sample at greater than twice the rate of the
maximum frequency component in the input signal
• Nyquist frequency – half the sampling frequency
• Only possible to recover frequencies at or below Nyquist (so what is the bandwidth of the data acquisition system?)
• Frequencies above Nyquist will “alias” between DC and Nyquist
• Alias frequency = Absolute Value (closest integer multiple of sampling frequency - input frequency)
Columbia UniversityMechanical Engineering
Control Lab Signal Processing Lab33
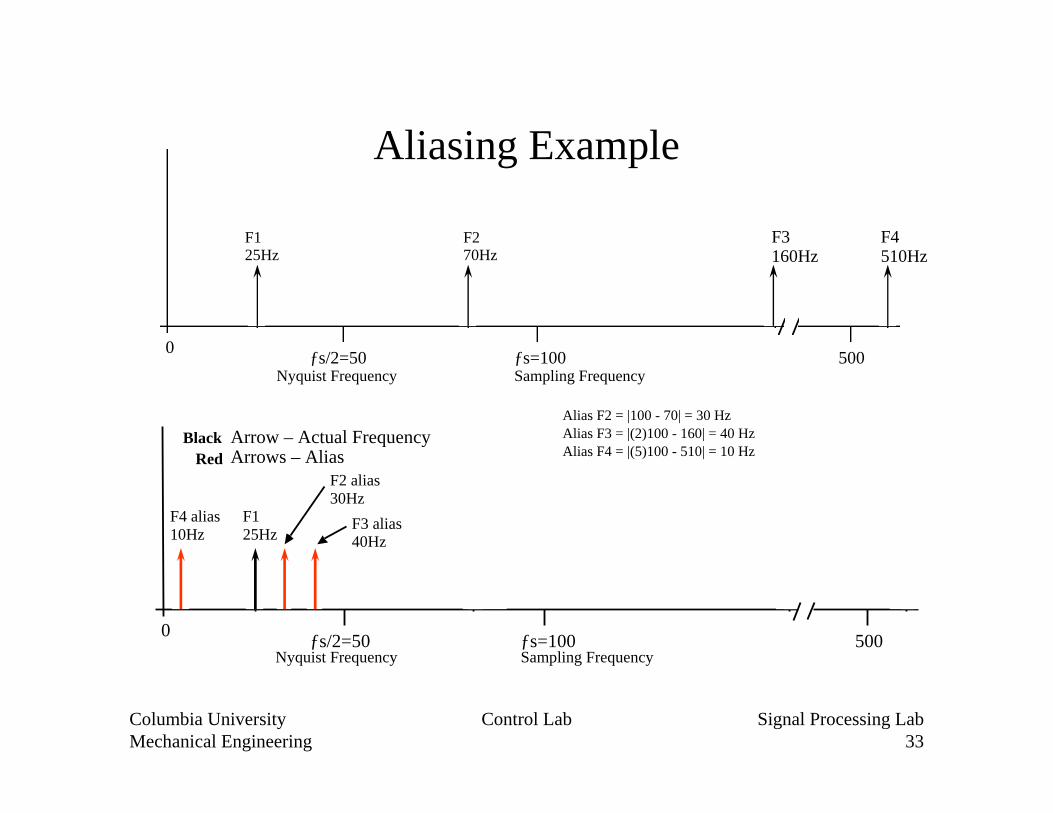
Aliasing Example
Sampling Frequency
ƒs=100 Sampling Frequency
ƒs/2=50 Nyquist Frequency
5000
F3 160Hz
F4 510Hz
F1 25Hz
F2 70Hz
ƒs=100 ƒs/2=50 Nyquist Frequency
5000
Arrow – Actual Frequency Arrows – Alias
F3 160Hz
F4 510Hz
F3 alias 40Hz
F1 25Hz
F4 alias 10Hz
F2 alias 30Hz
F2 70Hz
Alias F2 = |100 - 70| = 30 HzAlias F3 = |(2)100 - 160| = 40 HzAlias F4 = |(5)100 - 510| = 10 HzRed
Black
Columbia UniversityMechanical Engineering
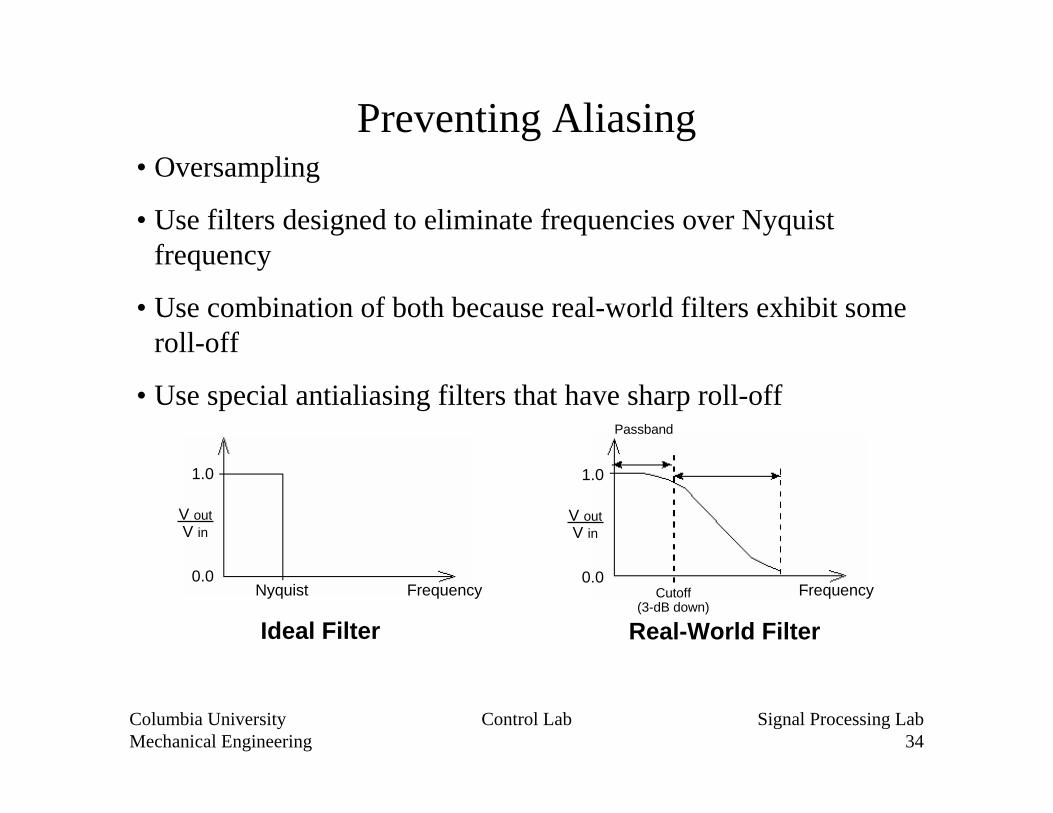
Control Lab Signal Processing Lab34
Preventing Aliasing• Oversampling
• Use filters designed to eliminate frequencies over Nyquistfrequency
• Use combination of both because real-world filters exhibit some roll-off
• Use special antialiasing filters that have sharp roll-off
Ideal Filter Real-World Filter
FrequencyNyquist0.0
1.0
V outV in
0.0
1.0
V outV in
FrequencyCutoff(3-dB down)
Passband
Columbia UniversityMechanical Engineering
Control Lab Signal Processing Lab35
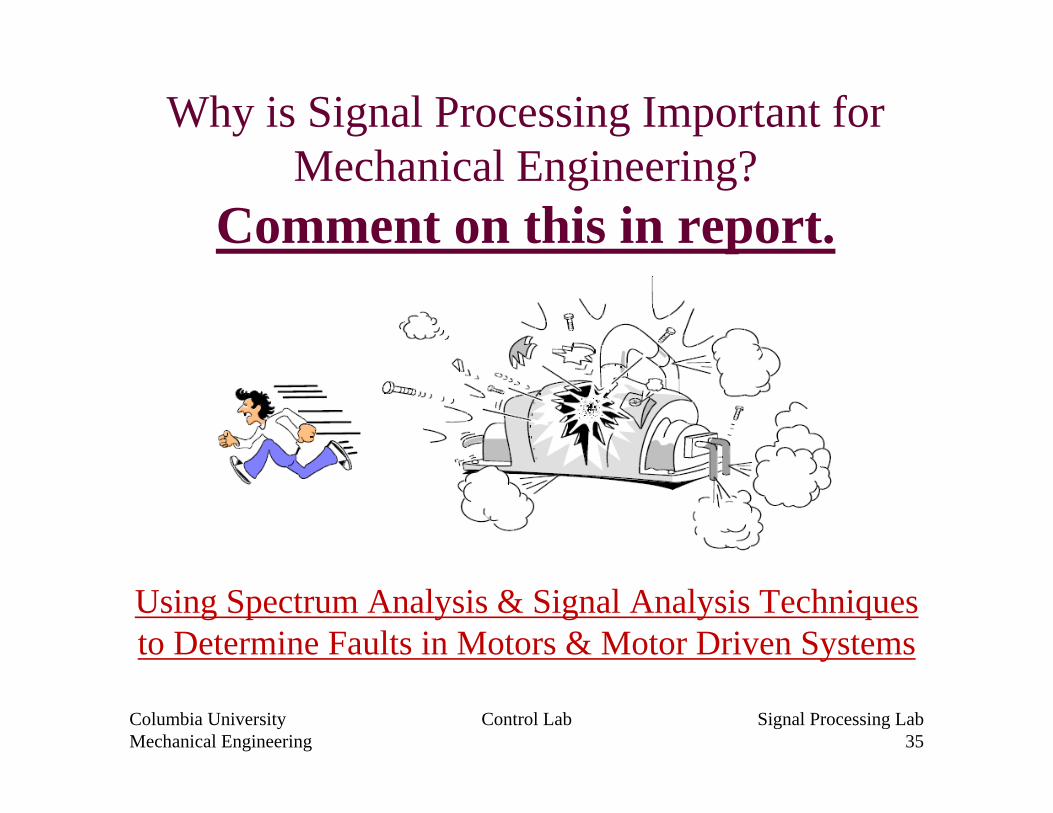
Why is Signal Processing Important for Mechanical Engineering?
Comment on this in report.
Using Spectrum Analysis & Signal Analysis Techniques to Determine Faults in Motors & Motor Driven Systems
Columbia UniversityMechanical Engineering
Control Lab Signal Processing Lab36
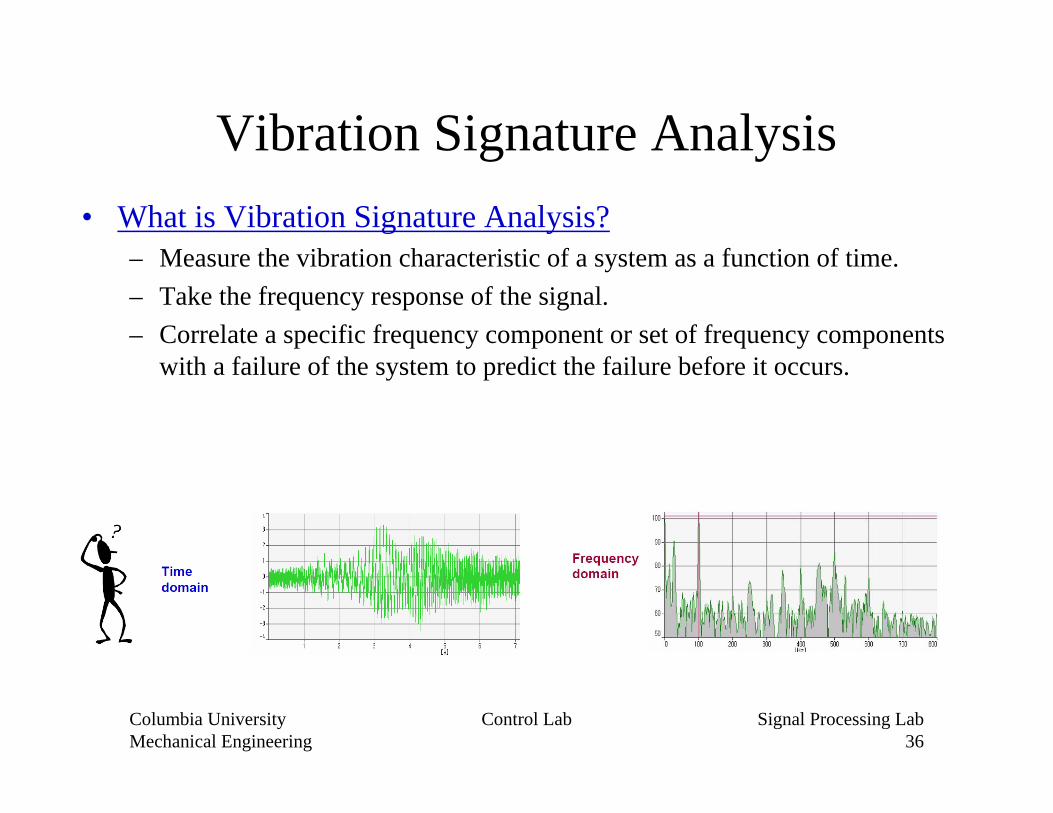
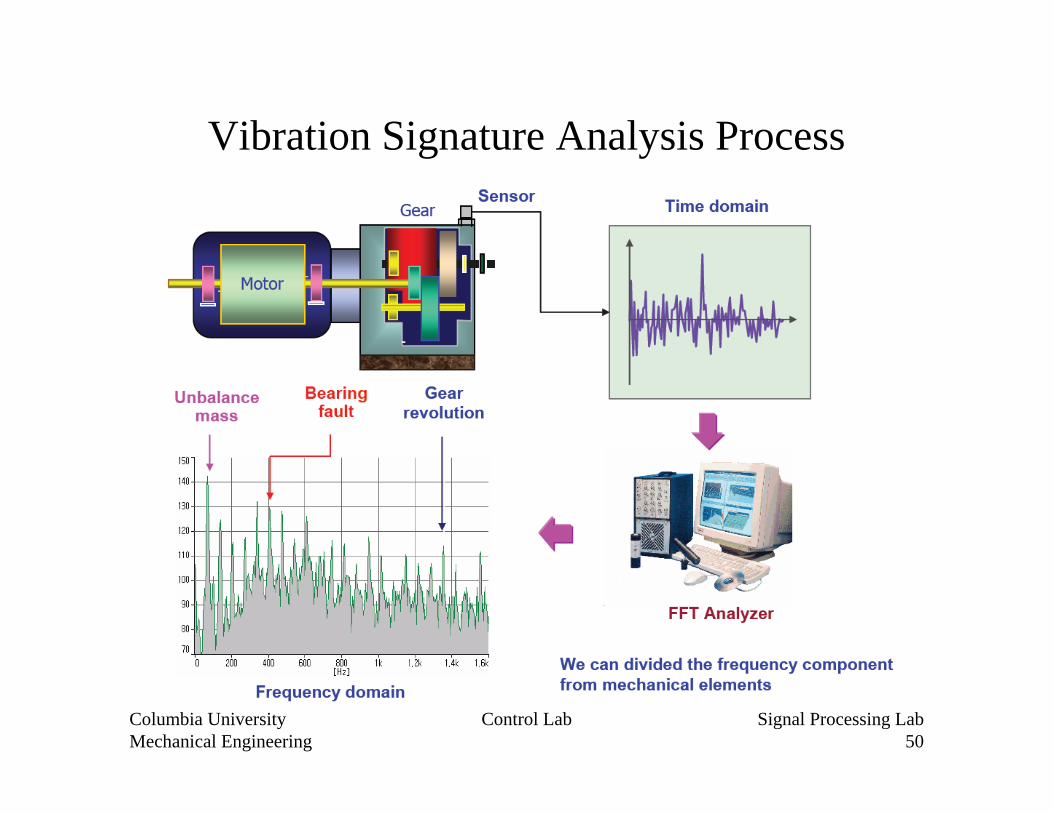
Vibration Signature Analysis• What is Vibration Signature Analysis?
– Measure the vibration characteristic of a system as a function of time.– Take the frequency response of the signal.– Correlate a specific frequency component or set of frequency components
with a failure of the system to predict the failure before it occurs.
Columbia UniversityMechanical Engineering
Control Lab Signal Processing Lab37
What is Vibration?
• Vibration : Any motion that repeats itself after an interval of time is called a vibration or oscillation.
• The swinging of a pendulum and the motion of a plucked string are typical examples of vibration.
• For a motor driven system, the vibration characteristic can give an indication of impending system failure.
Columbia UniversityMechanical Engineering
Control Lab Signal Processing Lab38
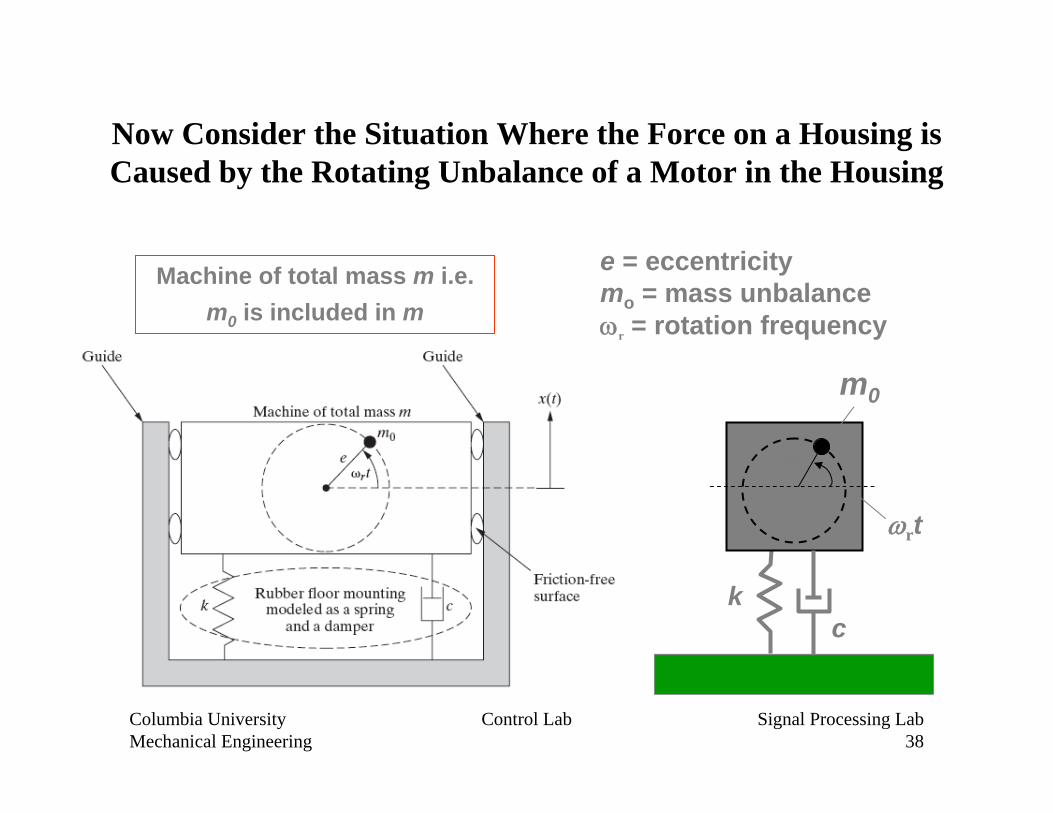
Now Consider the Situation Where the Force on a Housing is Caused by the Rotating Unbalance of a Motor in the Housing
e = eccentricitymo = mass unbalancer = rotation frequency
Machine of total mass m i.e. m0 is included in m
m0
kc
e
rt
Columbia UniversityMechanical Engineering
Control Lab Signal Processing Lab39
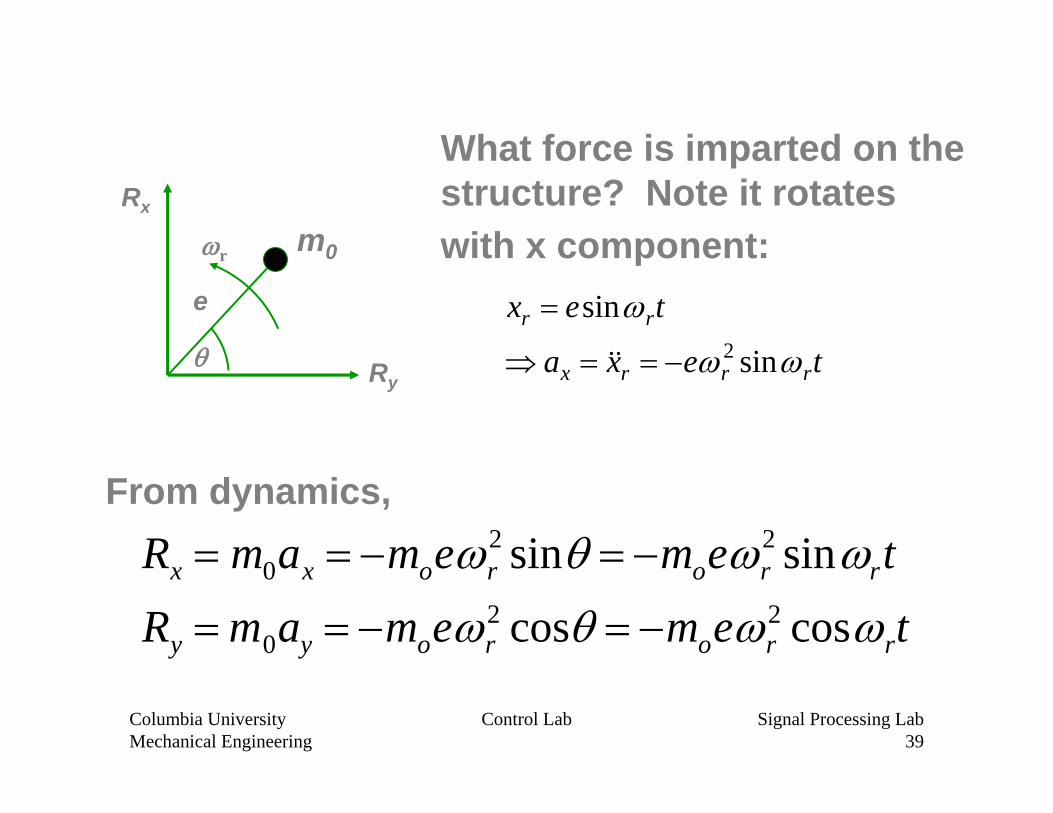
What force is imparted on the structure? Note it rotateswith x component:
From dynamics,Rx m0ax moer
2 sin moer2 sinrt
Ry m0ay moer2 cos moer
2 cosrt
e
m0
Rx
Ry
r
texa
tex
rrrx
rr
sin
sin2
Columbia UniversityMechanical Engineering
Control Lab Signal Processing Lab40
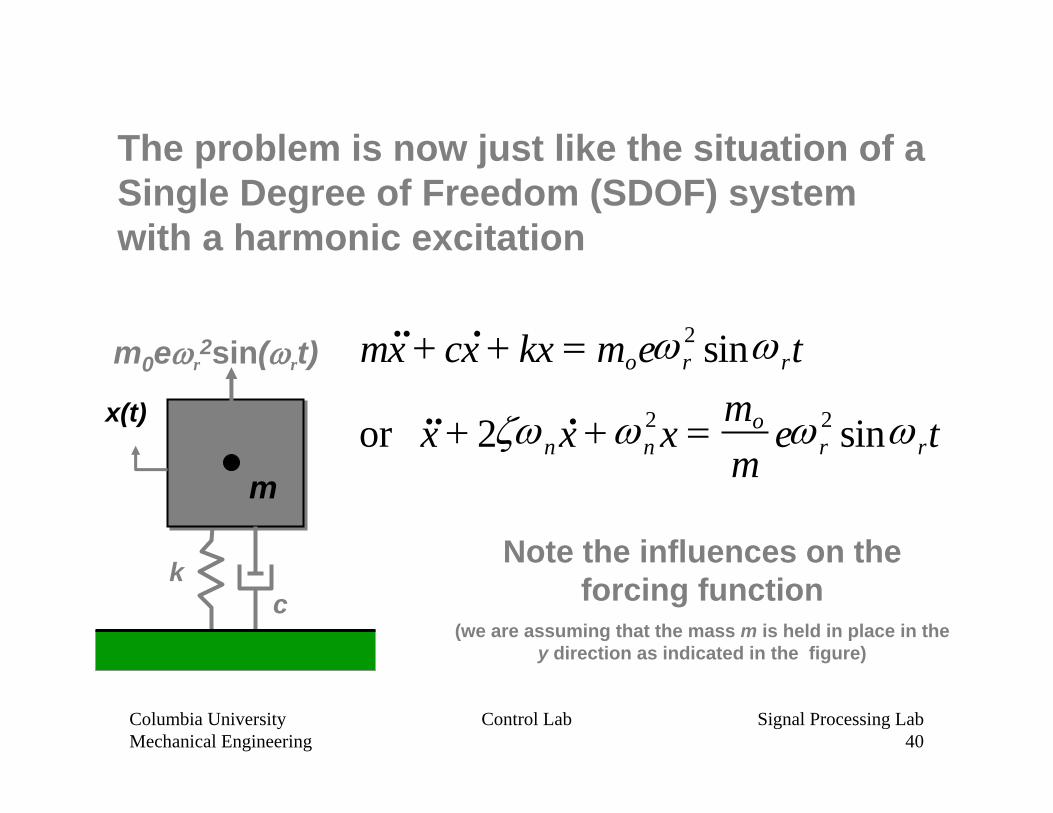
The problem is now just like the situation of a Single Degree of Freedom (SDOF) system with a harmonic excitation
Note the influences on the forcing function
(we are assuming that the mass m is held in place in the y direction as indicated in the figure)
m0er2sin(rt)
kc
x(t)
mxx
xxm c kx moe r2 sin rt
or 2n n2x mo
me r
2 sin rt
..
..
.
.
Columbia UniversityMechanical Engineering
Control Lab Signal Processing Lab41
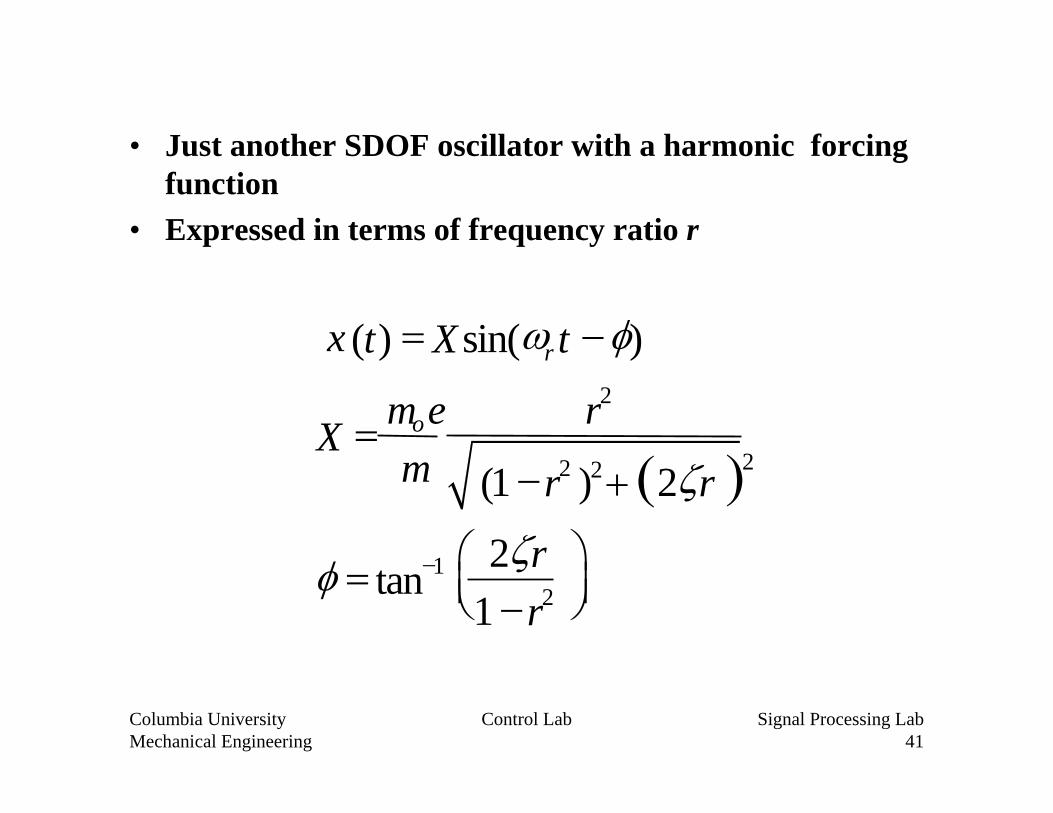
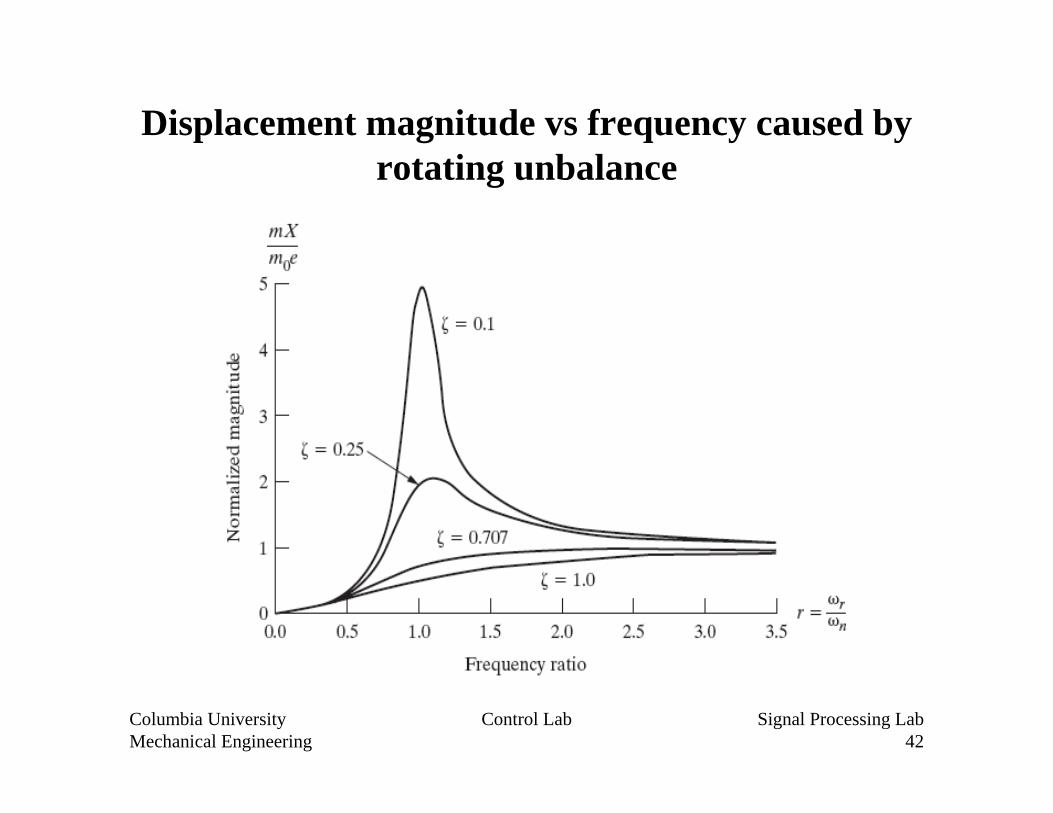
• Just another SDOF oscillator with a harmonic forcing function
• Expressed in terms of frequency ratio r
x (t) Xsin(r t )
X moem
r2
(1 r2 )2 2r 2
tan1 2r1 r2
Columbia UniversityMechanical Engineering
Control Lab Signal Processing Lab42
Displacement magnitude vs frequency caused by rotating unbalance
Columbia UniversityMechanical Engineering
Control Lab Signal Processing Lab43
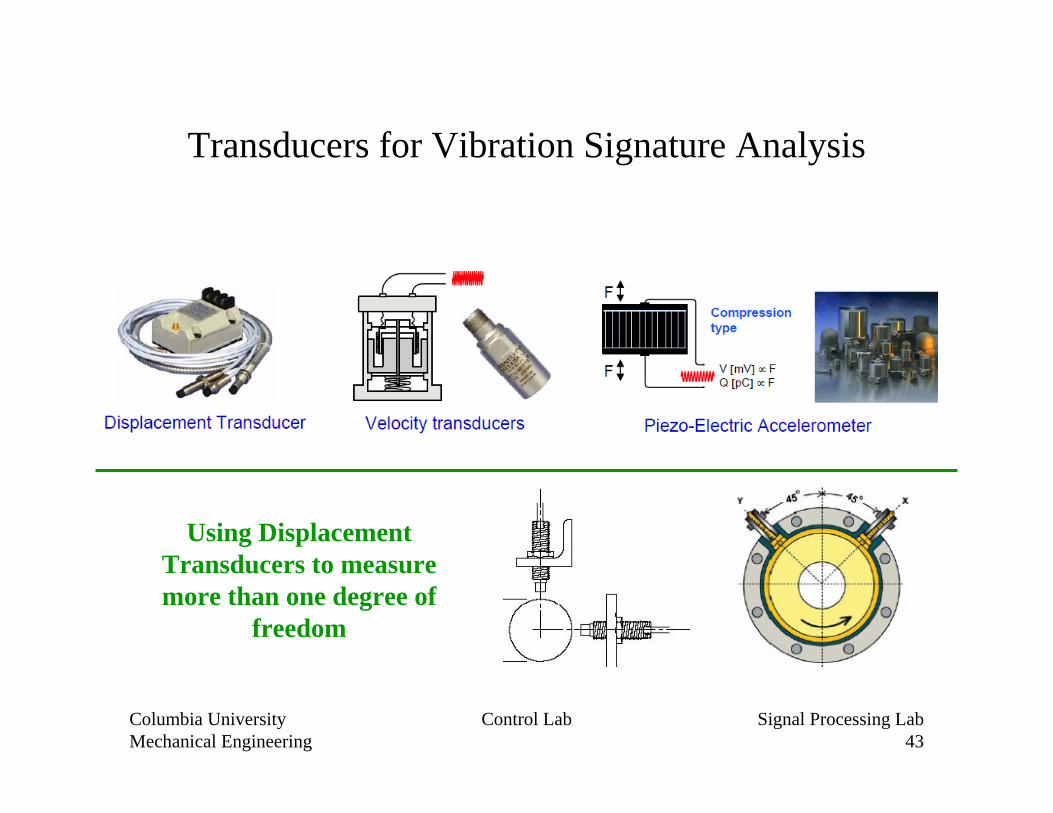
Transducers for Vibration Signature Analysis
Using Displacement Transducers to measure more than one degree of
freedom
Columbia UniversityMechanical Engineering
Control Lab Signal Processing Lab44
• Displacement Transducers– Measures the displacement of the housing– Non-contact type are typically capacitive or inductive (eddy
current) essentially measuring the change in air gap of a capacitor or magnetic circuit
– Contact type can be resistive or LVDTs (Linear Variable Differential Transformer)
– Capacitive, inductive and LVDT require electronic processing of the signals
– Good for measuring low frequency vibrations– Very limited output for low amplitude high frequency
vibrations
Columbia UniversityMechanical Engineering
Control Lab Signal Processing Lab45
• Accelerometers– Measures the acceleration of the housing– Piezoelectric type measures the force produced by an
accelerating mass (seismic mass) – cannot measure DC acceleration
– MEMS type often measure the displacement of the seismic mass mounted on a cantilever beam using a non-contact (capacitive or inductive) displacement transducer – can be used to measure DC
– Requires electronic processing of the signals– Good for measuring high frequency vibrations– Very limited output for low frequency vibrations (unless high
amplitude)
Columbia UniversityMechanical Engineering
Control Lab Signal Processing Lab46
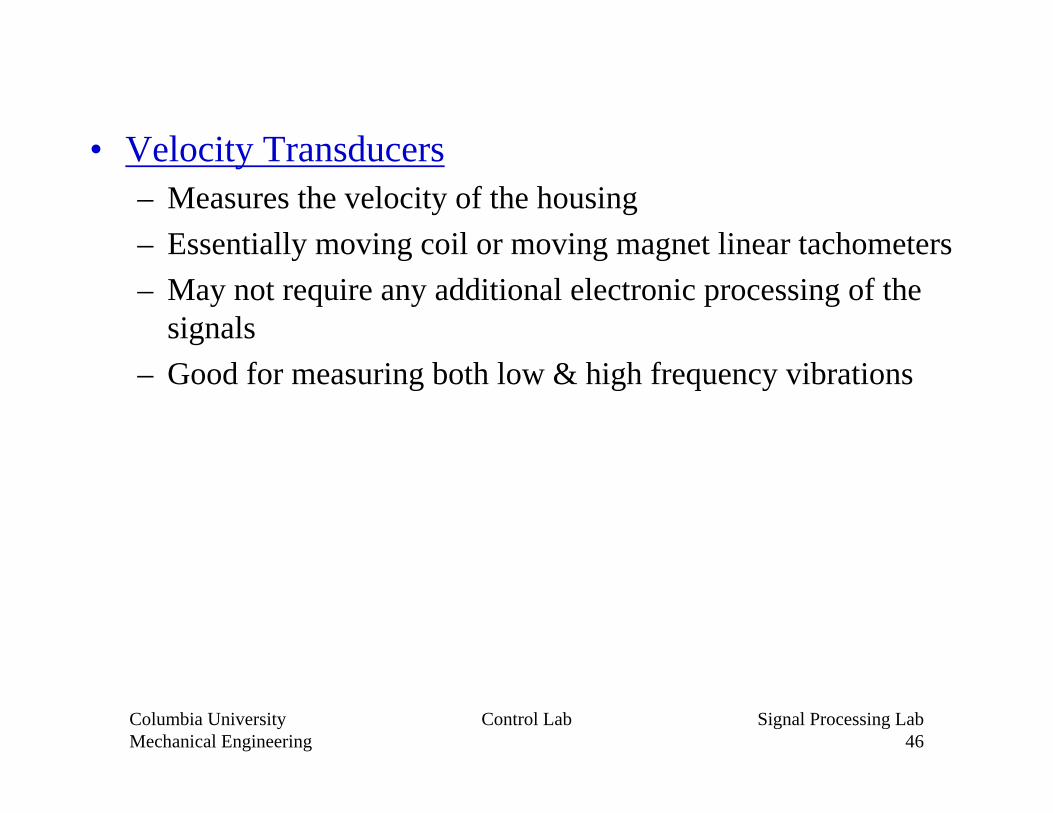
• Velocity Transducers– Measures the velocity of the housing– Essentially moving coil or moving magnet linear tachometers– May not require any additional electronic processing of the
signals– Good for measuring both low & high frequency vibrations
Columbia UniversityMechanical Engineering
Control Lab Signal Processing Lab47
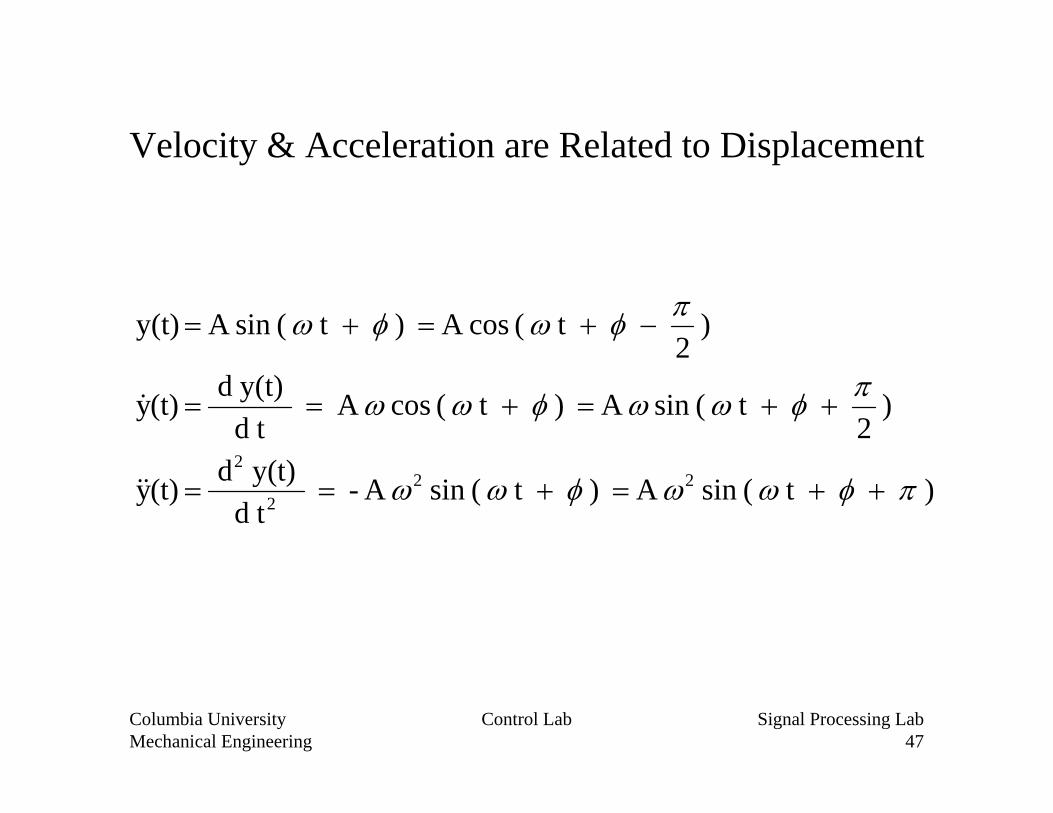
Velocity & Acceleration are Related to Displacement
) t ( sin A ) t ( sin A- td
y(t)d (t)y
) 2
t ( sin A ) t ( cos A td
y(t)d (t)y
) 2
t ( cos A ) t ( sin A y(t)
222
2
Columbia UniversityMechanical Engineering
Control Lab Signal Processing Lab48
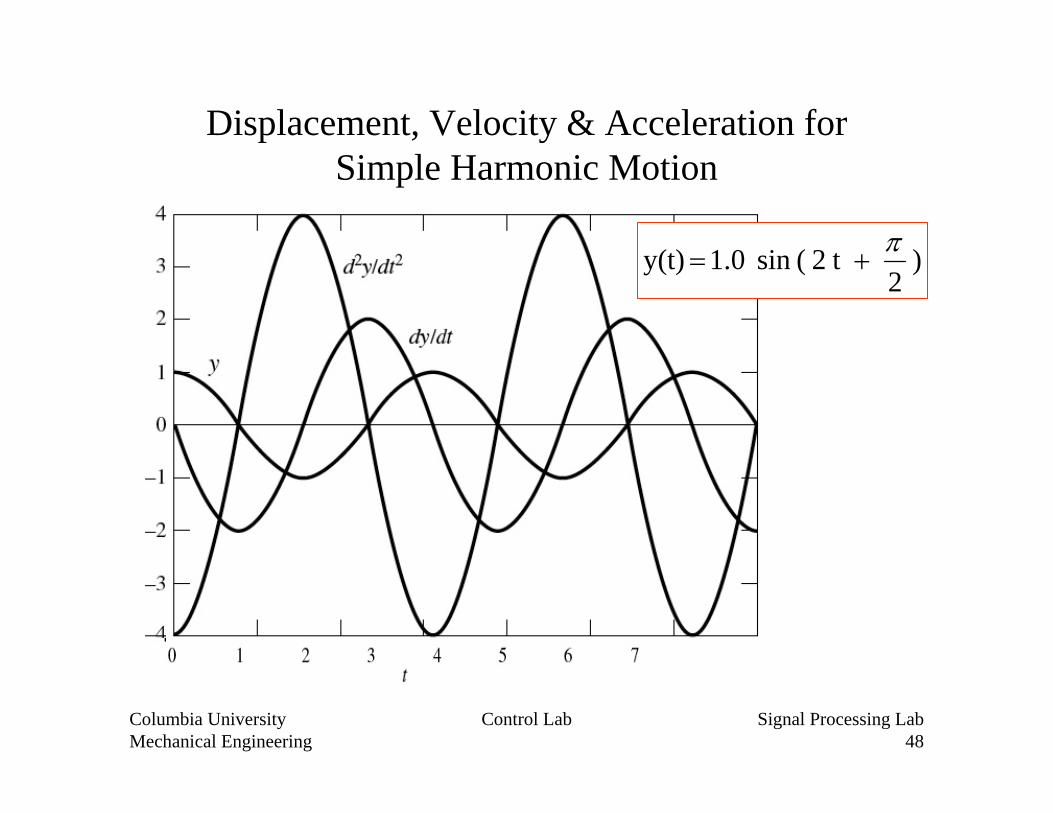
Displacement, Velocity & Acceleration forSimple Harmonic Motion
) 2
t 2 ( sin 1.0 y(t)
Columbia UniversityMechanical Engineering
Control Lab Signal Processing Lab49
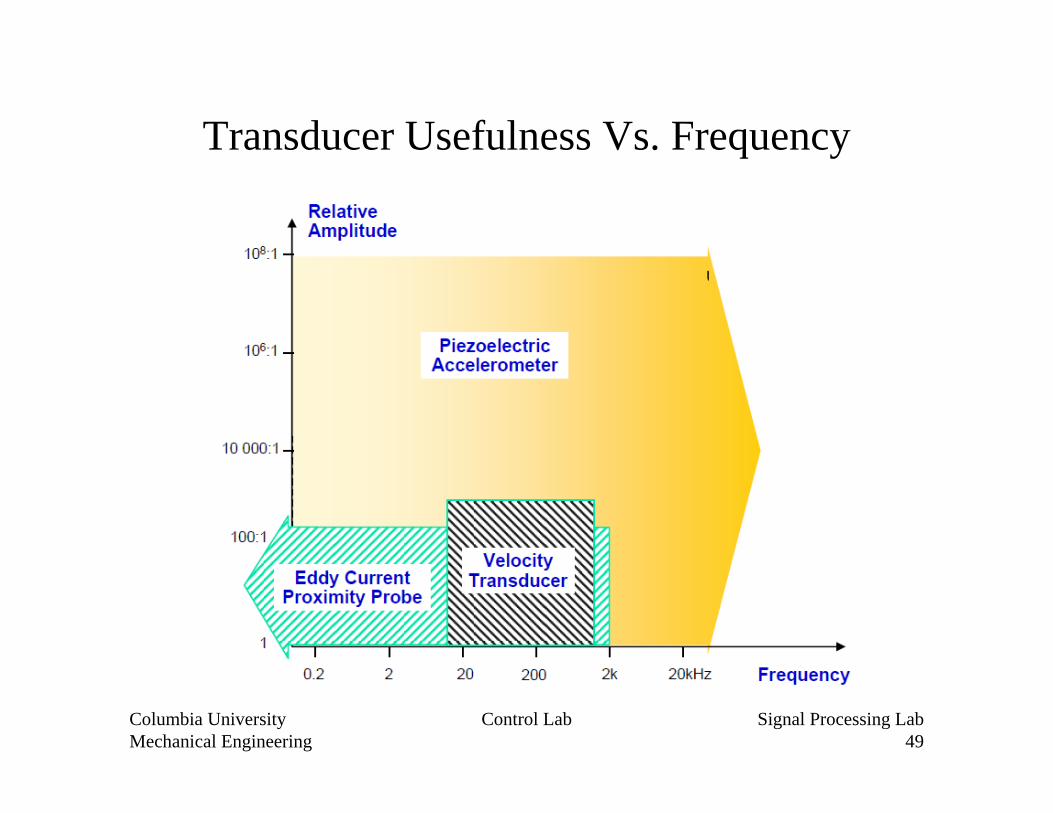
Transducer Usefulness Vs. Frequency
Columbia UniversityMechanical Engineering
Control Lab Signal Processing Lab50
Vibration Signature Analysis Process
Columbia UniversityMechanical Engineering
Control Lab Signal Processing Lab51
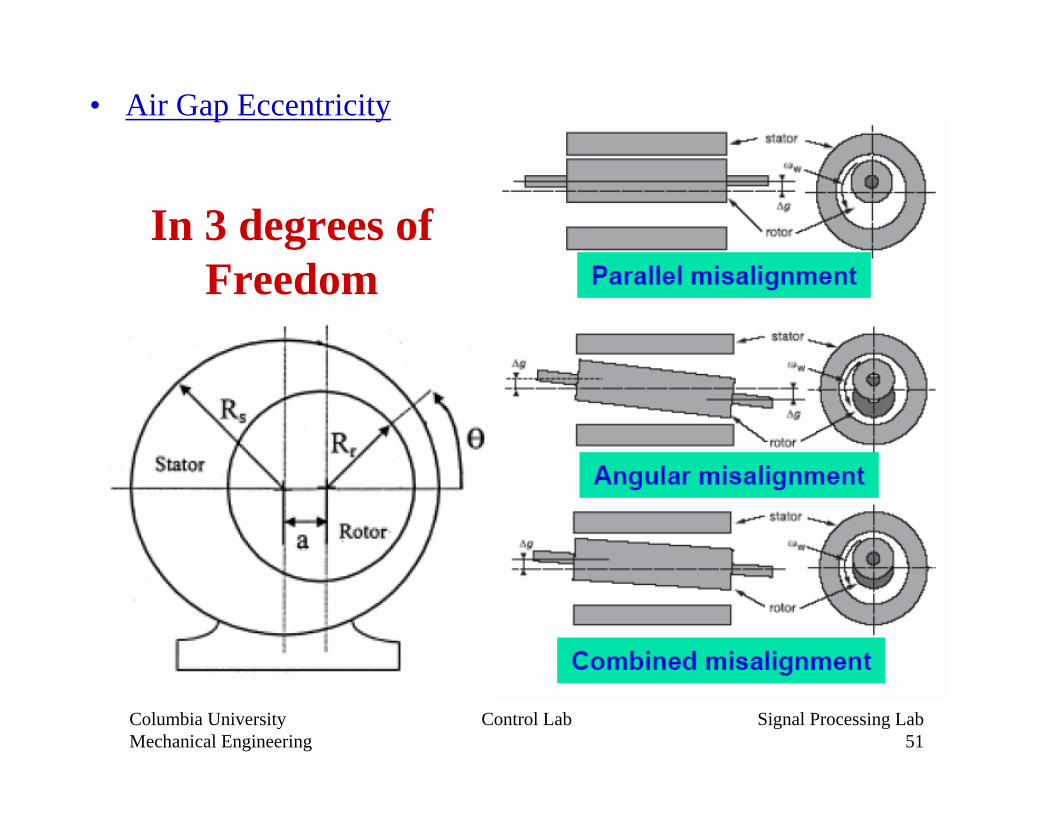
• Air Gap Eccentricity
In 3 degrees of Freedom
Columbia UniversityMechanical Engineering
Control Lab Signal Processing Lab52
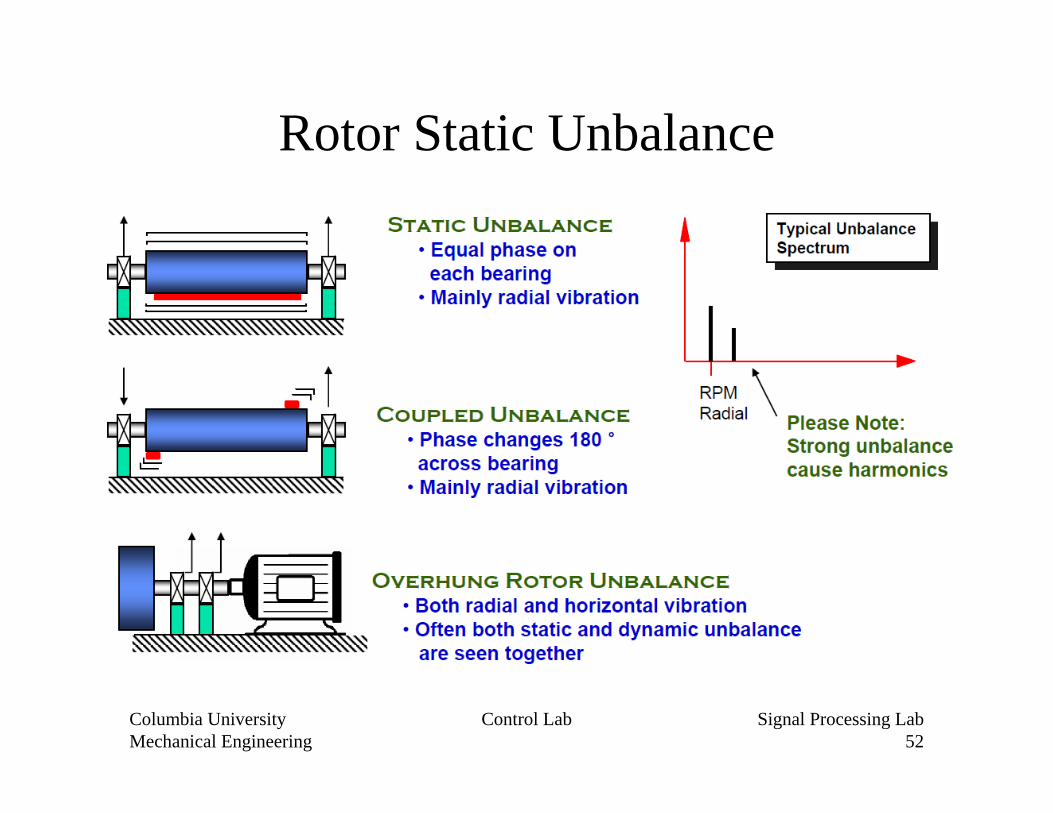
Rotor Static Unbalance
Columbia UniversityMechanical Engineering
Control Lab Signal Processing Lab53
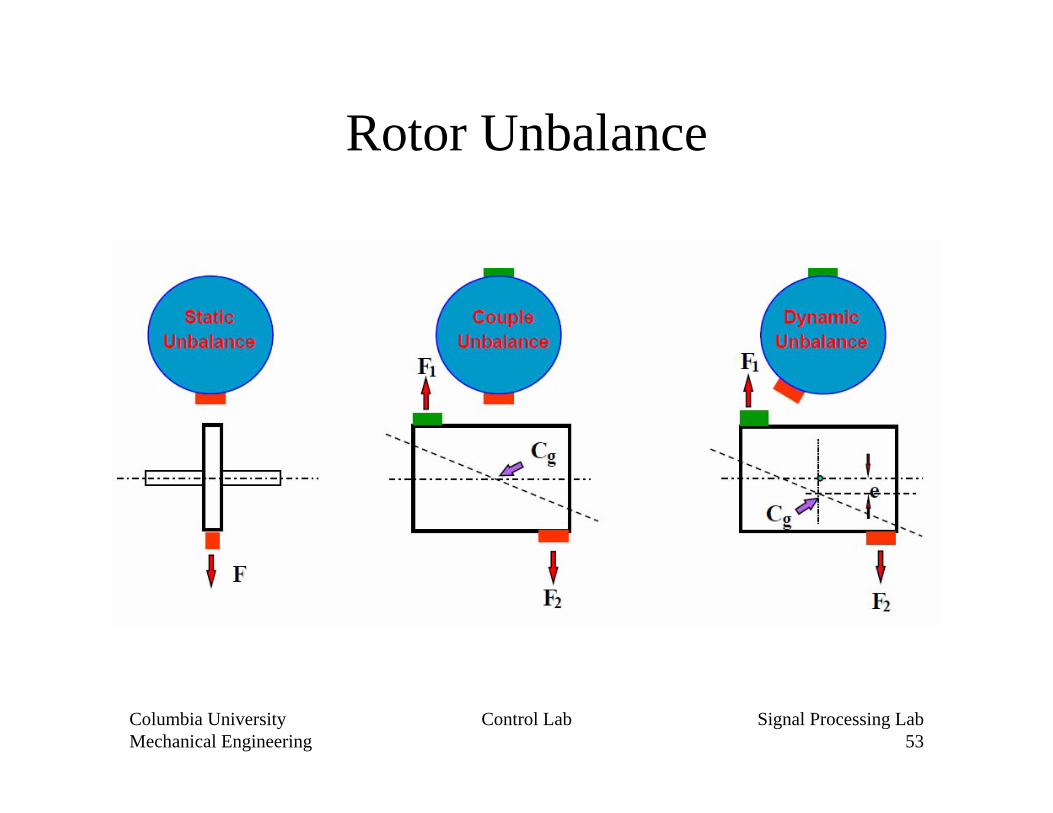
Rotor Unbalance