Embed Size (px)
Citation preview
Single-Entity-Single-RelationQuestion Answering with Minimal
Annotation
by
Zhongyu Peng
A thesispresented to the University of Waterloo
in fulfillment of thethesis requirement for the degree of
Master of Mathematicsin
Computer Science
Waterloo, Ontario, Canada, 2016
c© Zhongyu Peng 2016

I hereby declare that I am the sole author of this thesis. This is a true copy of the thesis,including any required final revisions, as accepted by my examiners.
I understand that my thesis may be made electronically available to the public.
ii

Abstract
We present a novel bag-of-words based approach that automatically constructs a seman-tic parsing based question answering (QA) system tailored to single-entity-single-relationquestions. Given a large community QA pair corpus and a knowledge base, our approachuses knowledge base entries to supervise relation extraction from the corpus, reduces noisein the extracted data via unsupervised clustering, and learns to identify each relation’squestion patterns. We implement the approach on a large Chinese corpus with little an-notation, which we believe is one of the first of its kind. Experiments show that ourimplementation manages to answer questions in test cases independent of the corpus withrelatively high accuracy and to avoid answering questions beyond its scope, achieving ahigh accuracy on answered questions.
iii
Acknowledgements
I would first like to thank my supervisor, Dr. Ming Li. He is available for help at everystage of my graduate study. His guidance and support made this thesis possible.
I would also like to thank the readers of my thesis, Dr. Grant Weddell and Dr.Chrysanne DiMarco, for reviewing my work.
Special thanks to Anqi Cui and Borui Ye, who gave me lots of advice and helpedannotating the data used in this thesis.
Finally, I must express my very profound gratitude towards my parents. Without theirencouragement and support throughout my years of study, none of my accomplishmentswould have been possible.
iv

Dedication
This is dedicated to my parents whose unwavering support sustains me through.
v

Table of Contents
List of Tables viii
List of Figures ix
1 Introduction 1
2 Related Work 3
2.1 Question Answering . . . . . . . . . . . . . . . . . . . . . . . . . . . . . . . 3
2.2 Relation Extraction . . . . . . . . . . . . . . . . . . . . . . . . . . . . . . . 5
3 Approach 7
3.1 Overview . . . . . . . . . . . . . . . . . . . . . . . . . . . . . . . . . . . . . 7
3.2 Question Pattern Extraction . . . . . . . . . . . . . . . . . . . . . . . . . . 8
3.3 Noise Reduction . . . . . . . . . . . . . . . . . . . . . . . . . . . . . . . . . 10
3.4 Pattern Evaluation and Model Selection . . . . . . . . . . . . . . . . . . . 13
3.5 Question Parsing and Answering . . . . . . . . . . . . . . . . . . . . . . . 14
4 Data and Implementation 15
4.1 Overview . . . . . . . . . . . . . . . . . . . . . . . . . . . . . . . . . . . . . 15
4.2 Data . . . . . . . . . . . . . . . . . . . . . . . . . . . . . . . . . . . . . . . 15
4.3 Experiment Environment . . . . . . . . . . . . . . . . . . . . . . . . . . . . 17
4.4 Question Pattern Extraction . . . . . . . . . . . . . . . . . . . . . . . . . . 17
vi

4.5 Noise Reduction . . . . . . . . . . . . . . . . . . . . . . . . . . . . . . . . . 19
4.6 Pattern Evaluation and Model Selection . . . . . . . . . . . . . . . . . . . 22
4.7 Question Parsing and Answering . . . . . . . . . . . . . . . . . . . . . . . 28
5 Evaluation 30
5.1 Overview . . . . . . . . . . . . . . . . . . . . . . . . . . . . . . . . . . . . . 30
5.2 Noise Reduction . . . . . . . . . . . . . . . . . . . . . . . . . . . . . . . . . 30
5.3 System Parameters . . . . . . . . . . . . . . . . . . . . . . . . . . . . . . . 32
5.4 Answer Triggering . . . . . . . . . . . . . . . . . . . . . . . . . . . . . . . 32
5.5 Question Coverage . . . . . . . . . . . . . . . . . . . . . . . . . . . . . . . 33
5.6 Run Time . . . . . . . . . . . . . . . . . . . . . . . . . . . . . . . . . . . . 38
6 Discussion 42
7 Conclusion 48
References 50
vii
List of Tables
5.1 Average precision, average recall, average f1-measure, and Pearson produce-moment correlation coefficient (Pearson’s r) between f1-measure and num-ber of extracted questions for different typed relations in noise reductioncomponent. . . . . . . . . . . . . . . . . . . . . . . . . . . . . . . . . . . . 31
5.2 Statistics of SystemR, Solr, and basic configuration of our system on theQA test cases. . . . . . . . . . . . . . . . . . . . . . . . . . . . . . . . . . . 37
5.3 Statistics of our system with θmodel = 0.6, θanswer = 0.6 and different ntreeand rnoise values on the QA test cases. . . . . . . . . . . . . . . . . . . . . 39
5.4 Statistics of our system with ntree = 25, rnoise = 10%, θanswer = 0.6 anddifferent θmodel values on the QA test cases. . . . . . . . . . . . . . . . . . . 39
5.5 Statistics of our system with ntree = 25, rnoise = 10%, θmodel = 0.6 anddifferent θanswer values on the QA test cases. . . . . . . . . . . . . . . . . . 40
5.6 System’s average run time per question and number of relations in the sys-tem with different ntree, rnoise, θmodel values on the QA test cases. . . . . . 41
6.1 Answer triggering and question coverage statistics of our system with θmodel =0.6, θanswer = 0.6 and different ntree and rnoise values. . . . . . . . . . . . . 46
viii
List of Figures
4.1 Relations and corresponding number of questions . . . . . . . . . . . . . . 20
4.2 Relations and corresponding number of extracted questions, non-noise ques-tions . . . . . . . . . . . . . . . . . . . . . . . . . . . . . . . . . . . . . . . 22
4.3 Relations and corresponding average f1-measures on questions against relatedrelations’ questions during two independent cross validation runs with thesame parameters. . . . . . . . . . . . . . . . . . . . . . . . . . . . . . . . . 24
4.4 Relations and corresponding average f1-measures on questions against relatedrelations’ questions with rnoise = 10% and different ntree values. . . . . . . 24
4.5 Relations and corresponding average f1-measures on questions against noisesample with rnoise = 10% and different ntree values. . . . . . . . . . . . . . 25
4.6 Relations and corresponding average f1-measures on questions against noisesample with ntree = 25 and different rnoise values. . . . . . . . . . . . . . . 26
4.7 Relations and corresponding average f1-measures on questions against noisesample with rnoise = 20% and different ntree values. . . . . . . . . . . . . . 26
4.8 Average f1-measures on questions against noise sample and on questionsagainst related relations’ questions with 25 trees and 10% noise samplingrate. . . . . . . . . . . . . . . . . . . . . . . . . . . . . . . . . . . . . . . . 27
5.1 Answer triggering accuracy and probability threshold for answer selectionwith different values of ntree, rnoise, θmodel, and θanswer. . . . . . . . . . . . 34
5.2 Answer triggering accuracy and f1 measure threshold for model selectionwith different values of ntree, rnoise, θmodel, and θanswer. . . . . . . . . . . . 35
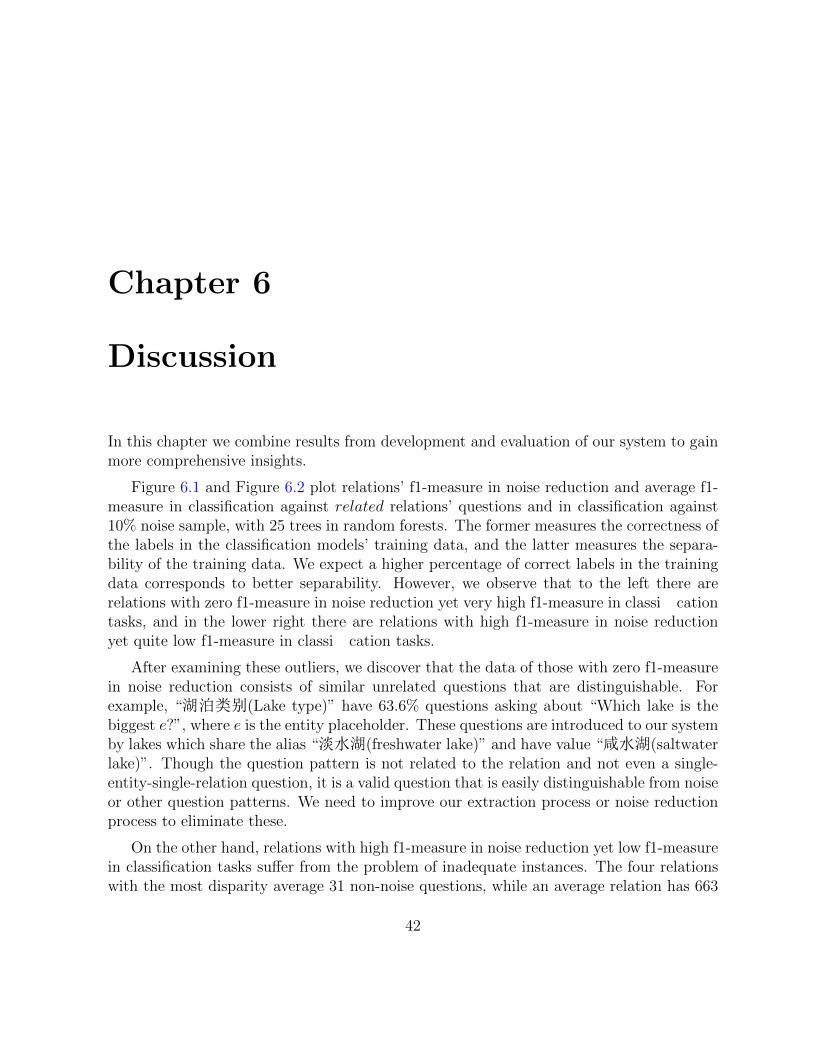
6.1 Relations’ f1-measure in noise reduction and average f1-measure in classifi-cation against 10% noise sample with 25 trees in random forests. . . . . . . 43
ix

6.2 Relations’ f1-measure in noise reduction and average f1-measure in classifi-cation against related relations’ questions with 25 trees in random forests. 43
6.3 Relations’ accuracy on question coverage test cases at the basic configurationof our system and corresponding f1-measure on noise reduction. . . . . . . 44
6.4 Relations’ accuracy on question coverage test cases at the basic configurationof our system and minimum of average f1-measure in classification against10% noise sample and in related relations’ questions with 25 trees in randomforests. . . . . . . . . . . . . . . . . . . . . . . . . . . . . . . . . . . . . . . 45
6.5 Answer triggering and question coverage statistics of our system with ntree =25, rnoise = 10%, θmodel = 0.6 and different θanswer values. . . . . . . . . . . 46
6.6 Answer triggering and question coverage statistics of our system with ntree =25, rnoise = 10%, θanswer = 0.6 and different θmodel values. . . . . . . . . . . 47
7.1 Relationships between community QA questions, single-entity-single-relationquestions, and questions that our implementation has learned to answer. . 48
x

Chapter 1
Introduction
Wolfram Alpha 1 is an answer engine developed by Wolfram Research. It can answerfactual queries directly with answers from its structured knowledge bases. For example,query “Where’s Canada’s capital?” returns answer “Ottawa”. It is used to power Apple’sintelligent personal assistant, Siri, and Samsung’s counterpart, S Voice.
Yet when asked the same question but in Chinese, “加拿大的首都在哪里? (Where’sCanada’s capital?)”, Wolfram Alpha does not know how to interpret the question 2. EvenSiri, which supports the Chinese language, cannot answer the question and returns a list ofsearch results from the Web instead. We are motivated to build an open domain questionanswering (QA) system that can answer such questions in Chinese.
Questions such as “NSA的总部在哪里? (Where’s NSA’s headquarters?)” and “奥巴马什么时候出生的? (When was Obama born?)” are known as single-entity-single-relation questions, as each question is composed of an entity mention and a binary relationdescription. It is a subset of factoid questions and is observed to be the most common typeof questions in various community QA sites [13]. We focus on answering such questions.
Automatic QA systems that return the direct and exact answers to natural languagequestions have been in the limelight of research since 1960s and 1970s (e.g., Baseball[14], Lunar [30]). Though early systems are limited to closed-domains due to lack ofknowledge sources, recently there has been huge growth in open-domain systems since thedevelopment of large scale knowledge bases, such as DBpedia [1], Freebase [5], ReVerb [12],and Yago2 [18] in the past decade. The advent of publicly available large scale datasets,
1Wolfram Alpha, www.wolframalpha.com2Wolfram Alpha doesn’t know how to interpret your input, www.wolframalpha.com/input/?i=加拿大
的首都在哪里, retrieved on July 9, 2016.
1
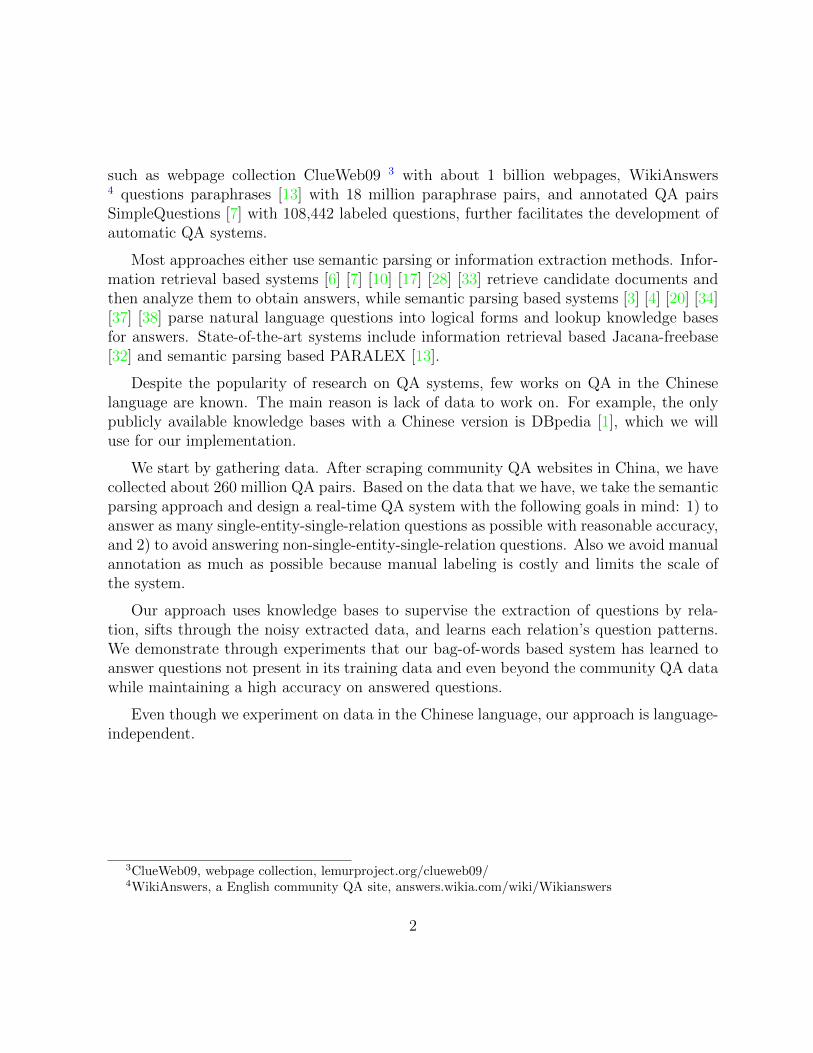
such as webpage collection ClueWeb09 3 with about 1 billion webpages, WikiAnswers4 questions paraphrases [13] with 18 million paraphrase pairs, and annotated QA pairsSimpleQuestions [7] with 108,442 labeled questions, further facilitates the development ofautomatic QA systems.
Most approaches either use semantic parsing or information extraction methods. Infor-mation retrieval based systems [6] [7] [10] [17] [28] [33] retrieve candidate documents andthen analyze them to obtain answers, while semantic parsing based systems [3] [4] [20] [34][37] [38] parse natural language questions into logical forms and lookup knowledge basesfor answers. State-of-the-art systems include information retrieval based Jacana-freebase[32] and semantic parsing based PARALEX [13].
Despite the popularity of research on QA systems, few works on QA in the Chineselanguage are known. The main reason is lack of data to work on. For example, the onlypublicly available knowledge bases with a Chinese version is DBpedia [1], which we willuse for our implementation.
We start by gathering data. After scraping community QA websites in China, we havecollected about 260 million QA pairs. Based on the data that we have, we take the semanticparsing approach and design a real-time QA system with the following goals in mind: 1) toanswer as many single-entity-single-relation questions as possible with reasonable accuracy,and 2) to avoid answering non-single-entity-single-relation questions. Also we avoid manualannotation as much as possible because manual labeling is costly and limits the scale ofthe system.
Our approach uses knowledge bases to supervise the extraction of questions by rela-tion, sifts through the noisy extracted data, and learns each relation’s question patterns.We demonstrate through experiments that our bag-of-words based system has learned toanswer questions not present in its training data and even beyond the community QA datawhile maintaining a high accuracy on answered questions.
Even though we experiment on data in the Chinese language, our approach is language-independent.
3ClueWeb09, webpage collection, lemurproject.org/clueweb09/4WikiAnswers, a English community QA site, answers.wikia.com/wiki/Wikianswers
2

Chapter 2
Related Work
2.1 Question Answering
Many studies have been done on question answering. Most methods fall into two categories:information retrieval based and semantic parsing based.
Information retrieval based systems retrieve candidate documents and then analyzethem to obtain answers. Early systems, such as AnswerBus [40] and MULDER [21], usefeatures from questions to generate queries for Web search engines (e.g., Google1, Yahoo2),retrieve short passages, extract answer candidates, and rank answers. The key to goodresults is query generation and answer ranking. For example, MULDER would generateadditional query by replacing the adjective in the question with its attribute noun, andpick the best candidate answer by clustering and voting. Current approaches for answerselection include syntactic analysis (e.g., tree-edit distance based tree matching method[10], tree kernel fucntion together with logeistic regression model with syntactic features ofedit sequences [17]), lexical semantic model (e.g., pairing semantically related words basedon word relations [33]), and deep learning neural networks (e.g., stacked bidirectional longshort-term memory network with keyword matching [28], embedding model that embedsquestions and corresponding answers close to each other [6]).
Jacana-freebase [32] is one of the state-of-the-art information retrieval-based systems.It uses Freebase Search API 3 to retrieve topic graphs from Freebase [5] as candidate
1Google, search engine, www.google.com2Yahoo!, search engine, www.yahoo.com3Search overview for Freebase API, developers.google.com/freebase/v1/search-overview.
3

documents. It converts the dependency parse of the question into a feature graph anduses rules to extract question features. Also it uses relations and properties of nodes inretrieved topic graphs as knowledge base features. To rank candidate questions, it feeds theextracted question features and the extracted knowledge base features to a binary classifierthat outputs correct or incorrect.
On the other hand, semantic parsing based systems usually work together with knowl-edge bases. They parse natural language questions into logical forms and lookup knowledgebases for answers. Generally, to answer a question, they decompose questions, map phrasesto knowledge base items (e.g., entities, relations, queries), generate knowledge base queries,pick the top ranked query, and retrieve the answer. Early efforts [20] [37] [38] train theparser with English sentences paired with manually annotated logical forms as supervi-sion, while recent works [3] [4] use question-answer pairs as weak supervision to avoid theexpensive manual annotation.
PARALEX [13] is one of the first general open-domain QA systems that is scaled tolarge knowledge bases. It maps questions to formal queries over ReVerb [12] extractions,a database consisting of relation triples extracted from ClueWeb09 4. The model used togenerate the database query includes a lexicon used to map natural language patterns todatabase items, and a linear ranking function used to rank the queries derived from theinput question. The system derives a query by decomposing the question into an entitypattern, a relation pattern, and a question pattern, and then applying the lexicon. Thelexicon is induced by applying learned word alignments on paraphrases of questions fromWikiAnswers 5. Though the development of the system does not involve manual annotationof questions, it requires a seed lexicon consisting of 16 question templates (e.g. What isthe r of e? r is a database relation, e is a database entity).
Inspired by PARALEX, Yih et al. [34] build a system that matches natural languagepatterns with database items via a semantic similarity function instead of a lexicon, fromthe same data that PARALEX uses. At the core of the system is a semantic similaritymodel based on convolutional neural networks trained on the WikiAnswers paraphrases.Given a question, the system decomposes it into two disjoint parts, an entity mention anda relation pattern, by enumerating all possible combinations. The combinations are fedinto the semantic similarity model, mapped to database entity and database relation, andscored. The system then looks up the ReVerb database with the entity and the relationand returns the result as answer.
The major challenge for us to adopt an existing method is lack of data to operate on.
4ClueWeb09, webpage collection, lemurproject.org/clueweb09/5WikiAnswers, a English community QA site, answers.wikia.com/wiki/Wikianswers
4
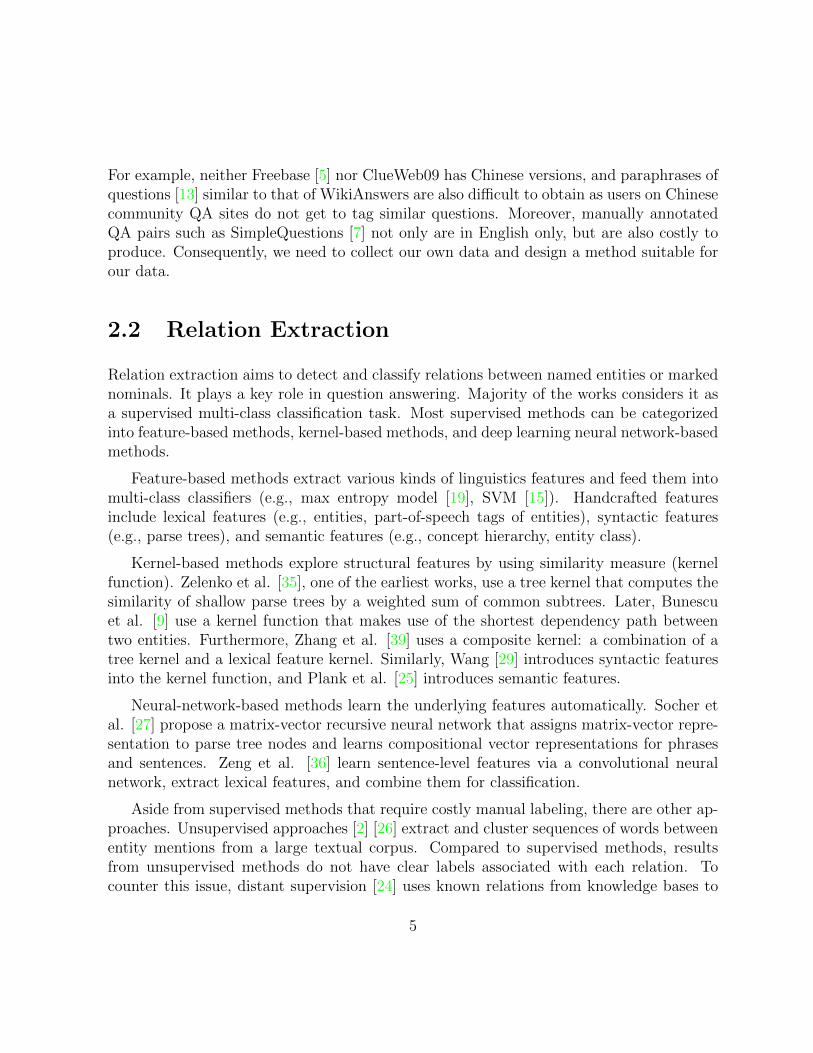
For example, neither Freebase [5] nor ClueWeb09 has Chinese versions, and paraphrases ofquestions [13] similar to that of WikiAnswers are also difficult to obtain as users on Chinesecommunity QA sites do not get to tag similar questions. Moreover, manually annotatedQA pairs such as SimpleQuestions [7] not only are in English only, but are also costly toproduce. Consequently, we need to collect our own data and design a method suitable forour data.
2.2 Relation Extraction
Relation extraction aims to detect and classify relations between named entities or markednominals. It plays a key role in question answering. Majority of the works considers it asa supervised multi-class classification task. Most supervised methods can be categorizedinto feature-based methods, kernel-based methods, and deep learning neural network-basedmethods.
Feature-based methods extract various kinds of linguistics features and feed them intomulti-class classifiers (e.g., max entropy model [19], SVM [15]). Handcrafted featuresinclude lexical features (e.g., entities, part-of-speech tags of entities), syntactic features(e.g., parse trees), and semantic features (e.g., concept hierarchy, entity class).
Kernel-based methods explore structural features by using similarity measure (kernelfunction). Zelenko et al. [35], one of the earliest works, use a tree kernel that computes thesimilarity of shallow parse trees by a weighted sum of common subtrees. Later, Bunescuet al. [9] use a kernel function that makes use of the shortest dependency path betweentwo entities. Furthermore, Zhang et al. [39] uses a composite kernel: a combination of atree kernel and a lexical feature kernel. Similarly, Wang [29] introduces syntactic featuresinto the kernel function, and Plank et al. [25] introduces semantic features.
Neural-network-based methods learn the underlying features automatically. Socher etal. [27] propose a matrix-vector recursive neural network that assigns matrix-vector repre-sentation to parse tree nodes and learns compositional vector representations for phrasesand sentences. Zeng et al. [36] learn sentence-level features via a convolutional neuralnetwork, extract lexical features, and combine them for classification.
Aside from supervised methods that require costly manual labeling, there are other ap-proaches. Unsupervised approaches [2] [26] extract and cluster sequences of words betweenentity mentions from a large textual corpus. Compared to supervised methods, resultsfrom unsupervised methods do not have clear labels associated with each relation. Tocounter this issue, distant supervision [24] uses known relations from knowledge bases to
5
guide the extraction from a large textual corpus. The assumption is that if two entitiesare known to have a known relation in a knowledge base, then any sentence that mentionsthese entities expresses the relation in some way.
Mintz et al. [24] experiment on Freebase to extract relations from Wikipedia. Giventwo entities, the system extracts features from sentences that contain the two entities,aggregate the features into a single feature vector, and feeds it into a multi-class logisticregression classifier. The extracted features include: lexical features (e.g., part-of-speechtags of entities, sequence of words between entities), syntactic features (e.g., dependencypath between entities), and named entity tag features.
6
Chapter 3
Approach
3.1 Overview
In this chapter we describe the methodologies to build a specialized QA system from scratchwith question-answer pairs from community QA sites and entity-relation-value triples fromknowledge bases. The system is designed with the following goals in mind:
• The system should answer as many single-entity-single-relation questions as possiblewith reasonable accuracy.
• The system should not answer questions that do not fall into the single-entity-single-relation category.
Even though our motivation is to build a QA system that can answer questions inChinese language, our approach is independent of the language of the data.
Our system extracts question patterns from community QA sites, evaluates the ex-tracted patterns, and couples them with knowledge bases to answer single-entity-single-relation questions. The basic idea is that similar questions are asking about similar rela-tions. We choose a bag-of-words approach, and there are four major steps:
1. (Offline) Extract single-entity-single-relation questions from community QA datawith the guidance of triples from knowledge base. (Section 3.2)
2. (Offline) Reduce the noise present in the extracted question by clustering. (Sec-tion 3.3)
7
3. (Offline) Evaluate the filtered questions via classification and train models with se-lected data. (Section 3.4)
4. (Online) Parse question and rank potential answers. (Section 3.5)
3.2 Question Pattern Extraction
One major challenge when building a machine learning system is collecting training data.The correctness of the labeling and the quantity of the training data directly impact thesystem performance. However, quality data is often hard to come by, because hand-labeledcorpora is expensive to produce and therefore limited in quantity. This is especially aproblem when the study focuses on the Chinese language, as labeled Chinese corpora isvery scarce.
In our Chinese question-answering case, we need single-entity-single-relation questions,with the mentioned entities and implied relations labeled, in order to learn the variedquestion patterns for each relation. For example, for question “碟中谍是谁拍的? (Whodirected Mission Impossible?)”, the corresponding annotation we would like to have is “碟中谍(Mission Impossible)” as the entity and “导演(director)” as the relation. With suchlabels, we can deduce that “X 是谁拍的? (Who directed X?)” is likely to be asking aboutthe “导演(director)” of X.
We extract the questions with the labels from a corpora of community QA pairs. Distantsupervision [24] is a commonly used technique to generate large amounts of automaticallylabeled training data effectively. It assumes that if an entity-relation-entity triple exists ina knowledge base, then any sentence that contains the pair of entities is likely to expressthe relation in some way. It is a strong assumption and usually introduces wrong labelsinto the training data, hindering the performance of trained models. Also, it is limited torelations between entities in the sense that literals, such as dates, numbers, and strings,are not considered during the extraction process. As a result, data pertaining to relationsthat involve an entity and a literal, e.g. birthday, population, etc. cannot be generated.
To apply the idea of distant supervision to our work, we first extend it to extract QApairs instead of sentences, and to include entity-literal relations:
For an entity-relation-value1 triple in a knowledge base, a QA pair is said to beassociated with the triple if the two following conditions are met:
1A value can be an entity, or a literal
8

1. The question contains the entity but not the value,
2. The answer(s) contain the value.
For each entity-relation-value triple, all questions in associated QA pairs areextracted with labels “entity” and “relation”.
For example, consider the relation triple (“纽约市(New York City)”, “人口(population)”,“8336697”) and the QA pair (“纽约市有多少人? (How many people live in New YorkCity?)”, “据估计,2012年有8336697人住在纽约(According to estimate, in 2012 New YorkCity has a population of 8336697.)”): because the entity appears in the question while thevalue only appears in the answer, the question meets the criteria and is extracted withlabels “纽约市(New York City)” and “人口(population)”.
Because answers on community QA sites vary from few words to several long para-graphs, they tend to carry more information compared to single sentences. As a result,QA pair extraction introduces more noise than sentence extraction. Consider the QA pair(“介绍一下纽约市(Tell me about New York City)”, “纽约市位于纽约州南端,是美国人口最多的城市,常驻人口8336697人,土地面积305平方英里. . . (New York City is locatedat the southern tip of the State of New York. With a population of 8,336,697, it is themost populous city in the United State. It has a land area of 305 square miles. . . ”). Thequestion does not fall into single-entity-single-relation category; however, with the simpleextraction rule stated above, the question would be extracted multiple times and labeledwith relations such as population, location, area, etc.
We mitigate the noise issue by introducing additional constraint. Under the simpleextraction rule, for each extraction, only one entity-relation-value triple is used to guidethe process. Yet in knowledge bases, an entity usually has more than one entity-relation-value triples. Intuitively, if a QA pair can only be associated with one entity-relation-valuetriple, it is more likely to be about the “relation” in the triple. In the “介绍一下纽约市(Tellme about New York City)” example above, if we only extract the question if the QA paircan only be associated with one triple, the question will not be extracted.
We use the following rule to extract questions from community QA pairs:
Given knowledge base K = {(e, r, v)} where (e, r, v) represents an entity-relation-value triple, and community QA data C = {(q, a)} where (q, a) rep-resents a question-answer pair, for an entity-relation-value triple (e, r, v) ∈ Kand an associated QA pair (q, a) ∈ C, we extract question q and label it withentity e and relation r if and only if ∀(e, r′, v′) ∈ K, (e, r′, v′) is associated with(q, a) ⇐⇒ r′ = r and v′ = v.
9
For further processing, we strip the extracted questions of the labeled entities and groupthem by the labeled relations. For example, “纽约市有多少人? (How many people live inNew York City?)” is stored as “e有多少人? (How many people live in e?)” with otherquestions such as “e的人口是多少? (What is the population of e?)” under relation “人口(population)”.
3.3 Noise Reduction
As our data is produced by automatic extraction instead of manual labeling, it is expectedto contain more noise; therefore, noise reduction is a critical step. Consider the triple (“纽约市(New York City)”, “人口(population)”, “8 million”) and the QA pair (“纽约市一套房多少钱? (How much does a house in New York City cost?)”, “8 million”): though thequestion is not asking about the population of New York City, it would be labeled with“New York City” and “population” because the QA pair meets our extraction criteria. Wewant to filter out the mislabeled questions and retain as many different question patternsas possible.
Whether a question is making an inquiry about certain relation is closely related towhether there are many similar questions labeled with the same relation. If several ques-tions with the same relation label have a similar pattern, it is likely that the shared patternis an inquiry template about the relation. Meanwhile, if a question pattern is a popularinquiry about certain relation, many people would use it when they ask about the relation;as a result, the pattern is expected to match several questions in our collected data. Fol-lowing this reasoning, we use clustering for noise reduction. For each relation, we clustersimilar questions together and consider the questions without cluster assignments as noise.
We model sentences as bags of their words and consider two sentences to be similarif their vocabularies overlay: the more words the sentences share, the more similar weconsider them to be. We can measure it by calculating the cosine similarity between twovector representations. Given an indexed vocabulary V , a straightforward bag-of-wordsvector representation of a sentence would be a |V |-entry vector, where i-th entry is thecount of the i-th word of V in the sentence. But in our case calculating similarity directlyon bag-of-words representations is undesirable, mainly for two reasons:
• The Chinese language has tens of thousands of unique characters and millions ofcommon words. As a result, straightforward vector representations of bag-of-wordsmodels are sparse. Moreover, we are calculating similarity measures between short
10
sentences instead of long passages, so it is less likely that two vectors have non-zerovalues on any given component. Due to these factors, we would get coarse-grainedsimilarity measures: because the values on each dimensions are restricted to integervalues, the cosine similarity between a m-word sentence and a n-word sentence canonly be one of the m ·n discreet values between 0 and 1, no matter how they vary inmeaning. This makes differentiation difficult.
• For cosine similarity to accurately reflect how similar two vector are, the basis vectorsneed to be independent of each other. However, individual words, the basis vectors inour case, clearly are not independent of each other. Therefore, cosine similarity overstraightforward bag-of-words vector representations is not accurate. For example,consider phrase pair (“非常(very)好(good)”, “很(very)好(good)”) and phrase pair(“很(very)好(good)”, “不(not)好(good)”): both would have a cosine similarity of 0.5,yet the first pair has similar meanings while the second pair has opposite meanings.
To refine the similarity measure, we use word embeddings. On a vocabulary V , a wordembedding δ projects a word w ∈ V into an n-dimension vector v. We show that withword embedding, a |V |-dimension straightforward vector representation is projected to an-dimension vector:
Given indexed vocabulary V = {w1, w2, . . . , w|V |}, word embedding δ where∀i, 1 ≤ i ≤ |V |, δ(wi) = vi = (vi1 , vi2 , . . . , vin) = vi1 · e1 + vi2 · e2 + . . .+ vin · en,and a sentence s with straightforward vector representation (c1, c2, . . . , c|V |), we
11
have:
s = (c1, c2, . . . , c|V |)
= c1 · w1 + c2 · w2 + . . .+ c|V | · w|V |δ−→ c1 · v1 + c2 · v2 + . . .+ c|V | · v|V |
= c1(v11 · e1 + v12 · e2 + . . .+ v1n · en)
+ c2(v21 · e1 + v22 · e2 + . . .+ v2n · en)
+ . . .
+ c|V |(v|V |1 · e1 + v|V |2 · e2 + . . .+ v|V |n · en)
= (c1v11 + c2v21 + . . .+ c|V |v|V |1)e1
+ (c1v12 + c2v22 + . . .+ c|V |v|V |2)e2
+ . . .
+ (c1v1n + c2v2n + . . .+ c|V |v|V |n)en
=
(c1v11 + c2v21 + . . .+ c|V |v|V |1 ,
c1v12 + c2v22 + . . .+ c|V |v|V |2 ,
. . . ,
c1v1n + c2v2n + . . .+ c|V |v|V |n)
Compared to straightforward bag-of-words vector representation, the new representa-tion has many benefits. First, the vector space has drastically fewer dimensions, and thevectors have real-number values instead of positive integer values on each dimension. Ac-cordingly, cosine similarity would give more continuous numeric values and have betterdifferentiation. Moreover, if the word vectors have the property that similar words havehigher cosine similarities, cosine similarity based on the new representation would be moreaccurate.
For clustering, we use unsupervised density-based clustering algorithms. Compared toother clustering algorithms, density-based algorithms have several advantages that suitsour system. First, density-based clustering works on unlabeled data. Second, density-basedclustering allows outliers with no cluster assignments. In our case, such observation pointswhich are distant from other observations are noise. Finally, density-based clustering doesnot need information on number of clusters. We cannot reasonably estimate number ofclusters because it is impractical to estimate each relation’s number of question patternsand one cluster may contain several question patterns if the patterns are similar enough.
12

As we are looking for universal patterns for each relation, we put in additional restraintto restrict any single entity’s influence: if all the questions in a cluster are labeled with onesingle entity, we discard all the question in the cluster as noise.
3.4 Pattern Evaluation and Model Selection
In the noise reduction step, we filter out questions that do not have enough similar questionsto form clusters. However, this does not eliminate noise. When the system operates onhuge amounts of data, there may be a sufficient number of similar irrelevant questions forirrelevant clusters to form and thereby pass the noise filtering. We need to evaluate theprocessed data of each relation.
We measure the relevancy of each relation’s data by testing it against noise and otherrelations’ data:
• we test whether it is distinguishable from the noise of the noise reduction step. If itis difficult to tell it apart from noise, the data is likely to be noise. For example, thedata may consist of aforementioned irrelevant clusters.
• we test whether it is distinguishable from the data of the relation’s related relations.Here we say relation B is relation A’s related relation if entities with entries onrelation A in the knowledge base are likely to also have entries on relation B. If itis difficult to separate the data from related relations’ data, the data is likely to beabout multiple relations. For example, the data may consist of clusters similar torelated relations’ data. We restrict the testing to against related relations insteadof all other relations because in the knowledge base many relations have the samemeaning and their data would be indistinguishable from each other.
We approach testing distinguishability as a classification task. Using bag-of-wordsmodel, if two collections of questions are distinguishable from each other, we expect binaryclassifiers trained on the collections to achieve high f1-measures. For each relation, weconduct cross-validation iterations of binary classifiers on its data against noise and onits data against its related relations’ data, independently. We calculate the two averagef1-measures, and use the lower one as the relation’s relevancy score.
We retain the relations whose relevancy scores are higher than certain threshold, andtrain classifiers on the data without any holdout. For each relation, we have a classifieron its data against noise and a classifier on its data against its related relations’ data.
13
Combined, these classification models can tell whether a new question is similar to thedata of retained relations. In other words, given a question, now we can identify whichrelation the question is referring to.
3.5 Question Parsing and Answering
Now that we can identify the relation, in order to search the knowledge base for the answersto the question, we only need to extract the entity in the question by using a named-entityrecognizer (NER). For each entity candidate e that NER returns, we identify the relationr in the question with classifiers and search the knowledge base for triples that have e asentity and r as relation. We rank the results by the classifiers’ output, i.e. probability thatthe question is referring to certain relation, and return the answer with the highest score.
14
Chapter 4
Data and Implementation
4.1 Overview
In this chapter, we describe in details how we implement the system and the data on whichthe implementation is based. As data plays a critical role in our system, the implementationis closely coupled with the data we have.
In Section 4.2, we list all the data we access to implement the system.
In Section 4.3, we briefly describe our experiment environment, which affects our im-plementation by physically restricting the computing power available to us.
In Section 4.4, we describe the details of how we extract questions from the knowledgebase.
In Section 4.5, we describe the details of how we reduce noise in the extracted data.
In Section 4.6, we describe the details of how we evaluate the collected questions andtrain the models to identify relations in questions.
In Section 4.7, we describe the details of how we parse the questions, generate candidateanswers, and rank them.
4.2 Data
We use following Chinese resources for our implementation:
15

• DBpedia infobox properties
For knowledge base, we use DBpedia [1], obtained from DBpedia 2014 data dump 1. Itconsists of information extracted from Wikipedia infoboxes, stored as entity-relation-value triples. We use DBpedia because it is the only publicly available knowledgebase in Chinese.
The release has 7,285,034 entries on 422,728 entities and 23,219 relations. An entityis a link to a Wikipedia article. Since a Wikipedia article can be uniquely identifiedby its title, we use the title to denote the entity. A relation is a nominal tag, usuallya parameter name in the Wikipedia infobox. However, in our case, the tags oftendiffer from the parameter names and are not accurate descriptors for the relations.For example, while the actual parameter names are all Chinese, only 6,523 out of23,219 relation tags in the data are Chinese. A value is either an entity or a literalwith type, e.g. number, text, date.
As the data is automatically extracted from Wikipedia, it has several issues asidefrom errors in values. First of all, the data unfortunately includes meta informationin infoboxes such as “imagesize” as relation entries. Additionally, the literal typesare inaccurate. For example, date values are often mislabeled as number values.Literal types are important to us because natural expression can vary a lot fromDBpedia expression depending on the actual data types. For example, date is storedas “yyyy-mm-dd”, a format that does not exist in conversation or community QAquestions.
To mitigate the issues, we annotate the top 400 English relation tags and the top 404Chinese relation tags with type “meta”, “entity”, “number”, and “date”. 29 rela-tions are labeled “number”, 55 relations are labeled “date”, 389 relations are labeled“entity”, and the rest 331 relations are labeled “meta”. The 804 annotated rela-tion tags cover 416,254 (98.5%) entities and 5,763,288 (79.1%) triples. Among them,473 (58.8%) have non-meta types, covering 380,513 (90.0%) entities and 2,467,063(33.9%) triples. 273 out of 473 tags are in Chinese. This is the only human annotationneeded in our implementation.
• Community QA pairs
We have a data set consisting of 366,381,454 QA pairs from community QA websitesin China, including the two largest websites, Sougou Wenwen 2 and Baidu Zhidao
1DBpedia 2014 downloads, oldwiki.dbpedia.org/Downloads20142Sougou Wenwen, Chinese community QA site, wenwen.sougou.com, formerly known as Tencent Wen-
wen Soso
16
3. Each pair contains one question and at least one answers. The questions cover awide range of topics from computer games to agriculture.
Around 100 million questions are dated before 2010 and were collected by others in2010. We contributed the rest of questions, dated between 2010 to 2014, by scrapingthe websites from 2013 to 2015. The data is indexed and stored using Apache Solr4. In our setup, Solr works like a search engine, allowing keyword matching againstquestions.
• Wikipedia redirect list
We use the Wikipedia redirect list to identify aliases in name entity recognition,obtained from Wikipedia data dump 5. The list has 576,627 redirect entries.
• Pre-trained word2vec word embedding
We have a word2vec [22] word embedding trained from the community QA data set.There are 4,128,853 word vector representations and each vector has 200 dimensions.
4.3 Experiment Environment
The system is trained and implemented on a 4-core CPU 16GB memory desktop in Java.
4.4 Question Pattern Extraction
Because our community QA data is huge, it is prohibitive to iterate through the datato fetch candidate questions for extraction. Instead, for each entity we gather candidatequestion-answer pairs by querying Solr with its name. Finding entities’ names is a chal-lenge: in DBpedia, each entity only has one official name, which often is different from howthe entity is mentioned in real life. For example, “上海市(Shanghai City)” is the officialname and is the one on DBpedia’s record, but the shortened form “上海(Shanghai)” is usedmost often in reality, and there are many other more often used nicknames such as “魔都”,“沪”, and “申”. The issue is complicated by formatting: western names in DBpedia usethe “·” symbol to separate first name and last name, while online users in China often do
3Baidu Zhidao, Chinese community QA site, zhidao.baidu.com4Apache Solr, lucene.apache.org/solr5dumps.wikimedia.org/zhwiki/
17
not use “·”. Therefore, if we query Solr with only the official name, it would significantlyreduce the candidate pool for extraction.
We identify the entities’ aliases with the help of Wikipedia redirect list and formattingrules. As Wikipedia is the source of DBpedia’s information, the redirect target on thelist uses the same official name as DBpedia, making the list the prime resource for aliasdiscovery in our case. We use the two following simple rules for alias discovery:
• For each redirect target and redirect source on the list, add redirect source as an aliasfor redirect target.
• For western names in the format of “First · Last”, add “First Last” as an alias for“First · Last”.
In total, we discover 653,818 names for 380,513 entities. For each name, we querySolr for questions that contain the name. 78,433 queries return 114,884,161 questions intotal (one question may appear multiple times). The low coverage, 12.0%, of the names isexpected and shows that community QA do not have information on many entities.
The next step is to determine whether a QA pair is associated with a entity-relation-value triple. To do so, we need to detect a value’s presence in a question or an answer. Weachieve this by generating regular expressions automatically based on the value and therelation’s type:
• If the relation has “meta” type, we discard the relation altogether because “meta”information such as “imageheight” is specific to the Wikipedia and irrelevant to theentities.
• if the relation has “entity” type, we generate regular expressions that literally matchone of the entity’s discovered aliases. For example, for entity-typed value “上海市”we generate regular expressions “上海市”, “上海”, “沪”, and “申”.
• If the relation has “number” type, we generate regular expressions that match anynumber within a close range of the value. Approximation is crucial because in theDBpedia, number-typed values can be accurate to several digits after the decimalmark, while online users rarely match the exact same accuracy. For example, fornumber-typed value “1532.7” we generate regular expression “153[0-9]([^0-9]|$)”; ifthe value is followed by a unit such as “米(meter)”, we generate regular expression“153[0-9](\.[0-9]*)?米”.
18

• If the relation has “date” type, we generate regular expressions that match the datein the most commonly used format. For example, for date-typed value “2016-07-01”we generate regular expression “2016年7月1日”. If the month or day information ismissing in the value, we adjust the regular expression accordingly. The format changefrom DBpedia’s “yyyy-mm-dd” is crucial for successfully detecting the values.
For each entity, we generate all the regular expressions for its relations and iteratethrough its candidate QA pairs. Given a QA pair, we test it against every relation of theentity to see:
• whether any regular expression matches the question. If there is a match, the questionis not associated with the relation.
• whether any regular expression matches one of the answers. If there are no matches,the question is not associated with the relation.
If a QA pair is associated with only one relation, we extract the question, replace theappearance of the entity in the question with a marker, and group it with other extractedquestions under the relation.
On average, a relation has 1,533,859 QA pairs tested against it. Among those, questionsin 883,836 (57.6%) pairs do not contain the value, 2,257 (0.15%) pairs are associated withat least 1 triple, and only 1,668 (0.11%) questions are extracted. In general, the numbersof questions display a long-tail pattern (see Figure 4.1), with the top 20% relations having88.0% percent of the total questions. Moreover, 75 relations do not have any questionsextracted. The number of extracted questions has a Pearson product-moment correlationcoefficient of 0.34 with the number of QA pairs tested and a Pearson product-momentcorrelation coefficient of 0.97 with the number of QA pairs which are associated with atleast 1 triples.
4.5 Noise Reduction
The word embedding we use is trained with word2vec and covers 4,128,853 words. It hasthe property that similar words have higher cosine similarity. Our extracted questionsare made up of 97,910 different words, which are all contained in the word embedding.However, the word embedding does not contain English words. As a result, we discardquestions that have English words.
19
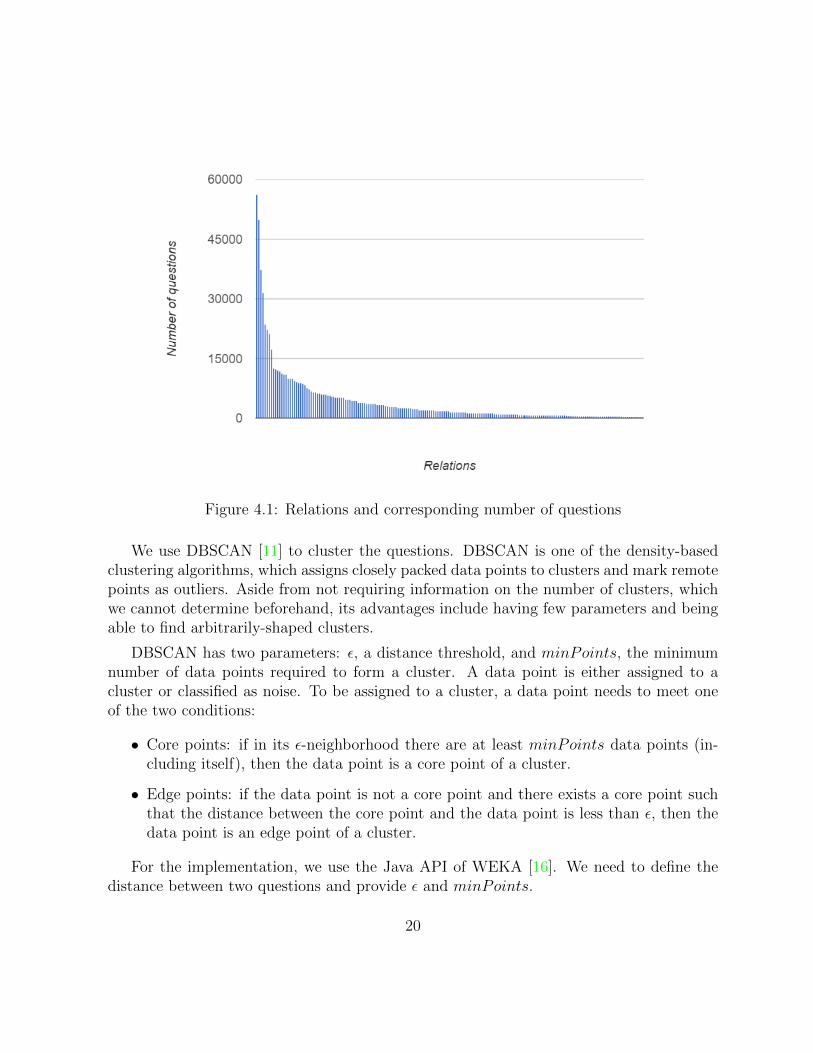
Figure 4.1: Relations and corresponding number of questions
We use DBSCAN [11] to cluster the questions. DBSCAN is one of the density-basedclustering algorithms, which assigns closely packed data points to clusters and mark remotepoints as outliers. Aside from not requiring information on the number of clusters, whichwe cannot determine beforehand, its advantages include having few parameters and beingable to find arbitrarily-shaped clusters.
DBSCAN has two parameters: ε, a distance threshold, and minPoints, the minimumnumber of data points required to form a cluster. A data point is either assigned to acluster or classified as noise. To be assigned to a cluster, a data point needs to meet oneof the two conditions:
• Core points: if in its ε-neighborhood there are at least minPoints data points (in-cluding itself), then the data point is a core point of a cluster.
• Edge points: if the data point is not a core point and there exists a core point suchthat the distance between the core point and the data point is less than ε, then thedata point is an edge point of a cluster.
For the implementation, we use the Java API of WEKA [16]. We need to define thedistance between two questions and provide ε and minPoints.
20
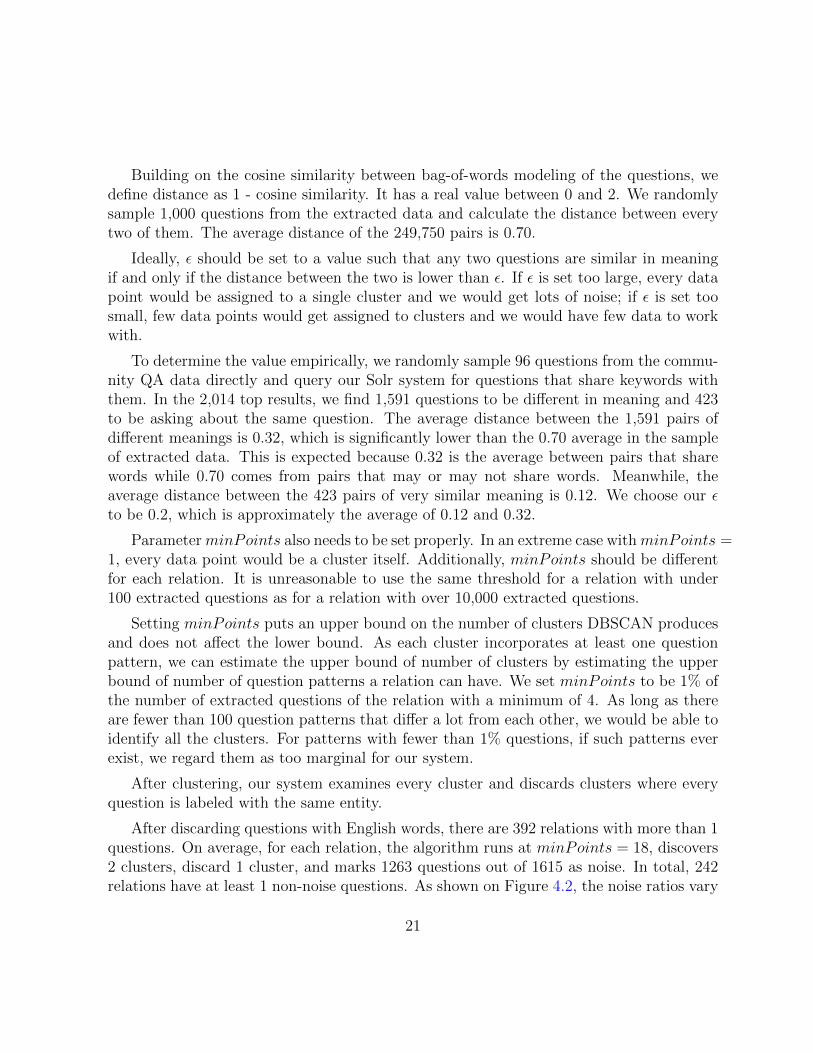
Building on the cosine similarity between bag-of-words modeling of the questions, wedefine distance as 1 - cosine similarity. It has a real value between 0 and 2. We randomlysample 1,000 questions from the extracted data and calculate the distance between everytwo of them. The average distance of the 249,750 pairs is 0.70.
Ideally, ε should be set to a value such that any two questions are similar in meaningif and only if the distance between the two is lower than ε. If ε is set too large, every datapoint would be assigned to a single cluster and we would get lots of noise; if ε is set toosmall, few data points would get assigned to clusters and we would have few data to workwith.
To determine the value empirically, we randomly sample 96 questions from the commu-nity QA data directly and query our Solr system for questions that share keywords withthem. In the 2,014 top results, we find 1,591 questions to be different in meaning and 423to be asking about the same question. The average distance between the 1,591 pairs ofdifferent meanings is 0.32, which is significantly lower than the 0.70 average in the sampleof extracted data. This is expected because 0.32 is the average between pairs that sharewords while 0.70 comes from pairs that may or may not share words. Meanwhile, theaverage distance between the 423 pairs of very similar meaning is 0.12. We choose our εto be 0.2, which is approximately the average of 0.12 and 0.32.
ParameterminPoints also needs to be set properly. In an extreme case withminPoints =1, every data point would be a cluster itself. Additionally, minPoints should be differentfor each relation. It is unreasonable to use the same threshold for a relation with under100 extracted questions as for a relation with over 10,000 extracted questions.
Setting minPoints puts an upper bound on the number of clusters DBSCAN producesand does not affect the lower bound. As each cluster incorporates at least one questionpattern, we can estimate the upper bound of number of clusters by estimating the upperbound of number of question patterns a relation can have. We set minPoints to be 1% ofthe number of extracted questions of the relation with a minimum of 4. As long as thereare fewer than 100 question patterns that differ a lot from each other, we would be able toidentify all the clusters. For patterns with fewer than 1% questions, if such patterns everexist, we regard them as too marginal for our system.
After clustering, our system examines every cluster and discards clusters where everyquestion is labeled with the same entity.
After discarding questions with English words, there are 392 relations with more than 1questions. On average, for each relation, the algorithm runs at minPoints = 18, discovers2 clusters, discard 1 cluster, and marks 1263 questions out of 1615 as noise. In total, 242relations have at least 1 non-noise questions. As shown on Figure 4.2, the noise ratios vary
21
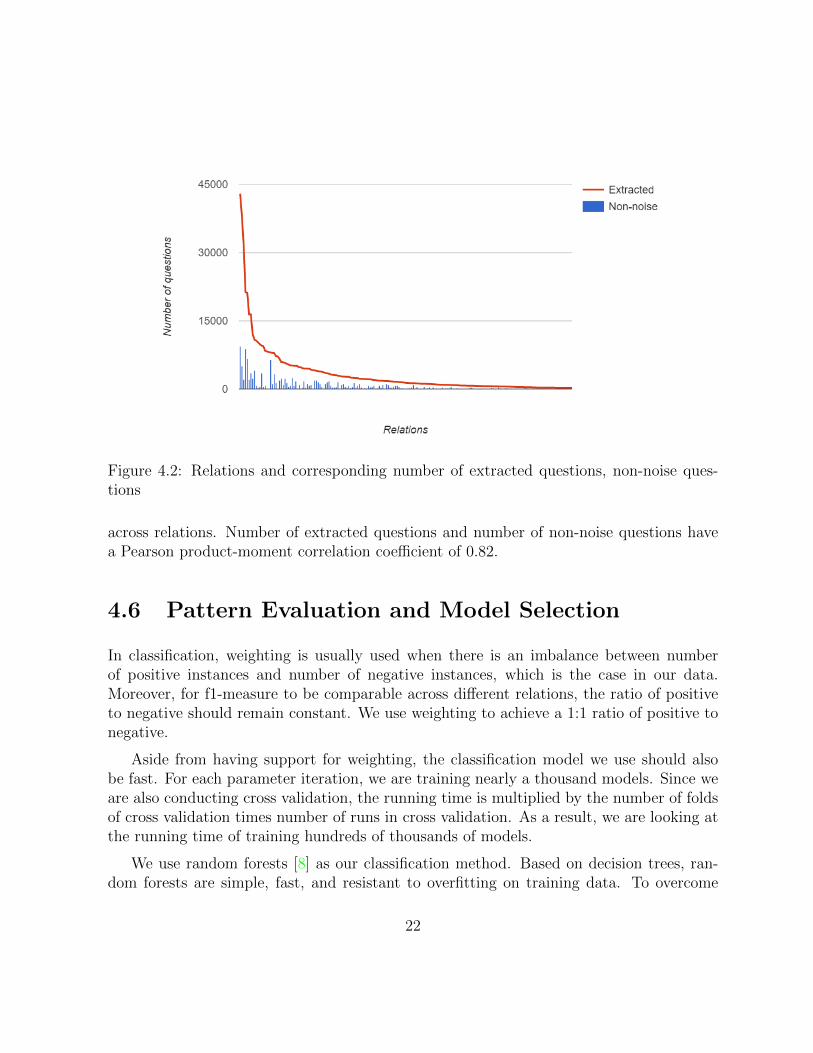
Figure 4.2: Relations and corresponding number of extracted questions, non-noise ques-tions
across relations. Number of extracted questions and number of non-noise questions havea Pearson product-moment correlation coefficient of 0.82.
4.6 Pattern Evaluation and Model Selection
In classification, weighting is usually used when there is an imbalance between numberof positive instances and number of negative instances, which is the case in our data.Moreover, for f1-measure to be comparable across different relations, the ratio of positiveto negative should remain constant. We use weighting to achieve a 1:1 ratio of positive tonegative.
Aside from having support for weighting, the classification model we use should alsobe fast. For each parameter iteration, we are training nearly a thousand models. Since weare also conducting cross validation, the running time is multiplied by the number of foldsof cross validation times number of runs in cross validation. As a result, we are looking atthe running time of training hundreds of thousands of models.
We use random forests [8] as our classification method. Based on decision trees, ran-dom forests are simple, fast, and resistant to overfitting on training data. To overcome
22
the overfitting tendency of decision trees, random forests apply two ensemble learningtechniques:
• Bootstrap aggregating (bagging): for each decision tree, instead of learning from thewhole training data, it learns from a random sample with replacement of the data.
• Random subspace method: for each decision tree, instead of learning from all thefeatures, it learns from a random subset of the features.
We resort to JAVA API of WEKA for implementation. For parameter ntree, numberof decision trees in random forests, we test the performance on ntree = 25 and ntree = 50.Performance of random forests goes up with this parameter with a diminishing return.We could not test a larger value such as 100 due to limitations of physical memory in theexperiment environment, while a typical configuration would be ntree = 10 or ntree = 30.
Before we evaluate the questions via classification, we still need to identify each re-lation’s related relations. Given a knowledge base, let E(r) be the set of entities with
relation r. For relation r1 and r2, if card(E(r1)∩E(r2))card(E(r1))
≥ 0.1, we add r2 to r1’s related rela-tions. Among the remaining 242 relations, on average, a relation has 16 related relations.The ratio of a relation’s questions to those of its realted relations is 1:18.
Additionally, we need to train the models on a subset of noise questions instead of allthe noise. As there are 494,922 noise questions, it is not feasible to use all the data dueto physical memory constraint and time constraint. Therefore, we sample noise questionswithout replacement at different sampling rates rnoise for noise samples to train the models.We test the performance for rnoise = 10% and rnoise = 20%.
For each relation, we conduct three five-fold cross validation on its filtered questionsagainst noise sample, and on its filtered questions against its related relations’ questions,independently. If the relation has fewer than 20 questions, we discard it due to inadequateinstance number. Accordingly, we evaluate 208 relations.
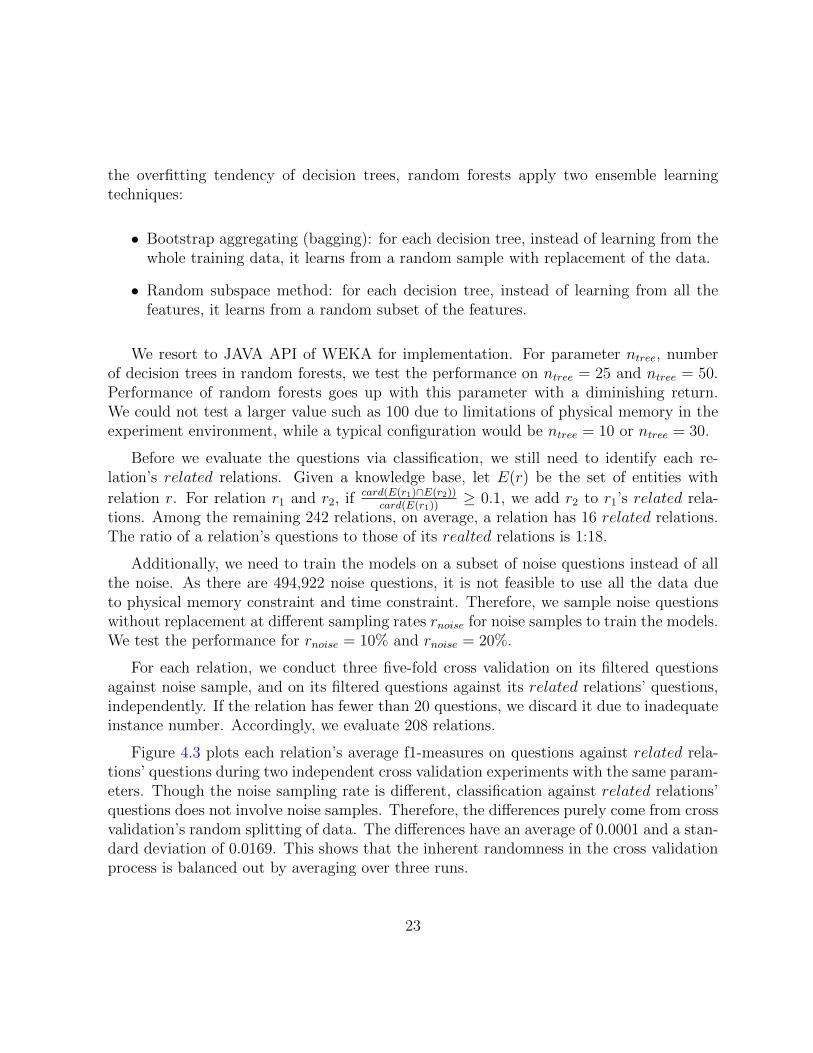
Figure 4.3 plots each relation’s average f1-measures on questions against related rela-tions’ questions during two independent cross validation experiments with the same param-eters. Though the noise sampling rate is different, classification against related relations’questions does not involve noise samples. Therefore, the differences purely come from crossvalidation’s random splitting of data. The differences have an average of 0.0001 and a stan-dard deviation of 0.0169. This shows that the inherent randomness in the cross validationprocess is balanced out by averaging over three runs.
23
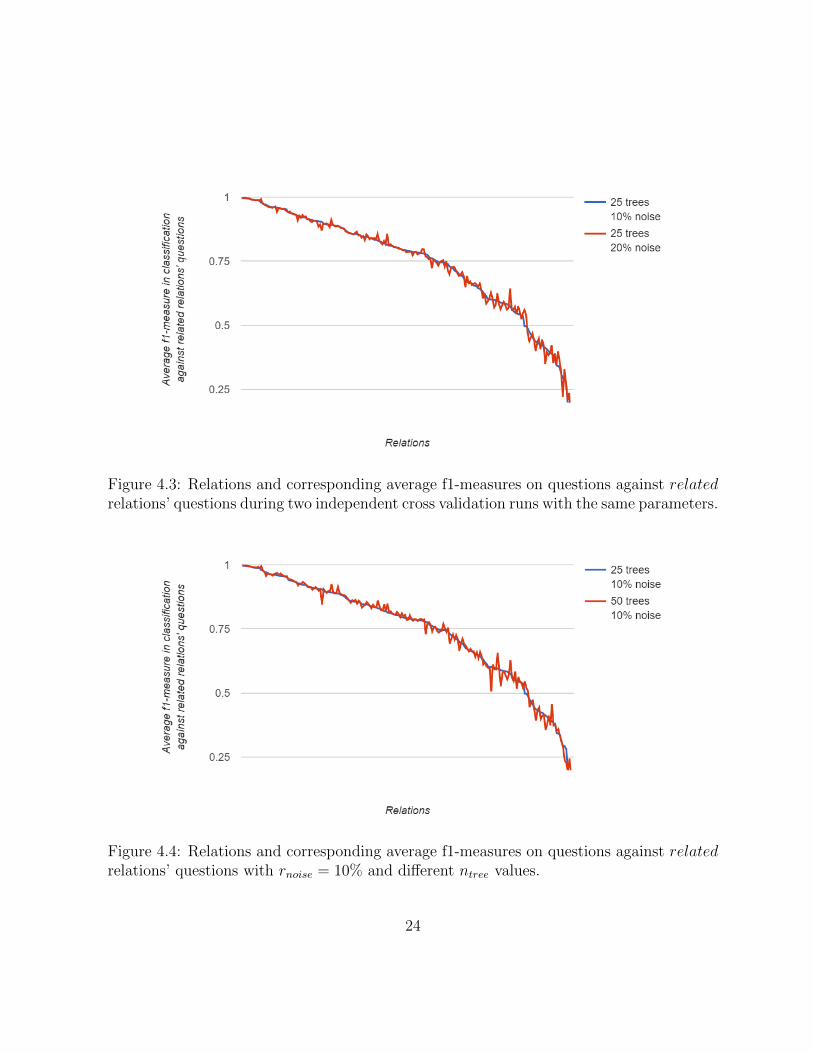
Figure 4.3: Relations and corresponding average f1-measures on questions against relatedrelations’ questions during two independent cross validation runs with the same parameters.
Figure 4.4: Relations and corresponding average f1-measures on questions against relatedrelations’ questions with rnoise = 10% and different ntree values.
24
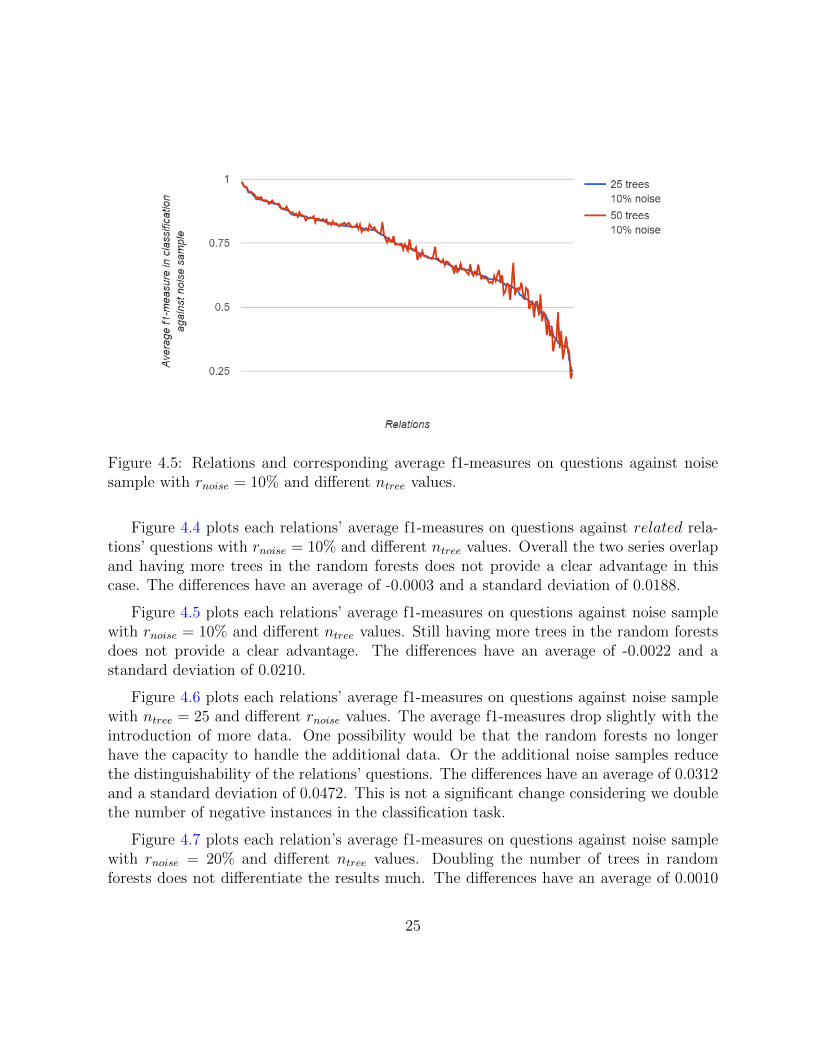
Figure 4.5: Relations and corresponding average f1-measures on questions against noisesample with rnoise = 10% and different ntree values.
Figure 4.4 plots each relations’ average f1-measures on questions against related rela-tions’ questions with rnoise = 10% and different ntree values. Overall the two series overlapand having more trees in the random forests does not provide a clear advantage in thiscase. The differences have an average of -0.0003 and a standard deviation of 0.0188.
Figure 4.5 plots each relations’ average f1-measures on questions against noise samplewith rnoise = 10% and different ntree values. Still having more trees in the random forestsdoes not provide a clear advantage. The differences have an average of -0.0022 and astandard deviation of 0.0210.
Figure 4.6 plots each relations’ average f1-measures on questions against noise samplewith ntree = 25 and different rnoise values. The average f1-measures drop slightly with theintroduction of more data. One possibility would be that the random forests no longerhave the capacity to handle the additional data. Or the additional noise samples reducethe distinguishability of the relations’ questions. The differences have an average of 0.0312and a standard deviation of 0.0472. This is not a significant change considering we doublethe number of negative instances in the classification task.
Figure 4.7 plots each relation’s average f1-measures on questions against noise samplewith rnoise = 20% and different ntree values. Doubling the number of trees in randomforests does not differentiate the results much. The differences have an average of 0.0010
25

Figure 4.6: Relations and corresponding average f1-measures on questions against noisesample with ntree = 25 and different rnoise values.
Figure 4.7: Relations and corresponding average f1-measures on questions against noisesample with rnoise = 20% and different ntree values.
26
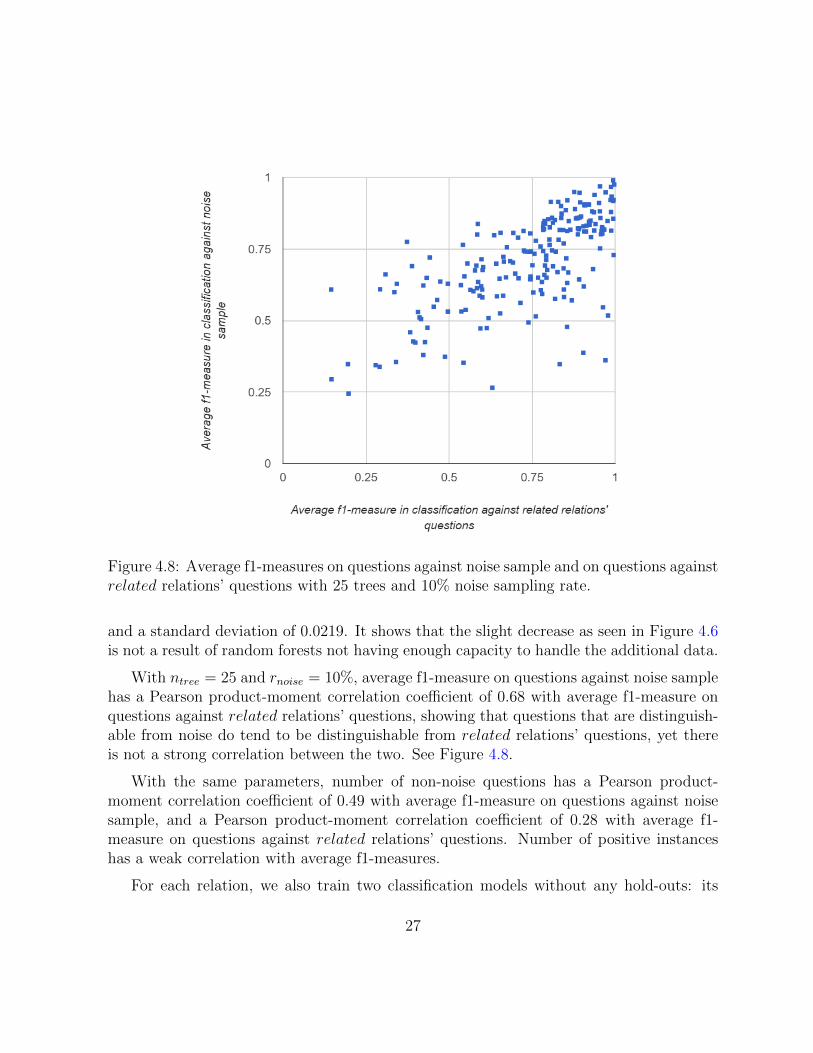
Figure 4.8: Average f1-measures on questions against noise sample and on questions againstrelated relations’ questions with 25 trees and 10% noise sampling rate.
and a standard deviation of 0.0219. It shows that the slight decrease as seen in Figure 4.6is not a result of random forests not having enough capacity to handle the additional data.
With ntree = 25 and rnoise = 10%, average f1-measure on questions against noise samplehas a Pearson product-moment correlation coefficient of 0.68 with average f1-measure onquestions against related relations’ questions, showing that questions that are distinguish-able from noise do tend to be distinguishable from related relations’ questions, yet thereis not a strong correlation between the two. See Figure 4.8.
With the same parameters, number of non-noise questions has a Pearson product-moment correlation coefficient of 0.49 with average f1-measure on questions against noisesample, and a Pearson product-moment correlation coefficient of 0.28 with average f1-measure on questions against related relations’ questions. Number of positive instanceshas a weak correlation with average f1-measures.
For each relation, we also train two classification models without any hold-outs: its
27
questions against noise sample, and its questions against related relations’ questions. Givena threshold θmodel, if the relation’s either cross validation f1-measure is lower than θmodel,we discard the relation’s classification models.
4.7 Question Parsing and Answering
Question parsing and answering is the only online step in our design.
To answer a question, we first identify the entity by pattern matching through the aliaslist which we have compiled in Section 4.4. If there is a match for alias a, we generate apair (a, qa), where qa is the question with a stripped.
Then we generate candidate answers from (a, qa) and score them. Let e be the entityof which a is an alias. For every relation r that e has in the knowledge base, if we haveretained r classification models, we fetch the triple (e, r, v) from the knowledge base, usev as a candidate answer, and assign the two probability outputs of the two classifiers asthe scores of the candidate answer.
Finally we rank the candidate answers. Given a threshold θanswer, if either score of thecandidate answer is lower than θanswer, we discard the candidate answer. If there are atleast one remaining candidates, we rank them by the average of the two scores, and choosethe one with the highest score as the answer.
For example, given θanswer = 0.6, the process to answer question “道光是哪个皇帝的年号? (Which emperor has the Chinese era name Daoguang?)” is as follows:
1. (“道光”, “是哪个皇帝的年号?”) and (“光”, “道是哪个皇帝的年号?”) are producedbecause aliases “道光” and “光” match the question.
2. 12 values from the knowledge bases are fetched and used as candidate answers. Theyare scored by invoking the classification models. (“道光”, “是哪个皇帝的年号?”)produces and scores 5 candidate answers while (“光”, “道是哪个皇帝的年号?”)produces and scores the other 7 candidate answers.
3. Only 1 candidate answer “清宣宗爱新觉罗旻宁(Qing Xuanzong Aisin-Gioro Min-ning)” has scores both of which are higher than θanswer. It is produced by (“道光”,“是哪个皇帝的年号?”) and has scores of 1.0 and 0.99.
4. The system produces an answer “清宣宗爱新觉罗旻宁(Qing Xuanzong Aisin-GioroMinning)”, which is the correct answer to the question.
28

In the experiment environment (desktop PC), the system is able to answer the questioncorrectly well within 1 second, despite doing hundreds of thousands of pattern matching,fetching 12 values from the knowledge base, and running 24 classification tasks.
29

Chapter 5
Evaluation
5.1 Overview
In this chapter, we conduct experiments to evaluate various aspects of the system.
First, we evaluate the performance of the noise reduction component in Section 5.2.
Before we evaluate the end-to-end performance of the system, we brief summarize theparameters of our system in Section 5.3.
Then, we evaluate the overall performance of system along its two design goals:
• The system should not answer questions that do not fall into the single-entity-single-relation category. In Section 5.4, we conduct experiments to test the system’s capa-bility of opting for no answers when it should not answer the question.
• The system should answer as many single-entity-single-relation questions as possiblewith reasonable accuracy. In Section 5.5, we conduct experiments to test the system’scapability of producing the right answers to questions across different relations.
Finally, we evaluate the run time performance of the system in Section 5.6.
5.2 Noise Reduction
We evaluate the noise reduction component by examining the precision, recall, and f1-measure across different relations.
30
Relation Type Average Precision Average Recall Average F1 Pearson’s rAny 0.6424 0.7367 0.6800 0.0259
Number 0.6395 0.6058 0.6182 0.4099Entity 0.6429 0.7613 0.6915 -0.0055Date 0.6416 0.6831 0.6554 0.2122
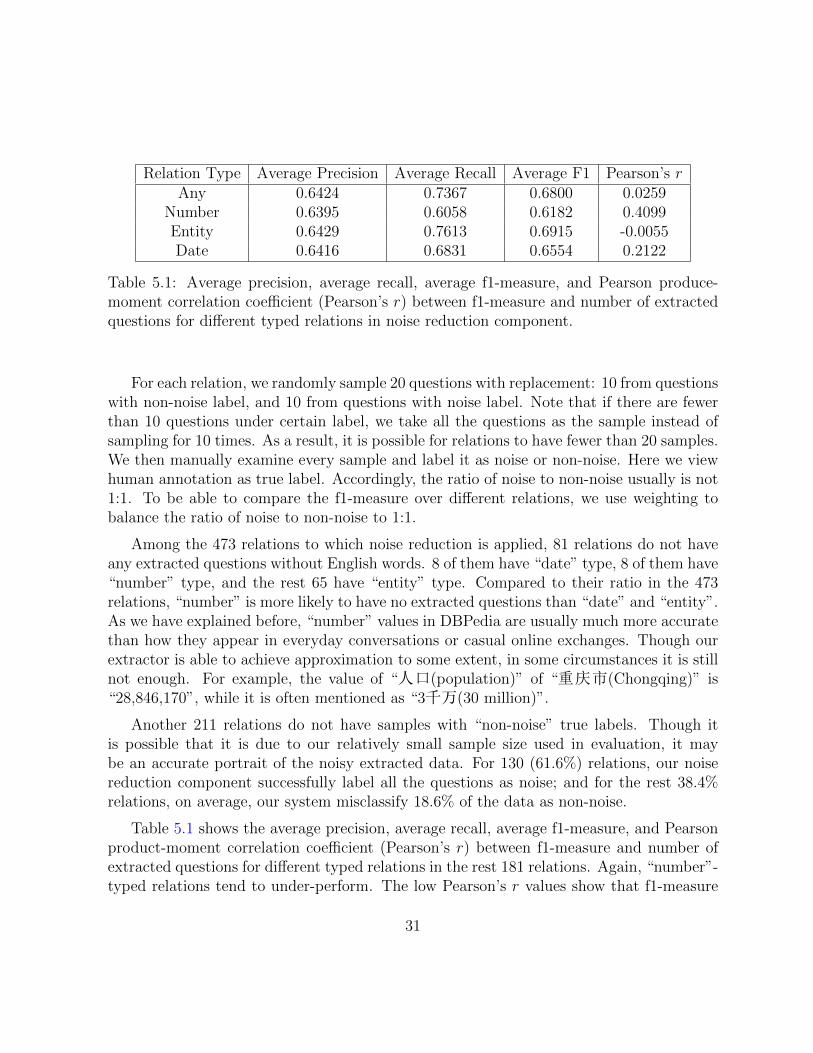
Table 5.1: Average precision, average recall, average f1-measure, and Pearson produce-moment correlation coefficient (Pearson’s r) between f1-measure and number of extractedquestions for different typed relations in noise reduction component.
For each relation, we randomly sample 20 questions with replacement: 10 from questionswith non-noise label, and 10 from questions with noise label. Note that if there are fewerthan 10 questions under certain label, we take all the questions as the sample instead ofsampling for 10 times. As a result, it is possible for relations to have fewer than 20 samples.We then manually examine every sample and label it as noise or non-noise. Here we viewhuman annotation as true label. Accordingly, the ratio of noise to non-noise usually is not1:1. To be able to compare the f1-measure over different relations, we use weighting tobalance the ratio of noise to non-noise to 1:1.
Among the 473 relations to which noise reduction is applied, 81 relations do not haveany extracted questions without English words. 8 of them have “date” type, 8 of them have“number” type, and the rest 65 have “entity” type. Compared to their ratio in the 473relations, “number” is more likely to have no extracted questions than “date” and “entity”.As we have explained before, “number” values in DBPedia are usually much more accuratethan how they appear in everyday conversations or casual online exchanges. Though ourextractor is able to achieve approximation to some extent, in some circumstances it is stillnot enough. For example, the value of “人口(population)” of “重庆市(Chongqing)” is“28,846,170”, while it is often mentioned as “3千万(30 million)”.
Another 211 relations do not have samples with “non-noise” true labels. Though itis possible that it is due to our relatively small sample size used in evaluation, it maybe an accurate portrait of the noisy extracted data. For 130 (61.6%) relations, our noisereduction component successfully label all the questions as noise; and for the rest 38.4%relations, on average, our system misclassify 18.6% of the data as non-noise.
Table 5.1 shows the average precision, average recall, average f1-measure, and Pearsonproduct-moment correlation coefficient (Pearson’s r) between f1-measure and number ofextracted questions for different typed relations in the rest 181 relations. Again, “number”-typed relations tend to under-perform. The low Pearson’s r values show that f1-measure
31

is not correlated with the number of extracted relations.
5.3 System Parameters
Our system has four parameters, ntree, rnoise, θmodel, θanswer:
• ntree is used to train the classification models in Section 4.6. It is the number of treesin random forests and is an inherent parameter of random forests. Higher valuesimproves the performance of random forests for a diminishing return, but requiresmore computing power. We test it on {25, 50}.
• rnoise is used to train the classification models in Section 4.6. It is the sampling rateof the noise sample used for model training. Higher values means more training data,but requires more computing power. We test it on {10%, 20%}.
• θmodel, f1-measure threshold for model selection, is used to discard inadequate modelsin Section 4.6. An increase in value decreases the number of model the system usesand therefore decreases the number of relations that the system can identify. We testit on {0.6, 0.7, 0.8, 0.9}.
• θanswer, probability threshold for answer selection, is used to discard improbable an-swers in Section 4.7. An increase in value decreases the number of answer candidatesthe system considers. We test it on {0.6, 0.7, 0.8, 0.9}.
Configuration ntree = 25, rnoise = 10%, θmodel = 0.6, θanswer = 0.6 is our basic configu-ration as these are the most relaxed values for each parameters.
5.4 Answer Triggering
Answer triggering [31] is a task which requires QA systems to report no answers whengiven questions that are known to have no correct answers or beyond the knowledge ofthe systems. This is a relatively novel evaluation task, as traditionally QA systems areevaluated on question-answer data sets where each question has at least 1 correct answers.However, answer triggering is an important task. A system that excels in answer triggeringunderstands the limitation of its knowledge and works well with other QA systems, each ofwhich specializes or excels in certain domains. Meanwhile, a system that does extremely
32

poor in answer triggering would attempt to answer almost every question and eventuallyproduce much more incorrect answers.
We compile the test cases by randomly sampling our community QA data. As whengiven a question, our system first uses pattern matching to identify the entities and doesnot proceed if no known entities are found in the question, to accurately assess our systemin answer triggering, the test cases should have entities known to our system.
We gather the test cases by the following steps:
1. Randomly sample aliases from relations known to our system. At our system’s basicparameter configuration, it has models of 130 relations. For each relation, we expandits entity list with our alias list compiled in Section 4.4. Then we randomly sample5 aliases from each of these relations, for a total of 650 aliases.
2. Query Solr, our storage system for community QA data, for questions that containthe aliases and randomly sample questions from the query results. 6 of the 650 aliasesdo not have any questions that mention them in community QA data, and we pulla random sample of at most 5 for the rest 644 aliases. If the query result has fewerthan 5 questions, we take them all instead of sampling the result. In total we collect2,689 questions.
3. Label the questions as “single entity single relation” or not. We use the 2,369 non-“single entity single relation” questions as our test case candidates.
4. In the 2,369 candidates, a total of 55 appear in our extracted questions. 46 areclassified as noise: 11 of them are in the 10% noise sample, 17 of them are in the20% noise sample, and 6 of them are in both noise samples. After excluding thecandidates that are used to train our models, we end up with 2,338 test cases.
In the testing, our system declines to answer at least 94.4% non-“single entity singlerelation” questions. Figure 5.2 and 5.1 plots the accuracy in answer triggering task withdifferent parameters. A higher rnoise, θmodel, or θanswer results in higher accuracy in answertriggering task.
5.5 Question Coverage
In Section 5.4, we test whether our system reject questions which it should not answer.And in this section, we evaluate our system by testing whether it answers questions whichit should answer correctly.
33
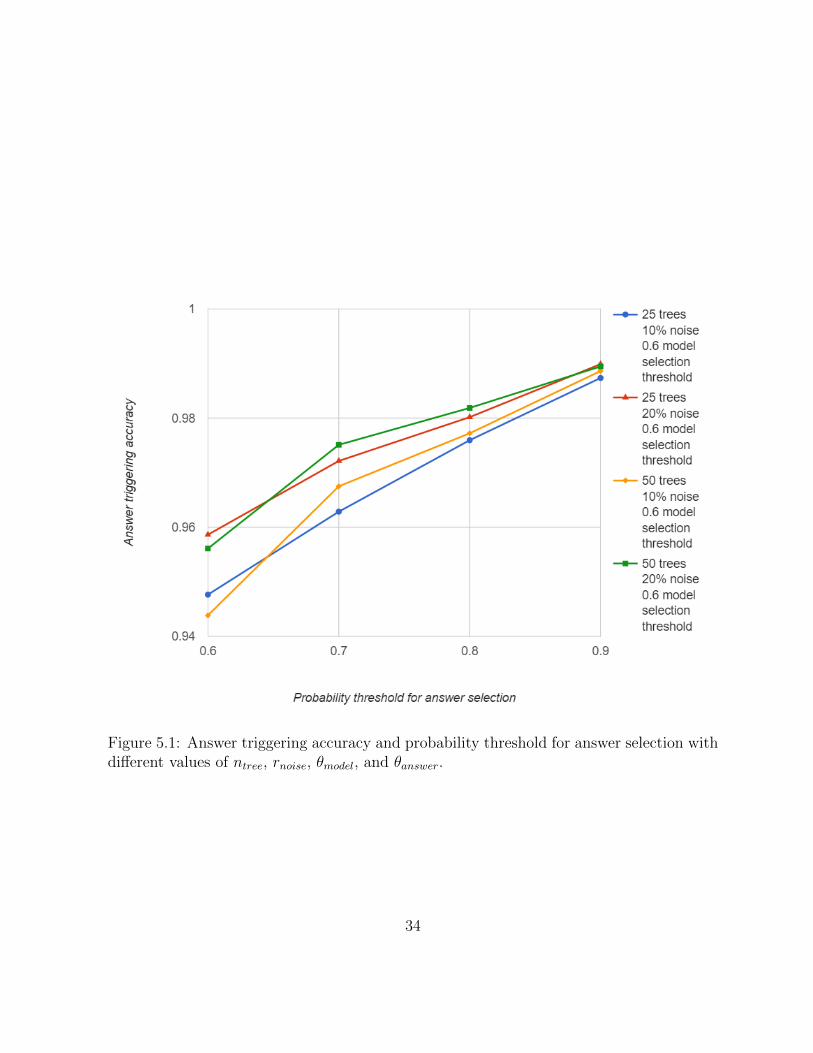
Figure 5.1: Answer triggering accuracy and probability threshold for answer selection withdifferent values of ntree, rnoise, θmodel, and θanswer.
34

Figure 5.2: Answer triggering accuracy and f1 measure threshold for model selection withdifferent values of ntree, rnoise, θmodel, and θanswer.
35

Our test cases are generated by combining aliases with question patterns:
1. We begin with the 130 relations and 644 aliases in Section 5.4.
2. For each relation, we have native Chinese speakers come up with questions patternsthat are directly asking about the relation. The question patterns should apply toall the alias samples.
For example, let a be a placeholder for alias, for relation “配偶(spouse)”, questionspatterns from our annotators include “a的老婆是谁? (Who’s a’s wife?)”, “a的爱人是谁? (Who’s a’s lover?)”, “a和谁结婚了? (Who’s a married to?)”, “a娶了谁?(Who did a marry?)”, etc.
In total we have 279 question patterns from 124 relations. Six relations do not havequestion patterns: four of them have multiple relations mingled, and there lacks acommon question pattern in Chinese for all the alias samples; and the last two, onclose inspection, have obscure meanings.
3. Let r be one of the 124 relations, a be one of r’s sampled alias, and q be one of r’squestion patterns, we generate a QA pair by replacing the alias placeholder in q witha and fetching a’s DBpedia value on r.
For example, for relation “director”, alias “角斗士(Gladiator)”, and patterns “a是谁导演的? (Who directed a?)”, “a的导演是谁? (Who’s the director of a?)”, we firstfetch value “雷利·史考特(Ridley Scott)” from DBpedia, then generate two QA pairs:(“角斗士是谁导演的? (Who directed Gladiator?)”, “雷利·史考特(Ridley Scott)”)and (“角斗士的导演是谁? (Who’s the director of Gladiator?)”, “雷利·史考特(RidleyScott)”).
In total we have 1,395 QA pairs for 124 relations.
We compare the performance of our system to that of two retrieval-based systems, bothof which are developed on the same community QA data set and return the original answerof a QA pair as answer:
• Solr
We use Solr to store our community QA data. Working as a search engine, it can beused for question answering. When used as a simple QA system, Solr ranks the QApairs by the number of shared keywords between the query and its indexed questions.Then it selects the QA pair whose question shares the most words with the query,and returns the answer in the QA pair as the answer to the query.
36
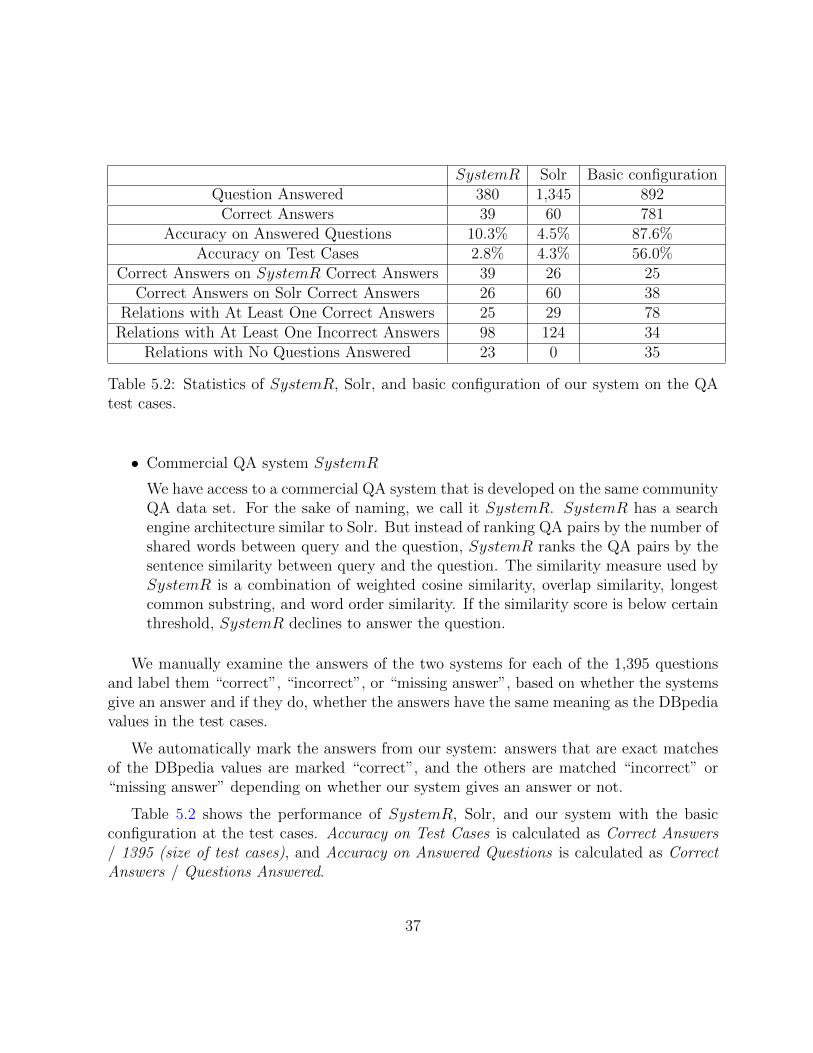
SystemR Solr Basic configurationQuestion Answered 380 1,345 892
Correct Answers 39 60 781Accuracy on Answered Questions 10.3% 4.5% 87.6%
Accuracy on Test Cases 2.8% 4.3% 56.0%Correct Answers on SystemR Correct Answers 39 26 25
Correct Answers on Solr Correct Answers 26 60 38Relations with At Least One Correct Answers 25 29 78
Relations with At Least One Incorrect Answers 98 124 34Relations with No Questions Answered 23 0 35
Table 5.2: Statistics of SystemR, Solr, and basic configuration of our system on the QAtest cases.
• Commercial QA system SystemR
We have access to a commercial QA system that is developed on the same communityQA data set. For the sake of naming, we call it SystemR. SystemR has a searchengine architecture similar to Solr. But instead of ranking QA pairs by the number ofshared words between query and the question, SystemR ranks the QA pairs by thesentence similarity between query and the question. The similarity measure used bySystemR is a combination of weighted cosine similarity, overlap similarity, longestcommon substring, and word order similarity. If the similarity score is below certainthreshold, SystemR declines to answer the question.
We manually examine the answers of the two systems for each of the 1,395 questionsand label them “correct”, “incorrect”, or “missing answer”, based on whether the systemsgive an answer and if they do, whether the answers have the same meaning as the DBpediavalues in the test cases.
We automatically mark the answers from our system: answers that are exact matchesof the DBpedia values are marked “correct”, and the others are matched “incorrect” or“missing answer” depending on whether our system gives an answer or not.
Table 5.2 shows the performance of SystemR, Solr, and our system with the basicconfiguration at the test cases. Accuracy on Test Cases is calculated as Correct Answers/ 1395 (size of test cases), and Accuracy on Answered Questions is calculated as CorrectAnswers / Questions Answered.
37
Our system comes at top in number of correctly answered questions, accuracy on an-swered questions, accuracy on test cases, and number of relations with at least 1 correctlyanswered questions. However, our system cannot identify the relation in any question of35 relations. Also, even though our system gives much more correct answers, it cannotanswer all the question which SystemR or Solr answers correctly.
Our system’s high accuracy on the test cases, 56.0% compared to SystemR’s 2.8% andSolr’s 4.3%, is largely attributed to the incorporation of structured knowledge base, andthe separation of a question into entity and question pattern. Once our system learns apattern for a relation, it can apply it to the relation’s numerous entities and their aliases toanswer numerous similar questions; meanwhile, for each newly acquired QA pair, retrieval-based systems like SystemR and Solr can learn to answer at most one new question. Oursystem does not need to encounter the question during the system’s development in orderto answer the question, while retrieval-based systems do.
Our system has very high accuracy on the answered questions, 87.6% compared toSystemR’s 10.3% and Solr’s 4.5%. For it to answer a question, our system needs to beable to recognize an entity and a matching relation in the question. Solr is a search engine,therefore as long as one of the QA pairs shares keywords with the query, Solr produces ananswer. Even though SystemR also uses threshold to control its answer output, SystemR’ssimilarity mechanisms fail to consider that two questions with the same pattern have totallydifferent meaning if they have different entities in the questions. The entity in a questioncarries a weight disproportional of its length.
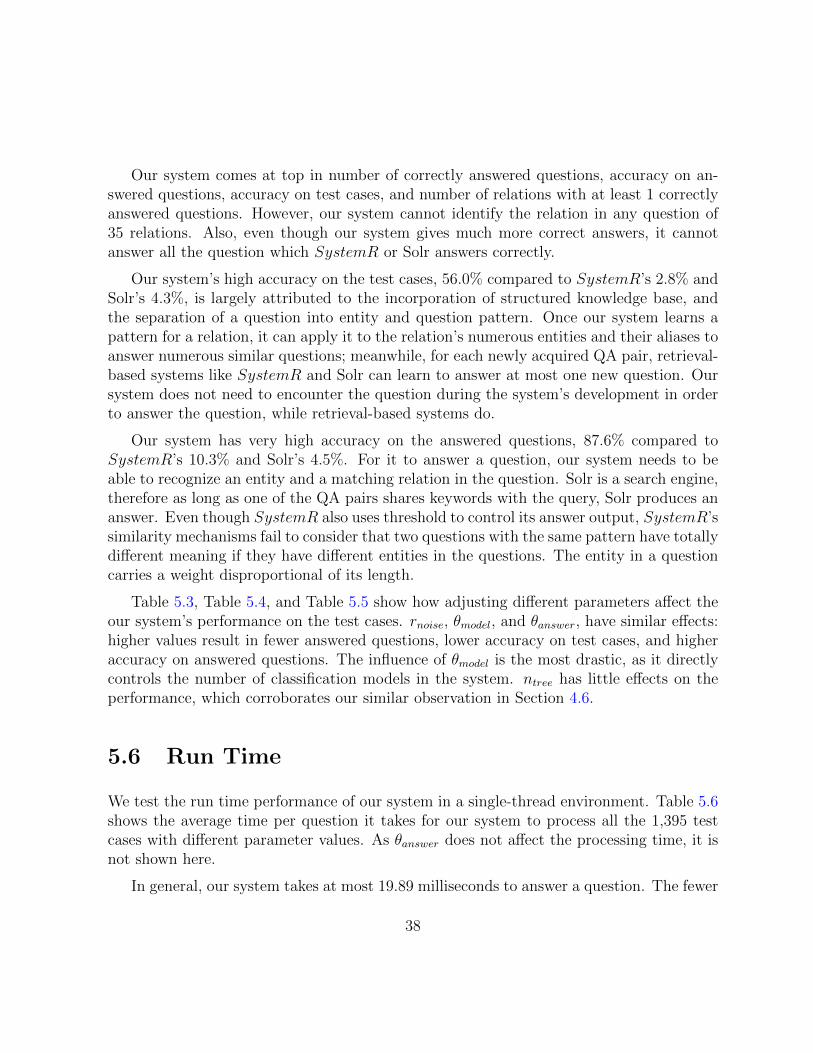
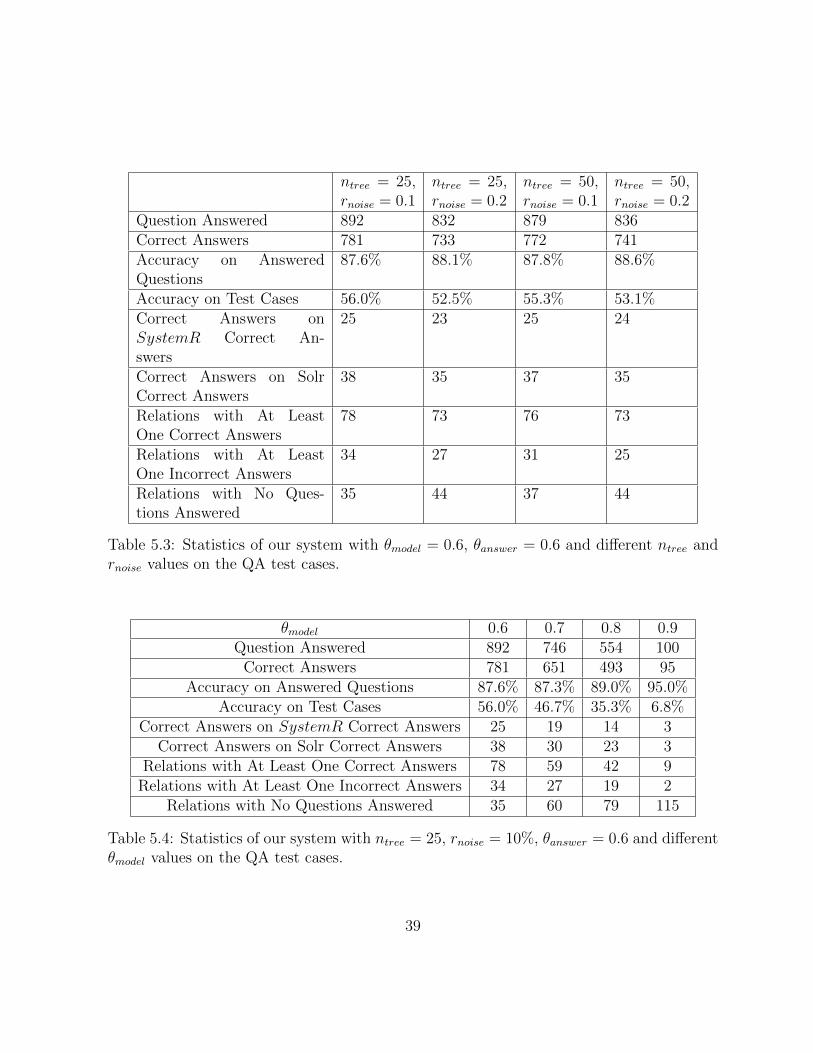
Table 5.3, Table 5.4, and Table 5.5 show how adjusting different parameters affect theour system’s performance on the test cases. rnoise, θmodel, and θanswer, have similar effects:higher values result in fewer answered questions, lower accuracy on test cases, and higheraccuracy on answered questions. The influence of θmodel is the most drastic, as it directlycontrols the number of classification models in the system. ntree has little effects on theperformance, which corroborates our similar observation in Section 4.6.
5.6 Run Time
We test the run time performance of our system in a single-thread environment. Table 5.6shows the average time per question it takes for our system to process all the 1,395 testcases with different parameter values. As θanswer does not affect the processing time, it isnot shown here.
In general, our system takes at most 19.89 milliseconds to answer a question. The fewer
38
ntree = 25,rnoise = 0.1
ntree = 25,rnoise = 0.2
ntree = 50,rnoise = 0.1
ntree = 50,rnoise = 0.2
Question Answered 892 832 879 836Correct Answers 781 733 772 741Accuracy on AnsweredQuestions
87.6% 88.1% 87.8% 88.6%
Accuracy on Test Cases 56.0% 52.5% 55.3% 53.1%Correct Answers onSystemR Correct An-swers
25 23 25 24
Correct Answers on SolrCorrect Answers
38 35 37 35
Relations with At LeastOne Correct Answers
78 73 76 73
Relations with At LeastOne Incorrect Answers
34 27 31 25
Relations with No Ques-tions Answered
35 44 37 44
Table 5.3: Statistics of our system with θmodel = 0.6, θanswer = 0.6 and different ntree andrnoise values on the QA test cases.
θmodel 0.6 0.7 0.8 0.9Question Answered 892 746 554 100
Correct Answers 781 651 493 95Accuracy on Answered Questions 87.6% 87.3% 89.0% 95.0%
Accuracy on Test Cases 56.0% 46.7% 35.3% 6.8%Correct Answers on SystemR Correct Answers 25 19 14 3
Correct Answers on Solr Correct Answers 38 30 23 3Relations with At Least One Correct Answers 78 59 42 9
Relations with At Least One Incorrect Answers 34 27 19 2Relations with No Questions Answered 35 60 79 115
Table 5.4: Statistics of our system with ntree = 25, rnoise = 10%, θanswer = 0.6 and differentθmodel values on the QA test cases.
39
θanswer 0.6 0.7 0.8 0.9Question Answered 892 873 824 753
Correct Answers 781 765 728 667Accuracy on Answered Questions 87.6% 87.6% 88.3% 88.6%
Accuracy on Test Cases 56.0% 54.8% 52.2% 47.8%Correct Answers on SystemR Correct Answers 25 25 23 22
Correct Answers on Solr Correct Answers 38 38 37 35Relations with At Least One Correct Answers 78 78 77 71
Relations with At Least One Incorrect Answers 34 34 31 28Relations with No Questions Answered 35 35 38 45
Table 5.5: Statistics of our system with ntree = 25, rnoise = 10%, θmodel = 0.6 and differentθanswer values on the QA test cases.
relations in the system, the lower the average time is. Overall, our system is shown to bea real-time QA system.
40

ntree rnoise θmodel Number of Relations Average Time (ms)25 0.1 6 130 19.8925 0.1 7 96 17.8325 0.1 8 68 15.4125 0.1 9 15 3.2425 0.2 6 118 18.2925 0.2 7 90 16.9425 0.2 8 41 13.2825 0.2 9 7 2.2150 0.1 6 131 19.8750 0.1 7 97 17.9550 0.1 8 68 16.4650 0.1 9 15 3.2450 0.2 6 118 18.8850 0.2 7 91 18.0550 0.2 8 42 13.1650 0.2 9 8 2.43
Table 5.6: System’s average run time per question and number of relations in the systemwith different ntree, rnoise, θmodel values on the QA test cases.
41
Chapter 6
Discussion
In this chapter we combine results from development and evaluation of our system to gainmore comprehensive insights.
Figure 6.1 and Figure 6.2 plot relations’ f1-measure in noise reduction and average f1-measure in classification against related relations’ questions and in classification against10% noise sample, with 25 trees in random forests. The former measures the correctness ofthe labels in the classification models’ training data, and the latter measures the separa-bility of the training data. We expect a higher percentage of correct labels in the trainingdata corresponds to better separability. However, we observe that to the left there arerelations with zero f1-measure in noise reduction yet very high f1-measure in classificationtasks, and in the lower right there are relations with high f1-measure in noise reductionyet quite low f1-measure in classification tasks.
After examining these outliers, we discover that the data of those with zero f1-measurein noise reduction consists of similar unrelated questions that are distinguishable. Forexample, “湖泊类别(Lake type)” have 63.6% questions asking about “Which lake is thebiggest e?”, where e is the entity placeholder. These questions are introduced to our systemby lakes which share the alias “淡水湖(freshwater lake)” and have value “咸水湖(saltwaterlake)”. Though the question pattern is not related to the relation and not even a single-entity-single-relation question, it is a valid question that is easily distinguishable from noiseor other question patterns. We need to improve our extraction process or noise reductionprocess to eliminate these.
On the other hand, relations with high f1-measure in noise reduction yet low f1-measurein classification tasks suffer from the problem of inadequate instances. The four relationswith the most disparity average 31 non-noise questions, while an average relation has 663
42
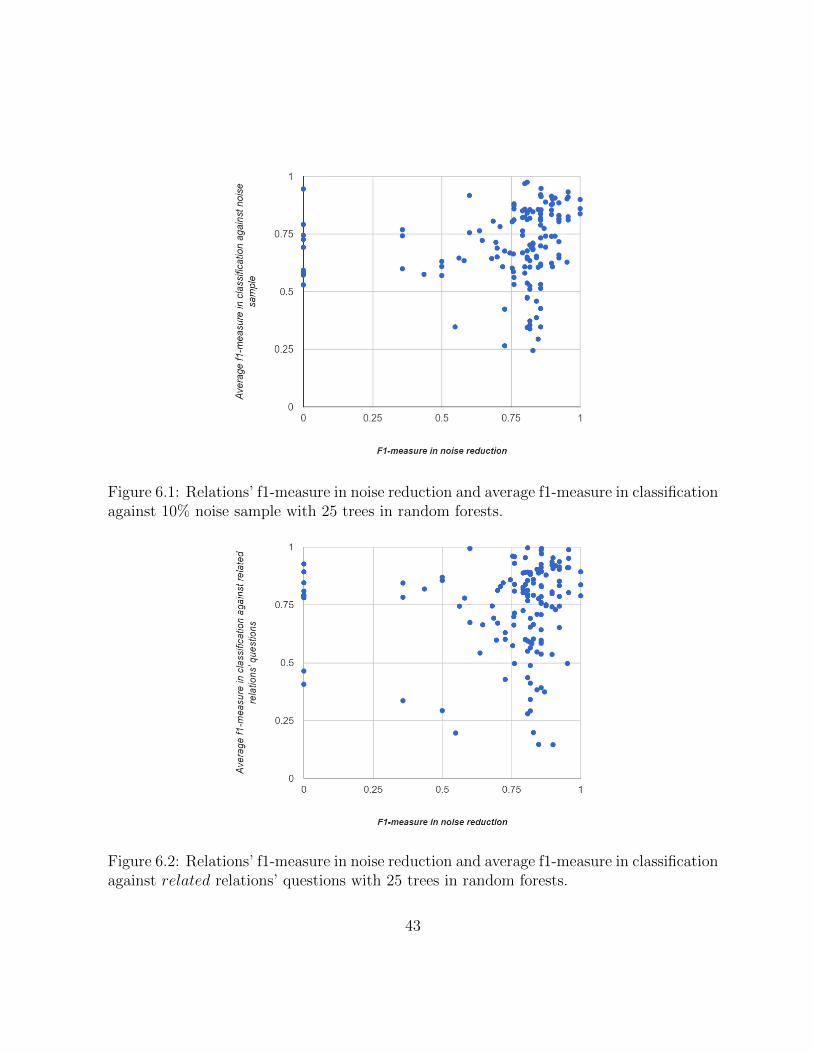
Figure 6.1: Relations’ f1-measure in noise reduction and average f1-measure in classificationagainst 10% noise sample with 25 trees in random forests.
Figure 6.2: Relations’ f1-measure in noise reduction and average f1-measure in classificationagainst related relations’ questions with 25 trees in random forests.
43
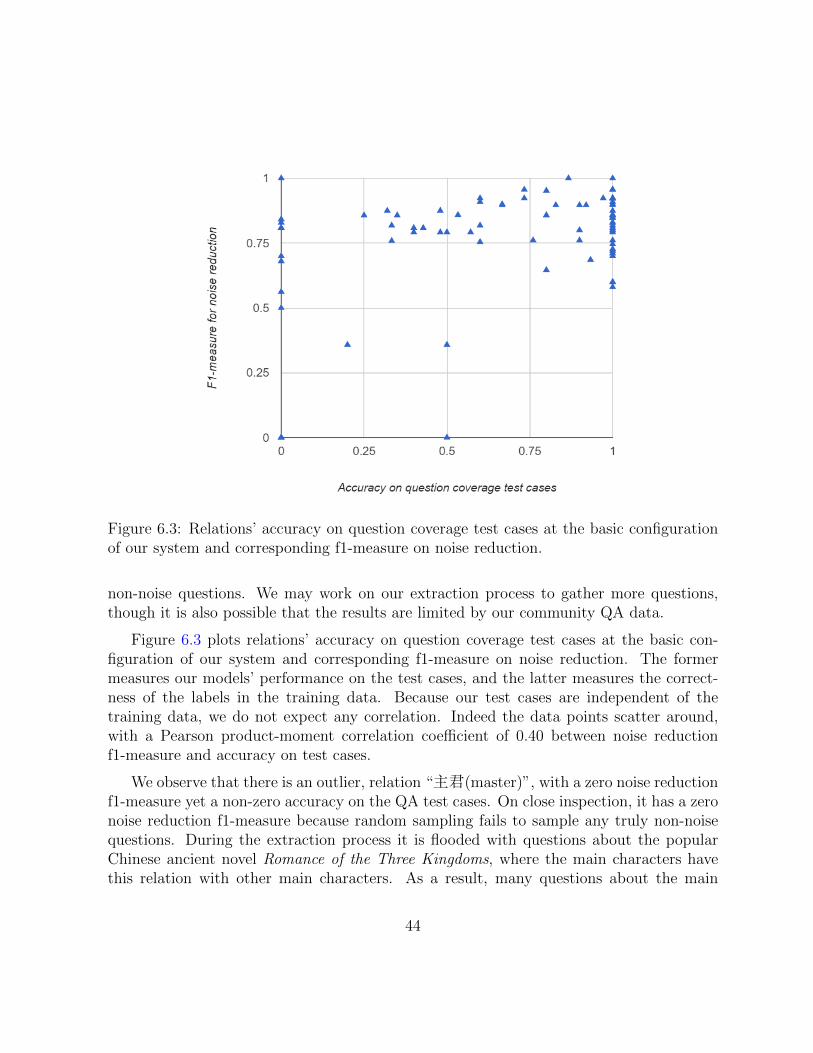
Figure 6.3: Relations’ accuracy on question coverage test cases at the basic configurationof our system and corresponding f1-measure on noise reduction.
non-noise questions. We may work on our extraction process to gather more questions,though it is also possible that the results are limited by our community QA data.
Figure 6.3 plots relations’ accuracy on question coverage test cases at the basic con-figuration of our system and corresponding f1-measure on noise reduction. The formermeasures our models’ performance on the test cases, and the latter measures the correct-ness of the labels in the training data. Because our test cases are independent of thetraining data, we do not expect any correlation. Indeed the data points scatter around,with a Pearson product-moment correlation coefficient of 0.40 between noise reductionf1-measure and accuracy on test cases.
We observe that there is an outlier, relation “主君(master)”, with a zero noise reductionf1-measure yet a non-zero accuracy on the QA test cases. On close inspection, it has a zeronoise reduction f1-measure because random sampling fails to sample any truly non-noisequestions. During the extraction process it is flooded with questions about the popularChinese ancient novel Romance of the Three Kingdoms, where the main characters havethis relation with other main characters. As a result, many questions about the main
44

Figure 6.4: Relations’ accuracy on question coverage test cases at the basic configuration ofour system and minimum of average f1-measure in classification against 10% noise sampleand in related relations’ questions with 25 trees in random forests.
characters find their way past the noise reduction process, making up the majority ofquestions with “non-noise” labeling.
Figure 6.4 plots relations’ accuracy on question coverage test cases at the basic config-uration of our system and minimum of average f1-measure in classification against relatedrelations’ questions and in classification against 10% noise sample, with 25 trees in randomforests. The former measures our models’ performance on the test cases, and the lattermeasures our models’ performance in cross validation on training data. Again, because theour test cases are independent of our training data, we expect no correlation between thetwo. Indeed, they have a Pearson product-moment correlation coefficient of 0.07.
In Table 6.1 is our system’s performance data in answer triggering and question coveragetasks with different ntree and rnoise values. The accuracy does not vary much. This showsthat ntree = 25 is a sufficient number of decision trees in random forests, and that r = 10%is a sufficiently large noise sampling rate.
In Figure 6.5 and Figure 6.6 we plot the effects of θmodel and θanswer on our system’s
45
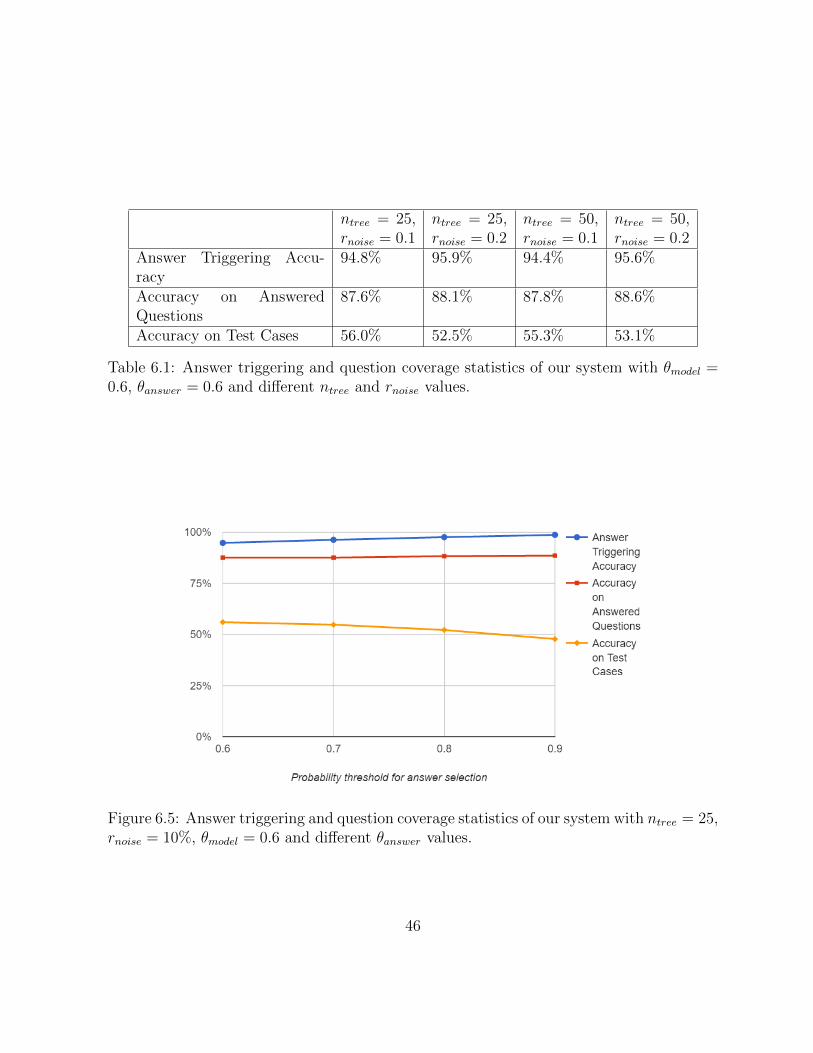
ntree = 25,rnoise = 0.1
ntree = 25,rnoise = 0.2
ntree = 50,rnoise = 0.1
ntree = 50,rnoise = 0.2
Answer Triggering Accu-racy
94.8% 95.9% 94.4% 95.6%
Accuracy on AnsweredQuestions
87.6% 88.1% 87.8% 88.6%
Accuracy on Test Cases 56.0% 52.5% 55.3% 53.1%
Table 6.1: Answer triggering and question coverage statistics of our system with θmodel =0.6, θanswer = 0.6 and different ntree and rnoise values.
Figure 6.5: Answer triggering and question coverage statistics of our system with ntree = 25,rnoise = 10%, θmodel = 0.6 and different θanswer values.
46
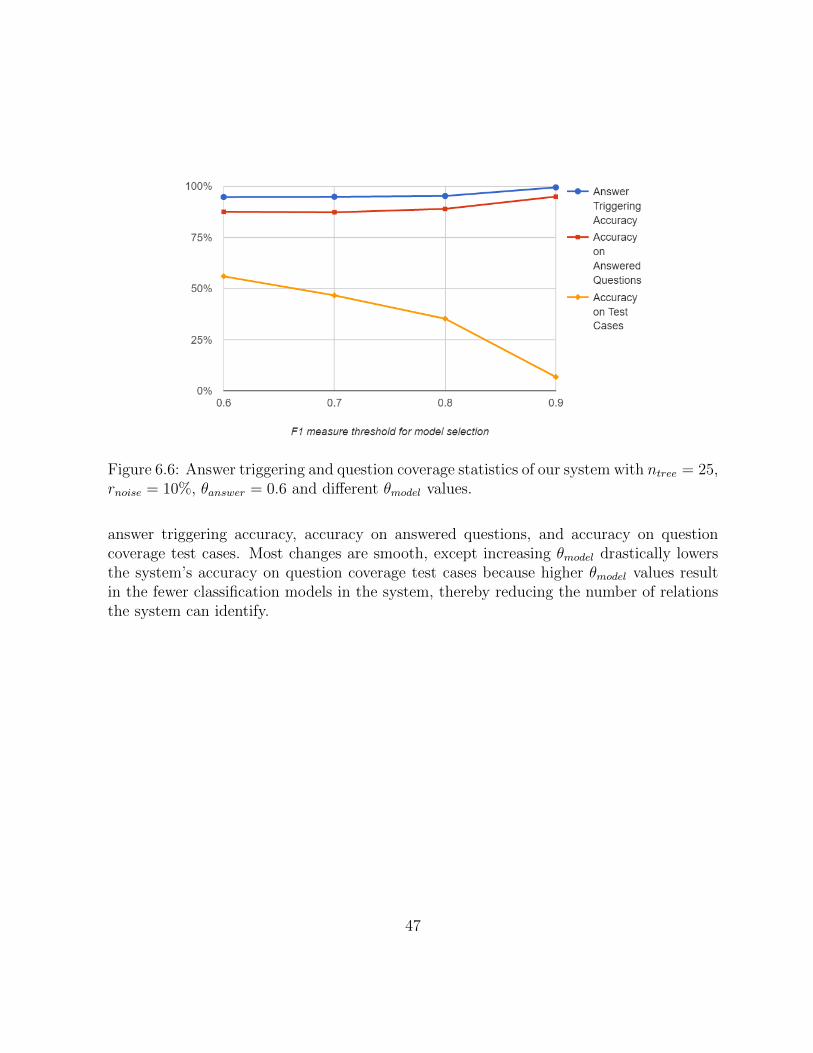
Figure 6.6: Answer triggering and question coverage statistics of our system with ntree = 25,rnoise = 10%, θanswer = 0.6 and different θmodel values.
answer triggering accuracy, accuracy on answered questions, and accuracy on questioncoverage test cases. Most changes are smooth, except increasing θmodel drastically lowersthe system’s accuracy on question coverage test cases because higher θmodel values resultin the fewer classification models in the system, thereby reducing the number of relationsthe system can identify.
47
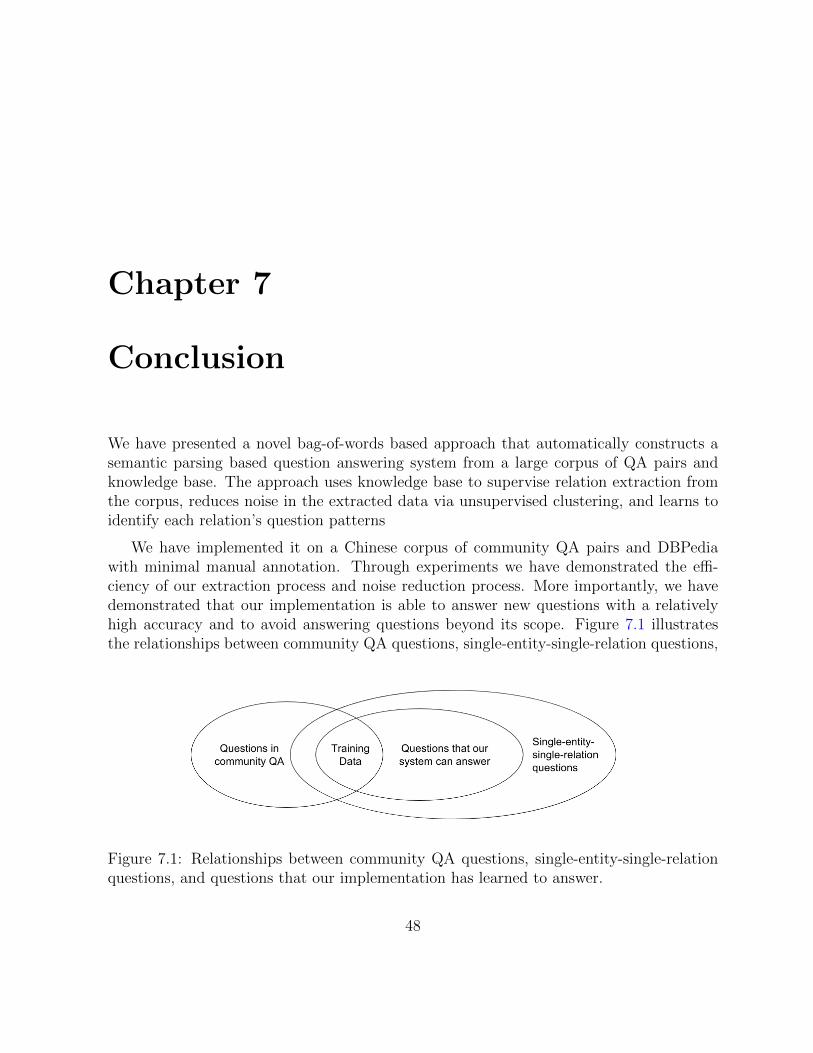
Chapter 7
Conclusion
We have presented a novel bag-of-words based approach that automatically constructs asemantic parsing based question answering system from a large corpus of QA pairs andknowledge base. The approach uses knowledge base to supervise relation extraction fromthe corpus, reduces noise in the extracted data via unsupervised clustering, and learns toidentify each relation’s question patterns
We have implemented it on a Chinese corpus of community QA pairs and DBPediawith minimal manual annotation. Through experiments we have demonstrated the effi-ciency of our extraction process and noise reduction process. More importantly, we havedemonstrated that our implementation is able to answer new questions with a relativelyhigh accuracy and to avoid answering questions beyond its scope. Figure 7.1 illustratesthe relationships between community QA questions, single-entity-single-relation questions,
Figure 7.1: Relationships between community QA questions, single-entity-single-relationquestions, and questions that our implementation has learned to answer.
48
and questions that our implementation has learned to answer. Last but not least, ourimplementation manages to answer a question within 20 milliseconds on a desktop envi-ronment.
Several open challenges remain. For better implementations, we would like to startwith automating the annotation of relation types in DBPedia by utilizing the aggregationof all values belonging to the same relation. If successful, we would be able to rid ourimplementation of any costly manual annotation. However, automatic identification of the“meta” types is a challenge in itself.
Another possible improvement for implementation would be identifying and separatingthe composite relations. Composite relations in DBPedia are a direct consequence ofambiguity of Wikipedia infobox tags and introduced by Wikipedia users incorrectly tagginginfobox properties. For example, “capital” is a composite relation in Chinese DBPedia. Itnot only includes capital cities of regions and countries, but also includes financial assets ofcompanies (the other meaning of capital). Every major component of our implementation,from extraction module to classification models, would benefit from splitting “capital” intotwo or more distinct relations.
Finally, we would like to incorporate syntactic information into our approach. So farour approach is based on bag-of-words models. Consequently, useful information suchas word order and sentence structure is lost. We want to explore introducing syntacticfeatures such as parse trees to our noise reduction procedure and classification models. Webelieve modifying the similarity measure we use to include tree-kernel functions is a goodstarting point.
49
References
[1] Soren Auer, Christian Bizer, Georgi Kobilarov, Jens Lehmann, Richard Cyganiak,and Zachary Ives. Dbpedia: A nucleus for a web of open data. In The semantic web,pages 722–735. Springer, 2007.
[2] Michele Banko, Michael J Cafarella, Stephen Soderland, Matthew Broadhead, andOren Etzioni. Open information extraction from the web. In IJCAI, volume 7, pages2670–2676, 2007.
[3] Jonathan Berant, Andrew Chou, Roy Frostig, and Percy Liang. Semantic parsing onfreebase from question-answer pairs. In EMNLP, volume 2, page 6, 2013.
[4] Jonathan Berant and Percy Liang. Semantic parsing via paraphrasing. In ACL (1),pages 1415–1425, 2014.
[5] Kurt Bollacker, Colin Evans, Praveen Paritosh, Tim Sturge, and Jamie Taylor. Free-base: a collaboratively created graph database for structuring human knowledge. InProceedings of the 2008 ACM SIGMOD international conference on Management ofdata, pages 1247–1250. ACM, 2008.
[6] Antoine Bordes, Sumit Chopra, and Jason Weston. Question answering with subgraphembeddings. arXiv preprint arXiv:1406.3676, 2014.
[7] Antoine Bordes, Nicolas Usunier, Sumit Chopra, and Jason Weston. Large-scale sim-ple question answering with memory networks. arXiv preprint arXiv:1506.02075, 2015.
[8] Leo Breiman. Random forests. Machine learning, 45(1):5–32, 2001.
[9] Razvan C Bunescu and Raymond J Mooney. A shortest path dependency kernel forrelation extraction. In Proceedings of the conference on human language technologyand empirical methods in natural language processing, pages 724–731. Association forComputational Linguistics, 2005.
50
[10] Hang Cui, Renxu Sun, Keya Li, Min-Yen Kan, and Tat-Seng Chua. Question answer-ing passage retrieval using dependency relations. In Proceedings of the 28th annualinternational ACM SIGIR conference on Research and development in informationretrieval, pages 400–407. ACM, 2005.
[11] Martin Ester, Hans-Peter Kriegel, Jorg Sander, and Xiaowei Xu. A density-based algo-rithm for discovering clusters in large spatial databases with noise. In Kdd, volume 96,pages 226–231, 1996.
[12] Anthony Fader, Stephen Soderland, and Oren Etzioni. Identifying relations for openinformation extraction. In Proceedings of the Conference on Empirical Methods inNatural Language Processing, pages 1535–1545. Association for Computational Lin-guistics, 2011.
[13] Anthony Fader, Luke S Zettlemoyer, and Oren Etzioni. Paraphrase-driven learningfor open question answering. In ACL (1), pages 1608–1618. Citeseer, 2013.
[14] Bert F Green Jr, Alice K Wolf, Carol Chomsky, and Kenneth Laughery. Baseball:an automatic question-answerer. In Papers presented at the May 9-11, 1961, westernjoint IRE-AIEE-ACM computer conference, pages 219–224. ACM, 1961.
[15] Zhou GuoDong, Su Jian, Zhang Jie, and Zhang Min. Exploring various knowledgein relation extraction. In Proceedings of the 43rd annual meeting on association forcomputational linguistics, pages 427–434. Association for Computational Linguistics,2005.
[16] Mark Hall, Eibe Frank, Geoffrey Holmes, Bernhard Pfahringer, Peter Reutemann,and Ian H Witten. The weka data mining software: an update. ACM SIGKDDexplorations newsletter, 11(1):10–18, 2009.
[17] Michael Heilman and Noah A Smith. Tree edit models for recognizing textual entail-ments, paraphrases, and answers to questions. In Human Language Technologies: The2010 Annual Conference of the North American Chapter of the Association for Com-putational Linguistics, pages 1011–1019. Association for Computational Linguistics,2010.
[18] Johannes Hoffart, Fabian M Suchanek, Klaus Berberich, and Gerhard Weikum. Yago2:A spatially and temporally enhanced knowledge base from wikipedia. Artificial Intel-ligence, 194:28–61, 2013.
51
[19] Nanda Kambhatla. Combining lexical, syntactic, and semantic features with maxi-mum entropy models for extracting relations. In Proceedings of the ACL 2004 on In-teractive poster and demonstration sessions, page 22. Association for ComputationalLinguistics, 2004.
[20] Tom Kwiatkowski, Luke Zettlemoyer, Sharon Goldwater, and Mark Steedman. In-ducing probabilistic ccg grammars from logical form with higher-order unification. InProceedings of the 2010 conference on empirical methods in natural language process-ing, pages 1223–1233. Association for Computational Linguistics, 2010.
[21] Cody Kwok, Oren Etzioni, and Daniel S Weld. Scaling question answering to the web.ACM Transactions on Information Systems (TOIS), 19(3):242–262, 2001.
[22] Tomas Mikolov, Ilya Sutskever, Kai Chen, Greg S Corrado, and Jeff Dean. Distributedrepresentations of words and phrases and their compositionality. In Advances in neuralinformation processing systems, pages 3111–3119, 2013.
[23] George A Miller. Wordnet: a lexical database for english. Communications of theACM, 38(11):39–41, 1995.
[24] Mike Mintz, Steven Bills, Rion Snow, and Dan Jurafsky. Distant supervision forrelation extraction without labeled data. In Proceedings of the Joint Conference ofthe 47th Annual Meeting of the ACL and the 4th International Joint Conference onNatural Language Processing of the AFNLP: Volume 2-Volume 2, pages 1003–1011.Association for Computational Linguistics, 2009.
[25] Barbara Plank and Alessandro Moschitti. Embedding semantic similarity in treekernels for domain adaptation of relation extraction. In ACL (1), pages 1498–1507,2013.
[26] Yusuke Shinyama and Satoshi Sekine. Preemptive information extraction using unre-stricted relation discovery. In Proceedings of the main conference on Human LanguageTechnology Conference of the North American Chapter of the Association of Compu-tational Linguistics, pages 304–311. Association for Computational Linguistics, 2006.
[27] Richard Socher, Brody Huval, Christopher D Manning, and Andrew Y Ng. Semanticcompositionality through recursive matrix-vector spaces. In Proceedings of the 2012Joint Conference on Empirical Methods in Natural Language Processing and Compu-tational Natural Language Learning, pages 1201–1211. Association for ComputationalLinguistics, 2012.
52

[28] Di Wang and Eric Nyberg. A long short-term memory model for answer sentenceselection in question answering. ACL, July, 2015.
[29] Mengqiu Wang. A re-examination of dependency path kernels for relation extraction.In IJCNLP, pages 841–846, 2008.
[30] William A Woods and R Kaplan. Lunar rocks in natural english: Explorations in nat-ural language question answering. Linguistic structures processing, 5:521–569, 1977.
[31] Yi Yang, Wen-tau Yih, and Christopher Meek. Wikiqa: A challenge dataset for open-domain question answering. In Proceedings of EMNLP, pages 2013–2018. Citeseer,2015.
[32] Xuchen Yao and Benjamin Van Durme. Information extraction over structured data:Question answering with freebase. In ACL (1), pages 956–966. Citeseer, 2014.
[33] Wen-tau Yih, Ming-Wei Chang, Christopher Meek, and Andrzej Pastusiak. Questionanswering using enhanced lexical semantic models. 2013.
[34] Wen-tau Yih, Xiaodong He, and Christopher Meek. Semantic parsing for single-relation question answering. In ACL (2), pages 643–648. Citeseer, 2014.
[35] Dmitry Zelenko, Chinatsu Aone, and Anthony Richardella. Kernel methods for rela-tion extraction. Journal of machine learning research, 3(Feb):1083–1106, 2003.
[36] Daojian Zeng, Kang Liu, Siwei Lai, Guangyou Zhou, Jun Zhao, et al. Relation classi-fication via convolutional deep neural network. In COLING, pages 2335–2344, 2014.
[37] Luke S Zettlemoyer and Michael Collins. Online learning of relaxed ccg grammars forparsing to logical form. In EMNLP-CoNLL, pages 678–687, 2007.
[38] Luke S Zettlemoyer and Michael Collins. Learning to map sentences to logicalform: Structured classification with probabilistic categorial grammars. arXiv preprintarXiv:1207.1420, 2012.
[39] Min Zhang, Jie Zhang, Jian Su, and Guodong Zhou. A composite kernel to extractrelations between entities with both flat and structured features. In Proceedings ofthe 21st International Conference on Computational Linguistics and the 44th annualmeeting of the Association for Computational Linguistics, pages 825–832. Associationfor Computational Linguistics, 2006.
53

[40] Zhiping Zheng. Answerbus question answering system. In Proceedings of the secondinternational conference on Human Language Technology Research, pages 399–404.Morgan Kaufmann Publishers Inc., 2002.
54


![Development and Health Introduction Single Indicator Questions[Date] Today I will: - Be confident in answering single indicator questions](https://img.pdfslide.net/doc/110x75/56649da35503460f94a90169/development-and-health-introduction-single-indicator-questionsdate-today.jpg)