Embed Size (px)
Citation preview
SIRT1 expression, energy expenditure and insulin sensitivity
SIRT1 mRNA Expression May Be Associated with
Energy Expenditure and Insulin Sensitivity
Running title: SIRT1 expression, energy expenditure and insulin sensitivity
Jarno Rutanen1, Nagendra Yaluri
1, Shalem Modi
1, Jussi Pihlajamäki
1, Markku Vänttinen
1, Paula
Itkonen1, Sakari Kainulainen
2, Hiroyasu Yamamoto
3,4, Marie Lagouge
3, David A. Sinclair
5, Peter
Elliott6, Christoph Westphal
6, Johan Auwerx
3,4, and Markku Laakso
1
1 Department of Medicine, University of Kuopio and Kuopio University Hospital, Kuopio,
Finland 2 Department of Clinical Radiology, University of Kuopio, Kuopio, Finland
3 Institut de Génétique et de Biologie Moléculaire et Cellulaire, CNRS/INSERM/ULP, Illkirch,
France 4
Laboratory of Integrative and Systems Physiology, Ecole Polytechnique Fédérale de Lausanne
(EPFL), Switzerland 5 Department of Pathology and Glenn Labs for Aging research, Harvard Medical School, Boston,
MA 02115, USA 6
Sirtris Pharmaceuticals, Cambridge, MA, USA
Correspondence:
Markku Laakso, MD,
E mail: [email protected]
Submitted 11 August 2009 and accepted 20 January 2010.
Additional information for this article can be found in an online appendix at
http://diabetes.diabetesjournals.org
This is an uncopyedited electronic version of an article accepted for publication in Diabetes. The American Diabetes Association, publisher of Diabetes, is not responsible for any errors or omissions in this version of the manuscript or any version derived from it by third parties. The definitive publisher-authenticated version will be available in a future issue of Diabetes in print and online at
http://diabetes.diabetesjournals.org.
Diabetes Publish Ahead of Print, published online January 27, 2010
Copyright American Diabetes Association, Inc., 2010
SIRT1 expression, energy expenditure and insulin sensitivity
2
Objective - Sirtuin 1 (SIRT1) is implicated in the regulation of mitochondrial function, energy
metabolism, and insulin sensitivity in rodents. No studies are available in humans to demonstrate
that SIRT1 expression in insulin sensitive tissues is associated with energy expenditure and
insulin sensitivity.
Research Design And Methods - Energy expenditure (EE), insulin sensitivity, and SIRT1 mRNA
adipose tissue expression (N=81) were measured by indirect calorimetry, euglycemic
hyperinsulinemic clamp, and quantitative RT-PCR in 247 non-diabetic offspring of type 2
diabetic patients.
Results - High EE during the clamp (r=0.375, P = 2.8×10⁻⁹
) and high ∆EE (EE during the clamp
- EE in the fasting state) (r=0.602, P = 2.5×10⁻²⁴
) were associated with high insulin sensitivity.
Adipose tissue SIRT1 mRNA expression was significantly associated with EE (r = 0.289, P =
0.010) and with insulin sensitivity (r = 0.334, P = 0.002) during hyperinsulinemic euglycemic
clamp. Furthermore, SIRT1 mRNA expression correlated significantly with the expression of
several genes regulating mitochondrial function and energy metabolism (e.g. PGC-1β, estrogen-
related receptor α , nuclear respiratory factor -1, mitochondrial transcription factor A), and with
several genes of the respiratory chain (e.g. including NADH dehydrogenase (ubiquinone) 1α
subcomplex, 2, cytochrome c, cytochrome c oxidase subunit IV, and ATP synthase).
Conclusions - Impaired stimulation of EE by insulin and low SIRT1 expression in insulin
sensitive tissues are likely to reflect impaired regulation of mitochondrial function associated
with insulin resistance in humans.
SIRT1 expression, energy expenditure and insulin sensitivity
3
ompromised mitochondrial
function in skeletal muscle
predisposes to insulin
resistance and type 2 diabetes (1,2). In
contrast, physical activity and weight loss in
obese and sedentary subjects stimulate
mitochondrial biogenesis and improve insulin
sensitivity (3). Animal and human studies
have shown that mitochondrial function is
associated with insulin sensitivity but the
mechanisms explaining this association are
largely unknown (4).
The mammalian sirtuins SIRT1-
SIRT7 are implicated in gene silencing,
mitochondrial function, energy homeostasis,
insulin sensitivity and longevity (5). We
previously demonstrated that the treatment
with SIRT1 activator, resveratrol, enhanced
mitochondrial activity and protected mice
from diet-induced obesity and insulin
resistance (4). The effects of resveratrol were
seen in both muscle and adipose tissue and
resulted in an increase in mitochondrial
function, which translated into an increase in
energy expenditure (EE) and insulin
sensitivity. Small molecule activators of
SIRT1, that are structurally unrelated to
resveratrol, have also been shown to improve
insulin sensitivity, lower plasma glucose, and
increase mitochondrial capacity (6). In many
rodent models (4, 7) the up-regulation of the
oxidative phosphorylation (OXPHOS)
pathway is coordinated by peroxisome
proliferator-activated receptor gamma
coactivator α (PGC-1α), which is a target of
SIRT1 (8). Similarly, insulin resistance in
human skeletal muscle has been associated
with decreased mitochondrial oxidative
capacity and ATP synthesis, and decreased
expression of genes that control mitochondrial
activity, including PGC-1α (9-11).
The offspring of type 2 diabetic
subjects are known to be insulin resistant and
they have defects in mitochondrial OXPHOS
associated with increased intramyocellular
lipid content (9). The association of EE and
insulin sensitivity with SIRT1 and PGC-1α
mRNA expression has not been previously
investigated. Therefore, we studied here the
association of EE, insulin sensitivity and
adipose tissue SIRT1 and PGC-1α mRNA
expression in 247 non-diabetic offspring of
subjects with type 2 diabetes.
RESEARCH DESIGN AND METHODS
Participants. The subjects were
selected from an ongoing study and included
healthy non-diabetic offspring of patients with
type 2 diabetes, as previously described (12).
The diabetic patients (probands) were
randomly selected among type 2 diabetic
subjects living in the region of the Kuopio
University Hospital. Spouses of the probands
had to have a normal glucose tolerance in an
oral glucose tolerance test (OGTT). The study
protocol was approved by the Ethics
Committee of the University of Kuopio. All
study subjects gave an informed consent. A
total of 247 offspring (1-3 from each family)
were studied. Their mean (±SD) age was 35.1
± 6.3 years, and body mass index (BMI) 26.3
± 4.7 kg/m2.
Clinical and laboratory methods.
Height and weight were measured to the
nearest 0.5 cm and 0.1 kg, respectively. BMI
was calculated
as weight (kg) divided by
height (m) squared. On the first day an OGTT
was performed with 75 g of glucose. Subjects
with normal glucose tolerance (N = 210),
isolated impaired fasting glucose (N = 6) or
impaired glucose tolerance (N = 31), defined
on the basis of the WHO criteria (13), were
included in further studies. An intravenous
glucose tolerance test (IVGTT) was
performed to determine the first-phase insulin
release after an overnight fast. After baseline
blood
collection, a bolus of glucose (300
mg/kg in a 50% solution) was given within 30
seconds into the antecubital vein. Samples for
the measurement of blood glucose and plasma
C
SIRT1 expression, energy expenditure and insulin sensitivity
4
insulin (arterialized
venous blood) were
drawn at –5, 0, 2, 4, 6, 8, 10, 20, 30, 40, 50,
and 60 minutes. After an IVGTT, the degree
of insulin sensitivity was evaluated with the
euglycemic hyperinsulinemic clamp
technique (insulin infusion rate of 40 mU ·
min–1
· m–2
body surface area) as previously
described (14). Blood glucose was clamped at
5.0 mmol/L for the next 120 minutes by
infusion
of 20% glucose at various rates
according to blood glucose measurements
performed at 5-minute intervals. The mean
amount of glucose infused during the last 20
minutes of the clamp was used to calculate
the rates of whole body glucose uptake
(WBGU) and divided with lean body mass
(LBM) for statistical analyses. Non-oxidative
glucose metabolism (per LBM) was
calculated as the difference between the rates
of WBGU/LBM and glucose oxidation (per
LBM). Indirect calorimetry was performed
with a computerized flow-through canopy gas
analyzer system (DELTATRAC, TM Datex)
as previously described (14). The mean value
of the data during the last 20 minutes of the
clamp was used to calculate glucose and lipid
oxidation.
Protein, glucose, and lipid
oxidation were calculated according to the
method reported by Ferrannini (15). A CT
scan (Siemens Volume Zoom) at the level of
fourth lumbal vertebra was performed to
evaluate the amount of intra-abdominal and
subcutaneous fat as previously described (14).
Blood and plasma glucose were measured by
the glucose oxidase
method (Glucose &
Lactate Analyzer 2300 Stat Plus, Yellow
Springs Instrument Co, Inc), and plasma
insulin was determined by radioimmunoassay
(Phadeseph Insulin RIA 100,
Pharmacia
Diagnostics AB; 125J RIA Kit, Incstar Co,
respectively). Serum free-fatty acids (FFAs)
were determined
by an enzymatic method
from Wako Chemicals GmbH.
Nonprotein
urinary nitrogen was measured by automated
Kjeldahl method as previously described (14).
Plasma concentrations of tumor
necrosis
factor-α (TNF-α) and cytokines (interleukin
[IL]-1 receptor antagonist [IL-1RA], IL-6, IL-
8, IL-10, IL-18, interferon gamma [IFNγ])
and serum levels
of soluble adhesion
molecules (intercellular adhesion molecule
[ICAM-1], vascular cell adhesion molecule
[VCAM-1], E-selectin, and P-selectin) were
measured with high-sensitivity assay kits from
R&D Systems. IL-8 was measured with a kit
from Biosource International. High-sensitivity
C-reactive protein (hs-CRP) was measured
with an Immulite analyzer and a DPC high-
sensitivity CRP assay.
Gene expression studies in offspring
of type 2 diabetic parents. Subcutaneous fat
needle biopsies were taken after an overnight
fast in a supine position at the level of the
umbilicus during local anesthesia. Total RNA
from adipose tissue (N=81) was isolated with
RNeasy Lipid Tissue Mini kit (Qiagen
GmbH) and treated with DNase (DNA-free,
Ambion). Total RNA from skeletal muscle
biopsies (N=11) was isolated with QIAzol
(Qiagen GmbH) and cleaned with RNeasy
Plus Micro Kit (Qiagen GmbH). RNA was
transcribed to cDNA using random primers
and a High Capacity cDNA Reverse
Transcription Kit (Applied Biosystems).
Quantitative RT-PCRs were performed in a
7 500 Real-Time PCR System (Applied
Biosystems) using 6 ng (RNA equivalents) of
cDNA as template, gene-specific primers and
probes (Applied Biosystems; information on
primers and probes available upon request).
Expression levels of different genes were
normalized to large ribosomal protein P0
(adipose tissue; Hs99999902_ml, Applied
Biosystems) or to ß-actin (skeletal muscle;
Hs99999903_m1, Applied Biosystems) using
the standard curve method.
Sirt1 mRNA expression studies in
mice: Total RNA was isolated from adipose
tissue samples of 5 months old female
transgenic (DBA/2 x Balb/c) mice using TRI
reagent (Ambion) according to the
manufacturer's guidelines. The resulting total
SIRT1 expression, energy expenditure and insulin sensitivity
5
RNA was subjected to DNase treatment using
RNase-free DNase (Ambion). The purity of
isolated RNA was measured by a NanoDrop
spectrophotometer. A set concentration of
RNA was reverse transcribed into cDNA and
quantitative PCR was performed on ABI
Prism 7500 Sequence Detection System
(Applied Biosystems). Inventoried Taqman
primers for Sirt1 (Mm01168521_m1) and
GAPDH (Mm99999915_g1) were purchased
from Applied Biosystems. Sirt1 expression
was normalized to the copy number of
GAPDH.
Sirt1 protein expression studies in
mice: Adipose tissue samples were
homogenized and proteins extracted using T-
PER (# 78510, Pierce) along with protease
inhibitors and phosphatase inhibitors (Roche,
USA) from the same mice as in mRNA
expression studies. After homogenization,
tissue lysates were centrifuged for 30 minutes
at high speed, and supernatant was collected
and stored at -70oC until further analysis.
Protein concentrations were measured with
BCA protein assay kit (# 23225, Pierce,
Rockford, USA). 20 µg/lane of protein
samples containing NuPAGE LDS sample
buffer (Invitrogen) and reducing agent were
loaded into 4-12% NuPAGE Bis-Tris gels
(Invitrogen) and were subjected to gel
electrophoresis and transferred to
polyvinylidene fluoride (PVDF) membranes
(Amersham). For Sirt1 proteins, the
membranes were blocked in Tris-buffered
saline (TBS) with 3% milk and 0.05%Tween-
20 for 1 hour at room temperature, washed
with TBS-0.05%Tween-20 for 3x5 minutes
and incubated overnight at +4ºC with
SIRT1(# 07-131, Millipore) primary
antibodies (1:1000). The membranes were
washed with TBS-0.05%Tween-20 for 3x5
minutes before incubating them with
secondary anti-rabbit horseradish peroxidase–
conjugated immunoglobulin (#NA934V, GE
Health Care, UK Ltd.) (1:40,000) for 2 hours
at room temperature. The membranes were
finally washed with TBS-0.05%Tween-20 for
3x5 minutes. For GAPDH, the membranes
were blocked in Tris buffered saline (TBS)
with 5% milk and 0.1% Tween-20 for 2 hours
at room temperature, washed with TBS-
0.1%Tween-20 for 3x5 minutes and incubated
with GAPDH (# ab8245, abcam) primary
antibodies (1:5000) overnight at +4ºC. The
membranes were washed with TBS-
0.1%Tween-20 for 3x5 minutes before
incubating them with secondary anti-mouse
horseradish peroxidase–conjugated
immunoglobulin (# NA931V, GE Health
Care, UK Ltd.) (1:10000) in TBS-
0.1%Tween-20 for 1 hour at room
temperature. The membranes were finally
washed with TBS-0.1%Tween-20 for 3x5
minutes. The bands were visualized using
chemiluminescence (ECL plus, GE Health
Care) and images were captured in Image
Quant RT-ECL machine (Version 1.0.1, GE
Health Care). Quantification of the bands was
done by applying Quantity One software
(Biorad). Sirt1 protein expression was
normalized to GAPDH protein levels. The
experiments were repeated four times.
Statistical analysis. Data analyses
were carried out with the SPSS 14.0 for
Windows. The results for continuous
variables are given as mean ± SD. Variables
with skewed distribution (glucose, insulin,
FFAs, subcutaneous and intra-abdominal fat)
were logarithmically transformed for
statistical analyses. Linear regression was
used to calculate the correlations. Uni- and
multivariate regression model was applied to
assess the determinants of the rates of the
WBGU. Linear mixed model analysis was
applied to adjust for confounding factors. For
mixed model analysis we included the
pedigree (coded as a family number) as a
random factor, the tertiles as fixed factors and
age as a covariate.
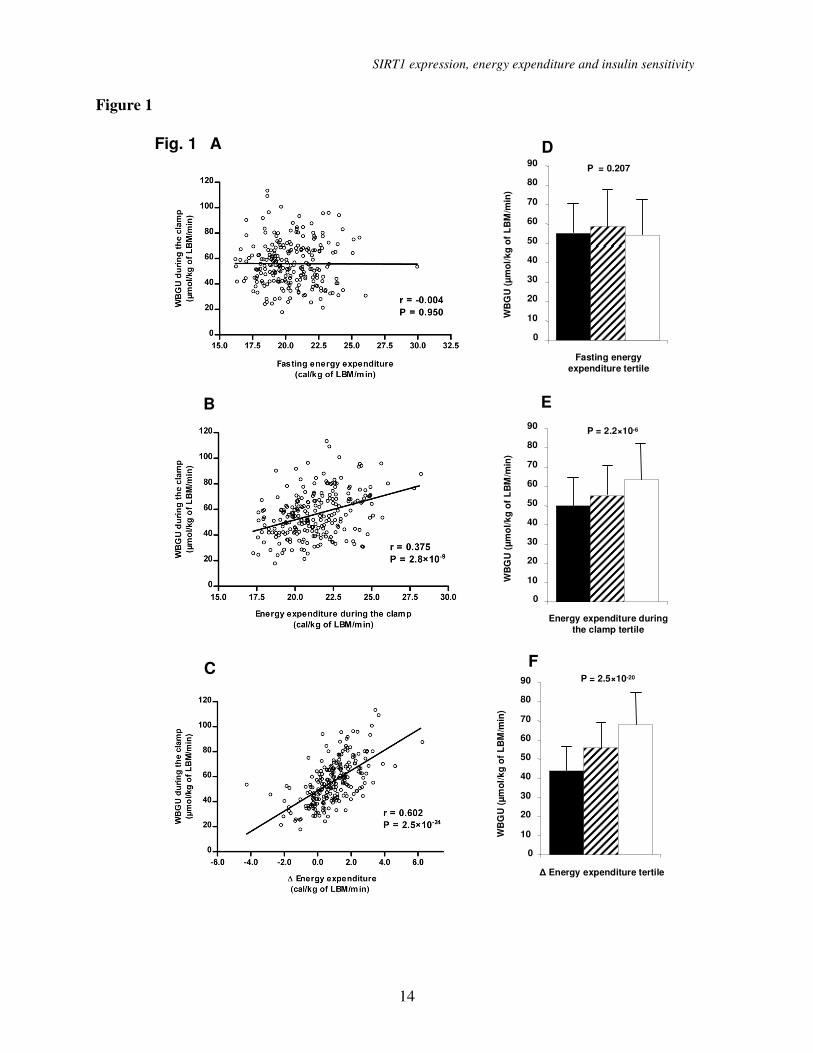
RESULTS Energy expenditure and insulin
SIRT1 expression, energy expenditure and insulin sensitivity
6
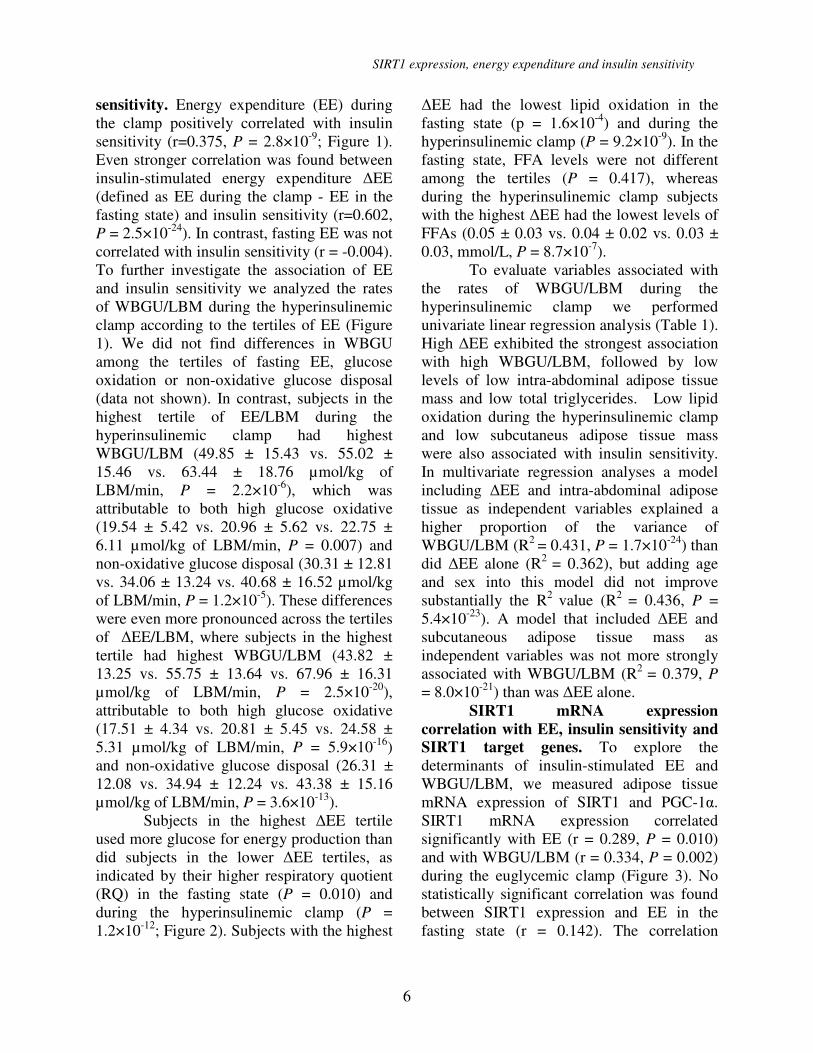
sensitivity. Energy expenditure (EE) during
the clamp positively correlated with insulin
sensitivity (r=0.375, P = 2.8×10⁻⁹
; Figure 1).
Even stronger correlation was found between
insulin-stimulated energy expenditure ∆EE
(defined as EE during the clamp - EE in the
fasting state) and insulin sensitivity (r=0.602,
P = 2.5×10⁻²⁴
). In contrast, fasting EE was not
correlated with insulin sensitivity (r = -0.004).
To further investigate the association of EE
and insulin sensitivity we analyzed the rates
of WBGU/LBM during the hyperinsulinemic
clamp according to the tertiles of EE (Figure
1). We did not find differences in WBGU
among the tertiles of fasting EE, glucose
oxidation or non-oxidative glucose disposal
(data not shown). In contrast, subjects in the
highest tertile of EE/LBM during the
hyperinsulinemic clamp had highest
WBGU/LBM (49.85 ± 15.43 vs. 55.02 ±
15.46 vs. 63.44 ± 18.76 µmol/kg of
LBM/min, P = 2.2×10⁻⁶
), which was
attributable to both high glucose oxidative
(19.54 ± 5.42 vs. 20.96 ± 5.62 vs. 22.75 ±
6.11 µmol/kg of LBM/min, P = 0.007) and
non-oxidative glucose disposal (30.31 ± 12.81
vs. 34.06 ± 13.24 vs. 40.68 ± 16.52 µmol/kg
of LBM/min, P = 1.2×10⁻⁵
). These differences
were even more pronounced across the tertiles
of ∆EE/LBM, where subjects in the highest
tertile had highest WBGU/LBM (43.82 ±
13.25 vs. 55.75 ± 13.64 vs. 67.96 ± 16.31
µmol/kg of LBM/min, P = 2.5×10⁻²⁰
),
attributable to both high glucose oxidative
(17.51 ± 4.34 vs. 20.81 ± 5.45 vs. 24.58 ±
5.31 µmol/kg of LBM/min, P = 5.9×10⁻¹⁶
)
and non-oxidative glucose disposal (26.31 ±
12.08 vs. 34.94 ± 12.24 vs. 43.38 ± 15.16
µmol/kg of LBM/min, P = 3.6×10⁻¹³
).
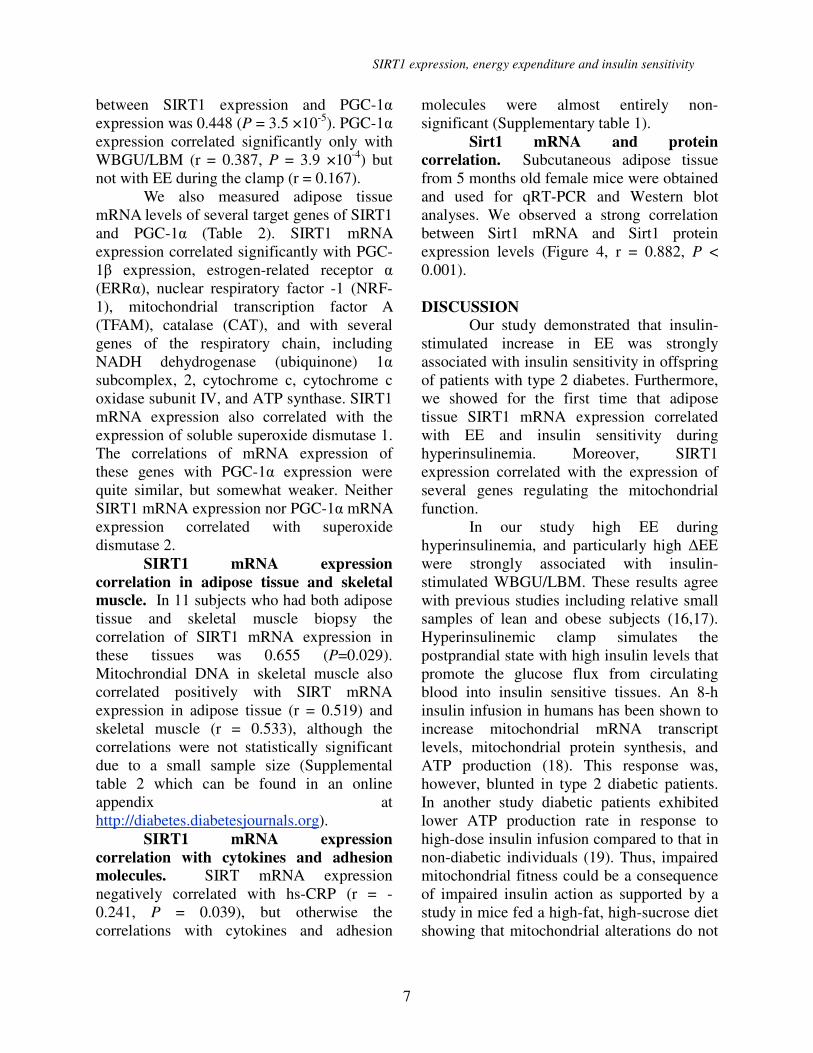
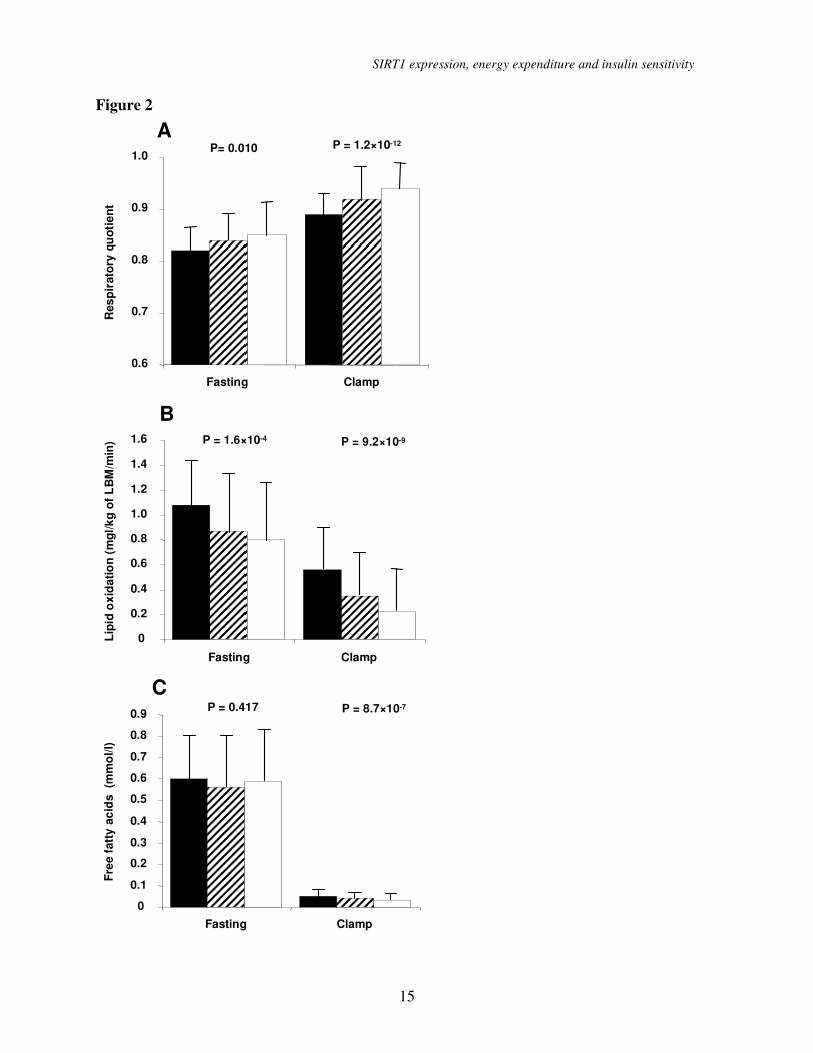
Subjects in the highest ∆EE tertile
used more glucose for energy production than
did subjects in the lower ∆EE tertiles, as
indicated by their higher respiratory quotient
(RQ) in the fasting state (P = 0.010) and
during the hyperinsulinemic clamp (P =
1.2×10⁻¹²
; Figure 2). Subjects with the highest
∆EE had the lowest lipid oxidation in the
fasting state (p = 1.6×10⁻⁴
) and during the
hyperinsulinemic clamp (P = 9.2×10⁻⁹
). In the
fasting state, FFA levels were not different
among the tertiles (P = 0.417), whereas
during the hyperinsulinemic clamp subjects
with the highest ∆EE had the lowest levels of
FFAs (0.05 ± 0.03 vs. 0.04 ± 0.02 vs. 0.03 ±
0.03, mmol/L, P = 8.7×10⁻⁷
).
To evaluate variables associated with
the rates of WBGU/LBM during the
hyperinsulinemic clamp we performed
univariate linear regression analysis (Table 1).
High ∆EE exhibited the strongest association
with high WBGU/LBM, followed by low
levels of low intra-abdominal adipose tissue
mass and low total triglycerides. Low lipid
oxidation during the hyperinsulinemic clamp
and low subcutaneus adipose tissue mass
were also associated with insulin sensitivity.
In multivariate regression analyses a model
including ∆EE and intra-abdominal adipose
tissue as independent variables explained a
higher proportion of the variance of
WBGU/LBM (R2
= 0.431, P = 1.7×10⁻²⁴
) than
did ∆EE alone (R2
= 0.362), but adding age
and sex into this model did not improve
substantially the R2
value (R2
= 0.436, P =
5.4×10⁻²³
). A model that included ∆EE and
subcutaneous adipose tissue mass as
independent variables was not more strongly
associated with WBGU/LBM (R2
= 0.379, P
= 8.0×10⁻²¹
) than was ∆EE alone.
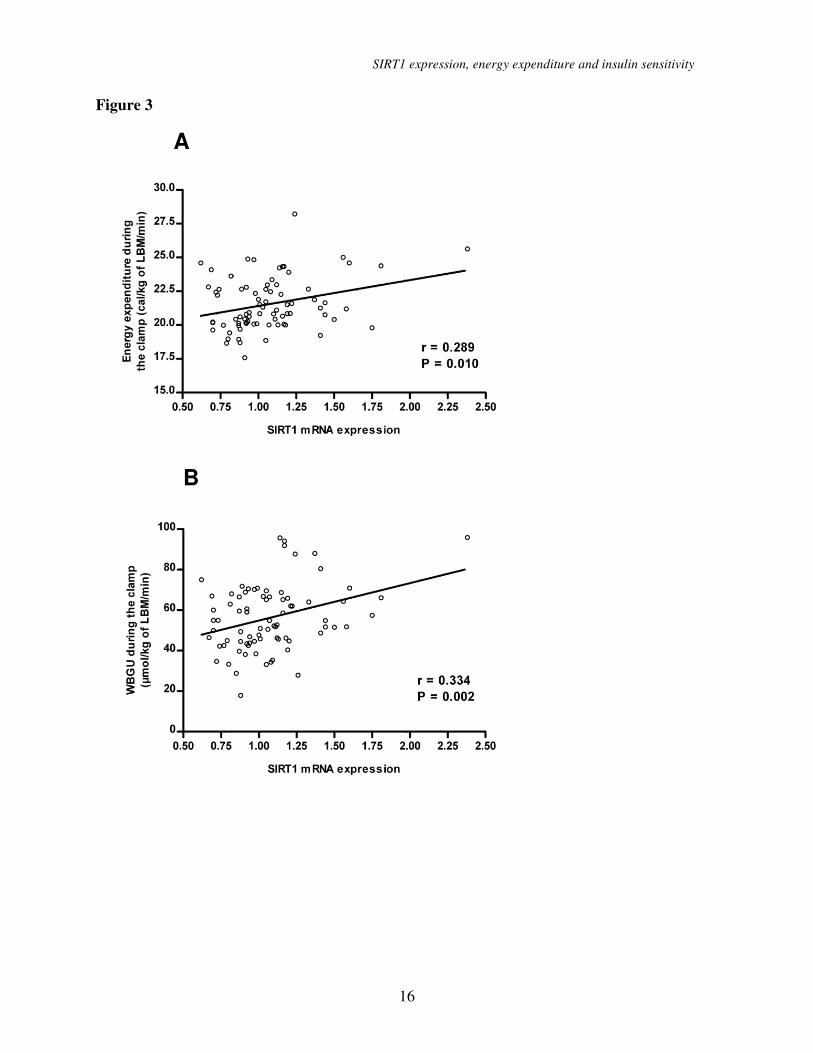
SIRT1 mRNA expression
correlation with EE, insulin sensitivity and
SIRT1 target genes. To explore the
determinants of insulin-stimulated EE and
WBGU/LBM, we measured adipose tissue
mRNA expression of SIRT1 and PGC-1α.
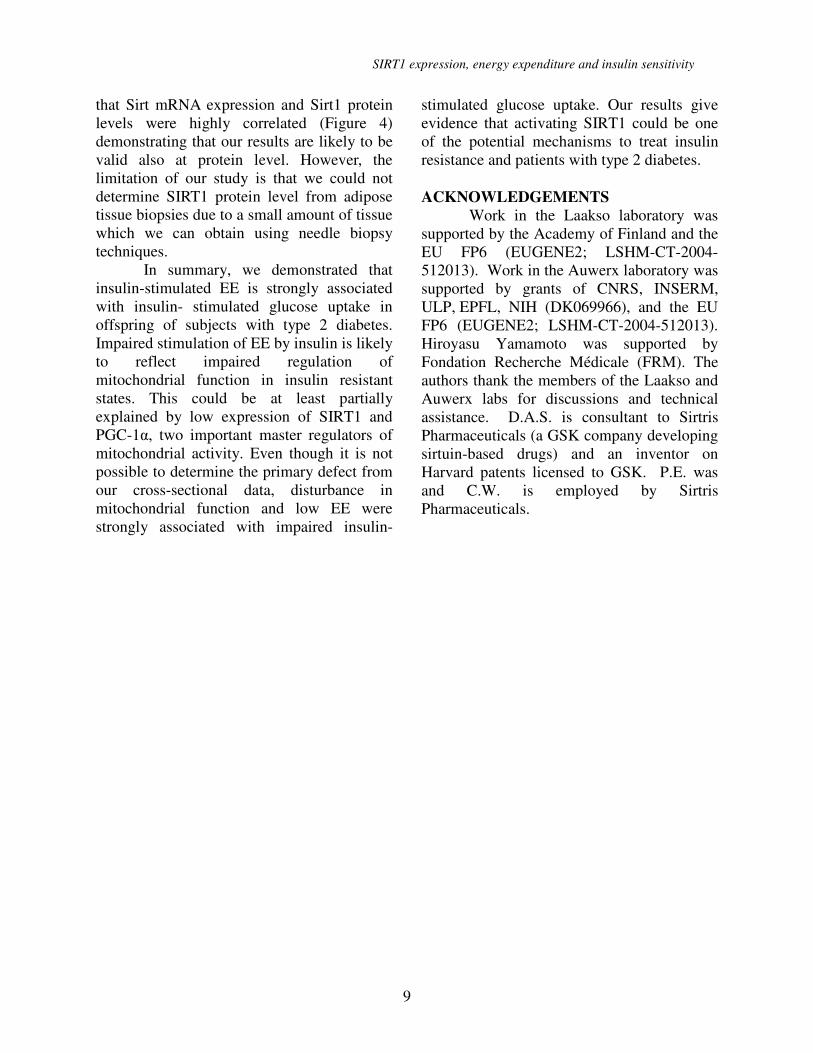
SIRT1 mRNA expression correlated
significantly with EE (r = 0.289, P = 0.010)
and with WBGU/LBM (r = 0.334, P = 0.002)
during the euglycemic clamp (Figure 3). No
statistically significant correlation was found
between SIRT1 expression and EE in the
fasting state (r = 0.142). The correlation
SIRT1 expression, energy expenditure and insulin sensitivity
7
between SIRT1 expression and PGC-1α
expression was 0.448 (P = 3.5 ×10⁻⁵
). PGC-1α
expression correlated significantly only with
WBGU/LBM (r = 0.387, P = 3.9 ×10⁻⁴
) but
not with EE during the clamp (r = 0.167).
We also measured adipose tissue
mRNA levels of several target genes of SIRT1
and PGC-1α (Table 2). SIRT1 mRNA
expression correlated significantly with PGC-
1β expression, estrogen-related receptor α
(ERRα), nuclear respiratory factor -1 (NRF-
1), mitochondrial transcription factor A
(TFAM), catalase (CAT), and with several
genes of the respiratory chain, including
NADH dehydrogenase (ubiquinone) 1α
subcomplex, 2, cytochrome c, cytochrome c
oxidase subunit IV, and ATP synthase. SIRT1
mRNA expression also correlated with the
expression of soluble superoxide dismutase 1.
The correlations of mRNA expression of
these genes with PGC-1α expression were
quite similar, but somewhat weaker. Neither
SIRT1 mRNA expression nor PGC-1α mRNA
expression correlated with superoxide
dismutase 2.
SIRT1 mRNA expression
correlation in adipose tissue and skeletal
muscle. In 11 subjects who had both adipose
tissue and skeletal muscle biopsy the
correlation of SIRT1 mRNA expression in
these tissues was 0.655 (P=0.029).
Mitochrondial DNA in skeletal muscle also
correlated positively with SIRT mRNA
expression in adipose tissue (r = 0.519) and
skeletal muscle (r = 0.533), although the
correlations were not statistically significant
due to a small sample size (Supplemental
table 2 which can be found in an online
appendix at
http://diabetes.diabetesjournals.org).
SIRT1 mRNA expression
correlation with cytokines and adhesion
molecules. SIRT mRNA expression
negatively correlated with hs-CRP (r = -
0.241, P = 0.039), but otherwise the
correlations with cytokines and adhesion
molecules were almost entirely non-
significant (Supplementary table 1).
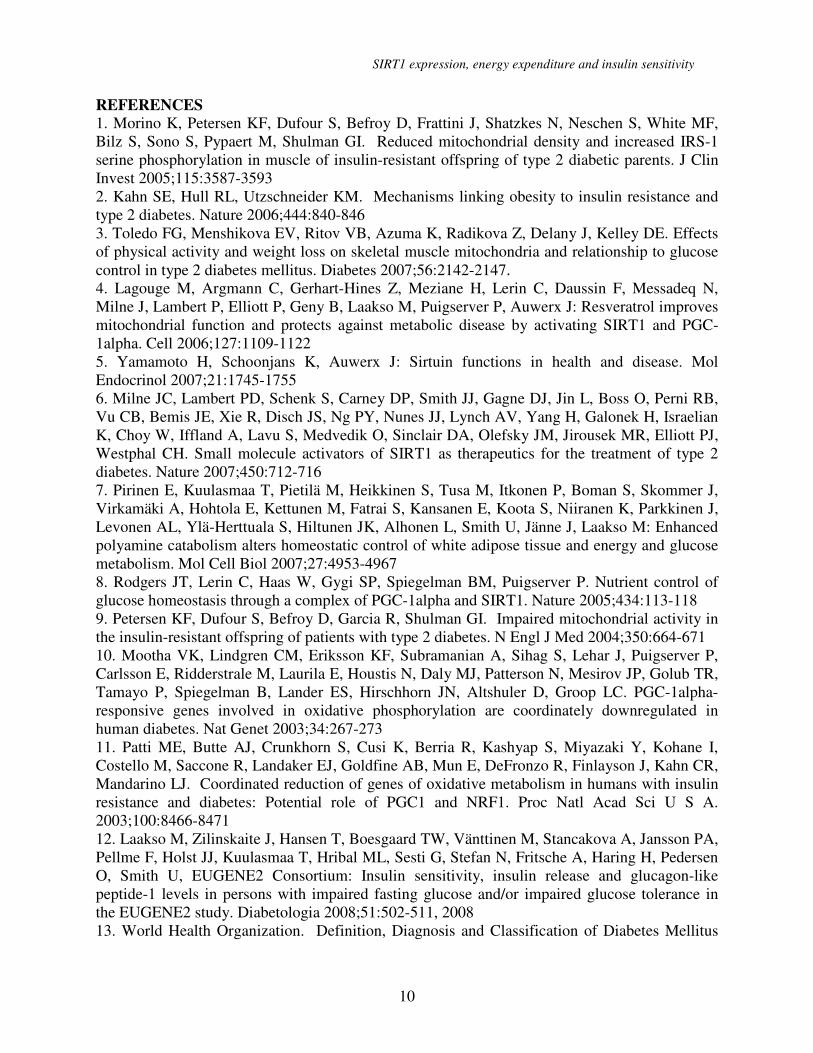
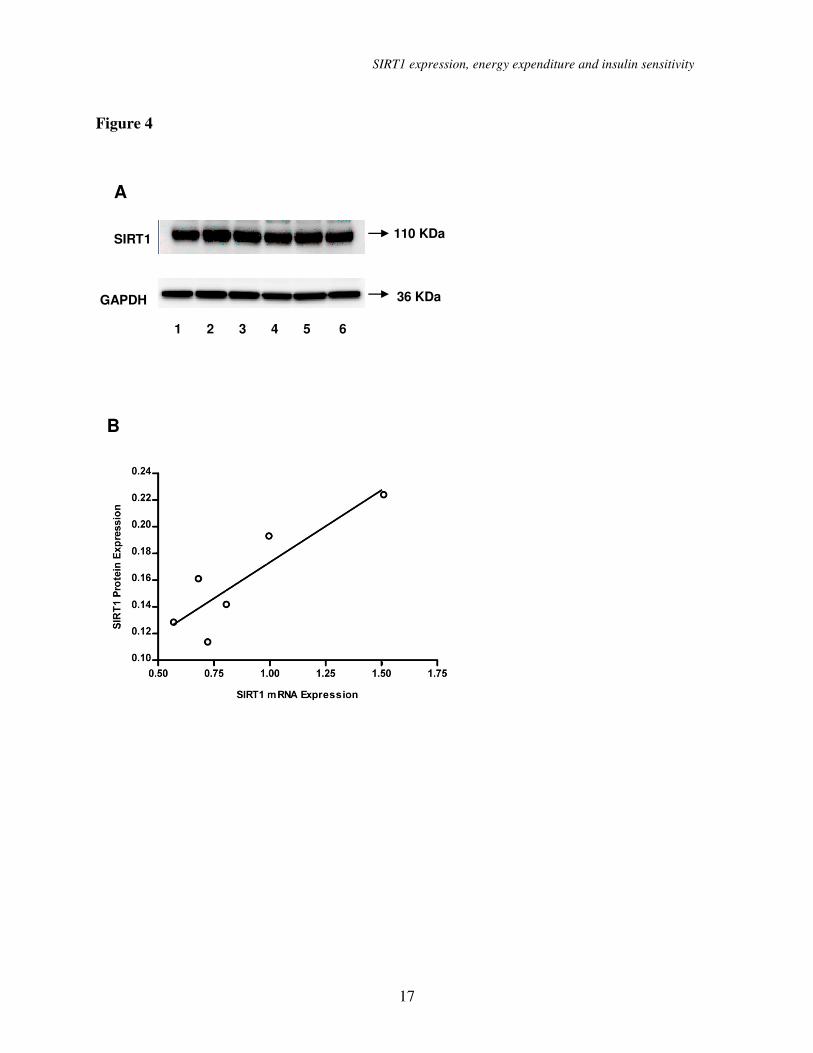
Sirt1 mRNA and protein
correlation. Subcutaneous adipose tissue
from 5 months old female mice were obtained
and used for qRT-PCR and Western blot
analyses. We observed a strong correlation
between Sirt1 mRNA and Sirt1 protein
expression levels (Figure 4, r = 0.882, P <
0.001).
DISCUSSION
Our study demonstrated that insulin-
stimulated increase in EE was strongly
associated with insulin sensitivity in offspring
of patients with type 2 diabetes. Furthermore,
we showed for the first time that adipose
tissue SIRT1 mRNA expression correlated
with EE and insulin sensitivity during
hyperinsulinemia. Moreover, SIRT1
expression correlated with the expression of
several genes regulating the mitochondrial
function.
In our study high EE during
hyperinsulinemia, and particularly high ∆EE
were strongly associated with insulin-
stimulated WBGU/LBM. These results agree
with previous studies including relative small
samples of lean and obese subjects (16,17).
Hyperinsulinemic clamp simulates the
postprandial state with high insulin levels that
promote the glucose flux from circulating
blood into insulin sensitive tissues. An 8-h
insulin infusion in humans has been shown to
increase mitochondrial mRNA transcript
levels, mitochondrial protein synthesis, and
ATP production (18). This response was,
however, blunted in type 2 diabetic patients.
In another study diabetic patients exhibited
lower ATP production rate in response to
high-dose insulin infusion compared to that in
non-diabetic individuals (19). Thus, impaired
mitochondrial fitness could be a consequence
of impaired insulin action as supported by a
study in mice fed a high-fat, high-sucrose diet
showing that mitochondrial alterations do not

SIRT1 expression, energy expenditure and insulin sensitivity
8
precede the onset of insulin resistance (20). In
agreement with this notion a recent study in
mice demonstrated a direct effect of SIRT1 on
insulin sensitivity by repressing PTP1B (21).
Whether this mechanism is working also in
man needs to be shown.
Alternatively, primary mitochondrial
dysfunction could lead to insulin resistance.
An attractive possibility to explain a causal
link between impaired mitochondrial function
and insulin resistance is the hypothesis that
impaired OXPHOS capacity leads to
intramyocellular lipid accumulation (9), and
thus impaired insulin signalling and insulin
resistance (22). High lipid levels in the
circulating blood impair insulin-stimulated
ATP production in humans (23). We observed
that subjects with low insulin-stimulated EE
also had higher levels of FFAs, higher lipid
oxidation and lower RQ during the
hyperinsulinemic clamp, reflecting changes in
fuel selection in these subjects, which often
lead to insulin resistance.
Further evidence supporting the
hypothesis that mitochondrial activity
stimulated by SIRT1 might be important for
energy metabolism and insulin action are high
correlations of adipose tissue SIRT1 mRNA
expression with expression of genes
regulating mitochondrial function. SIRT1
mRNA expression correlated significantly
with PGC-1β expression which has several
overlapping functions with PGC-1α in
inducing genes related to OXPHOS (24).
Significant correlations of SIRT1 mRNA
expression were also observed with ERRα,
which mediates many of the downstream
effects of activated PGC-1α on mitochondrial
function (25), with NRF-1, an ERRα/ PGC-1α
target, and with TFAM, which is a target of
NRF-1 (26). Furthermore, SIRT1 mRNA
levels correlated with expression of several
genes regulating the respiratory chain. SIRT1
mRNA expression level also correlated with
the expression of soluble superoxide
dismutase 1, which protects the cell from
superoxide toxicity, and with catalase, which
catalyzes the decomposition of hydrogen
peroxide to water and oxygen (27). Because
the accumulation of reactive oxygen species
can induce insulin resistance (28), the role of
SIRT1 in governing SOD1 and catalase
expression could cooperate with the effects of
SIRT1 on the control of OXPHOS to improve
insulin sensitivity. Our findings are also in
agreement with recent studies in mice (4,29).
Transgenic mice overexpressing SIRT1 (30)
or mice having SIRT1 activity enhanced by
the administration of the SIRT1 agonist,
resveratrol (4,29) or a small molecule
activator of SIRT1 (6), were both leaner, more
hypermetabolic, and showed favorable effects
on glucose and lipid metabolism. Mice treated
with SRT1720, a potent synthetic activator of
SIRT1, enhanced insulin sensitivity (31).
Furthermore, in human studies a SIRT1
activator (SRT501) has been shown to
improve glucose control (32). Adipose tissue
SIRT1 mRNA expression was negatively
associated with hs-CRP level which is in
agreement with the anti-inflammatory effect
of SIRT1 (33). The correlation of adipose
tissue SIRT1 mRNA with other inflammatory
markers was modest. This may reflect a
poorer correlation of SIRT1 mRNA with
plasma levels of cytokines compared to
cytokine expression in adipose tissue.
SIRT1 mRNA expression in adipose
tissue had a high correlation with skeletal
muscle SIRT1 mRNA (r=0.655). Therefore,
we believe that our results obtained in adipose
tissue reflect metabolic changes in skeletal
muscle which is the main tissue for EE and
insulin sensitivity during insulin stimulation.
Skeletal muscle mitochondrial DNA
correlated closely with SIRT1 mRNA
expression in skeletal muscle and adipose
tissue giving evidence that up-regulation of
the genes regulating mitochondrial biogenesis
in adipose tissue and likely to reflect
corresponding changes in skeletal muscle
(Table 2). Finally, we demonstrated in mice
SIRT1 expression, energy expenditure and insulin sensitivity
9
that Sirt mRNA expression and Sirt1 protein
levels were highly correlated (Figure 4)
demonstrating that our results are likely to be
valid also at protein level. However, the
limitation of our study is that we could not
determine SIRT1 protein level from adipose
tissue biopsies due to a small amount of tissue
which we can obtain using needle biopsy
techniques.
In summary, we demonstrated that
insulin-stimulated EE is strongly associated
with insulin- stimulated glucose uptake in
offspring of subjects with type 2 diabetes.
Impaired stimulation of EE by insulin is likely
to reflect impaired regulation of
mitochondrial function in insulin resistant
states. This could be at least partially
explained by low expression of SIRT1 and
PGC-1α, two important master regulators of
mitochondrial activity. Even though it is not
possible to determine the primary defect from
our cross-sectional data, disturbance in
mitochondrial function and low EE were
strongly associated with impaired insulin-
stimulated glucose uptake. Our results give
evidence that activating SIRT1 could be one
of the potential mechanisms to treat insulin
resistance and patients with type 2 diabetes.
ACKNOWLEDGEMENTS
Work in the Laakso laboratory was
supported by the Academy of Finland and the
EU FP6 (EUGENE2; LSHM-CT-2004-
512013). Work in the Auwerx laboratory was
supported by grants of CNRS, INSERM,
ULP, EPFL, NIH (DK069966), and the EU
FP6 (EUGENE2; LSHM-CT-2004-512013).
Hiroyasu Yamamoto was supported by
Fondation Recherche Médicale (FRM). The
authors thank the members of the Laakso and
Auwerx labs for discussions and technical
assistance. D.A.S. is consultant to Sirtris
Pharmaceuticals (a GSK company developing
sirtuin-based drugs) and an inventor on
Harvard patents licensed to GSK. P.E. was
and C.W. is employed by Sirtris
Pharmaceuticals.
SIRT1 expression, energy expenditure and insulin sensitivity
10
REFERENCES 1. Morino K, Petersen KF, Dufour S, Befroy D, Frattini J, Shatzkes N, Neschen S, White MF,
Bilz S, Sono S, Pypaert M, Shulman GI. Reduced mitochondrial density and increased IRS-1
serine phosphorylation in muscle of insulin-resistant offspring of type 2 diabetic parents. J Clin
Invest 2005;115:3587-3593
2. Kahn SE, Hull RL, Utzschneider KM. Mechanisms linking obesity to insulin resistance and
type 2 diabetes. Nature 2006;444:840-846
3. Toledo FG, Menshikova EV, Ritov VB, Azuma K, Radikova Z, Delany J, Kelley DE. Effects
of physical activity and weight loss on skeletal muscle mitochondria and relationship to glucose
control in type 2 diabetes mellitus. Diabetes 2007;56:2142-2147.
4. Lagouge M, Argmann C, Gerhart-Hines Z, Meziane H, Lerin C, Daussin F, Messadeq N,
Milne J, Lambert P, Elliott P, Geny B, Laakso M, Puigserver P, Auwerx J: Resveratrol improves
mitochondrial function and protects against metabolic disease by activating SIRT1 and PGC-
1alpha. Cell 2006;127:1109-1122
5. Yamamoto H, Schoonjans K, Auwerx J: Sirtuin functions in health and disease. Mol
Endocrinol 2007;21:1745-1755
6. Milne JC, Lambert PD, Schenk S, Carney DP, Smith JJ, Gagne DJ, Jin L, Boss O, Perni RB,
Vu CB, Bemis JE, Xie R, Disch JS, Ng PY, Nunes JJ, Lynch AV, Yang H, Galonek H, Israelian
K, Choy W, Iffland A, Lavu S, Medvedik O, Sinclair DA, Olefsky JM, Jirousek MR, Elliott PJ,
Westphal CH. Small molecule activators of SIRT1 as therapeutics for the treatment of type 2
diabetes. Nature 2007;450:712-716
7. Pirinen E, Kuulasmaa T, Pietilä M, Heikkinen S, Tusa M, Itkonen P, Boman S, Skommer J,
Virkamäki A, Hohtola E, Kettunen M, Fatrai S, Kansanen E, Koota S, Niiranen K, Parkkinen J,
Levonen AL, Ylä-Herttuala S, Hiltunen JK, Alhonen L, Smith U, Jänne J, Laakso M: Enhanced
polyamine catabolism alters homeostatic control of white adipose tissue and energy and glucose
metabolism. Mol Cell Biol 2007;27:4953-4967
8. Rodgers JT, Lerin C, Haas W, Gygi SP, Spiegelman BM, Puigserver P. Nutrient control of
glucose homeostasis through a complex of PGC-1alpha and SIRT1. Nature 2005;434:113-118
9. Petersen KF, Dufour S, Befroy D, Garcia R, Shulman GI. Impaired mitochondrial activity in
the insulin-resistant offspring of patients with type 2 diabetes. N Engl J Med 2004;350:664-671
10. Mootha VK, Lindgren CM, Eriksson KF, Subramanian A, Sihag S, Lehar J, Puigserver P,
Carlsson E, Ridderstrale M, Laurila E, Houstis N, Daly MJ, Patterson N, Mesirov JP, Golub TR,
Tamayo P, Spiegelman B, Lander ES, Hirschhorn JN, Altshuler D, Groop LC. PGC-1alpha-
responsive genes involved in oxidative phosphorylation are coordinately downregulated in
human diabetes. Nat Genet 2003;34:267-273
11. Patti ME, Butte AJ, Crunkhorn S, Cusi K, Berria R, Kashyap S, Miyazaki Y, Kohane I,
Costello M, Saccone R, Landaker EJ, Goldfine AB, Mun E, DeFronzo R, Finlayson J, Kahn CR,
Mandarino LJ. Coordinated reduction of genes of oxidative metabolism in humans with insulin
resistance and diabetes: Potential role of PGC1 and NRF1. Proc Natl Acad Sci U S A.
2003;100:8466-8471
12. Laakso M, Zilinskaite J, Hansen T, Boesgaard TW, Vänttinen M, Stancakova A, Jansson PA,
Pellme F, Holst JJ, Kuulasmaa T, Hribal ML, Sesti G, Stefan N, Fritsche A, Haring H, Pedersen
O, Smith U, EUGENE2 Consortium: Insulin sensitivity, insulin release and glucagon-like
peptide-1 levels in persons with impaired fasting glucose and/or impaired glucose tolerance in
the EUGENE2 study. Diabetologia 2008;51:502-511, 2008
13. World Health Organization. Definition, Diagnosis and Classification of Diabetes Mellitus
SIRT1 expression, energy expenditure and insulin sensitivity
11
and its Complications. Report of a WHO Consultation. Part 1: Diagnosis and Classification of
Diabetes Mellitus. Geneva, World Health Organization; 1999 (publ. no. WHO/NCD/NCS/99.2).
14. Salmenniemi U, Ruotsalainen E, Pihlajamäki J, Vauhkonen I, Kainulainen S, Punnonen K,
Vanninen E, Laakso M. Multiple abnormalities in glucose and energy metabolism and
coordinated changes in levels of adiponectin, cytokines, and adhesion molecules in subjects with
metabolic syndrome. Circulation 2004;110:3842-3848
15. Ferrannini E: The theoretical bases of indirect calorimetry: A review. Metabolism
1988;37:287-301
16. Ravussin E, Bogardus C, Schwartz RS, Robbins DC, Wolfe RR, Horton ES, Danforth E,Jr,
Sims EA: Thermic effect of infused glucose and insulin in man. Decreased response with
increased insulin resistance in obesity and noninsulin-dependent diabetes mellitus. J Clin Invest
1983;72:893-902
17. Segal KR, Albu J, Chun A, Edano A, Legaspi B, Pi-Sunyer FX. Independent effects of
obesity and insulin resistance on postprandial thermogenesis in men. J Clin Invest 1992;89:824-
833
18. Stump CS, Short KR, Bigelow ML, Schimke JM, Nair KS. Effect of insulin on human
skeletal muscle mitochondrial ATP production, protein synthesis, and mRNA transcripts. Proc
Natl Acad Sci U S A 2003;100:7996-8001
19. Asmann YW, Stump CS, Short KR, Coenen-Schimke JM, Guo Z, Bigelow ML, Nair KS:
Skeletal muscle mitochondrial functions, mitochondrial DNA copy numbers, and gene transcript
profiles in type 2 diabetic and nondiabetic subjects at equal levels of low or high insulin and
euglycemia. Diabetes 2006;55:3309-3319
20. Bonnard C, Durand A, Peyrol S, Chanseaume E, Chauvin MA, Morio B, Vidal H, Riesset J:
Mitochondrial dysfunction results from oxidative stress in the skeletal muscle of diet-induced
insulin-resistant mice. J Clin Invest 2008;118:789-800.
21. Sun C, Zhang F, Ge X, Yan T, Chen X, Shi X, Zhai Q. SIRT1 improves insulin sensitivity
under insulin-resistant conditions by repressing PTP1B. Cell Metab 2007;6:307-319
22. Petersen KF, Dufour S, Shulman GI: Decreased insulin-stimulated ATP synthesis and
phosphate transport in muscle of insulin-resistant offspring of type 2 diabetic parents. PLoS Med
2005;2:e233
23. Brehm A, Krssak M, Schmid AI, Nowotny P, Waldhausl W, Roden M. Increased lipid
availability impairs insulin-stimulated ATP synthesis in human skeletal muscle. Diabetes
2006;55:136-140
24. Lin J, Puigserver P, Donovan J, Tarr P, Spiegelman BM. Peroxisome proliferator-activated
receptor gamma coactivator 1beta (PGC-1beta ), a novel PGC-1-related transcription coactivator
associated with host cell factor. J Biol Chem 2002;277:1645-1648
25. Tcherepanova I, Puigserver P, Norris JD, Spiegelman BM, McDonnell DP. Modulation of
estrogen receptor-alpha transcriptional activity by the coactivator PGC-1. J Biol Chem
2000;275:16302-16308
26. Larsson NG, Wang J, Wilhelmsson H, Oldfors A, Rustin P, Lewandoski M, Barsh GS,
Clayton DA: Mitochondrial transcription factor A is necessary for mtDNA maintenance and
embryogenesis in mice. Nat Genet 1998;8:231-236
27. St-Pierre J, Drori S, Uldry M, Silvaggi JM, Rhee J, Jager S, Handschin C, Zheng K, Lin J,
Yang W, Simon DK, Bachoo R, Spiegelman BM. Suppression of reactive oxygen species and
neurodegeneration by the PGC-1 transcriptional coactivators. Cell 2006;127:397-408
28. Houstis N, Rosen ED, Lander ES: Reactive oxygen species have a causal role in multiple
SIRT1 expression, energy expenditure and insulin sensitivity
12
forms of insulin resistance. Nature 2006;440:944-948
29. Baur JA, Pearson KJ, Price NL, Jamieson HA, Lerin C, Kalra A, Prabhu VV, Allard JS,
Lopez-Lluch G, Lewis K, Pistell PJ, Poosala S, Becker KG, Boss O, Gwinn D, Wang M,
Ramaswamy S, Fishbein KW, Spencer RG, Lakatta EG, Le Couteur D, Shaw RJ, Navas P,
Puigserver P, Ingram DK, de Cabo R, Sinclair DA. Resveratrol improves health and survival of
mice on a high-calorie diet. Nature 2006;444:337-342
30. Bordone L, Cohen D, Robinson A, Motta MC, van Veen E, Czopik A, Steele AD, Crowe H,
Marmor S, Luo J, Gu W, Guarente L. SIRT1 transgenic mice show phenotypes resembling
calorie restriction. Aging Cell 2007;6:759-767
31. Feige JN, Lagouge M, Canto C, Strehle A, Houten SM, Milne JC, Lambert PD, Mataki C,
Elliott PJ, Auwerx J: Specific SIRT1 activation mimics low energy levels and protects against
diet-induced metabolic disorders by enhancing fat oxidation. Cell Metab 2008;8:347-358
32. Elliott PJ, Jirousek M: Sirtuins: Novel targets for metabolic disease. Curr Opin Investig
Drugs 2008;9:371-378
33. Yeung F, Hoberg JE, Ramsay CS, Keller MD, Jones DR, Frye RA, Mayo MW: Modulation
of NFκ-B-dependent transcription and cell survival by the SIRT1 deacetylase. The EMBO
Journal 2004;23:2369-2380.
Figure legends
Figure 1. (A) Correlation between the rates of whole body glucose uptake (WBGU) and fasting
energy expenditure (univariate linear regression). (B) Correlation between the rates of WBGU
and energy expenditure during the hyperinsulinemic clamp and (C) Correlation between the rates
of WBGU and ∆ energy expenditure (defined as energy expenditure during the clamp - energy
expenditure in the fasting state). (D) Rates of WBGU in the lowest (black bars), middle (stripped
bars) and highest (open bars) energy expenditure tertiles according to fasting energy expenditure,
(E) energy expenditure during the hyperinsulinemic clamp and (F) the ∆ energy expenditure.
Data are means with SD (D-F).
Figure 2. (A) Respiratory quotient in the fasting state and during the hyperinsulinemic
euglycemic clamp in the tertiles of ∆ energy expenditure. Data are means ± standard deviations
in the lowest (black bars), middle (stripped bars) and highest tertile (open bars), (B) Lipid
oxidation in the fasting state and during the hyperinsulinemic euglycemic clamp in the tertiles of
∆ energy expenditure, (C) Free fatty acids in the fasting state and during the hyperinsulinemic
euglycemic clamp in the tertiles of ∆ energy expenditure. Data are means with SD.
Figure 3. (A) Correlation of adipose tissue SIRT1 mRNA expression level with energy
expenditure during the hyperinsulinemic clamp. (B) Correlation of adipose tissue SIRT1 mRNA
expression level with the rates of whole body glucose uptake in offspring of type 2 diabetic
patients.
Figure 4. (A) Sirt1 protein expression western blots in subcutaneous adipose tissue from six 5
months old female mice (numbered from 1 to 6). GAPDH was used as a loading control. (B)
Correlation of Sirt1 mRNA expression level with Sirt1 protein expression level (r = 0.882,
P=0.020). A mean value of triplicates was used for Sirt1 mRNA level.
SIRT1 expression, energy expenditure and insulin sensitivity
13
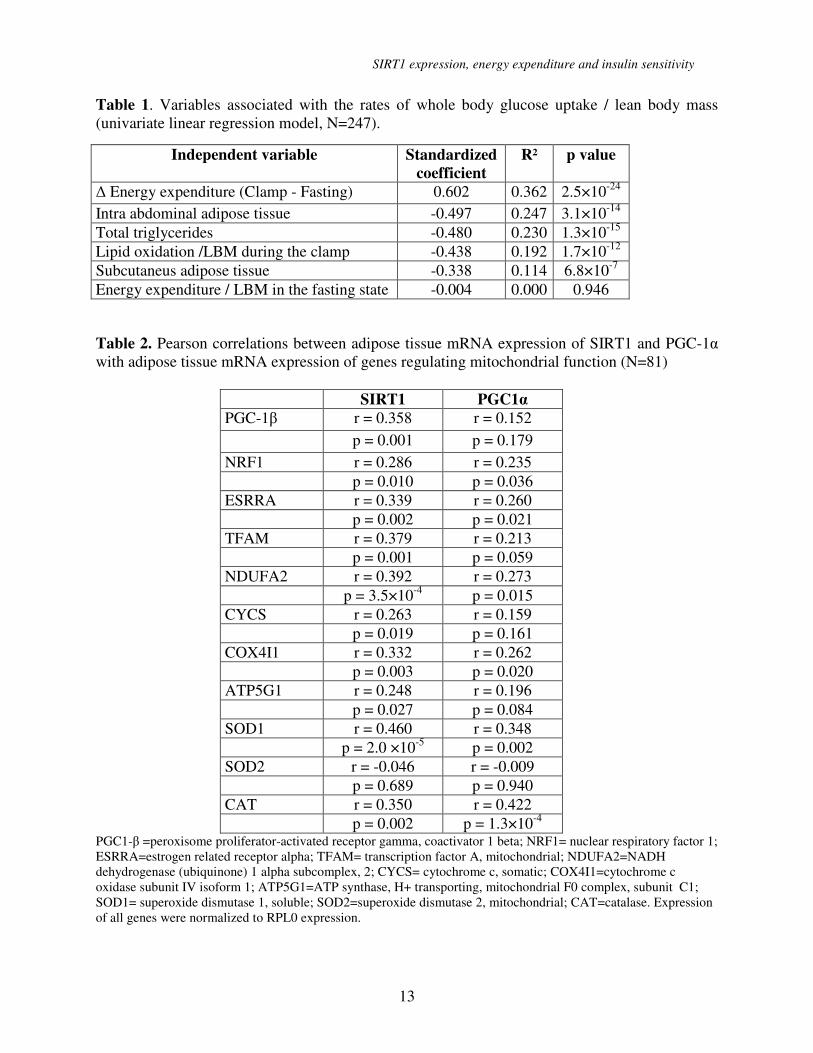
Table 1. Variables associated with the rates of whole body glucose uptake / lean body mass
(univariate linear regression model, N=247).
Table 2. Pearson correlations between adipose tissue mRNA expression of SIRT1 and PGC-1α
with adipose tissue mRNA expression of genes regulating mitochondrial function (N=81)
SIRT1 PGC1α
PGC-1β r = 0.358 r = 0.152
p = 0.001 p = 0.179
NRF1 r = 0.286 r = 0.235
p = 0.010 p = 0.036
ESRRA r = 0.339 r = 0.260
p = 0.002 p = 0.021
TFAM r = 0.379 r = 0.213
p = 0.001 p = 0.059
NDUFA2 r = 0.392
r = 0.273
p = 3.5×10⁻⁴
p = 0.015
CYCS r = 0.263 r = 0.159
p = 0.019 p = 0.161
COX4I1 r = 0.332 r = 0.262
p = 0.003 p = 0.020
ATP5G1 r = 0.248 r = 0.196
p = 0.027 p = 0.084
SOD1 r = 0.460
r = 0.348
p = 2.0 ×10⁻⁵
p = 0.002
SOD2 r = -0.046 r = -0.009
p = 0.689 p = 0.940
CAT r = 0.350 r = 0.422
p = 0.002 p = 1.3×10⁻⁴
PGC1-β =peroxisome proliferator-activated receptor gamma, coactivator 1 beta; NRF1= nuclear respiratory factor 1;
ESRRA=estrogen related receptor alpha; TFAM= transcription factor A, mitochondrial; NDUFA2=NADH
dehydrogenase (ubiquinone) 1 alpha subcomplex, 2; CYCS= cytochrome c, somatic; COX4I1=cytochrome c
oxidase subunit IV isoform 1; ATP5G1=ATP synthase, H+ transporting, mitochondrial F0 complex, subunit C1;
SOD1= superoxide dismutase 1, soluble; SOD2=superoxide dismutase 2, mitochondrial; CAT=catalase. Expression
of all genes were normalized to RPL0 expression.
Independent variable Standardized
coefficient
R² p value
∆ Energy expenditure (Clamp - Fasting) 0.602 0.362 2.5×10⁻²⁴
Intra abdominal adipose tissue -0.497 0.247 3.1×10⁻¹⁴
Total triglycerides -0.480 0.230 1.3×10⁻¹⁵
Lipid oxidation /LBM during the clamp -0.438 0.192 1.7×10⁻¹²
Subcutaneus adipose tissue -0.338 0.114 6.8×10⁻⁷
Energy expenditure / LBM in the fasting state -0.004 0.000 0.946
SIRT1 expression, energy expenditure and insulin sensitivity
14
Figure 1
A
B
C
0
10
20
30
40
50
60
70
80
90
WB
GU
(µ
mo
l/k
g o
f L
BM
/min
)
Fasting energy
expenditure tertile
DP = 0.207
0
10
20
30
40
50
60
70
80
90
Energy expenditure during
the clamp tertile
WB
GU
(µ
mo
l/k
g o
f L
BM
/min
)
E
P = 2.2×10⁻⁶
F
0
10
20
30
40
50
60
70
80
90
WB
GU
(µ
mo
l/k
g o
f L
BM
/min
)
P = 2.5×10⁻²⁰
∆ Energy expenditure tertile
Fig. 1
SIRT1 expression, energy expenditure and insulin sensitivity
15
Figure 2
0.6
0.7
0.8
0.9
1.0
Res
pir
ato
ry q
uo
tie
nt
P= 0.010 P = 1.2×10⁻¹²A
Fasting Clamp
0
0.2
0.4
0.6
0.8
1.0
1.2
1.4
1.6 P = 1.6×10⁻⁴
B
P = 9.2×10⁻⁹
Lip
id o
xid
ati
on
(m
gl/
kg
of
LB
M/m
in)
Fasting Clamp
0
0.1
0.2
0.3
0.4
0.5
0.6
0.7
0.8
0.9
Fasting Clamp
Fre
e f
att
y a
cid
s
(mm
ol/l)
P = 0.417 P = 8.7×10⁻⁷
C
SIRT1 expression, energy expenditure and insulin sensitivity
16
Figure 3
A
B
SIRT1 expression, energy expenditure and insulin sensitivity
17
Figure 4
B
A
SIRT1 110 KDa
GAPDH 36 KDa
1 2 3 4 5 6