Embed Size (px)
Citation preview
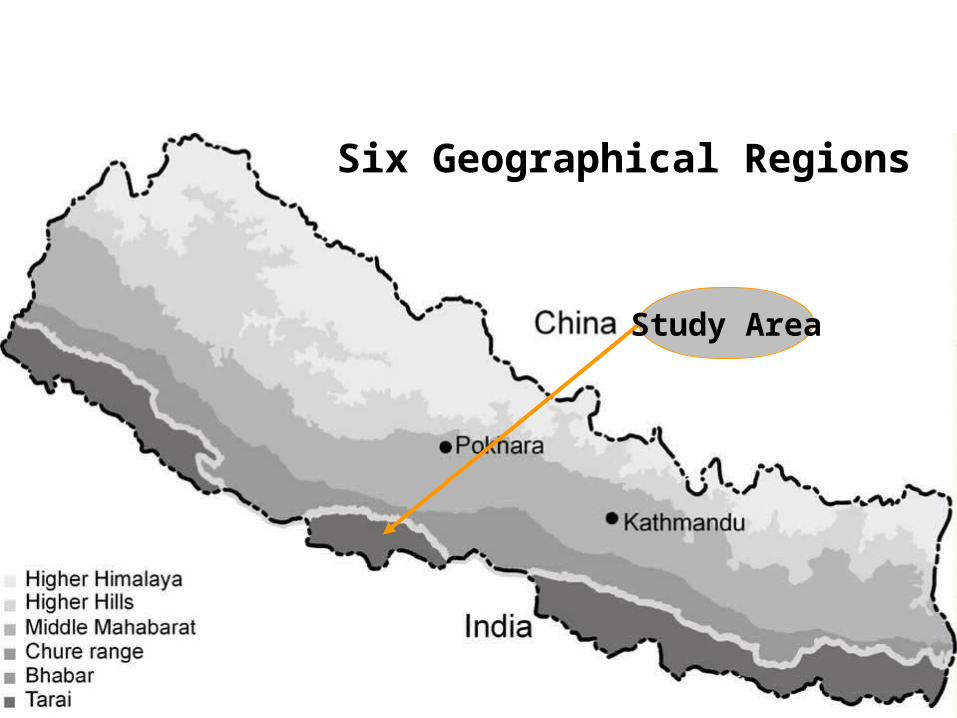
Six Geographical Regions
Study Area
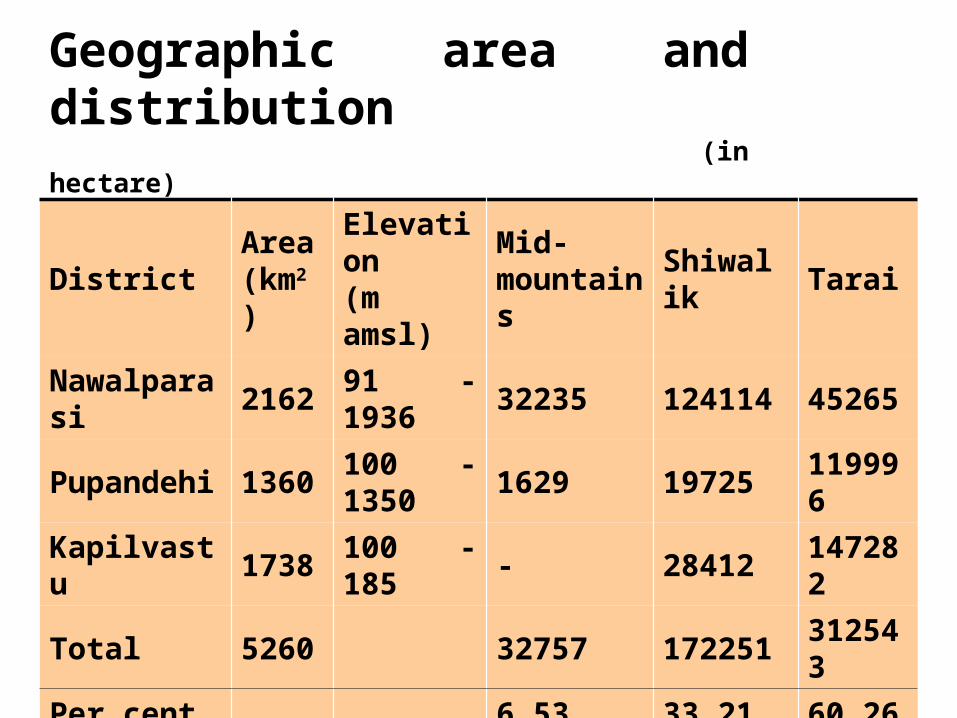
DistrictArea (km2)
Elevation (m amsl)
Mid-mountains
Shiwalik Tarai
Nawalparasi 2162 91 - 1936 32235 124114 45265
Pupandehi 1360 100 - 1350 1629 19725 119996
Kapilvastu 1738 100 - 185 - 28412 147282
Total 5260 32757 172251 312543
Per cent 6.53 33.21 60.26
Geographic area and distribution
(in hectare)
0
20
40
60
80
100
120
140
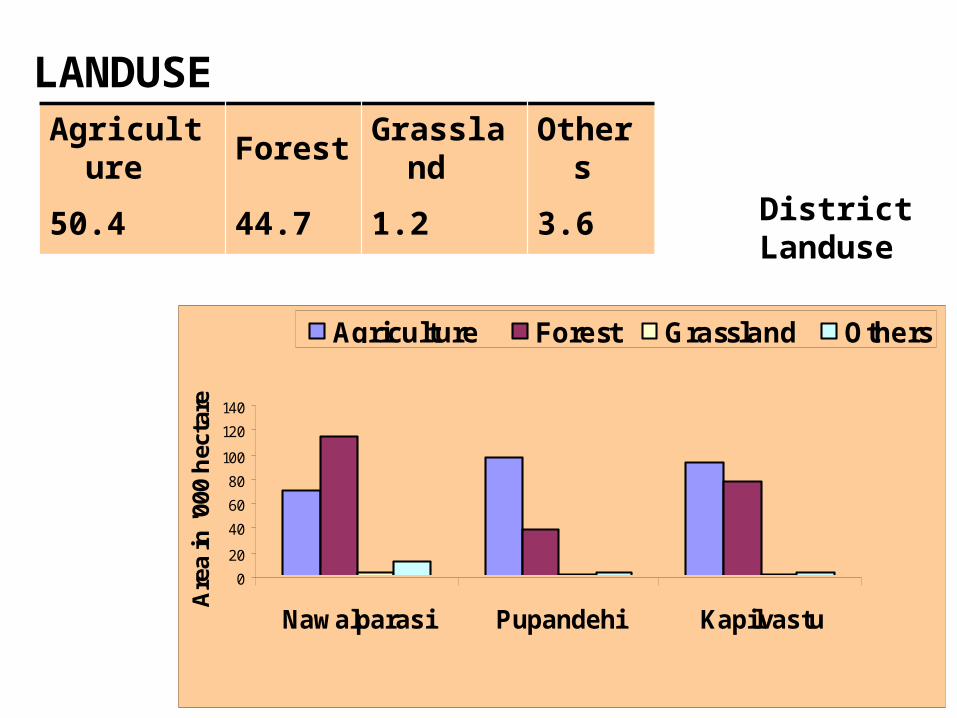
Nawalparasi Pupandehi Kapilvastu
Are
a in
'000
hec
tare
Agriculture Forest Grassland Others
Agriculture Forest Grassland Others
50.4 44.7 1.2 3.6
LANDUSE
District Landuse
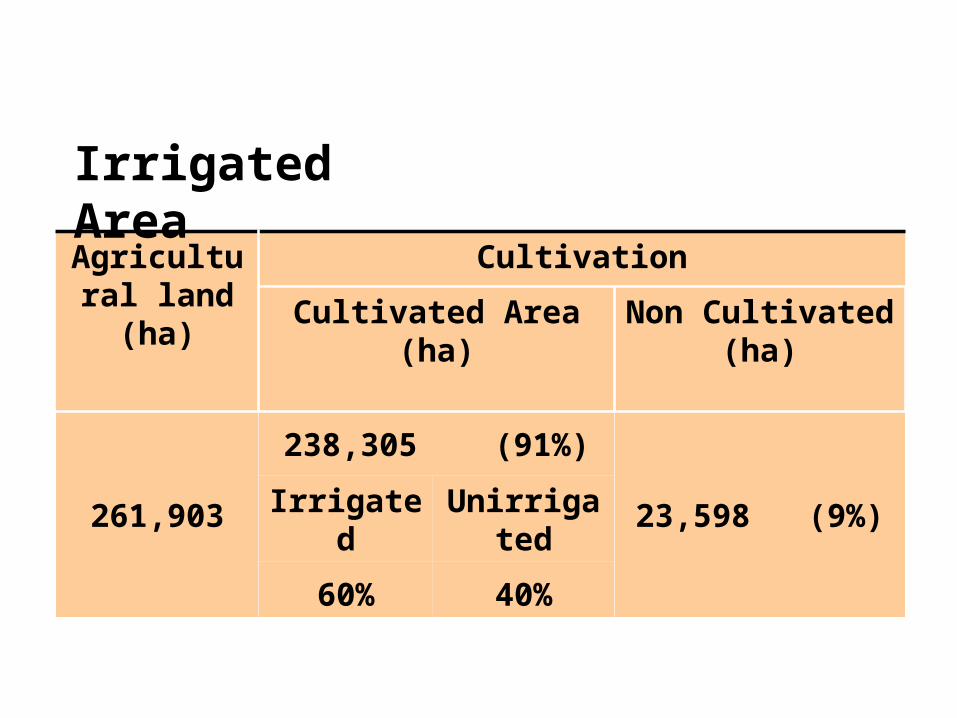
Agricultural land (ha)
Cultivation
Cultivated Area (ha) Non Cultivated (ha)
261,903
238,305 (91%)
23,598 (9%)Irrigated Unirrigated
60% 40%
Irrigated Area
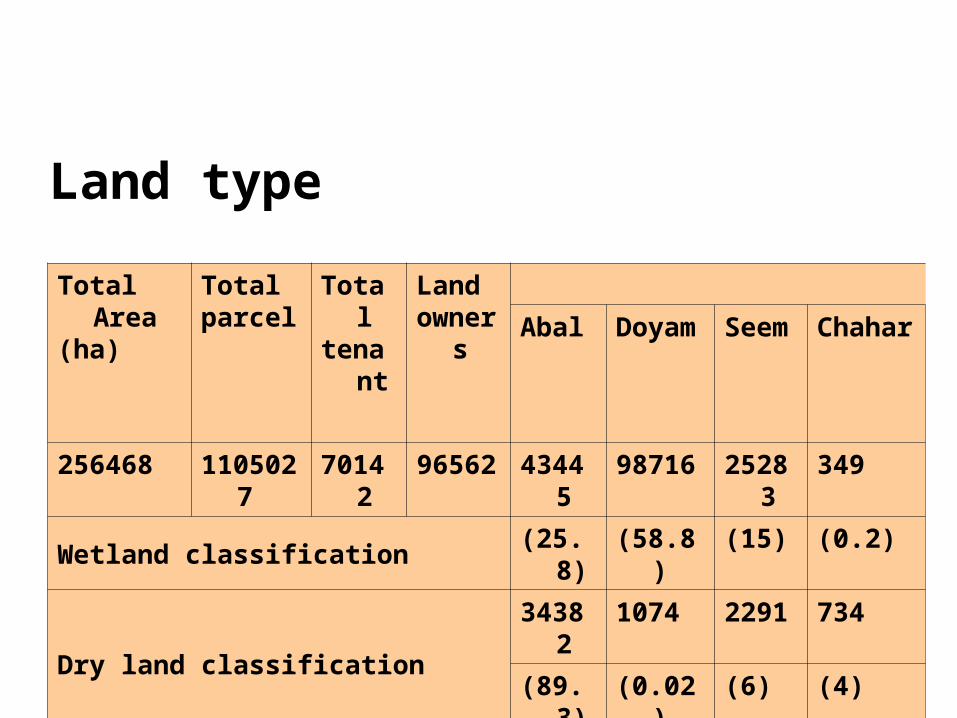
Total Area(ha)
Totalparcel
Totaltenant
Landowners
Abal Doyam Seem Chahar
256468 1105027 70142 96562 43445 98716 25283 349
Wetland classification (25.8) (58.8) (15) (0.2)
Dry land classification
34382 1074 2291 734
(89.3) (0.02) (6) (4)
Land type
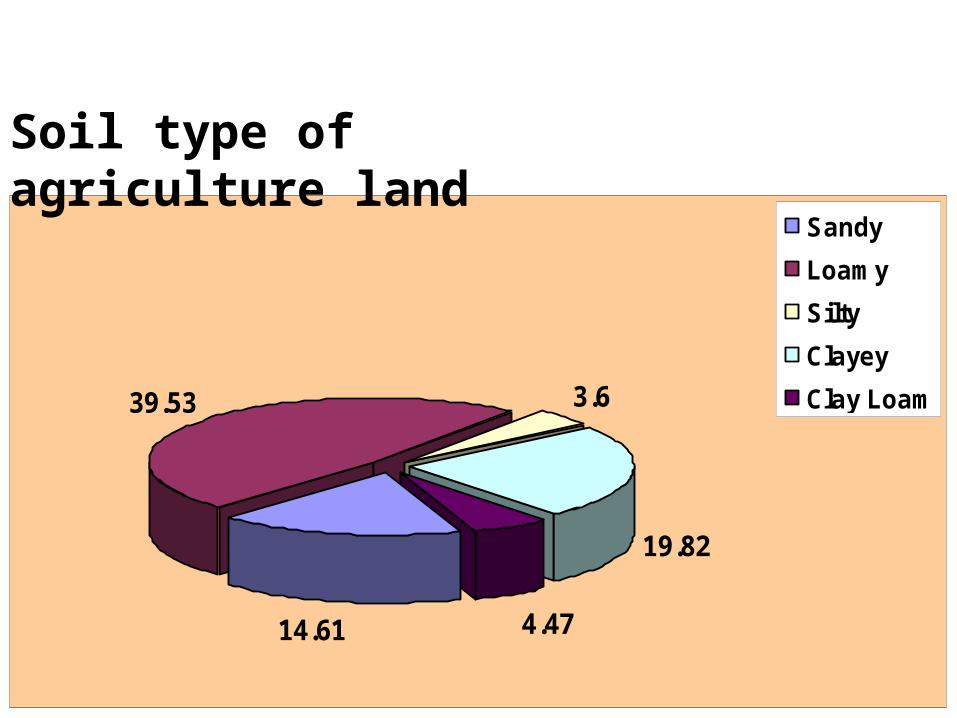
14.61
3.6
19.82
4.47
39.53
Sandy
Loamy
Silty
Clayey
Clay Loam
Soil type of agriculture land
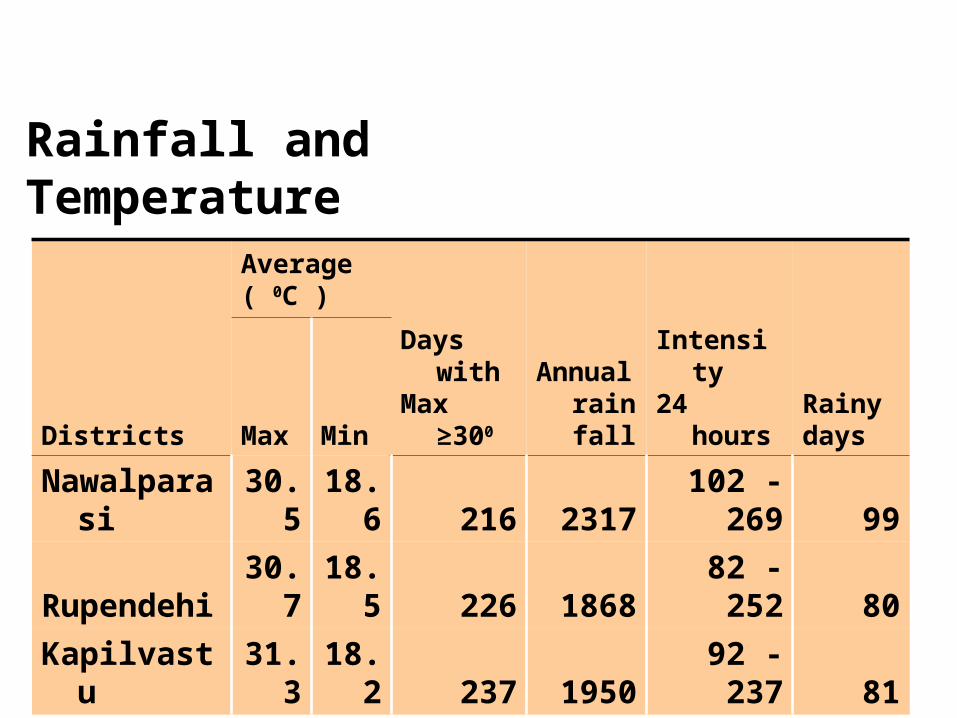
Districts
Average ( 0C )
Days withMax ≥300
Annual rain fall
Intensity24 hours
RainydaysMax Min
Nawalparasi 30.5 18.6 216 2317 102 - 269 99
Rupendehi 30.7 18.5 226 1868 82 - 252 80
Kapilvastu 31.3 18.2 237 1950 92 - 237 81
Rainfall and Temperature
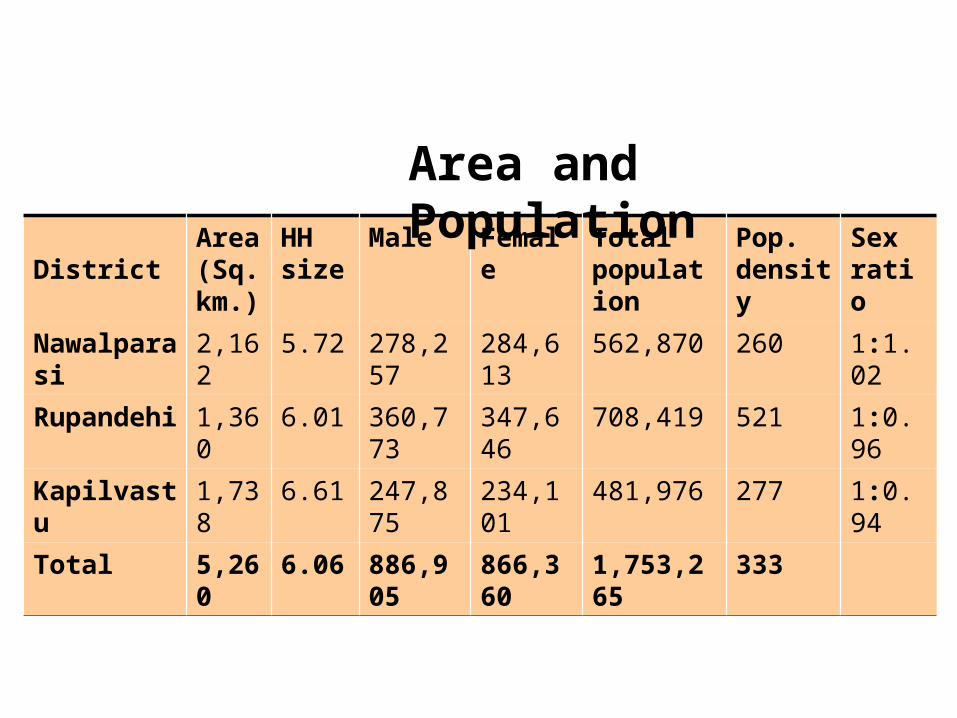
DistrictArea (Sq. km.)
HH size
Male Female Total population
Pop. density
Sex ratio
Nawalparasi
2,162 5.72 278,257 284,613 562,870 260 1:1.02
Rupandehi 1,360 6.01 360,773 347,646 708,419 521 1:0.96
Kapilvastu 1,738 6.61 247,875 234,101 481,976 277 1:0.94
Total 5,260 6.06 886,905 866,360 1,753,265 333
Area and Population
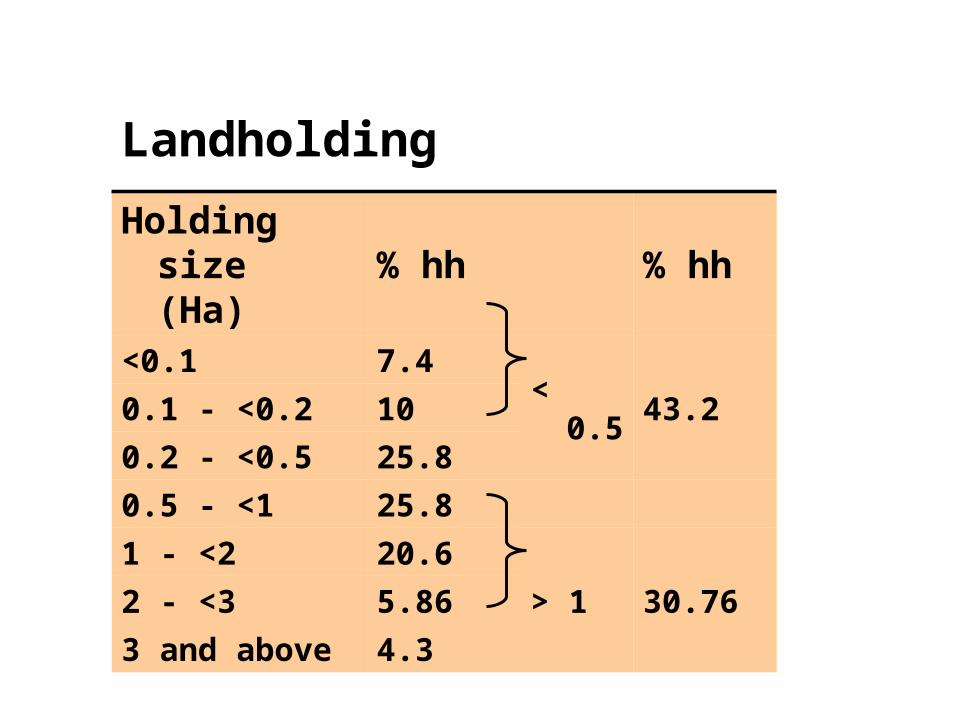
Holding size (Ha)
% hh % hh
<0.1 7.4
< 0.5 43.20.1 - <0.2 10
0.2 - <0.5 25.8
0.5 - <1 25.8
1 - <2 20.6
> 1 30.762 - <3 5.86
3 and above 4.3
Landholding
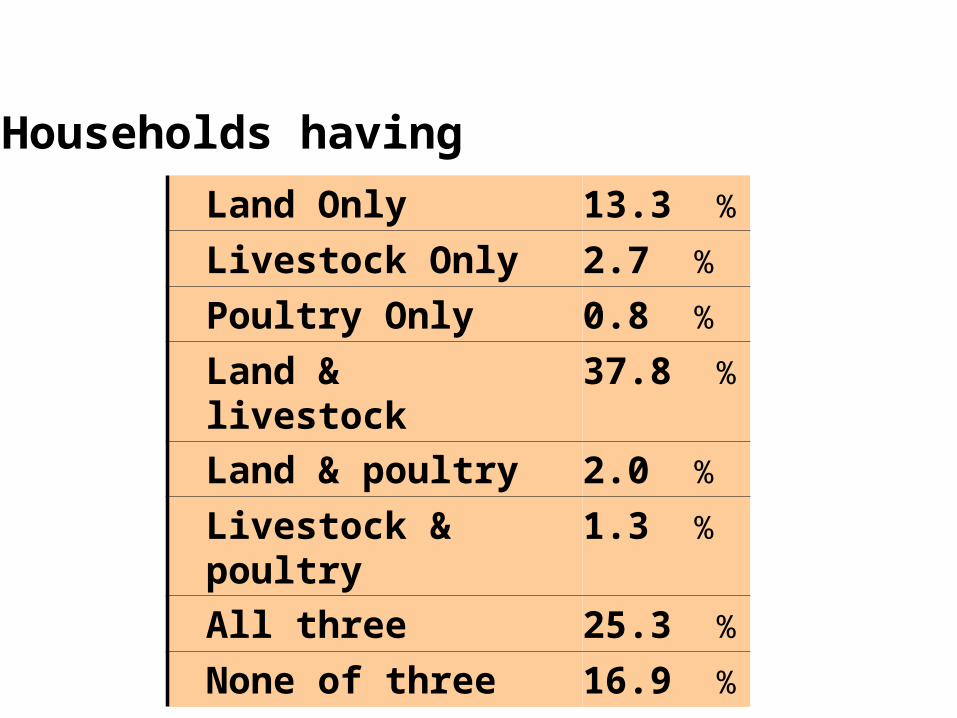
Land Only 13.3 %
Livestock Only 2.7 %
Poultry Only 0.8 %
Land & livestock 37.8 %
Land & poultry 2.0 %
Livestock & poultry 1.3 %
All three 25.3 %
None of three 16.9 %
Households having
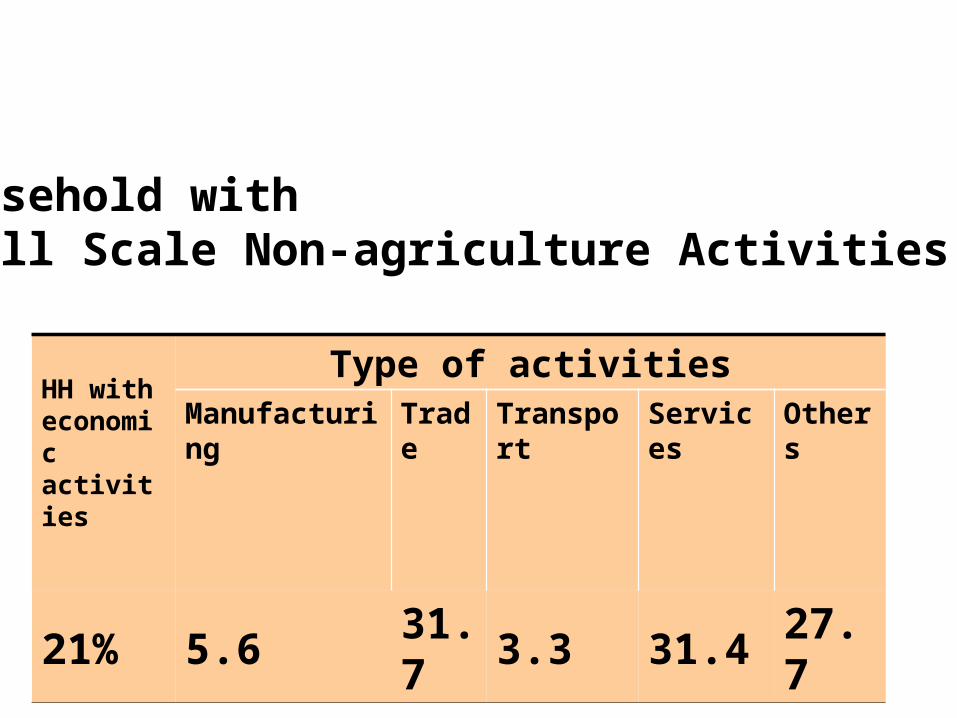
Household with Small Scale Non-agriculture Activities
HH with economic activities
Type of activitiesManufacturing Trade Transport Services Others
21% 5.6 31.7 3.3 31.4 27.7
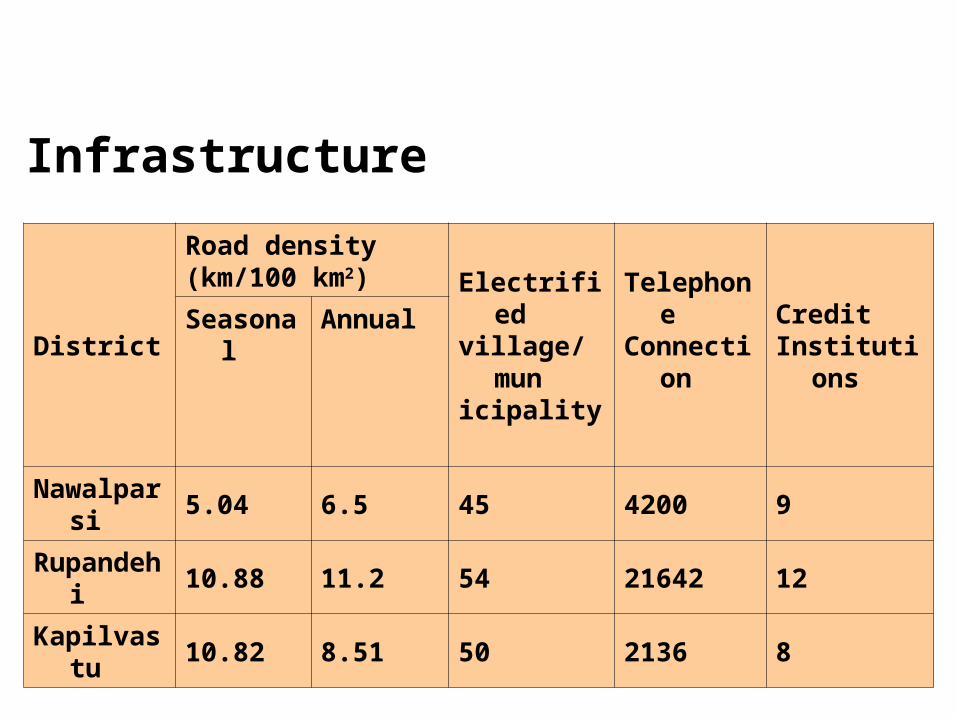
District
Road density(km/100 km2) Electrified
village/municipality
TelephoneConnection
CreditInstitutions Seasonal Annual
Nawalparsi 5.04 6.5 45 4200 9
Rupandehi 10.88 11.2 54 21642 12
Kapilvastu 10.82 8.51 50 2136 8
Infrastructure
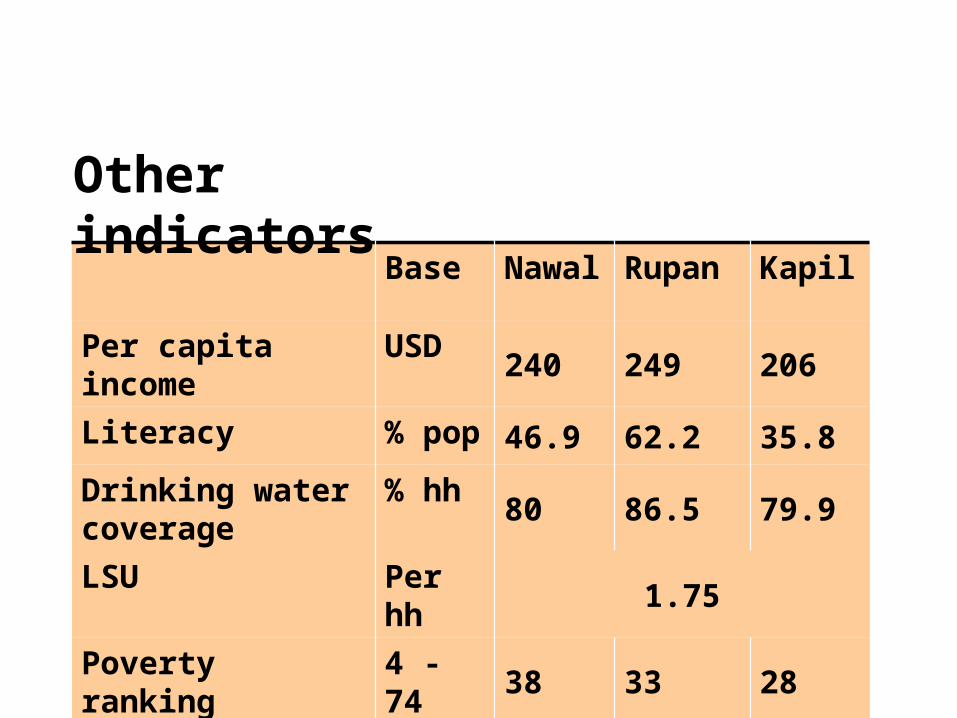
Base Nawal Rupan Kapil
Per capita income USD 240 249 206
Literacy % pop 46.9 62.2 35.8
Drinking water coverage
% hh80 86.5 79.9
LSU Per hh 1.75
Poverty ranking 4 - 74 38 33 28
Other indicators
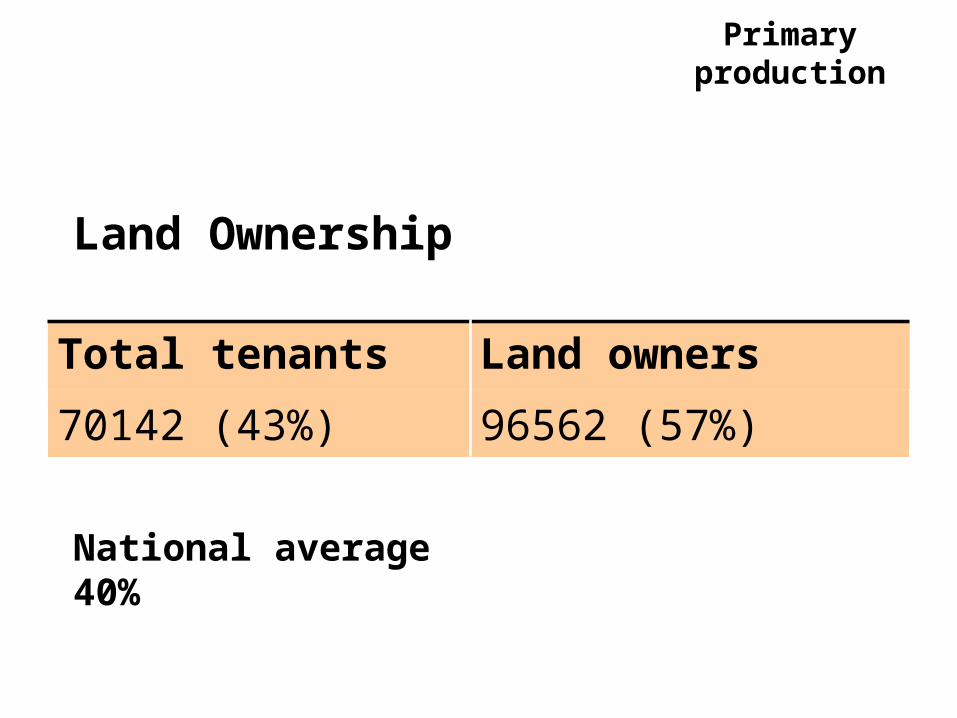
Primary production
Land Ownership
Total tenants Land owners
70142 (43%) 96562 (57%)
National average 40%
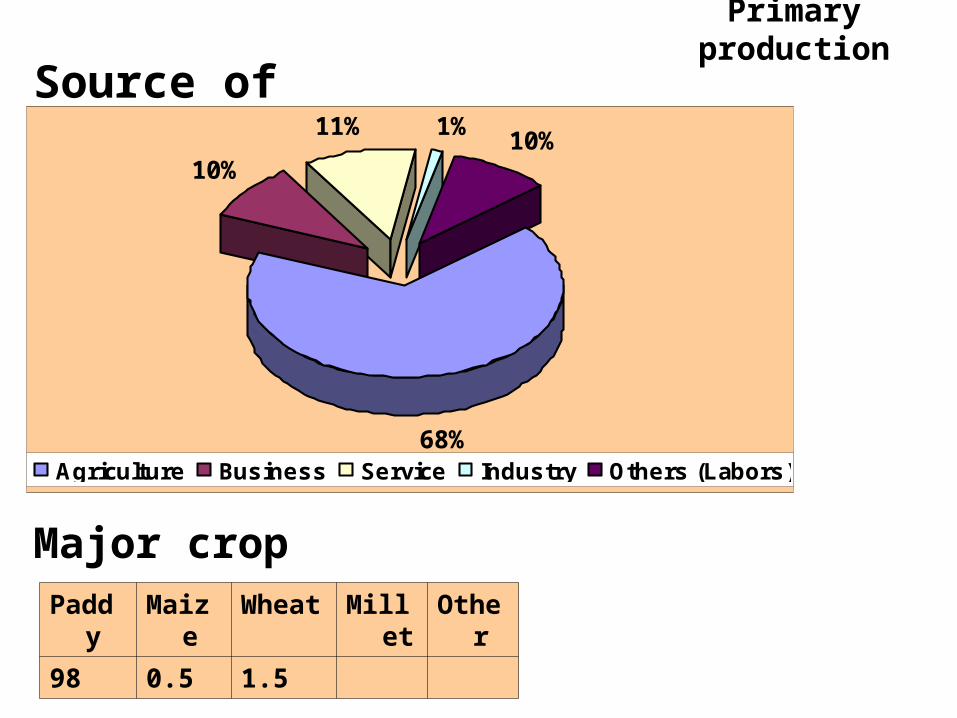
Primary production
Paddy Maize Wheat Millet Other
98 0.5 1.5
Major crop
Source of livelihood
68%
10%
11% 1%10%
Agriculture Business Service Industry Others (Labors)
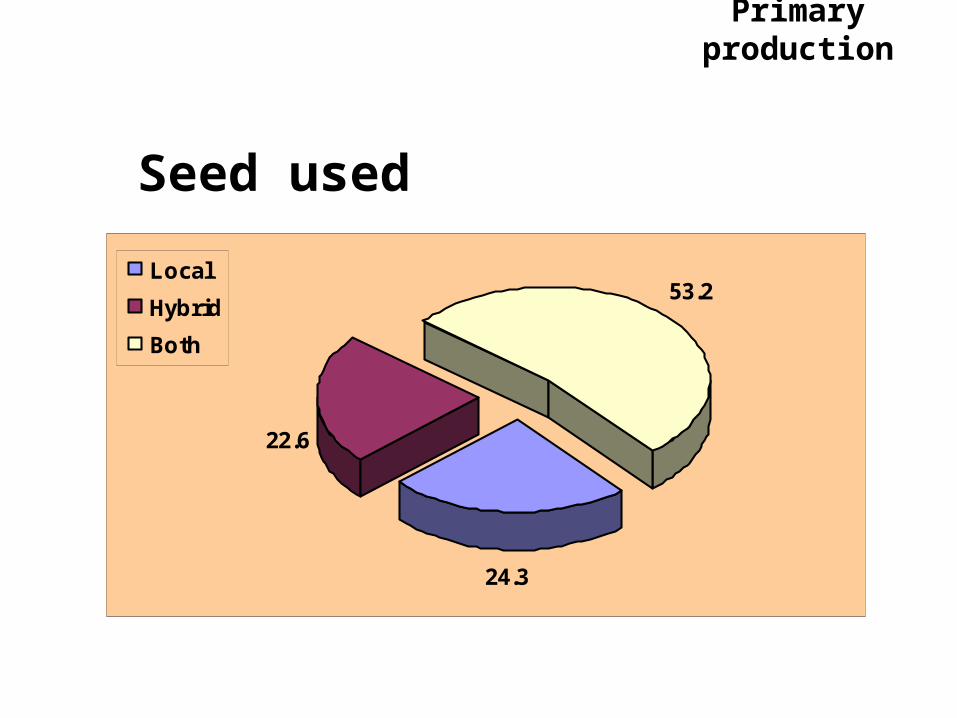
Primary production
Seed used
24.3
22.6
53.2Local
Hybrid
Both
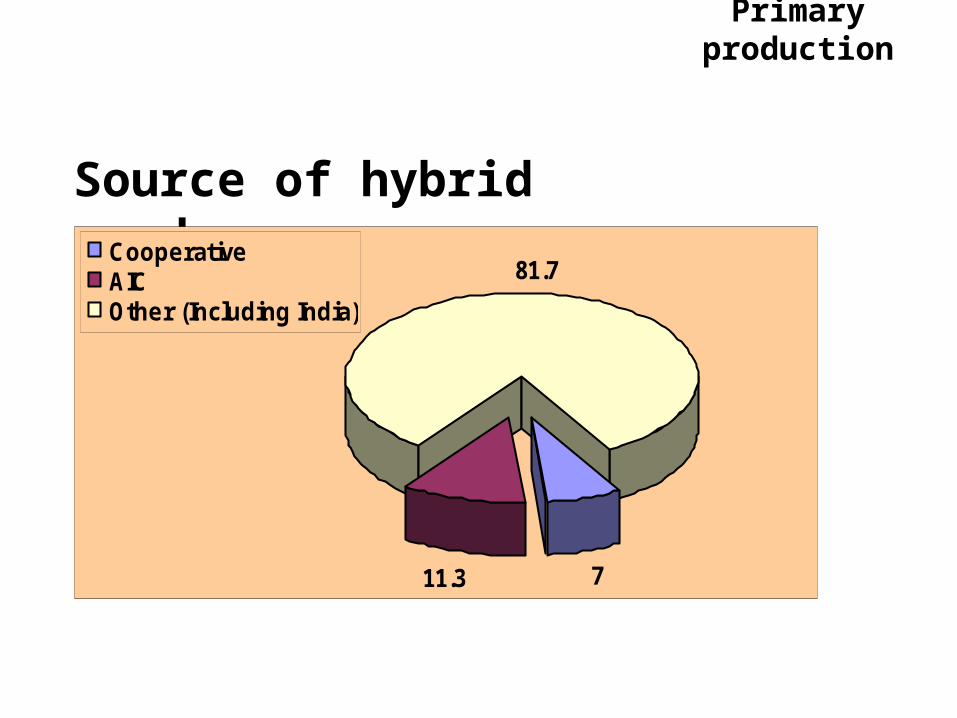
Primary production
Source of hybrid seeds
711.3
81.7CooperativeAICOther (Including India)
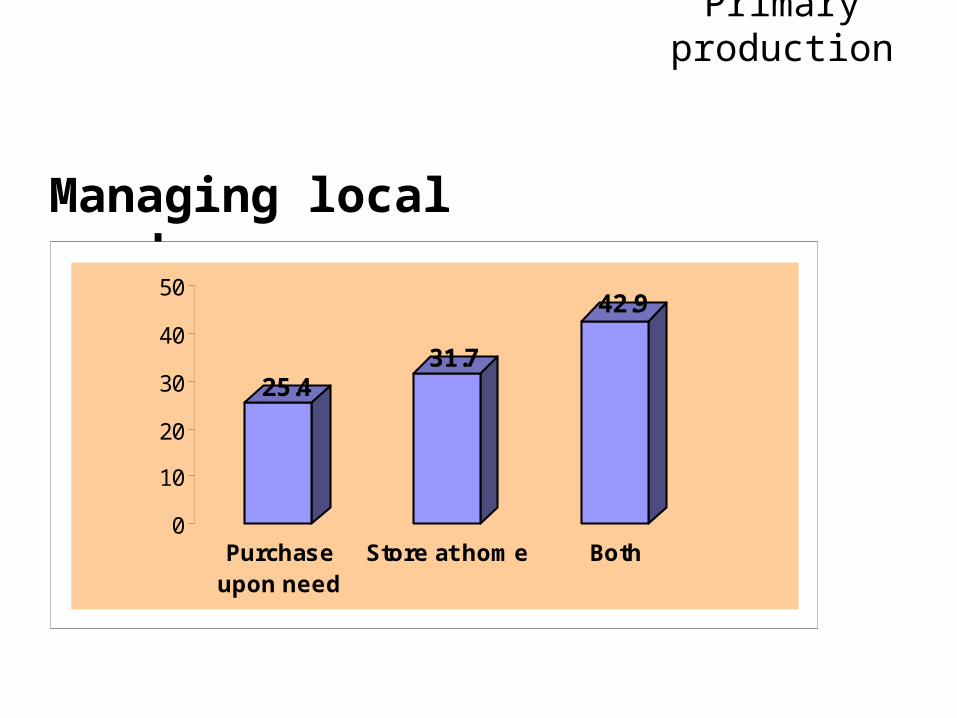
Primary production
Managing local seeds
25.431.7
42.9
0
10
20
30
40
50
Purchaseupon need
Store at home Both
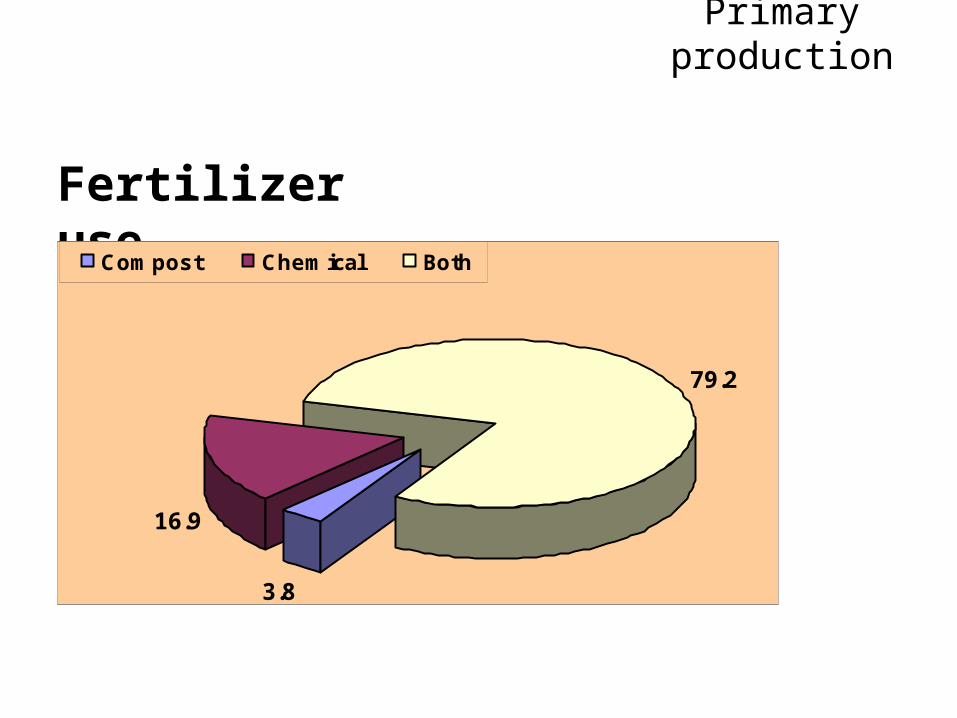
Primary production
Fertilizer use
3.8
16.9
79.2
Compost Chemical Both
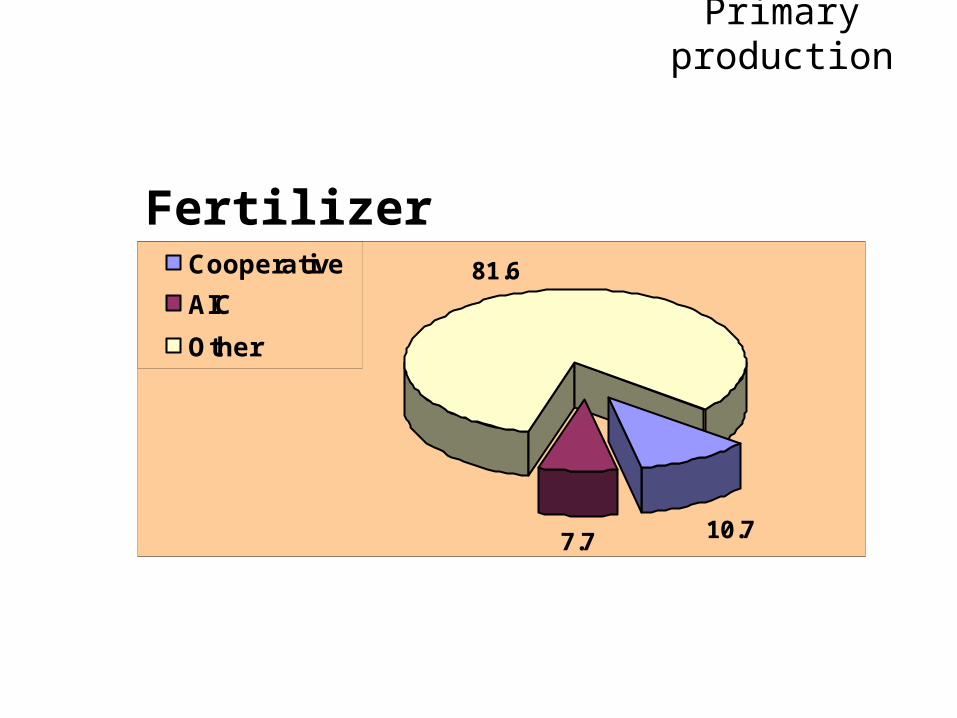
Fertilizer source
10.77.7
81.6Cooperative
AIC
Other
Primary production
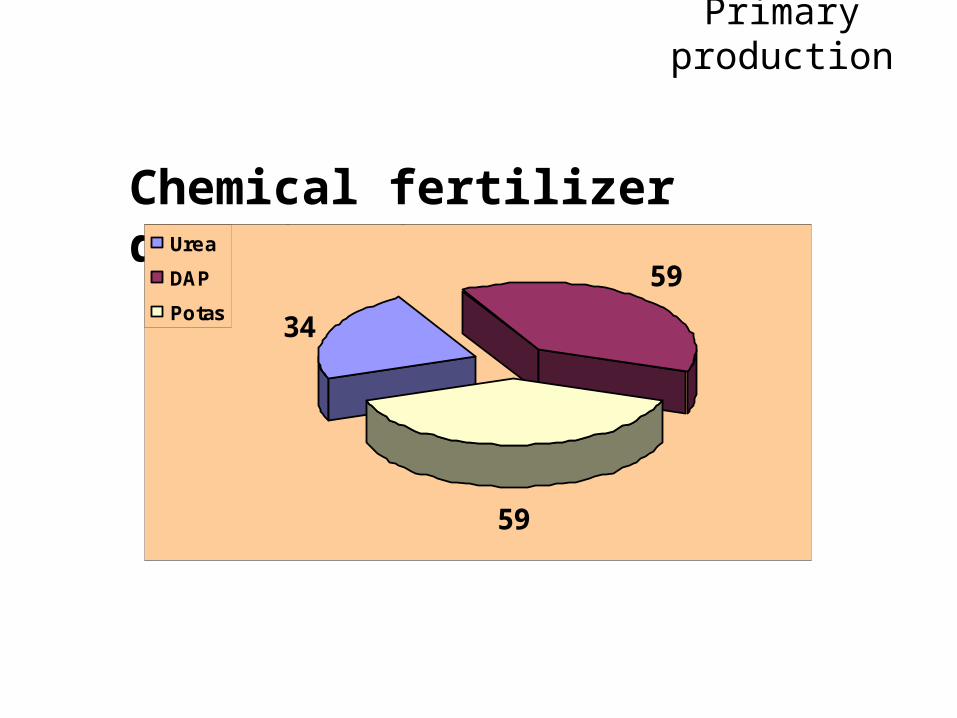
Chemical fertilizer distribution
34
59
59
Urea
DAP
Potas
Primary production
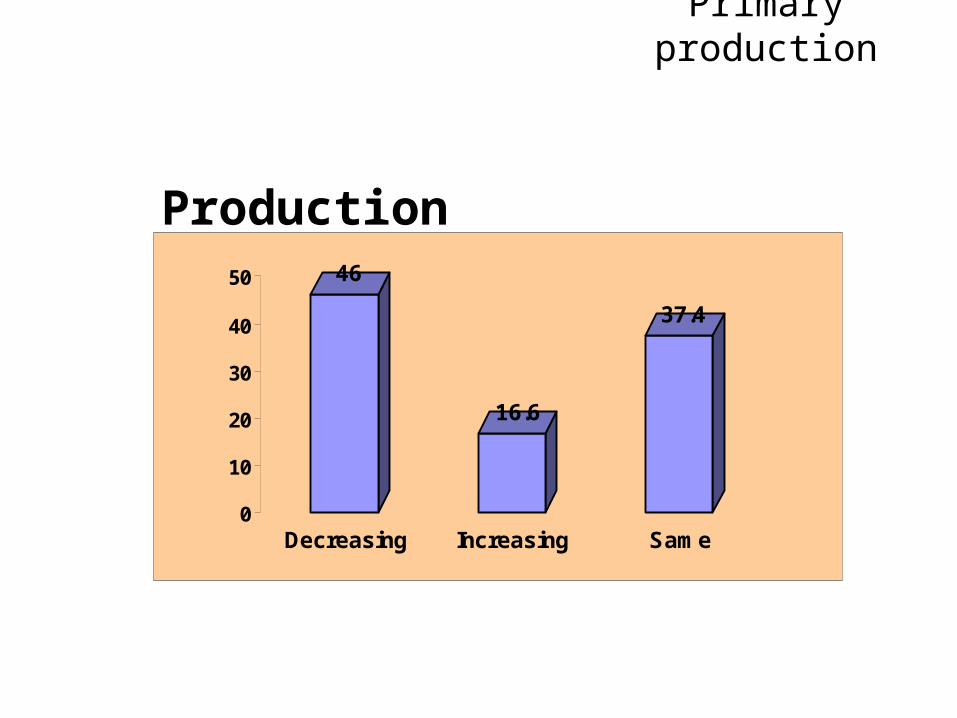
Production trend46
16.6
37.4
0
10
20
30
40
50
Decreasing Increasing Same
Primary production
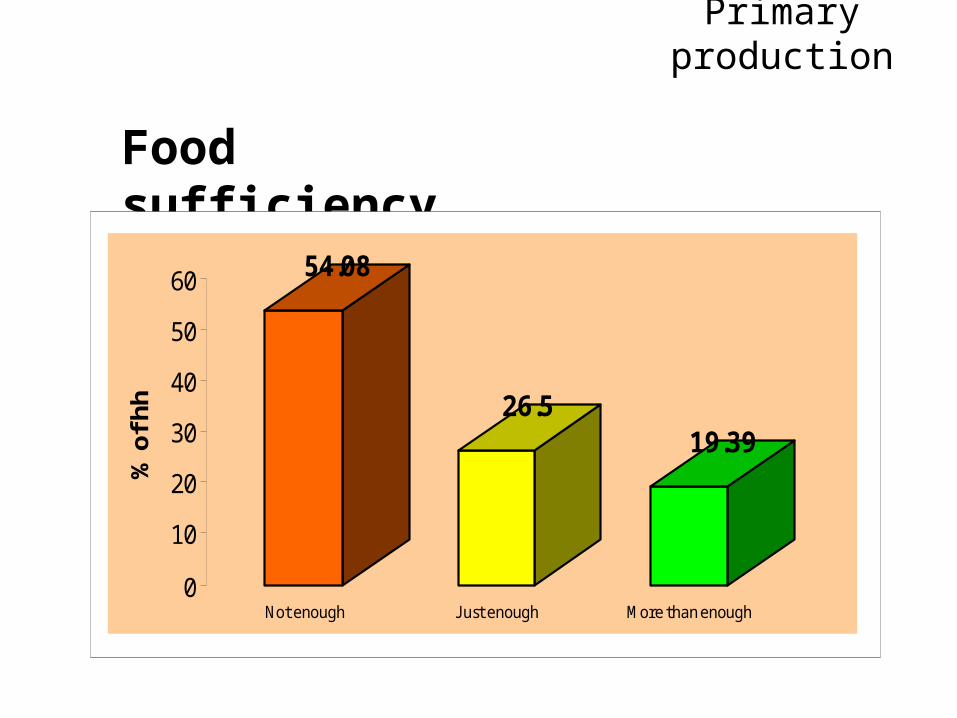
Food sufficiency
54.08
26.519.39
0
10
20
30
40
50
60
% o
f h
h
Not enough J ust enough More than enough
Primary production
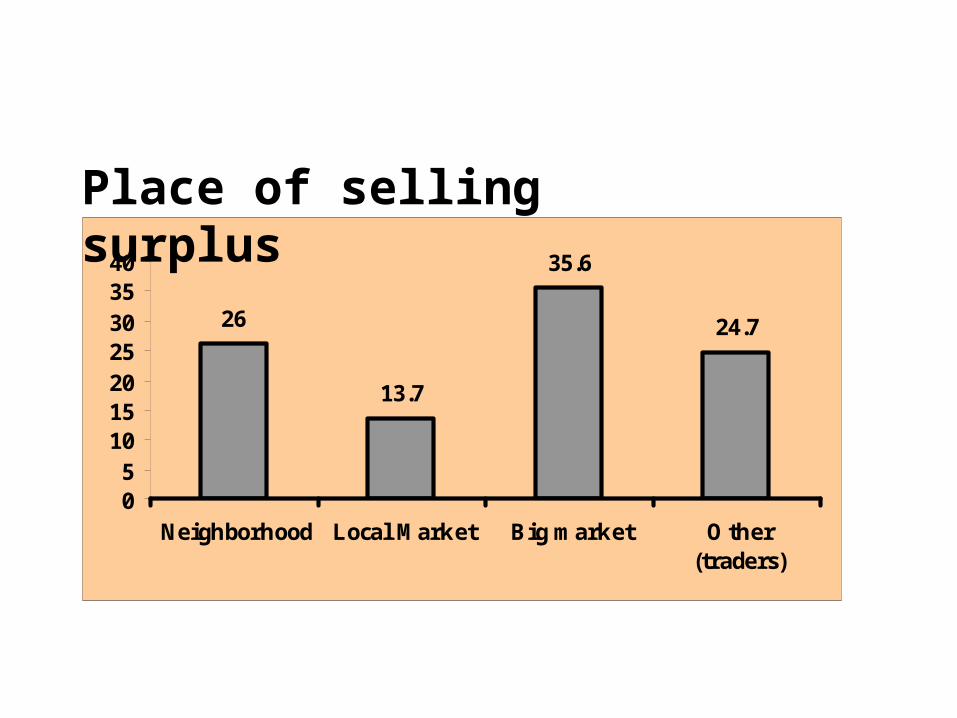
26
13.7
35.6
24.7
05
10152025303540
Neighborhood Local Market Big market O ther(traders)
Place of selling surplus
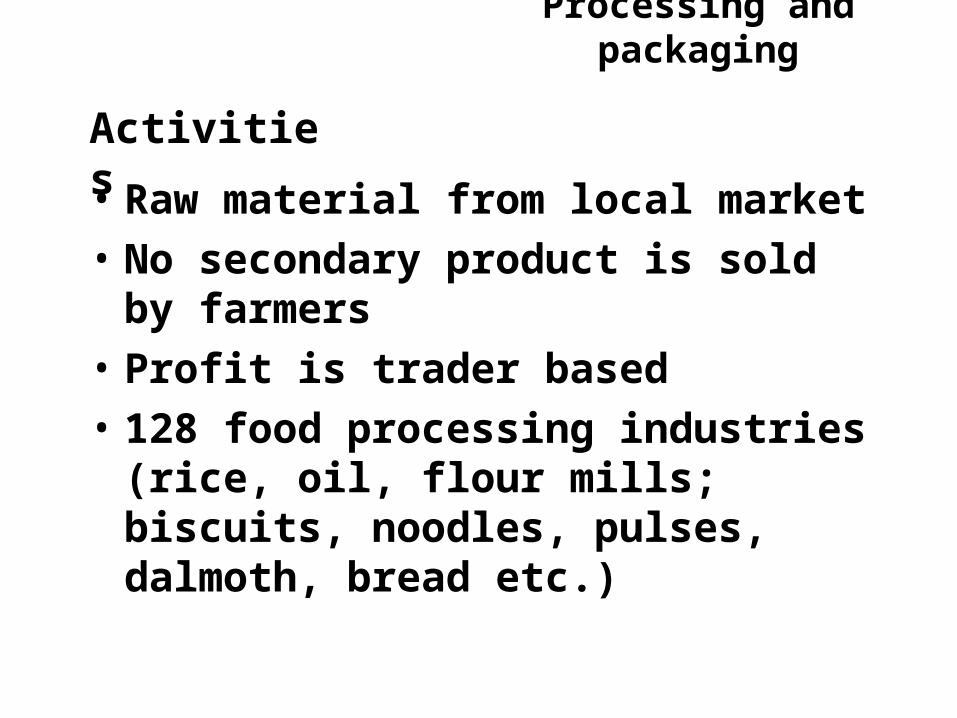
Processing and packaging
• Raw material from local market
• No secondary product is sold by farmers
• Profit is trader based
• 128 food processing industries (rice, oil, flour mills; biscuits, noodles, pulses, dalmoth, bread etc.)
Activities
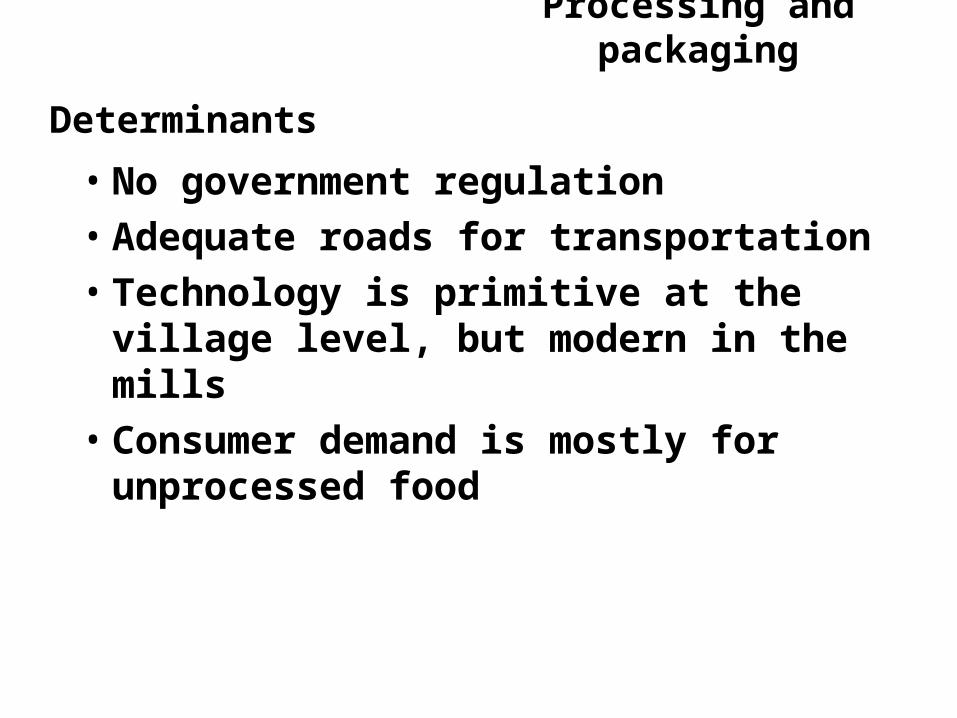
Processing and packaging
Determinants • No government regulation • Adequate roads for transportation• Technology is primitive at the village
level, but modern in the mills• Consumer demand is mostly for
unprocessed food
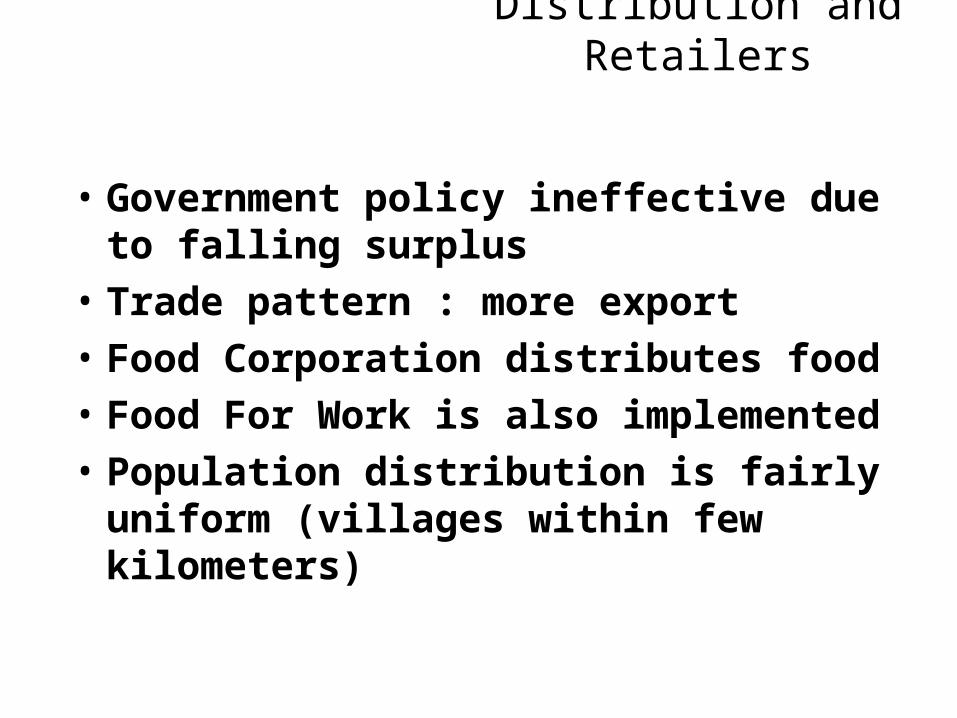
Distribution and Retailers
• Government policy ineffective due to falling surplus
• Trade pattern : more export
• Food Corporation distributes food
• Food For Work is also implemented
• Population distribution is fairly uniform (villages within few kilometers)
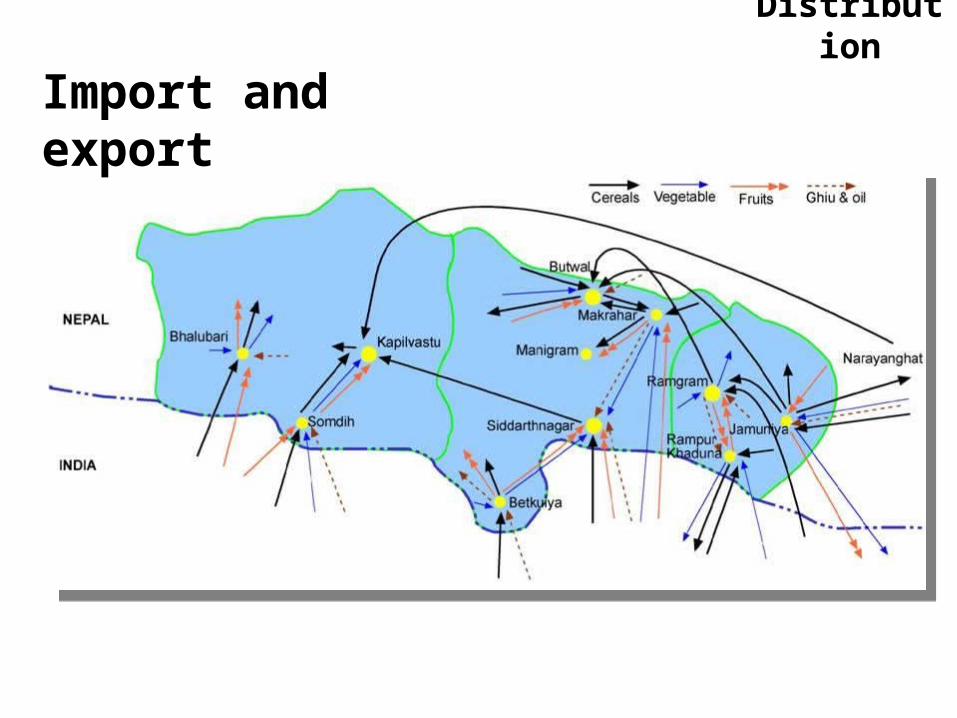
Import and export
Distribution
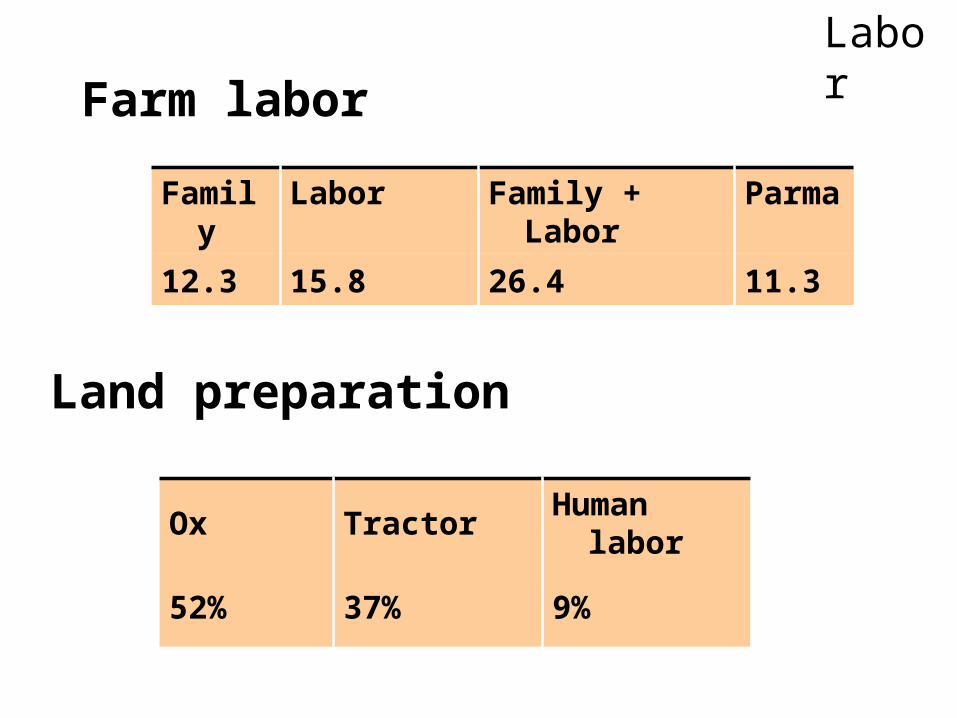
Family Labor Family + Labor Parma
12.3 15.8 26.4 11.3
Farm labor
Land preparation
Ox Tractor Human labor
52% 37% 9%
Labor
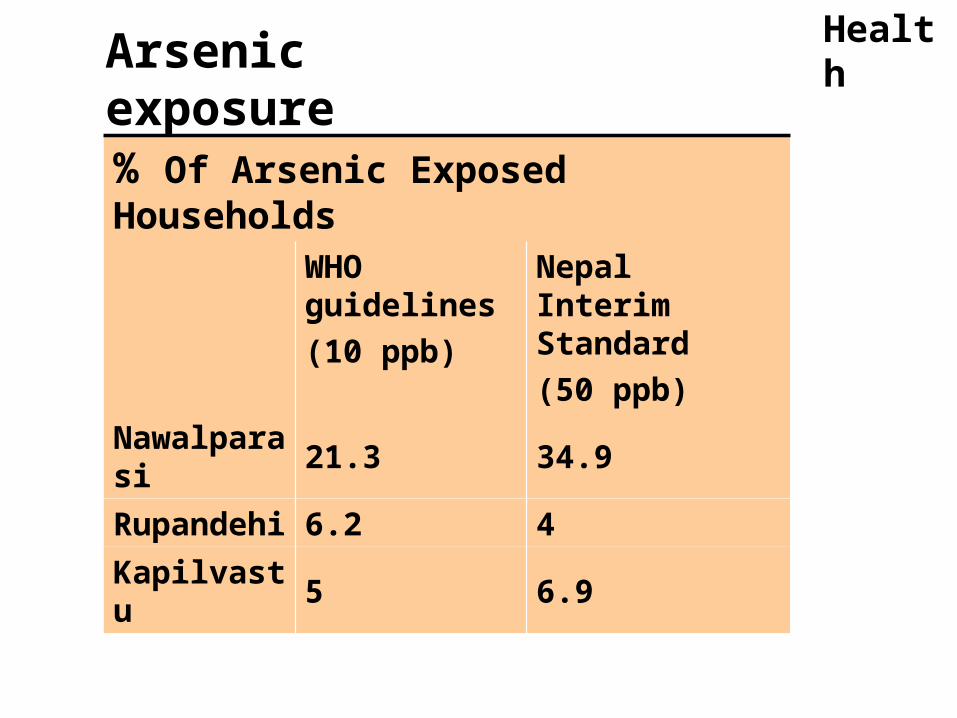
Arsenic exposure
% Of Arsenic Exposed Households WHO guidelines
(10 ppb)
Nepal Interim Standard
(50 ppb)
Nawalparasi 21.3 34.9
Rupandehi 6.2 4
Kapilvastu 5 6.9
Health
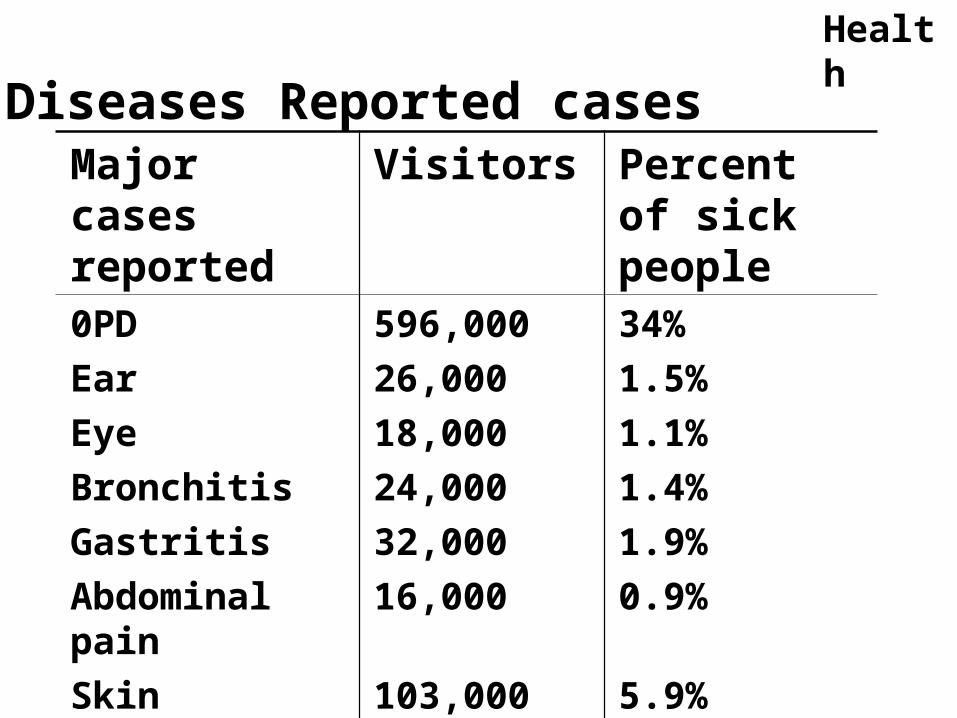
Major cases reported
Visitors Percent of sick people
0PD 596,000 34%
Ear 26,000 1.5%
Eye 18,000 1.1%
Bronchitis 24,000 1.4%
Gastritis 32,000 1.9%
Abdominal pain
16,000 0.9%
Skin 103,000 5.9%
Diseases Reported cases
Health
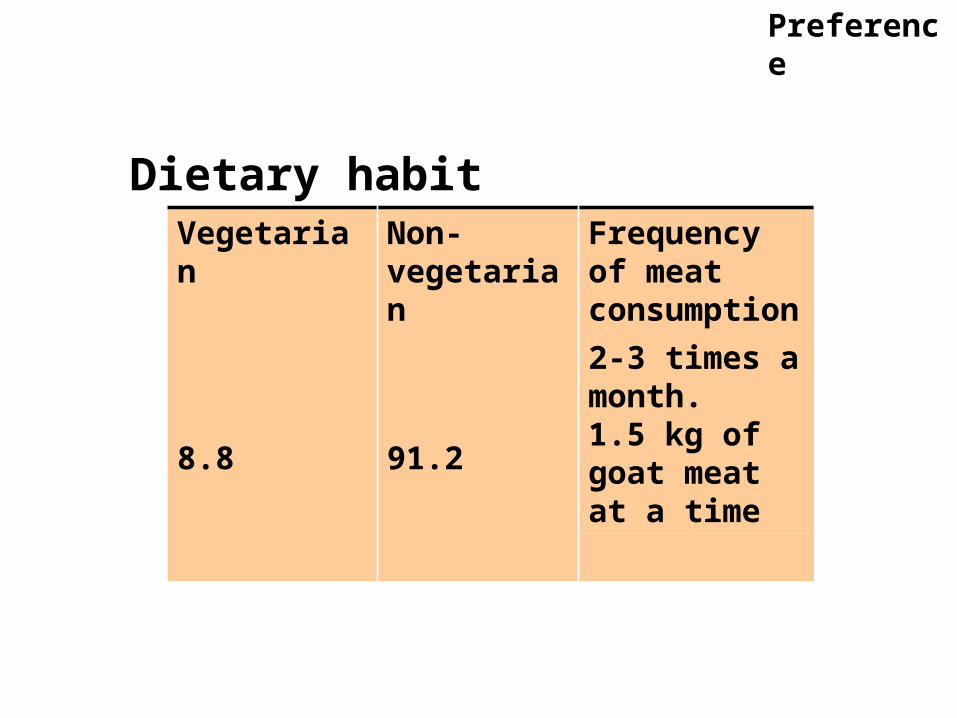
Dietary habitVegetarian Non-
vegetarianFrequency of meat consumption
8.8 91.2
2-3 times a month. 1.5 kg of goat meat at a time
Preference
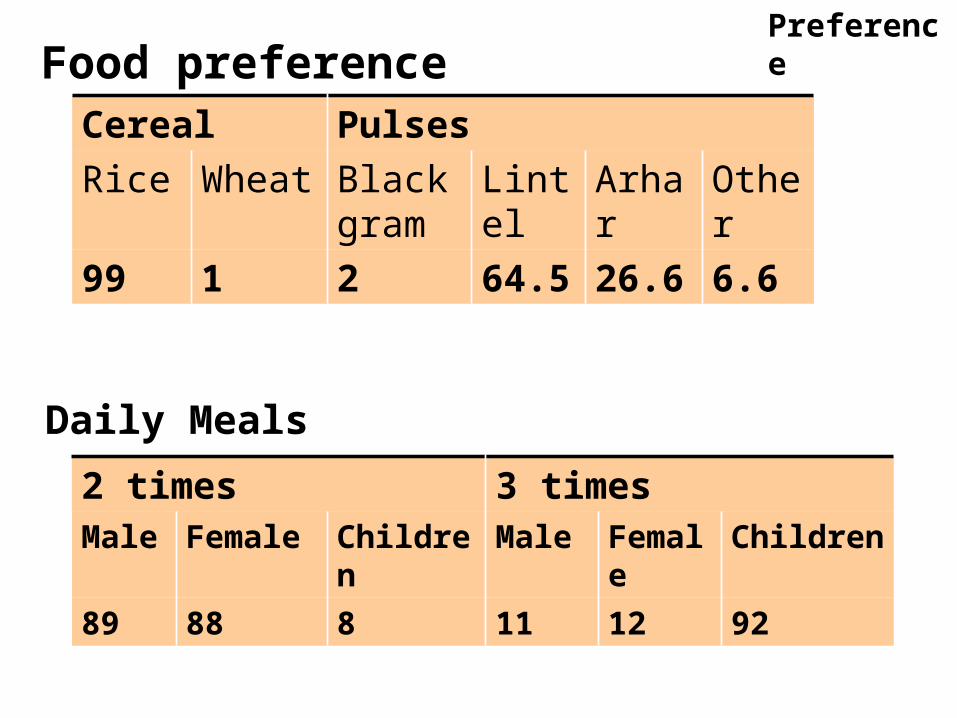
Food preferenceCereal Pulses
Rice Wheat Black gram
Lintel Arhar Other
99 1 2 64.5 26.6 6.6
Daily Meals
2 times 3 timesMale Female Children Male Female Children
89 88 8 11 12 92
Preference
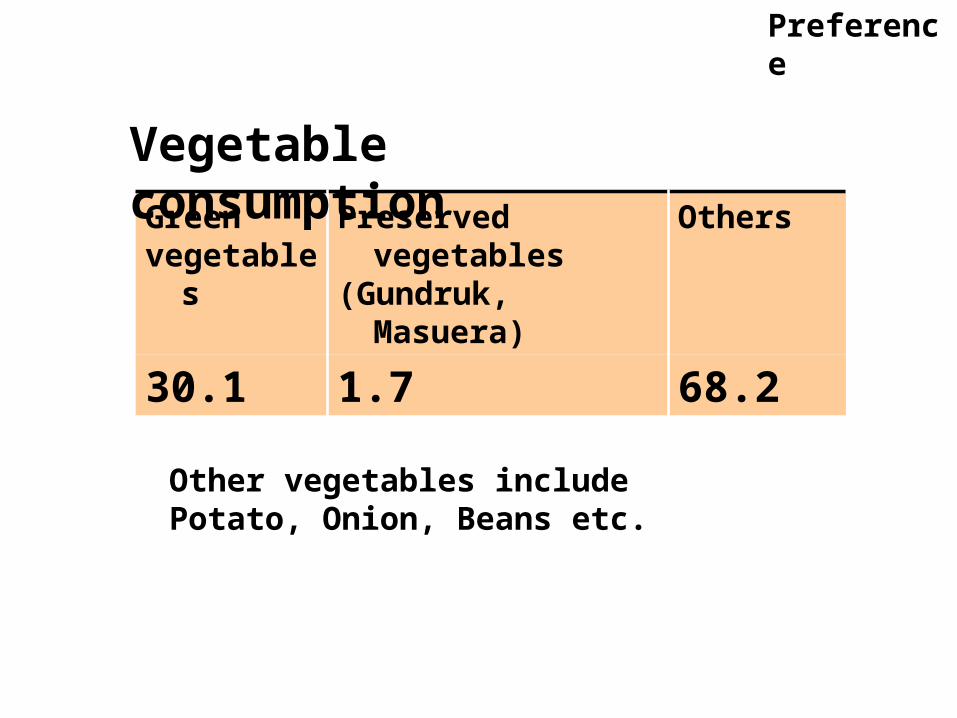
Greenvegetables
Preserved vegetables(Gundruk, Masuera)
Others
30.1 1.7 68.2
Vegetable consumption
Preference
Other vegetables include Potato, Onion, Beans etc.
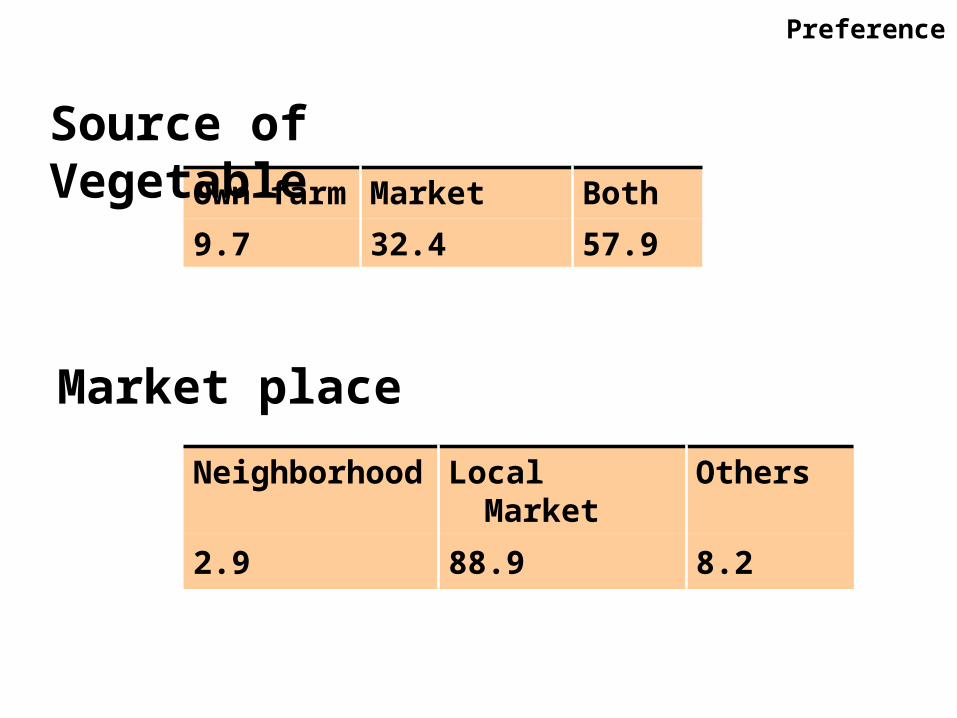
Own farm Market Both
9.7 32.4 57.9
Source of Vegetable
Neighborhood Local Market Others
2.9 88.9 8.2
Market place
Preference
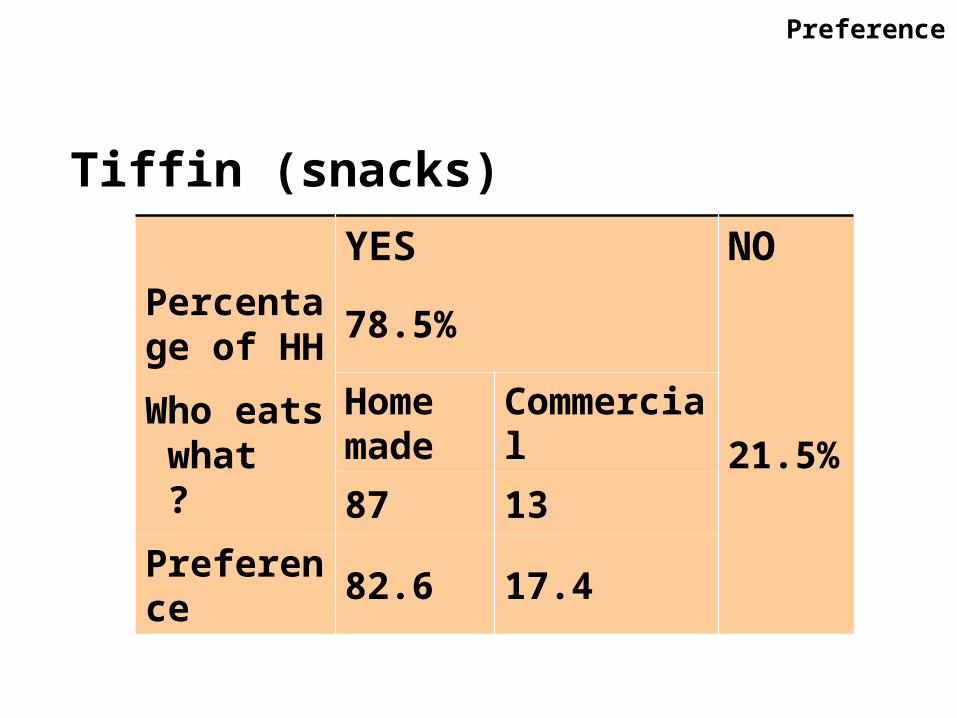
Tiffin (snacks)
YES NOPercentage of HH
78.5%
21.5%Who eats what ?
Home made
Commercial
87 13
Preference 82.6 17.4
Preference
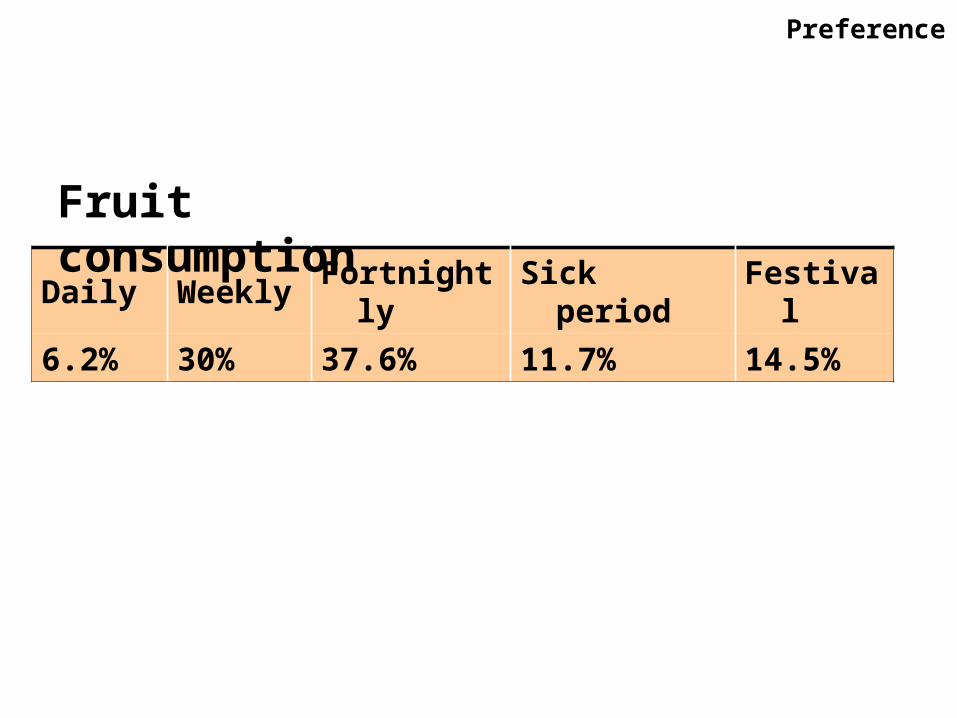
Daily Weekly Fortnightly Sick period Festival
6.2% 30% 37.6% 11.7% 14.5%
Fruit consumption
Preference
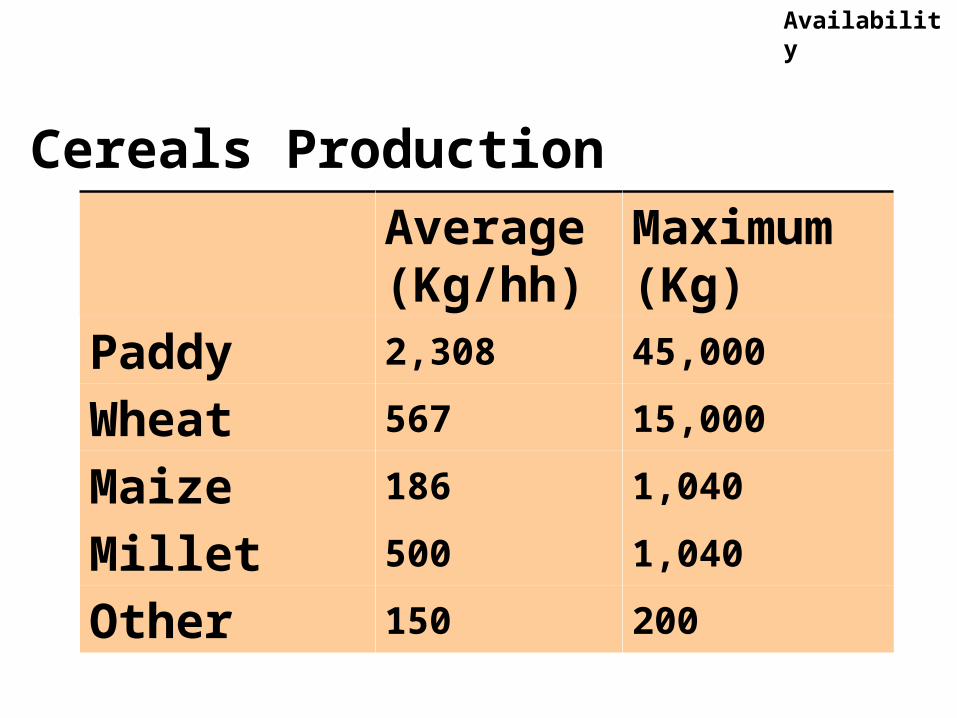
Cereals Production
Average (Kg/hh)
Maximum (Kg)
Paddy 2,308 45,000
Wheat 567 15,000
Maize 186 1,040
Millet 500 1,040
Other 150 200
Availability
Availability
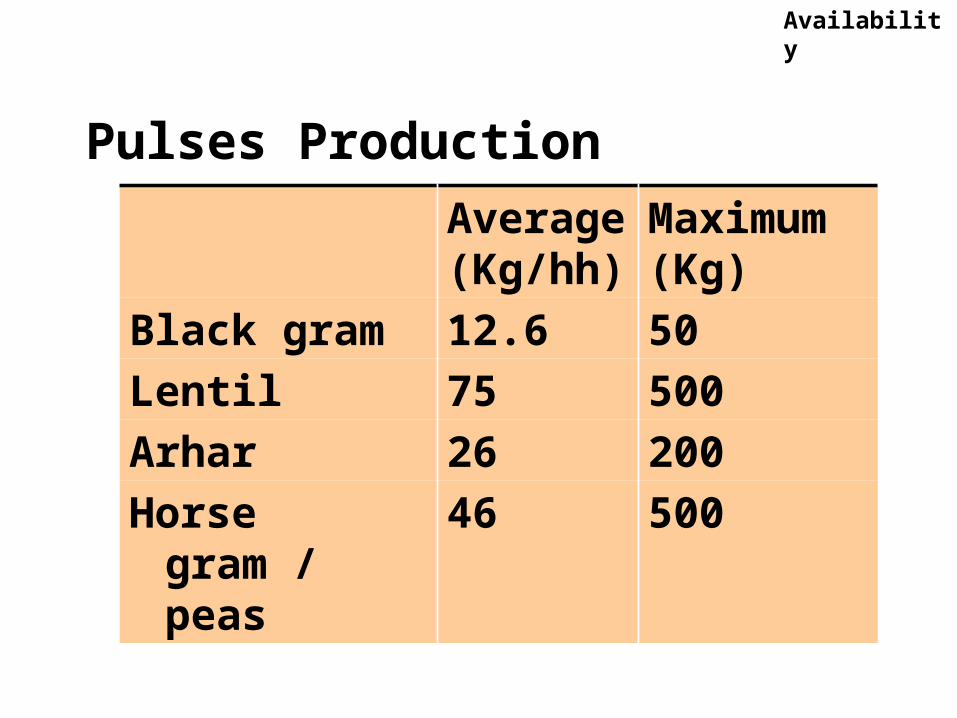
Pulses Production
Average (Kg/hh)
Maximum (Kg)
Black gram 12.6 50
Lentil 75 500
Arhar 26 200
Horse gram / peas
46 500
Availability
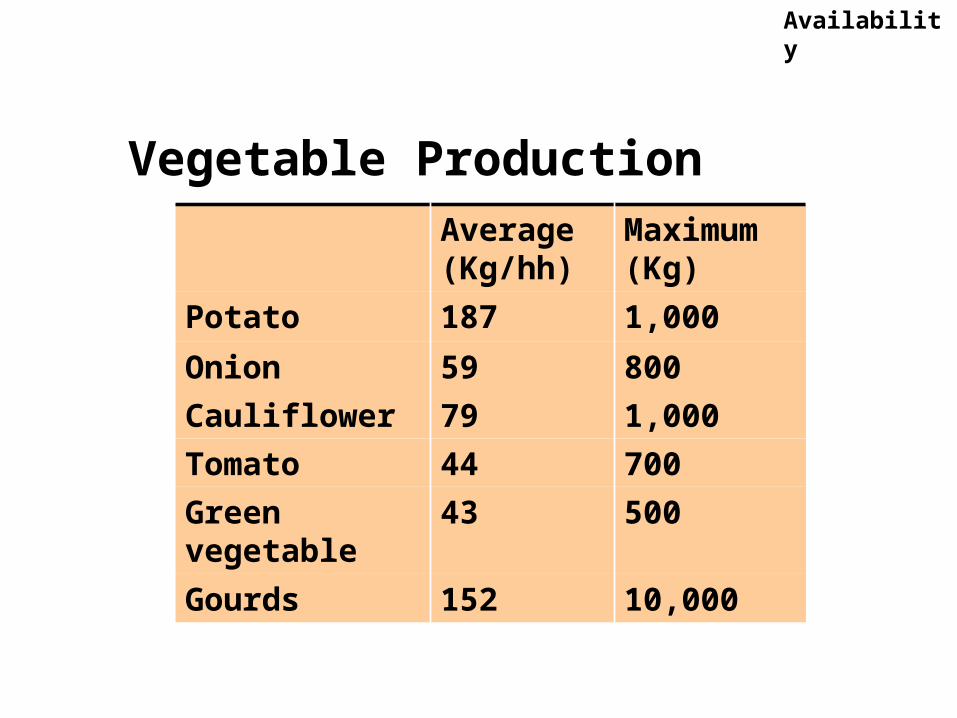
Vegetable ProductionAverage (Kg/hh)
Maximum (Kg)
Potato 187 1,000
Onion 59 800
Cauliflower 79 1,000
Tomato 44 700
Green vegetable 43 500
Gourds 152 10,000
Availability
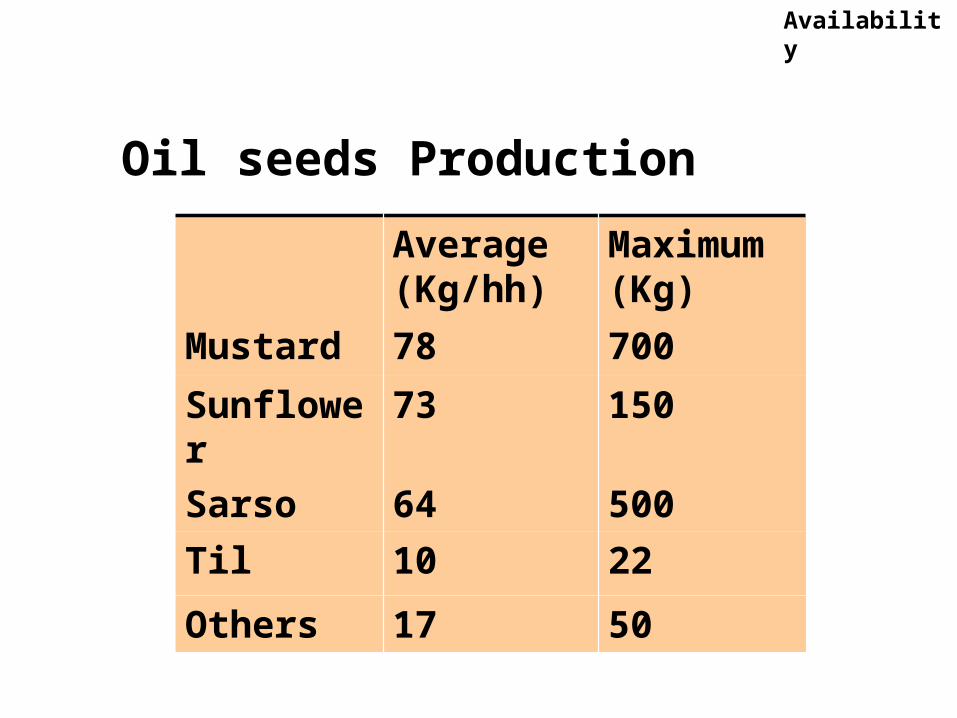
Oil seeds Production
Average (Kg/hh)
Maximum (Kg)
Mustard 78 700
Sunflower 73 150
Sarso 64 500
Til 10 22
Others 17 50
Availability
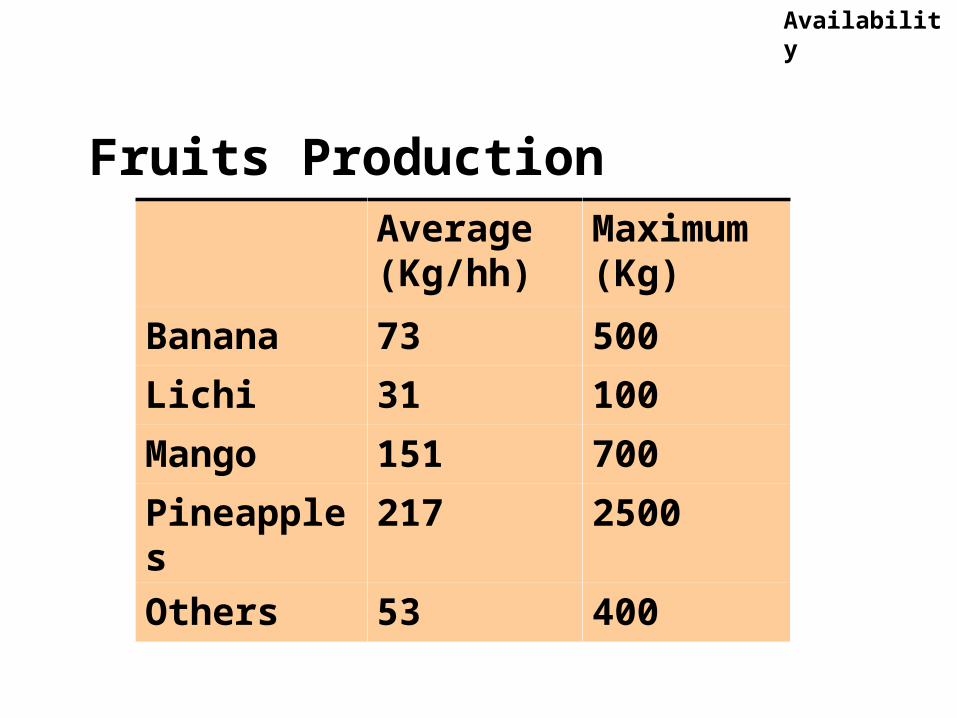
Fruits ProductionAverage (Kg/hh)
Maximum (Kg)
Banana 73 500
Lichi 31 100
Mango 151 700
Pineapples 217 2500
Others 53 400
Availability
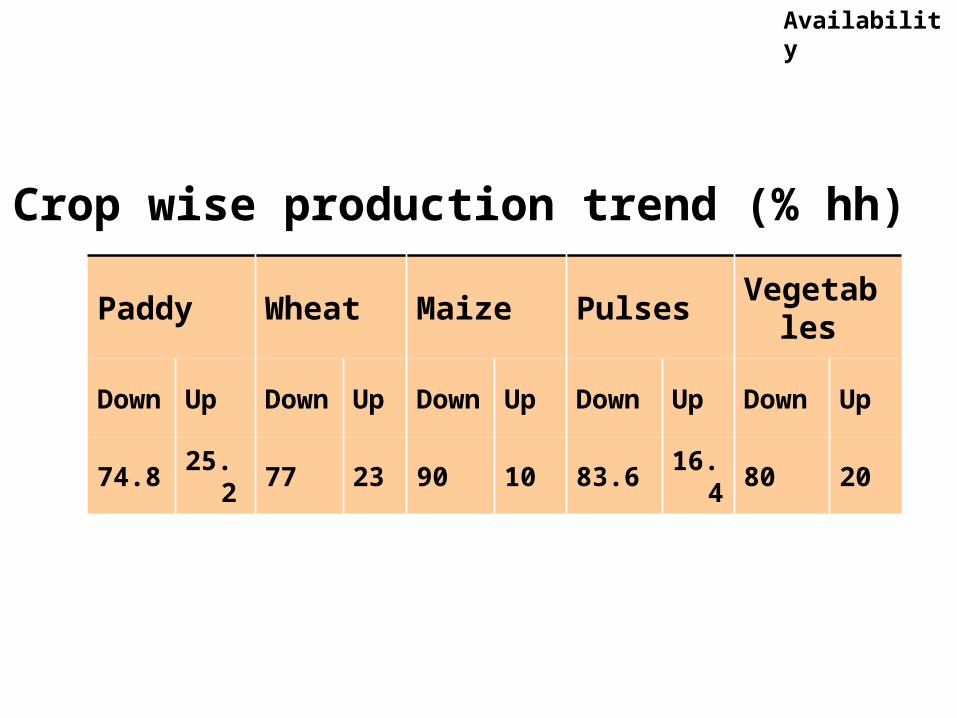
Crop wise production trend (% hh)
Paddy Wheat Maize Pulses Vegetables
Down Up Down Up Down Up Down Up Down Up
74.8 25.2 77 23 90 10 83.6 16.4 80 20
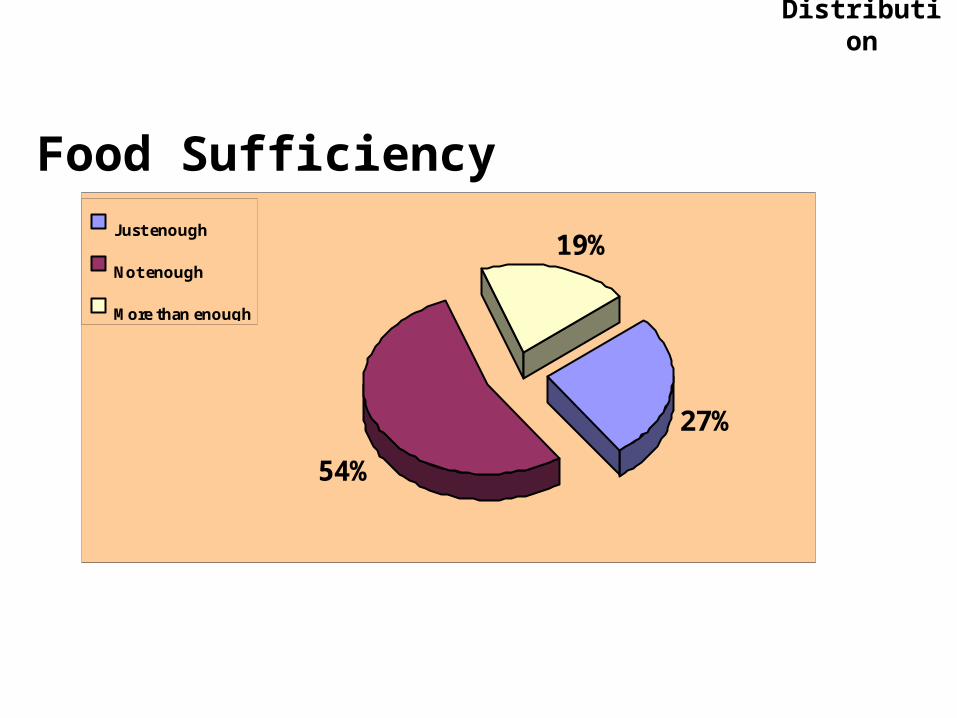
27%
54%
19%Just enough
Not enough
More than enough
Food Sufficiency
Distribution
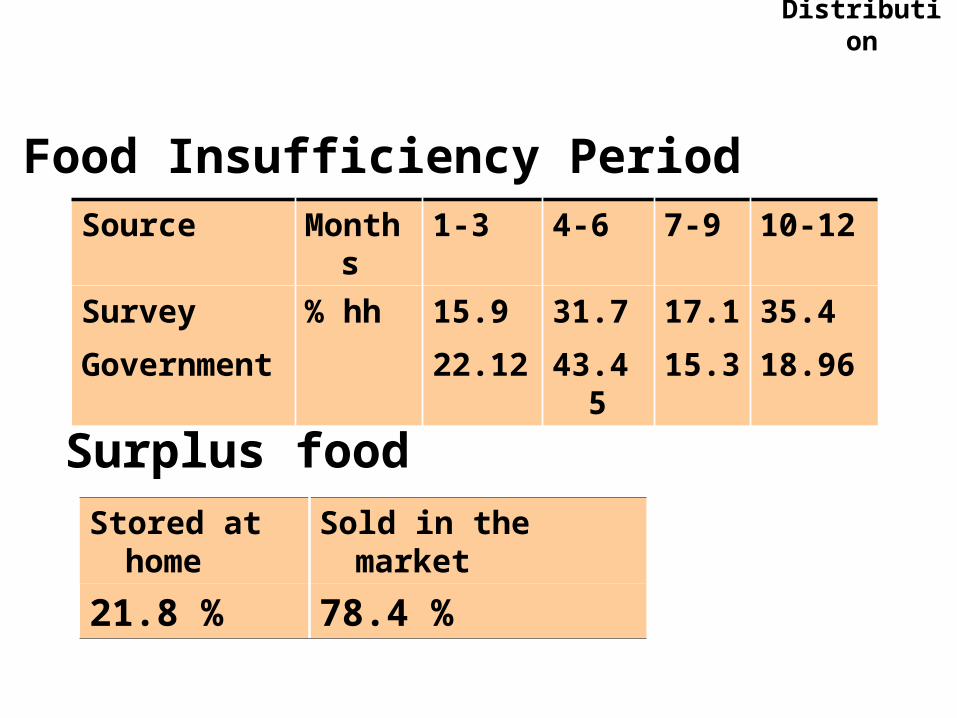
Source Months 1-3 4-6 7-9 10-12
Survey % hh 15.9 31.7 17.1 35.4
Government 22.12 43.45 15.3 18.96
Food Insufficiency Period
Surplus foodStored at home Sold in the market
21.8 % 78.4 %
Distribution
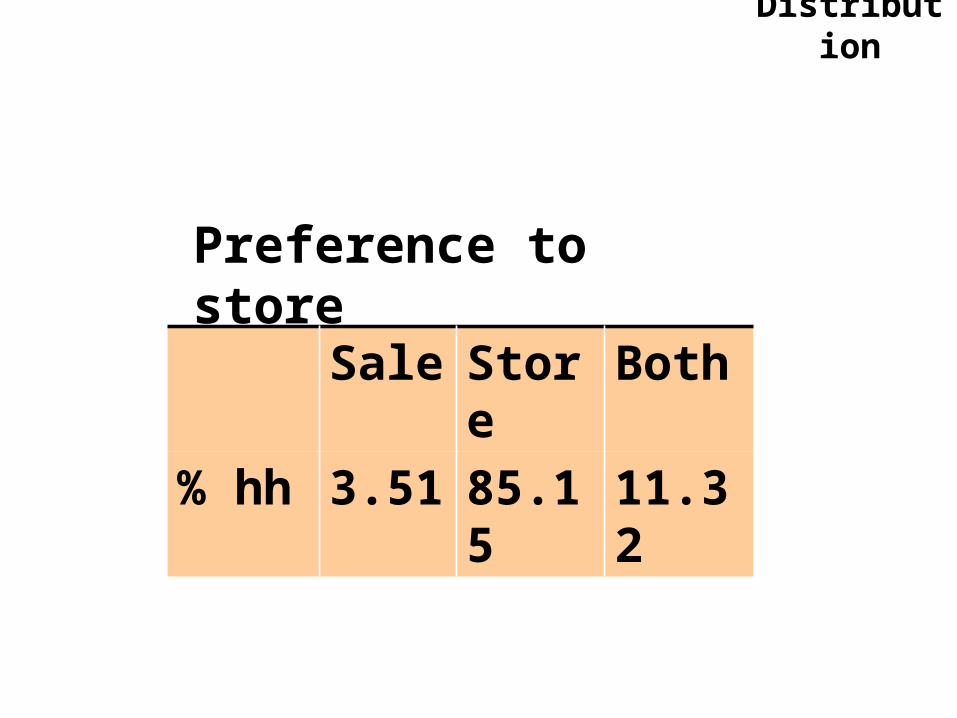
Sale Store Both
% hh 3.51 85.15 11.32
Preference to store
Distribution
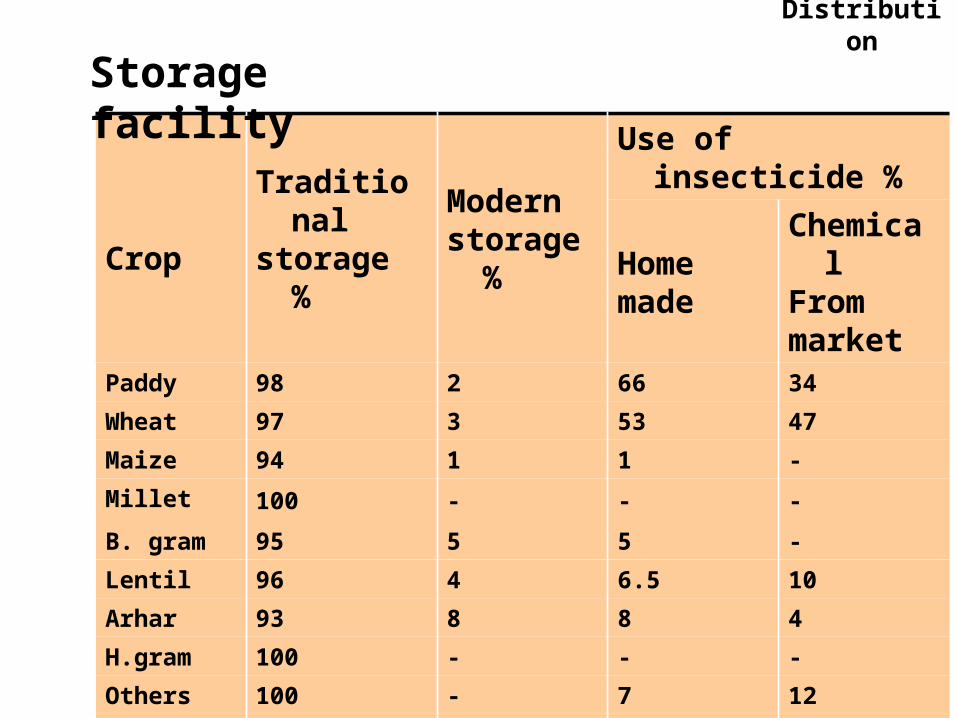
CropTraditionalstorage %
Modernstorage %
Use of insecticide %
Homemade
ChemicalFrommarket
Paddy 98 2 66 34
Wheat 97 3 53 47
Maize 94 1 1 -
Millet 100 - - -
B. gram 95 5 5 -
Lentil 96 4 6.5 10
Arhar 93 8 8 4
H.gram 100 - - -
Others 100 - 7 12
Potato 99 1 3 -
Onion 98 2 2 2
Storage facility
Distribution
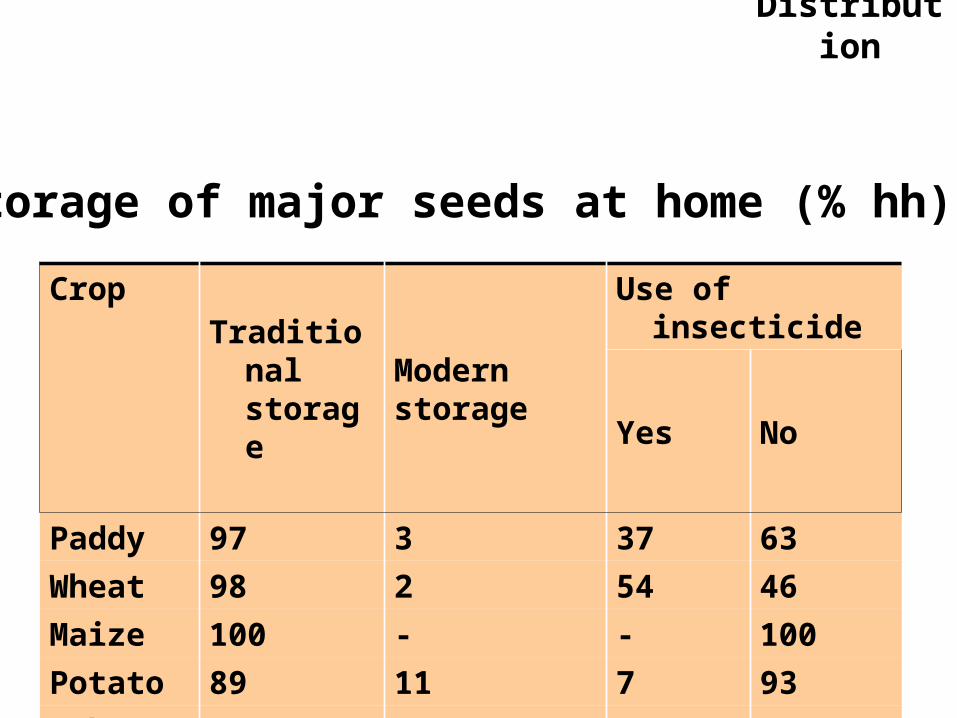
CropTraditional
storageModernstorage
Use of insecticide
Yes No
Paddy 97 3 37 63
Wheat 98 2 54 46
Maize 100 - - 100
Potato 89 11 7 93
Otherseeds
100 - 30 70
Storage of major seeds at home (% hh)
Distribution
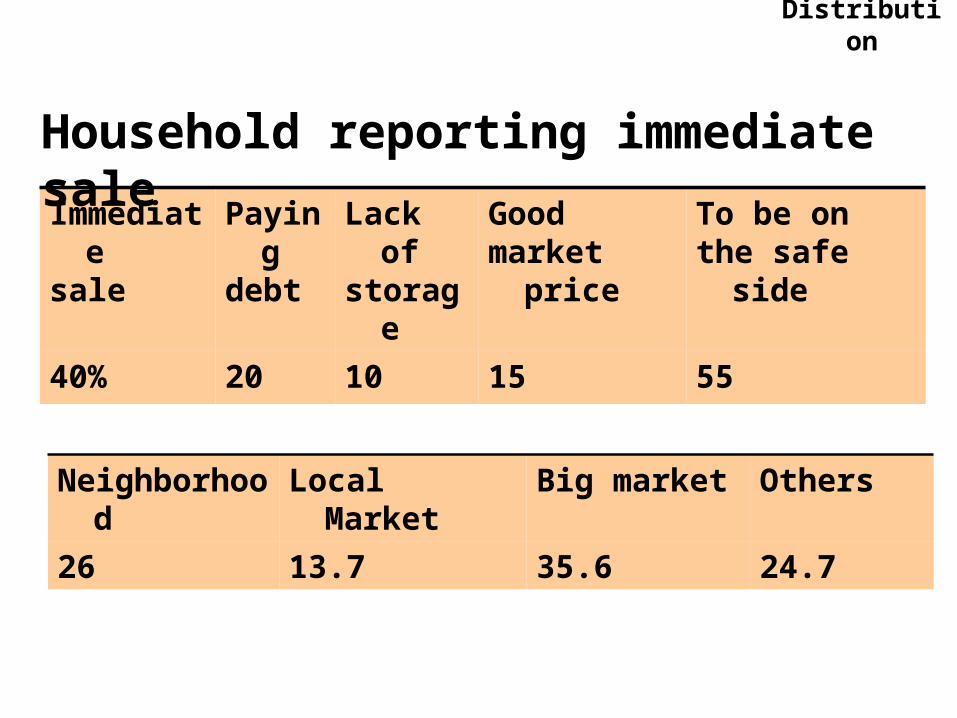
Immediatesale
Payingdebt
Lack of storage
Good market price
To be on the safe side
40% 20 10 15 55
Household reporting immediate sale
Distribution
Neighborhood Local Market Big market Others
26 13.7 35.6 24.7
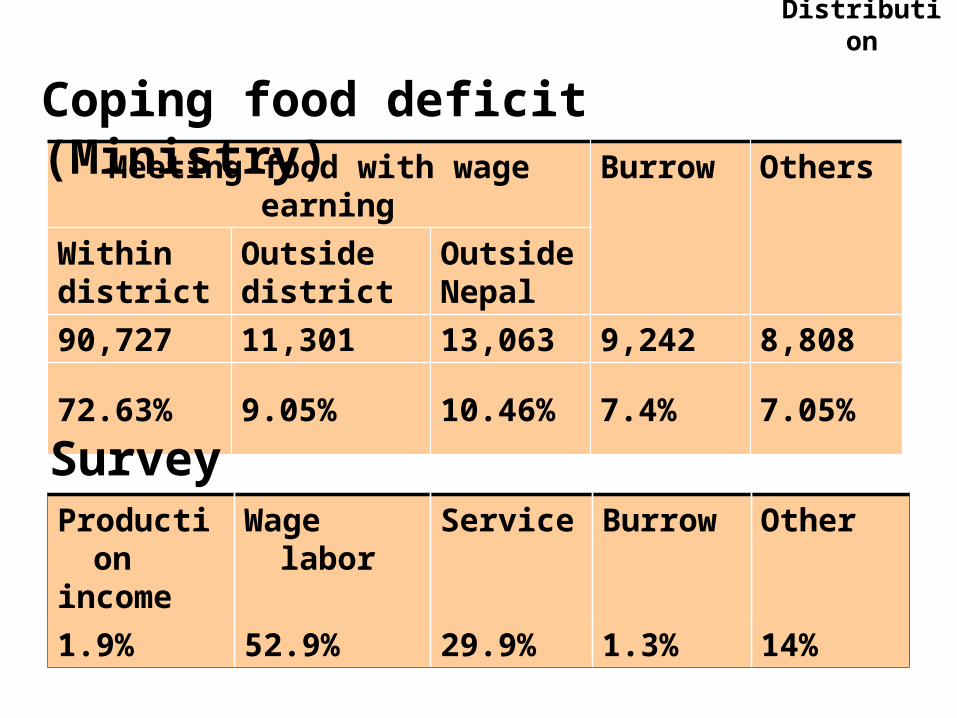
Productionincome
Wage labor Service Burrow Other
1.9% 52.9% 29.9% 1.3% 14%
Meeting food with wage earning Burrow Others
Withindistrict
Outsidedistrict
OutsideNepal
90,727 11,301 13,063 9,242 8,808
72.63% 9.05% 10.46% 7.4% 7.05%
Coping food deficit (Ministry)
Distribution
Survey
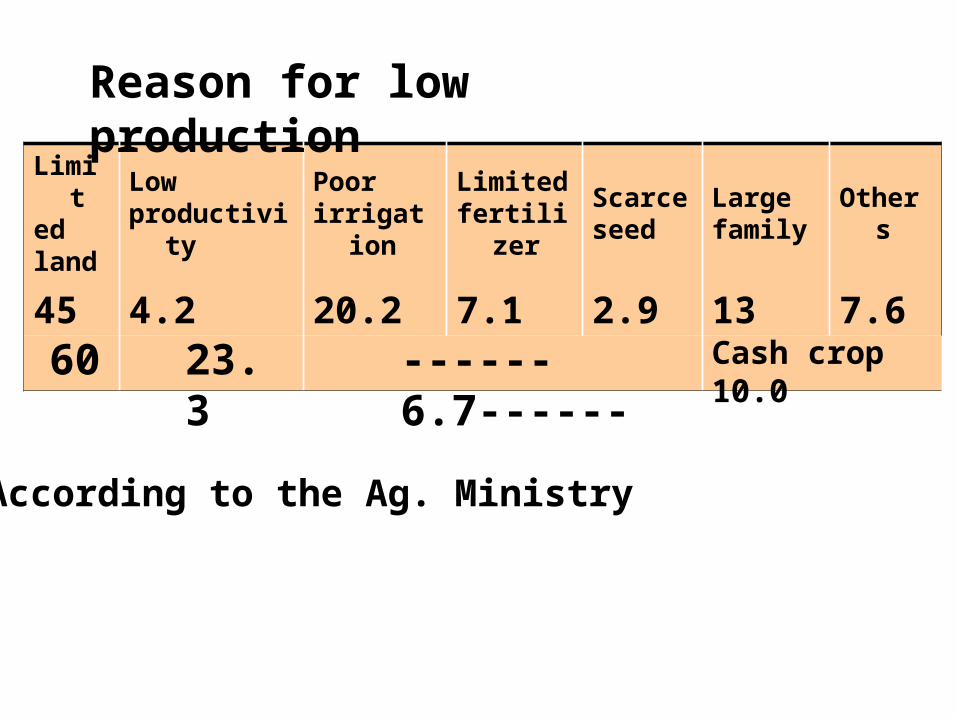
Limitedland
Low productivity
Poorirrigation
Limitedfertilizer
Scarceseed
Largefamily
Others
45 4.2 20.2 7.1 2.9 13 7.6
Reason for low production
60 23.3 ------6.7------ Cash crop 10.0
According to the Ag. Ministry
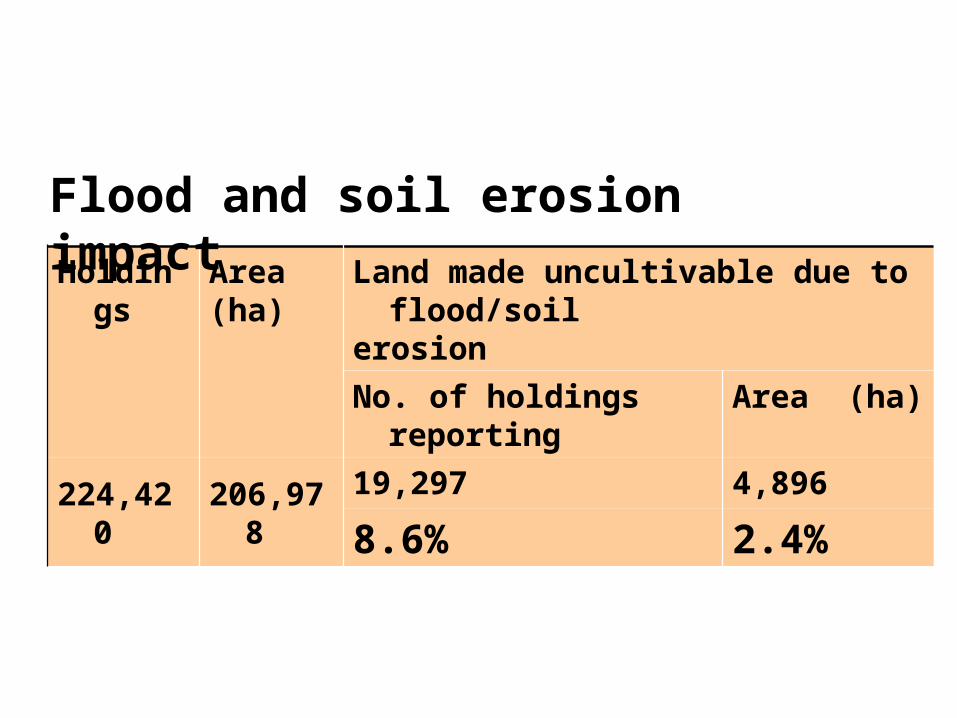
Holdings Area(ha)
Land made uncultivable due to flood/soilerosion
No. of holdings reporting Area (ha)
224,420 206,97819,297 4,896
8.6% 2.4%
Flood and soil erosion impact
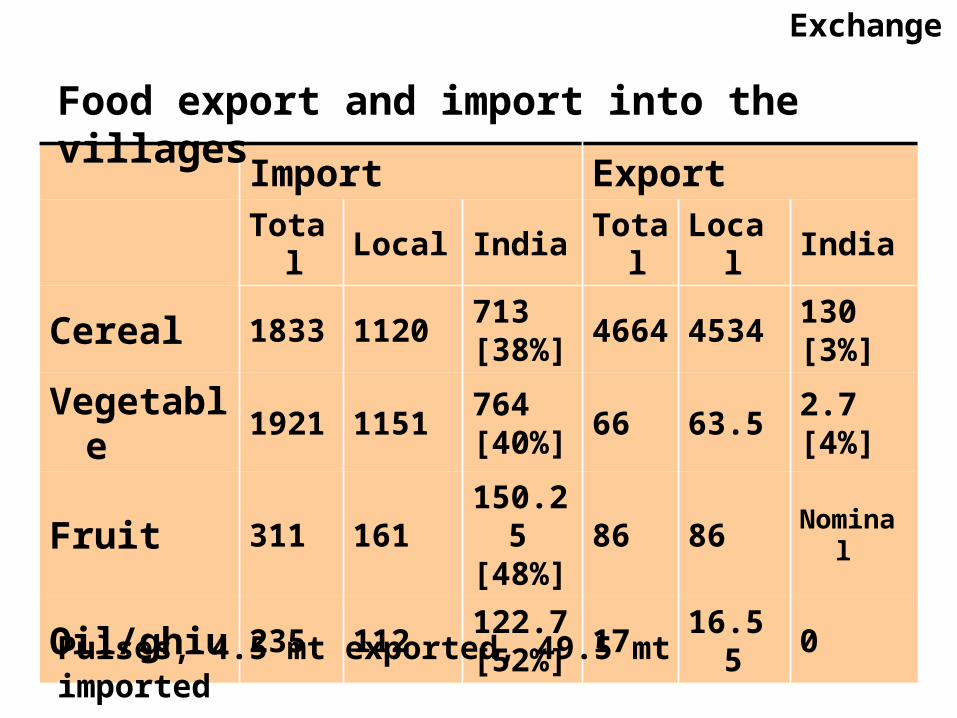
Import Export
Total Local India Total Local India
Cereal 1833 1120713[38%]
4664 4534130 [3%]
Vegetable 1921 1151764[40%]
66 63.52.7[4%]
Fruit 311 161150.25[48%]
86 86 Nominal
Oil/ghiu 235 112122.7[52%]
17 16.55 0
Pulses, 4.5 mt exported, 49.5 mt imported
Food export and import into the villages
Exchange
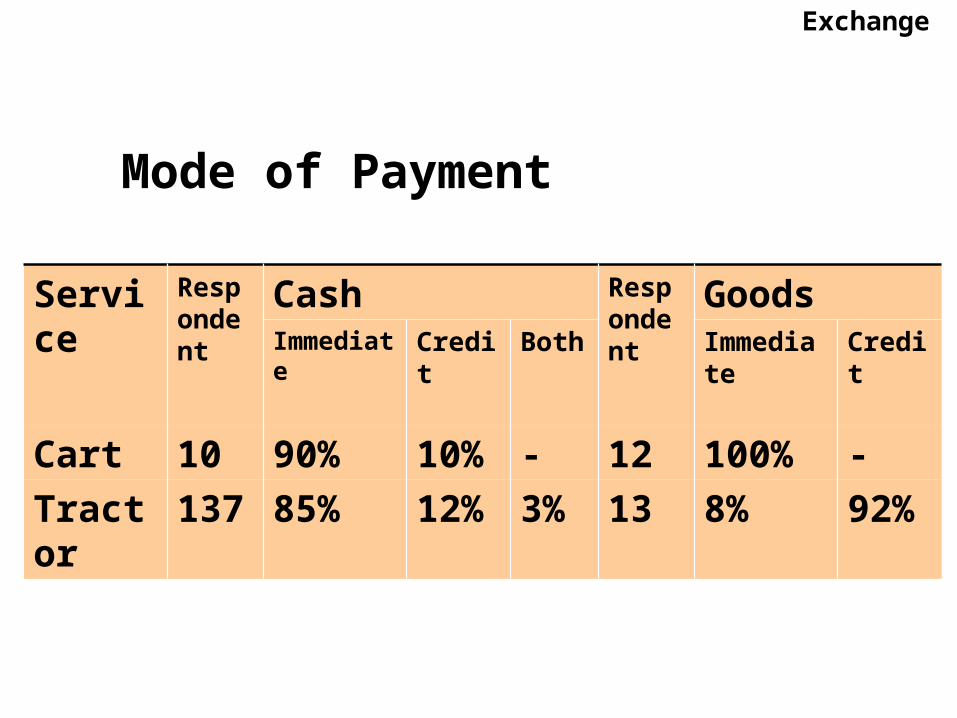
Mode of Payment
Service Respondent
Cash Respondent
GoodsImmediate Credit Both Immediate Credit
Cart 10 90% 10% - 12 100% -
Tractor 137 85% 12% 3% 13 8% 92%
Exchange
Affordability
• Pricing policy : Ineffective committee, market based
• Seasonal variation : Difficult in rainy season
• Food preparation : Simple, affordable
Distribution and retailers• Transport : Bicycle, Rikshaw, Jeep,
Bus• Advertising (radio) : Some impact• Delivery to consumers : Commercial
food by retailers • Haat bazar : Main source of market• Pricing : Fixed by traders
Allocation