Embed Size (px)
Citation preview

HAL Id: hal-03036236https://hal.archives-ouvertes.fr/hal-03036236
Submitted on 2 Dec 2020
HAL is a multi-disciplinary open accessarchive for the deposit and dissemination of sci-entific research documents, whether they are pub-lished or not. The documents may come fromteaching and research institutions in France orabroad, or from public or private research centers.
L’archive ouverte pluridisciplinaire HAL, estdestinée au dépôt et à la diffusion de documentsscientifiques de niveau recherche, publiés ou non,émanant des établissements d’enseignement et derecherche français ou étrangers, des laboratoirespublics ou privés.
Size-based characterization of polysaccharides by Taylordispersion analysis with photochemical oxidation or back
scattering interferometry detectionsL Leclercq, Phoonthawee Saetear, Agnès Rolland-Sabaté, Jean Philippe Biron,
Joseph Chamieh, Luca Cipelletti, Darryl J Bornhop, Herve Cottet
To cite this version:L Leclercq, Phoonthawee Saetear, Agnès Rolland-Sabaté, Jean Philippe Biron, Joseph Chamieh, etal.. Size-based characterization of polysaccharides by Taylor dispersion analysis with photochemicaloxidation or back scattering interferometry detections. Macromolecules, American Chemical Society,2019, 52 (12), pp.4421-4431. �10.1021/acs.macromol.9b00605�. �hal-03036236�

Page 1 / 33
Size-based characterization of polysaccharides by Taylor
dispersion analysis with photochemical oxidation or back
scattering interferometry detections
Laurent Leclercq1,*, Phoonthawee Saetear1,2, Agnès Rolland-Sabaté3, 4 , Jean-
Philippe Biron1, Joseph Chamieh1, Luca Cipelletti5, Darryl J. Bornhop6, 7, Hervé
Cottet1,*
1 IBMM, Université de Montpellier, CNRS, ENSCM, Montpellier, France
2 Department of Chemistry and the Center of Excellence for Innovation in Chemistry,
Faculty of Science, Mahidol University, Rama 6 Road, Ratchatewi, Bangkok 10400,
Thailand
3 UR1268 Biopolymères Interactions Assemblages, INRA, F-44300 Nantes, France
4 UMR0408 Sécurité et Qualité des Produits d’Origine Végétale, INRA, Université
Avignon, F-84000 Avignon, France
5 L2C, Université de Montpellier, CNRS, Montpellier, France
6 Department of Chemistry, Vanderbilt University, Nashville, Tennessee 37235,
United States
7 The Vanderbilt Institute for Chemical Biology, Vanderbilt University, Nashville,
Tennessee 37235, United States
*Corresponding authors. Tel.: +33 4 6714 3427; fax: +33 4 6763 1046
E-mail addresses: [email protected] (H. Cottet); and
[email protected] (L. Leclercq).

Page 2 / 33
Abstract
Taylor dispersion analysis (TDA) is a powerful sizing technique very well suited for
(macro)molecules between angstrom and sub-micron (typically up to 200 nm).
However, new detection modes are required for non UV-absorbing
(macro)molecules such as most of the polysaccharides, including starches. In this
work, two different detection modes were compared, backscattering interferometry
(BSI) and UV-photooxidation detection (UV-POD). TDA-BSI measures the relative
change of the refractive index (RI) between eluent and sample (water as eluent in
this work), whereas TDA-UV-POD detects the UV-absorbing photooxidized products
of polysaccharides/starches in a strong alkaline media (130 mM NaOH or 1 M KOH).
TDA-UV-POD detection was evaluated for linearity and sensitivity at two
wavelengths, 214 nm and 266 nm. The mass-average hydrodynamic radius (Rh)
obtained by TDA-BSI and TDA-UV-POD was found to be in excellent agreement,
while higher average Rh values were obtained by batch dynamic light scattering
(DLS) in the same conditions, due to the higher sensitivity of DLS to large size
solutes and aggregates. The hydrodynamic radius distributions obtained by TDA and
DLS are intrinsically different but both techniques were found to be complementary,
providing useful information on sample dispersity. Owing to the absence of the
stationary phase, low sample consumption with straightforward sample preparation
(no filtration), and no calibration, TDA is anticipated to become a method of choice
for the size-based characterization of polysaccharides, including starches.

Page 3 / 33
1. Introduction
Carbohydrates are ubiquitous compounds in the living world since they act as
energy and carbon sources which are essential for plant and animal metabolisms1.
They are also widely used as food additives2, 3 and in medical applications4, 5. This
class of compounds is of great complexity, namely due to the wide distributions of
molar mass (M), chemical composition and branching degree. Different separation
techniques can be used for the characterization of polysaccharides. Size-exclusion
chromatography (SEC)6 is one of the most important technique that can be coupled
to one or multiple detection methods such as: differential refractometry (DRI)6, 7,
differential viscosimetry6, 8 (VISC), multi-angle static light scattering (MALS)9. DRI
combined to MALS leads to absolute molar mass determination, while the VISC can
additionally provide the determination of hydrodynamic radius (Rh) or can be used for
universal calibration. More recently, field-flow fractionation (FFF) technologies have
been also employed for the separation of high molar mass macromolecules,
including polysaccharides10-12. Symmetric- or asymmetric-flow FFF13, 14 has regained
interested in the last years, because the absence of a stationary phase in the open
channel used in FFF limits the occurrence of undesirable adsorption frequently
observed in SEC, especially for high molar mass polymers15-18.
Capillary electrophoresis (CE) is also a well suited technique for the analysis
of charged and non-charged polysaccharides19. However, in CE the previously
mentioned detectors used in SEC or in FFF are not available due to the
miniaturization of the analysis with online detection. Generally, CE is mostly used
with UV, fluorescent, capacitively coupled contactless conductimetry (C4D)
detections and mass spectrometry. Since most of the polysaccharides are not UV or
fluorescently responding, derivatization of the analytes are required prior to analysis.
However, Rovio et al. described the use of direct UV detection of neutral mono- and

Page 4 / 33
disaccharides at 270 nm in beverages20 and plant fibers21, using strong alkaline
electrolyte at pH 12.6 (130 mM NaOH and 36 mM Na2HPO42H2O). Such high pH
ensures the ionization of the (originally neutral) saccharides for CE separation. The
detection mechanism was first described as the UV absorbance at 270 nm of
enediolates formed in alkaline conditions. The limits of detection (LOD) for neutral
mono- and disaccharides obtained from this method were about 0.02-0.05 mM20.
However, in later studies, the enediolate proposed structure was disproven by
Sarazin et al.22 since carbohydrate compounds such as sucrose cannot give
enediolate. Alternatively, Sarazin et al. proposed photochemical reaction of
carbohydrates in the detection window, induced by UV irradiation and leading to
malonaldehyde enolate (also named malondialdehyde, MDA) that is UV absorbing at
265-270 nm22. Later, Oliver et al.23, suggested that the photooxidation of the
saccharides, and thus their detection, could be enhanced by the application of the
electric filed. Schmid et al.24, 25 investigated in more details the occurring
photochemical reactions using CE-MS and HPLC-MS/MS. Experiments revealed
that the conversion reaction of carbohydrate to MDA is sensitive to the residence
time under the UV light since MDA can further degrade into non-UV absorbing
products24. Besides MDA, minor photooxidation reaction products, either with UV
absorbing (C4H6O2) or non-UV absorbing (gluconic acid) compounds could be
detected25. Photo-initiator Irgacure® 2959 added in the background electrolyte could
significantly increase sensitivity by 40% for mono- and disaccharides in CE-UV
method, providing LOD of 0.005 to 0.02 mM respectively26. This UV photooxidation
detection mode (UV-POD) has been applied to the analysis of mono- and
disaccharides in a variety of samples such as plant fibers in complex mixtures23,
forensics27, 28, pharmaceuticals and beverages27 and breakfast cereals29. Direct
photochemically induced UV-detection has also been applied for simultaneous

Page 5 / 33
analysis of underivatized cellodextrin oligomers up to degree of polymerization 7
(DP7) with similar LOD (~40 to 50 M)30. So far, the UV-photochemical approach
has not been yet reported for the analysis of longer polysaccharides.
Recently, Saetear et al. reported Taylor Dispersion Analysis (TDA) of non-UV
absorbing polysaccharides using backscattering interferometry detection (BSI),
which is a universal detector as defined by IUPAC (i.e. a detector that responds to
every component except the mobile phase) based on refractive index (RI)31. TDA is
a straightforward, simple and absolute method (no calibration), which only requires
the knowledge of the solvent viscosity and capillary radius, allowing the
determination of diffusion coefficient (or hydrodynamic radius Rh), relying on the
dispersion of a sample plug under laminar Poiseuille-like flow. TDA presents many
advantages: no stationary phase (no undesirable interactions), small injected
volumes (nL), no sample filtration, insensitivity to dust, and access to the mass-Rh
distribution. If BSI allows the detection of non-UV absorbing (macro)molecules, it
requires specific equipments with an optical breadboard, which are not provided with
commercial CE instrumentations. Moreover, TDA-BSI sensitivity of detection is
relatively low (LOD~50-80 mg/L in frontal mode31). To widen the applications of TDA
to non-UV absorbing polysaccharides (including starches), we investigated UV-POD
detection mode for TDA and we compared the results to those obtained using BSI.
Furthermore, TDA results were also compared to dynamic light scattering (DLS)
measurements performed in the same conditions as for the TDA experiments.
Advantages and disadvantages of BSI vs UV-POD, on the one hand, and TDA vs
DLS, on the other hand, are discussed.
2. Experimental
2.1 Materials and reagents

Page 6 / 33
Glucan compounds used in this work were mono-, di-, tetra- oligosaccharides
and -D-glucan polysaccharides. D-(+)-glucose monohydrate (C6H12O6·H2O) was
purchased from Alfa Aesar GmbH & Co KG, Germany (product no. A11090). D-(+)-
maltose monohydrate (C12H22O11·H2O) was purchased from Sigma Aldrich, Japan
(product no. 63418) and maltotetraose, Dp4 (C24H42O11) was purchased from
Supelco, USA (product no. 47877). All the polysaccharides studied in this work are
presented in Table 1.
Table 1. Presentation of the polysaccharides studied in this work.
Polysaccharide General chemical structure Polymer characteristics
Dextran
Branched polysaccharide (branching
degree~5%)
High dispersity (>>1)41, 50
Pullulan
Linear polysaccharide
Low dispersity (~1)41, 50
Glycogen
Branched polysaccharide with
densely packed branches
(branching degree~8-10%)
High dispersity (>>1)
Page 7 / 33
Starch Amylose
Amylopectin
Amylose: Quasi-linear
polysaccharide (25% in normal
maize starch)35
Amylopectin (75% in normal maize
starch): Branched polysaccharide
with arborescent branching structure
(branching degree~3.1-4.9%)13 High
dispersity (>>1)
Page 8 / 33
Dextran T500 and dextran T2000 were supplied by Amersham Pharmacia Biotech
(Uppsala, Sweden). Pullulan P400 and pullulan P800 were from Showa Denko K.K.
(Tokyo, Japan). Glycogen from oyster-Type II was from Sigma Chemical Company
(St Louis, MO). Phytoglycogen was extracted, as previously described by Rolland-
Sabaté et al32 from maize Sugary-1 provided by INRA (Plant Breeding Department,
Clermont-Ferrand, France). Normal maize starch (containing 25% amylose) was
from Roquette Frères (Lestrem, France) and amylose-free potato starch (containing
0% amylose) was from Lyckeby Stärkelsen Food & Fiber AB (Kristianstad,
Netherlands). Cassava amylopectin (containing 0% amylose) was extracted from
cassava starch by thymol complexation.
NaOH and KOH were from Merck (Germany). Ultra-pure water (18 M cm)
purified on a Milli-Q system from Millipore (Molsheim, France) was used to prepare
all solutions.
2.2 Samples and eluents
All polysaccharides were received in powder form. Sample solutions were
prepared by dissolving the appropriate amount in the appropriate eluents. For TDA-
UV-POD experiments,130 mM NaOH was used as eluent (to ensure photooxidation
under UV radiations at the detection point) for all polysaccharides that are soluble in
water (i.e., dextrans, pullulans and glycogens)32, 50, 53. Amylopectin and starch have a
poor solubility in water and in 130 mM NaOH at concentrations higher than 1g.L-1,
that is why they were dissolved in 1 M KOH for 72h at 4 C with mild stirring, and
then analyzed in the same eluent by TDA-UV-POD. This solubilization procedure is
known to be efficient for starch polysaccharides32. For TDA-BSI experiments, non-
starch polysaccharides (including dextrans, pullulans and glycogens) were dissolved

Page 9 / 33
in ultra-pure water since the presence of NaOH was not required for this mode of
detection. DLS was performed using the same eluent as for TDA (see Table 2).
Table 2. TDA conditions for analysis of polysaccharides using UV-POD and BSI.
Condition TDA-UV-POD TDA-BSI
CE apparatus and set detection
wavelength (nm)
Beckman Coulter,
214 and 266 nma
Beckman Coulter,
214
Capillary length (cm) 40 160
Inner diameter (i.d., m) 50 100
Outer diameter (o.d., m) 360 200
Detection window from the inlet (cm) 30 80.5 (BSI)
150 (UV)
Eluent 130 mM NaOHb
( = 0.998 10-3 Pas)
or 1 M KOHc
( = 1.048 10-3 Pas)
Water
( = 0.890 10-3 Pas)
Sample Polysaccharidesb
Amylopectin and starchc
Polysaccharides
Hydrodynamic injection 0.2 psi for 8 s (4.07 nL)
(Vi/Vd = 0.7 %)
0.3 psi for 20 s (71.3 nL)
(Vi/Vd = 1.1 %)
Mobilization pressure (psi) 0.1 0.4
Linear velocity (mm s-1) 0.19 0.6
Dilution Factor (for Rh = 10 and 100
nm, respectively)
3.5-11 13-42
aTwo wavelengths were compared in UV-POD to detect the products of photooxidation.
bTDA-UV-POD condition for glycogens, pullulans and dextrans
cTDA-UV-POD condition for amylopectin and starch
2.3 Taylor Dispersion Analysis
TDA was performed using a P/ACETM MDQ system (Beckman, USA). Bare
fused-silica capillaries were supplied from Polymicro technologies, USA. New
capillaries were conditioned with the following flushes: 1 M NaOH for 60 min; water
Page 10 / 33
for 60 min and eluent for 60 min. TDA experiments were carried out at 25 C. All
samples were prepared in the eluent. Instrumental setup for BSI interface with the
CE-UV equipment has been described in details elsewhere31. Experimental
conditions of TDA for two detection systems (UV-POD and BSI) are summarized in
Table 2.
TDA-UV-POD allows recording the taylorgram directly from the UV detector,
whereas TDA-BSI allows recording the taylorgrams in sequence by BSI and UV
detectors (for more detail on the setup, see ref. 31). For UV detection, the
absorbance detector was used and operated by Beckman Coulter's 32 Karat™
Software 8.0. For BSI detection, data was recorded and stored on a computer via
USB cable of the CCD array camera with an in-house software written using
LabVIEW 2015 (National Instruments, USA). The phase (signal from BSI) of the
recorded fringe pattern was extracted by using a Fourier-algorithm33, 34. In our BSI
configuration, the CCD camera orientation was upside-down. In other words, we
obtained negative going phase values for increasing RI signals. Therefore, to meet
with convention (increasing RI gives an increasing signal (phase value)), the
absolute value (raw signal multiplied by -1) of the phase shift were recorded. All data
obtained from BSI and UV were exported to Microsoft Excel for subsequent data
processing using Microcal Origin 6.0. The peak variance was determined by the
integration method described elsewhere35 to obtain the weight-average Rh.
Deconvolution of the signal by Constrained Regularized Linear Inversion (CRLI)36
were also applied to obtain the size distribution of the species in the sample. All
samples were analyzed at least 2 times and the average D (or Rh) values, as well as
the Rh distribution, were reported in Table 3.
Page 11 / 33
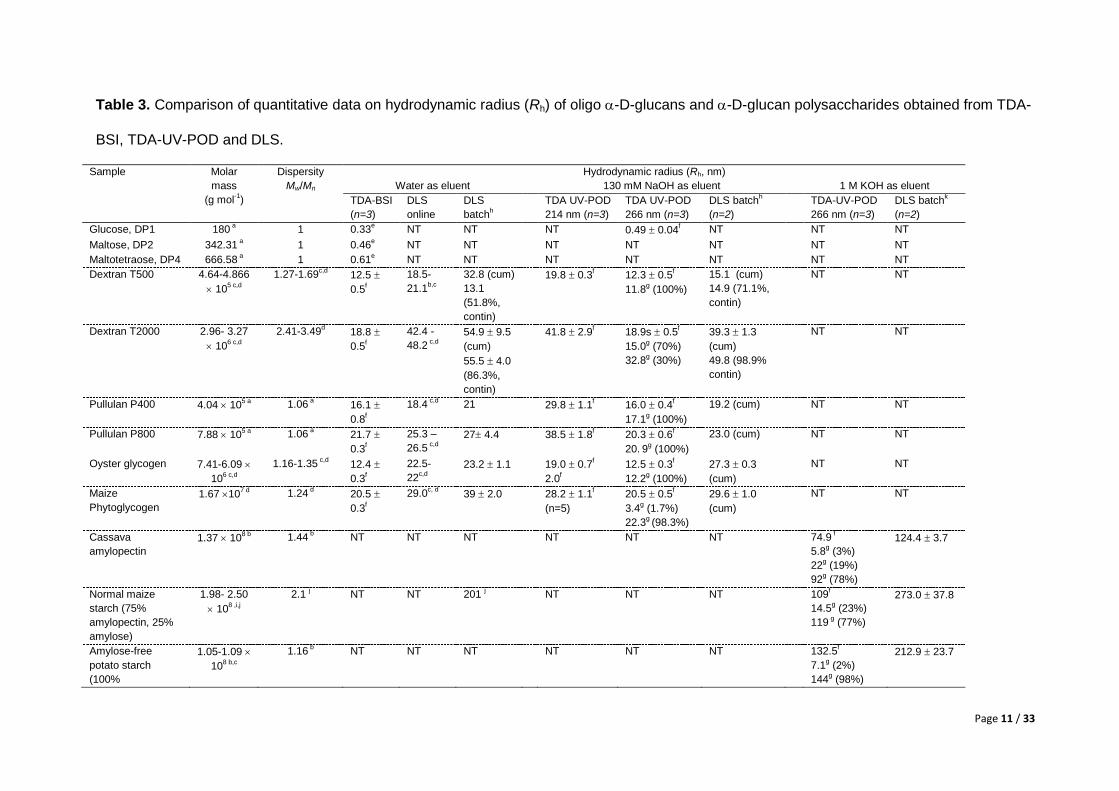
Table 3. Comparison of quantitative data on hydrodynamic radius (Rh) of oligo -D-glucans and -D-glucan polysaccharides obtained from TDA-
BSI, TDA-UV-POD and DLS.
Sample Molar
mass
(g mol-1)
Dispersity
Mw/Mn
Hydrodynamic radius (Rh, nm)
Water as eluent 130 mM NaOH as eluent 1 M KOH as eluent
TDA-BSI
(n=3)
DLS
online
DLS
batchh
TDA UV-POD
214 nm (n=3)
TDA UV-POD
266 nm (n=3)
DLS batchh
(n=2)
TDA-UV-POD
266 nm (n=3)
DLS batchk
(n=2)
Glucose, DP1 180
a 1 0.33
e NT NT NT 0.49 0.04
f NT NT NT
Maltose, DP2 342.31 a 1 0.46
e NT NT NT NT NT NT NT
Maltotetraose, DP4 666.58
a 1 0.61
e NT NT NT NT NT NT NT
Dextran T500 4.64-4.866
105 c,d
1.27-1.69c,d
12.5
0.5f
18.5-
21.1b,c
32.8 (cum)
13.1
(51.8%,
contin)
19.8 0.3f 12.3 0.5
f
11.8g (100%)
15.1 (cum)
14.9 (71.1%,
contin)
NT NT
Dextran T2000 2.96- 3.27
106 c,d
2.41-3.49d 18.8
0.5f
42.4 -
48.2 c,d
54.9 9.5
(cum)
55.5 4.0
(86.3%,
contin)
41.8 2.9f 18.9s 0.5
f
15.0g (70%)
32.8g (30%)
39.3 1.3
(cum)
49.8 (98.9%
contin)
NT NT
Pullulan P400 4.04 10
5 a 1.06
a 16.1
0.8f
18.4 c,d
21 29.8 1.1f 16.0 0.4
f
17.1g (100%)
19.2 (cum) NT NT
Pullulan P800 7.88 10
5 a 1.06
a 21.7
0.3f
25.3 –
26.5 c,d
27 4.4 38.5 1.8f 20.3 0.6
f
20. 9
g (100%)
23.0 (cum) NT NT
Oyster glycogen 7.41-6.09
106 c,d
1.16-1.35 c,d
12.4
0.3f
22.5-
22c,d
23.2 1.1 19.0 0.7f
2.0f
12.5 0.3f
12.2g (100%)
27.3 0.3
(cum)
NT NT
Maize
Phytoglycogen
1.67 107 d
1.24 d 20.5
0.3f
29.0c, d
39 2.0 28.2 1.1f
(n=5)
20.5 0.5f
3.4g (1.7%)
22.3g (98.3%)
29.6 1.0
(cum)
NT NT
Cassava
amylopectin
1.37 108 b
1.44 b NT NT NT NT NT NT 74.9
f
5.8g (3%)
22g (19%)
92g (78%)
124.4 3.7
Normal maize
starch (75%
amylopectin, 25%
amylose)
1.98- 2.50
108 ,i,j
2.1 j NT NT 201
j NT NT NT 109
f
14.5g (23%)
119 g (77%)
273.0 37.8
Amylose-free
potato starch
(100%
1.05-1.09
108 b,c
1.16 b NT NT NT NT NT NT 132.5
f
7.1g (2%)
144g (98%)
212.9 23.7
Page 12 / 33
amylopectin)
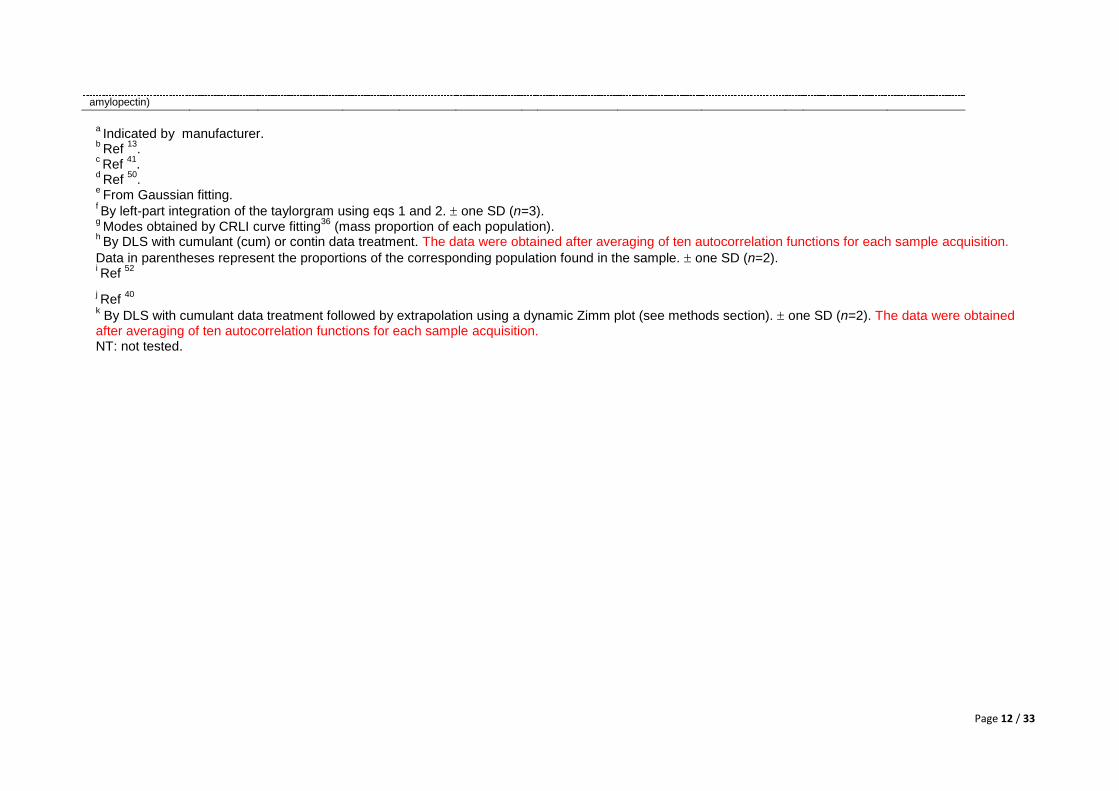
a Indicated by manufacturer.
b Ref
13.
c Ref
41.
d Ref
50.
e From Gaussian fitting.
f By left-part integration of the taylorgram using eqs 1 and 2. one SD (n=3).
g Modes obtained by CRLI curve fitting
36 (mass proportion of each population).
h By DLS with cumulant (cum) or contin data treatment. The data were obtained after averaging of ten autocorrelation functions for each sample acquisition.
Data in parentheses represent the proportions of the corresponding population found in the sample. one SD (n=2). i Ref
52
j Ref
40
k By DLS with cumulant data treatment followed by extrapolation using a dynamic Zimm plot (see methods section). one SD (n=2). The data were obtained
after averaging of ten autocorrelation functions for each sample acquisition. NT: not tested.

Page 13 / 33
2.4 Dynamic light scattering (DLS) operated in batch mode.
Experiments were made in the homodyne mode with full photon-counting
detection, using two phototubes in the pseudo-crosscorrelation configuration. The
incident radiation (in-vacuo wavelength = 532.5 nm) was obtained from a vertically
polarized frequency-doubled Nd-YAG laser diode. The experiments were performed
using a commercial set up (Amtec Goniometer and Brookhaven BI-9000AT
correlator). Measurements were performed at 25 °C, at five scattering angles in the
range 30° to 120° for starches and amylopectin at 0.5 g L-1 in 1 M KOH, and at 60°
and 90°for the other polysaccharides in water, and in 130 mM NaOH: at 2 g L-1 for
glycogens and pullulans, at 1 g L-1 for dextran T2000, and at 4 g L-1 for dextran T500.
For each sample acquisition, ten autocorrelation functions (acquisition duration: one
minute) were merged and subsequently submitted to data treatment.
The merged autocorrelation functions were processed using two different
methods: (i) the cumulant analysis37 and (ii) the CONTIN inversion routine38, 39, which
yields the distribution of relaxation times from the measured autocorrelation
functions.
The hydrodynamic radii values were directly calculated using the first-order
relaxation rate obtained from a 2nd order cumulant analysis, excepted for starches
and amylopectin for which a dynamic Zimm plot was constructed to extrapolate the
apparent diffusion coefficient Dapp = /q² to the zero-q limit, at a given concentration.
Here q = 4n/ sin(/2) is the magnitude of the scattering vector 40, n the solution
refractive index and the scattering angle. The angular extrapolation for the dynamic
Zimm plot was made using a second-order polynomial fit because of the important
curvature observed at high q values. Despite of the high qRg -range (where Rg is the
z-average radius of gyration) used in this study (1.4 to 6.6, calculated from the Rg
values reported by Rolland-Sabaté et al.,13, 41), it was possible to obtain

Page 14 / 33
hydrodynamic radii values for the starch samples by direct use of a dynamic Zimm
plot thanks to the high quality of this diagram (Figure S1 in Supplementary
Information).
3. Results and discussion
3.1. Choice of the wavelength and detection response in UV-POD
TDA-UV-POD was performed on a 50 µm × 40 cm fused silica capillary using
130 mM NaOH as mobile phase and in sample matrix (see Table 2 and experimental
section 2.3 for more details). Very low mobilization pressure (0.1 psi ≈ 7 mbar),
corresponding to a linear velocity of 0.19 mm s-1, was used to maximize the
response of the detector by increasing the amount of UV-absorbing species that are
produced in front of the UV detection window, in agreement with what was previously
observed for monosaccharides22. Figure 1 displays the UV taylorgrams obtained for
pullulan P400 (20 g L-1) at 214 nm (black trace) and at 266 nm (red trace).
Figure 1. Taylorgrams of pullulan P400 obtained by TDA-UV-POD at 214 nm (black trace)
and 266 nm (red and blue traces). The dip in the red curve was due to nonlinear response of
the photooxidation products, which disappeared by reducing the concentration (blue line,
preferred) or by changing the wavelength (black line). Experimental conditions: 50 µm × 40
cm (30 cm to the detector) fused silica capillary. Eluent: 130 mM NaOH. Injection: 0.5 psi,
4s. Mobilization pressure: 0.1 psi. Pullulan P400 sample: 20 g L-1 (black and red traces) and
Page 15 / 33
0.36 g L-1 (blue trace) in 130 mM NaOH. Other experimental conditions as described in
Table 2.
Clearly, the UV response was much higher at 266 nm compared to 214 nm, but the
signal at 266 nm displayed a dip at the peak apex, which was not observed at 214
nm. This peculiar behavior can be related to kinetics and nonlinear response effects
due to this specific detection mode involving complex photochemical reactions with
the formation of UV-absorbing intermediates (maximum of absorbance between 260
and 270 nm22-24). Decreasing the concentration of the injected sample to 0.36 g L-1
(blue trace) allowed to remove the dip seen at 266 nm, while keeping a sufficient
sensitivity to detect the polymer. At the same concentration, the signal was too weak
to be detected at 214 nm. Working at 266 nm is also preferable, since it allows for
the injection of more diluted, and thus, less viscous samples. The linearity of the UV
response was next investigated at both wavelengths for all analyzed solutes by
injecting a large sample plug, using the same mobilizing linear velocity (0.19 mm s-1).
Typical examples of recorded signals are provided in Figure S2. The corresponding
calibration curves are displayed in Figure 2 for glucose, pullulan P800, dextran
T2000 and amylose-free potato starch (all other samples are presented in Figure
S3).

Page 16 / 33
Figure 2. Signal response by POD for glucose, pullulan P800, dextran T2000 and amylose-
free potato starch, obtained at 214 and 266 nm by large plug injections. Better sensitivity
was obtained at 266 nm (blue trace) than at 214 nm (black trace), but the linear range was
relatively short. Inserts show the linear responses at 266 nm. Experimental conditions: 50
µm × 40 cm (30 cm to the detector) fused silica capillary. Eluent: 130 mM NaOH (except for
starch, 1M KOH). Injection: 1 psi, 60 s. Mobilization pressure: 0.1 psi (linear velocity, 0.19
mm/s). Sample at the indicated concentration in the eluent. Other experimental conditions as
described in Table 2.
On the investigated concentration range (typically, 0-5 g L-1), saturation of the
detection signal was always observed at 266 nm. However, the sensitivity of
detection was much higher at 266 nm than at 214 nm, for all the solutes. Moreover,
the linear calibration curves observed at 214 nm are not always passing through
zero (see e.g. Figures 2b and 2d). It is therefore preferable to work at 266 nm, but
the injected concentration should be carefully chosen to remain in the (relatively
short) linear response range. To set the injected concentration, it is important to
estimate the dilution factor (DF) between injection and detection points due to the
Taylor dispersion that are given by equations43 (1a) and (1b):
a. b.
c. d.
0 1 2 3 4 50
2
4
6
8
10
214 nm266 nm
[Glucose] (g L-1)
Ab
so
rba
nc
e (
mA
U)
0.0 0.5 1.0 1.5 2.0 2.50
2
4
6
214 nm266 nm
[Dextran T2000] (g L-1)
Ab
so
rba
nc
e (
mA
U)
0.0 0.5 1.0 1.5 2.00
1
2
214 nm266 nm
[Amylose-free potato starch] (g L-1)
Ab
so
rba
nc
e (
mA
U)
0 1 2 3 4 50
1
2
214 nm266 nm
[Pullulan P800] (g L-1)
Ab
so
rba
nc
e (
mA
U)
0.0 0.1 0.2 0.30.0
2.0
4.0
6.0
0.0 0.1 0.2 0.3 0.40.0
0.5
1.0
1.5
2.0
0.0 0.1 0.20.0
1.0
2.0
3.0
0.0 0.2 0.4 0.60.0
0.5
1.0
1.5

Page 17 / 33
2DF t
inj
Q
V
(1a)
2 3
0
DF2
c h
inj B
R l R
V k T t
(1b)
where Q is the flow rate, t is the temporal standard deviation of the elution profile
due to Taylor dispersion at a detection point placed at a distance l from the injection
point, Rc is the capillary radius, kb is the Boltzmann constant, T is the temperature (in
K), Vinj is the injected volume and t0 is the average elution time. Typical DF about 3.5
to 11 are obtained on the TDA-UV-POD set-up for solutes having a Rh of 10 and 100
nm, respectively. It is therefore advisable to set the sample concentration at the
value for which the UV response start to level off, so that the working concentration
at the detection point remains in the linear range, taking into account the DF.
Injected sample concentrations were chosen around 0.25-0.5 g L-1 for dextran,
pullulan and starch; and were one order of magnitude higher (~5 g L-1) for glycogen
samples.
3.2. Determination of the average hydrodynamic radius
Following the results obtained in the previous section, TDA-UV-POD was
performed on the polysaccharide samples tested in this work (see Table 1), by
monitoring the response at 266 nm, using injected concentrations between 0.25 g L-1
and 5 g L-1, depending on the calibration curve. As a matter of comparison, TDA-UV-
POD was also performed at 214 nm, using much higher injected concentrations (20
g L-1). All TDA-UV-POD analyses were performed in 130 mM NaOH eluent (except
for starch samples that are discussed later in the text). In a third independent series
of analyses, TDA-BSI was implemented using pure water as eluent with
polysaccharide concentration set at 20 g L-1. Due to different experimental
Page 18 / 33
requirements for TDA-UV-POD and TDA-BSI, the capillary dimensions, the eluent
and the mobilization pressure were different (see Table 2 for the comparison of the
experimental conditions). Example of taylorgrams obtained for these three series of
experiments, are given in Figures 3a and 3c for dextran T500 and Figures 3b and 3d
for oyster glycogen.
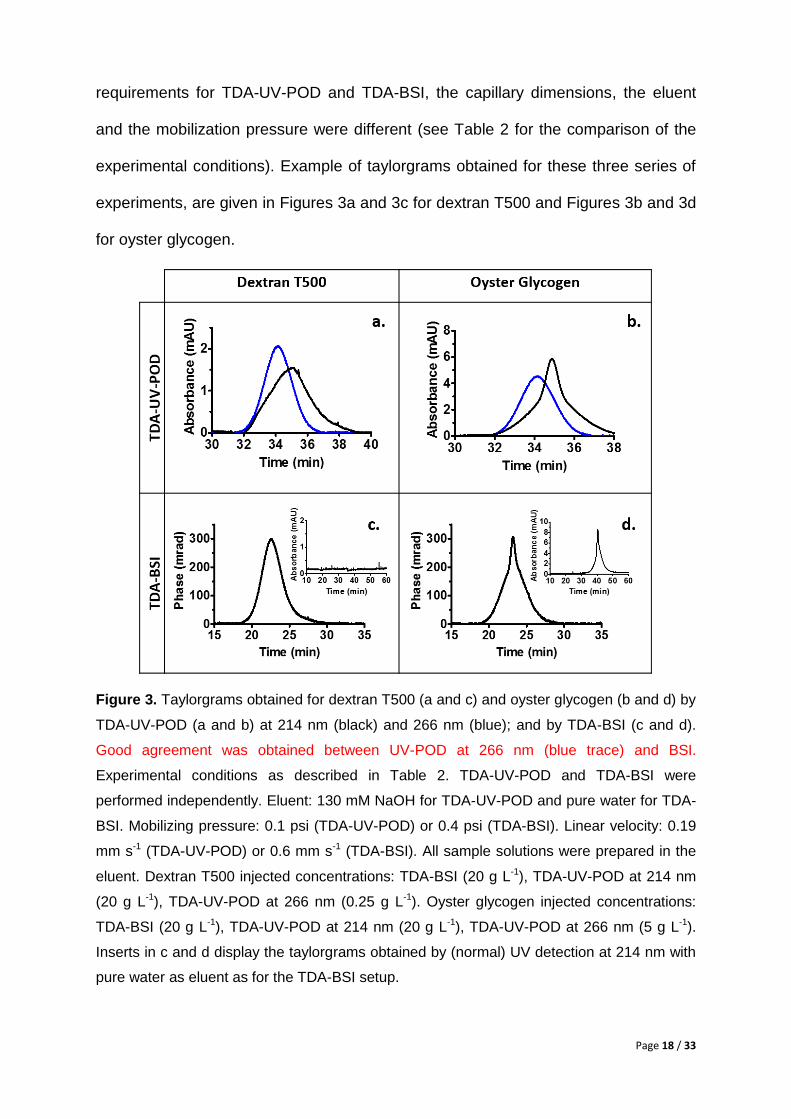
Figure 3. Taylorgrams obtained for dextran T500 (a and c) and oyster glycogen (b and d) by
TDA-UV-POD (a and b) at 214 nm (black) and 266 nm (blue); and by TDA-BSI (c and d).
Good agreement was obtained between UV-POD at 266 nm (blue trace) and BSI.
Experimental conditions as described in Table 2. TDA-UV-POD and TDA-BSI were
performed independently. Eluent: 130 mM NaOH for TDA-UV-POD and pure water for TDA-
BSI. Mobilizing pressure: 0.1 psi (TDA-UV-POD) or 0.4 psi (TDA-BSI). Linear velocity: 0.19
mm s-1 (TDA-UV-POD) or 0.6 mm s-1 (TDA-BSI). All sample solutions were prepared in the
eluent. Dextran T500 injected concentrations: TDA-BSI (20 g L-1), TDA-UV-POD at 214 nm
(20 g L-1), TDA-UV-POD at 266 nm (0.25 g L-1). Oyster glycogen injected concentrations:
TDA-BSI (20 g L-1), TDA-UV-POD at 214 nm (20 g L-1), TDA-UV-POD at 266 nm (5 g L-1).
Inserts in c and d display the taylorgrams obtained by (normal) UV detection at 214 nm with
pure water as eluent as for the TDA-BSI setup.

Page 19 / 33
Taylorgrams for the other polysaccharide samples (except starch samples) are
displayed in Figure S4 in supplementary data. If TDA-BSI was able to detect all the
polysaccharide samples, high injected concentrations were required to get sufficient
signal. This was mainly due to higher DF on the 100 µm i.d. capillary used with BSI
detection, leading to DF of 13 and 42 for solutes having a Rh of 10 and 100 nm,
respectively. As expected, for most of the polysaccharide samples, the UV trace
obtained in water at 214 nm during the TDA-BSI experiments did not give any
response (see e.g. insert in Figure 3c), which rationalizes the use of TDA-BSI or
TDA-UV-POD approaches. Only glycogen samples (oyster glycogen and
phytoglycogen shown in insets of Figures 3d and 3S-h, respectively) provide
detectable UV traces in pure water. This can be explained by the well-known
presence of proteins36 in these samples that are extracted either from oyster or
plants, and that are not pure (≥ 75% purity).
UV-POD and BSI traces were analyzed to get the average Rh by peak
integration of the left (rising) part of the elution profile using the following equations:
2
2
0
4 t Bh
c
k TR
R t
(2)
The temporal variance of the elution profile was calculated using eq. (2):35, 42
2
t
(3)
where h(t) is the detector response, ti is elution time for a given point i of the
taylorgram, and n and m are the starting and ending points that are considered for
the integration of the taylorgram. The integration of signal is performed on the left
part of the signal35 (t – t0 0) in order to avoid any bias on the Rh determination due
to possible adsorption of the solutes onto the capillary wall. For all measurements,

Page 20 / 33
the conditions of validity of TDA were fulfilled, with the numerical values of the
dimensionless residence time 1.25 ( = Dt0/Rc2) and the Péclet number Pe 40
(Pe = Rcu/D)43. Pe 40 ensures that the dispersion due to axial diffusion is negligible
compared to convection (Taylor dispersion). Quantitative data on average Rh values
obtained by TDA and DLS in the same conditions are given in Table 3 for all
samples (n=3 repetitions). The average values obtained by TDA-BSI in water were
very close to those obtained independently by TDA-UV-POD (266 nm) in 130 mM
NaOH, for the 6 non-starch polysaccharides (dextrans, pullulans and glycogens),
with typical Rh values between 10 and 20 nm. The average relative differences
between the two detection modes was about 2%. The repeatability (n=3) was also
very good for both detection modes, with average RSD below 3%. These data
demonstrate the robustness of TDA, whatever the detection mode. UV-POD (266
nm) should however be preferred since the injected concentration is lower (less
viscous injected samples), and the signal to noise ratio is higher (LOD significantly
lower). LOD obtained for TDA-UV-POD (266 nm) are in the order of 40 mg L-1 for
pullulans and dextrans (this work) versus 50-60 mg L-1 in TDA-BSI31. The polymer
size obtained by TDA will be compared to that retrieved from DLS when discussing
the full size distribution (see Section 3.3).
Numerical values obtained for the average Rh from TDA-UV-POD (214 nm)
experiments performed in 130 mM NaOH at high injected concentrations (about 20 g
L-1), were always higher (see Table 3) than those previously reported for TDA-BSI or
TDA-UV-POD (266 nm). This discrepancy cannot be explained by the high injected
concentration since TDA-BSI was performed at the same concentration and provided
accurate results. The reason is probably due to the poor linearity discussed in
section 3.1, with calibration curves that do not pass through the origin.

Page 21 / 33
As for the TDA experiments on starch samples, instead of 130 mM NaOH, 1M
KOH was used to dissolve the sample (72 h at 4 C with mild stirring, see
experimental section) and as mobile phase in the TDA experiments. In fact, the
solubility of starches is a crucial and complicated issue44. The use of 1 M KOH is a
good way to obtain full solubility, but low temperature (4 °C) conditions are important
to avoid any cleavage of the polymer chain by -elimination phenomenon at high pH.
Since KOH was required for the solubilization, it was readily suited for UV-POD
detection at 266 nm with injected concentration set at 0.45 g L-1. Taylorgrams are
displayed in Figure 4.
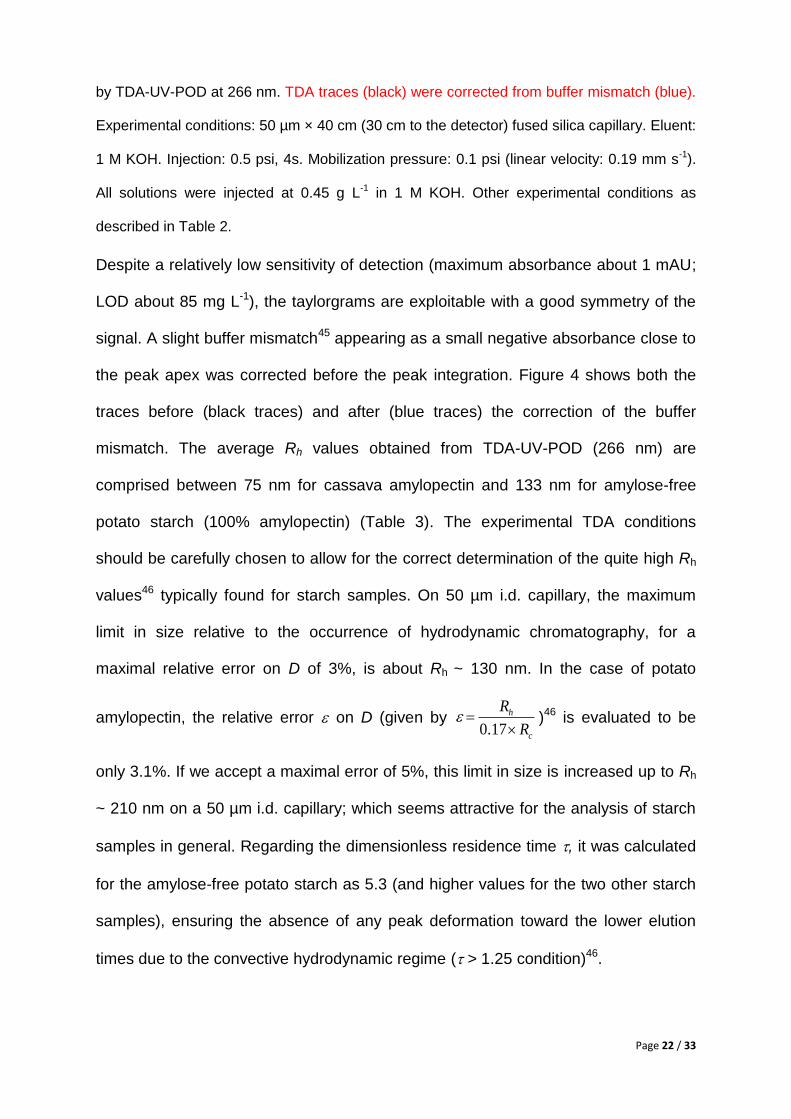
Figure 4. Taylorgrams of (a) Cassava amylopectin, (b) Normal maize starch (75%
amylopectin, 25% amylose) and (c) amylose free potato starch (100% amylopectin) obtained
Page 22 / 33
by TDA-UV-POD at 266 nm. TDA traces (black) were corrected from buffer mismatch (blue).
Experimental conditions: 50 µm × 40 cm (30 cm to the detector) fused silica capillary. Eluent:
1 M KOH. Injection: 0.5 psi, 4s. Mobilization pressure: 0.1 psi (linear velocity: 0.19 mm s-1).
All solutions were injected at 0.45 g L-1 in 1 M KOH. Other experimental conditions as
described in Table 2.
Despite a relatively low sensitivity of detection (maximum absorbance about 1 mAU;
LOD about 85 mg L-1), the taylorgrams are exploitable with a good symmetry of the
signal. A slight buffer mismatch45 appearing as a small negative absorbance close to
the peak apex was corrected before the peak integration. Figure 4 shows both the
traces before (black traces) and after (blue traces) the correction of the buffer
mismatch. The average Rh values obtained from TDA-UV-POD (266 nm) are
comprised between 75 nm for cassava amylopectin and 133 nm for amylose-free
potato starch (100% amylopectin) (Table 3). The experimental TDA conditions
should be carefully chosen to allow for the correct determination of the quite high Rh
values46 typically found for starch samples. On 50 µm i.d. capillary, the maximum
limit in size relative to the occurrence of hydrodynamic chromatography, for a
maximal relative error on D of 3%, is about Rh ~ 130 nm. In the case of potato
amylopectin, the relative error on D (given by 0.17
h
c
R
R
)46 is evaluated to be
only 3.1%. If we accept a maximal error of 5%, this limit in size is increased up to Rh
~ 210 nm on a 50 µm i.d. capillary; which seems attractive for the analysis of starch
samples in general. Regarding the dimensionless residence time , it was calculated
for the amylose-free potato starch as 5.3 (and higher values for the two other starch
samples), ensuring the absence of any peak deformation toward the lower elution
times due to the convective hydrodynamic regime ( > 1.25 condition)46.

Page 23 / 33
Regarding the comparison between TDA and DLS in batch mode, the
average Rh obtained by TDA was always lower than that obtained by DLS for all the
samples. This is well known and well understood42, 47 since for mass sensitive
detector such as RI-based detector (BSI) or UV-POD, TDA leads to the weight-
average Rh value (Rh,TDA) while DLS provides harmonic z-average Rh values (Rh,DLS):
i i h,ii
h,TDA i ii
N M R
RN M
(4a)
2i i
ih, DLS 2
i i
h,ii
N M
RN M
R
(4b)
where Ni is the number of moles species having a hydrodynamic Rh,i and a molar
mass Mi. The harmonic z-average value weights more the largest analytes/polymers
than the weight-average value. Accordingly, the wider the size distribution, the higher
the discrepancy between the TDA and DLS values of Rh. Sometimes, the Rh,DLS /
Rh,TDA ratio (noted PDI hereafter) is given as an estimator of the size dispersity, as
recently reported for the sizing of polydisperse microemulsions48, 49. For instance, the
PDI was much higher for dextran T2000 (PDI=2.16) than for pullulans (PDI between
1.1 and 1.2) which is in good agreement with the known lower dispersity in molar
mass and size for these pullulans as compared to dextrans (Table 3 and ref.41, 50).
Moreover, glycogens exhibit also a high dispersity in molar mass and in size with
PDI between 1.4 (phytoglycogen) and 2.1 (oyster glycogen). As for starch samples,
PDI are even higher (between 1.6 and 2.7), due to the great heterogeneity of the
samples. The higher value of PDI (2.7) obtained for normal maize starch was
expected, as this sample, in contrast to the two other starches that contain only
amylopectin, is constituted by a mixture of two macromolecules: amylose (25%) and

Page 24 / 33
amylopectin (75%), leading to a very high molar mass dispersity but also structural
dispersity (linear vs branched polymer).
3.3. Determination of the hydrodynamic radius distribution by deconvolution
of the taylorgrams
To obtain more information about the Rh distribution, deconvolutions of the
taylorgrams by Constrained Regularized Linear Inversion (CRLI)36 were also applied
to obtain the entire size distribution of the polysaccharides. These distributions are
presented in Figure 5 for all the samples (except pullulans which have a low
dispersity). Rh distributions of dextrans and glycogens are displayed in Figure 5a,
while distributions of starch samples are presented in Figure 5b. Clearly, starch
samples present bimodal (even trimodal for cassava amylopectin) distributions with a
major mode around 100 nm and one or two other modes around 6 and 20 nm.
Among the non-starch polysaccharides, dextran T2000 appeared as the most
polydispersed polysaccharide with two modes at 10-20 nm and 30-40 nm.
a.
b.
d.
c.

Page 25 / 33
Figure 5. Hydrodynamic radius (Rh) distributions obtained by CRLI with TDA-UV-POD at
266 nm (a, b) and by DLS operated in batch mode (c, d) for dextrans and glycogens (a, c)
and starches (b, d). Broader distributions shifted toward larger sizes were obtained by DLS
compared to TDA. Experimental conditions as in Figures 3 and 4. DLS distributions
represented here were obtained by a CONTIN analysis of data measured at 60° for T500
and at 90° for the other polysaccharides.
Rh distributions obtained by DLS in batch mode are presented in Figures 5c
and 5d. While it is instructive to compare the TDA and DLS data, the specificities of
each method should be kept in mind. TDA provides a mass-weighted distribution of
the hydrodynamic radius. The interpretation of the DLS signal is less straightforward.
The PDF obtained through the CONTIN analysis yields the distribution of the
hydrodynamic radii weighted by the scattering intensity associated to each size. For
small objects, such that Rh q < 1, the scattered intensity is proportional to the
squared mass of the object, regardless of its structure51. For the data shown in
Figures 5c and 5d, this regime corresponds to Rh ≤ 40 nm. In the opposite limit Rh ≥
40 nm, the scattered intensity depends in a non-trivial way both on the (squared)
mass of the object and on its size and structure. Most of the data of Figure 5
encompass both regimes. It is therefore impossible to convert quantitatively the
intensity-weighted PDF of Rh obtained by DLS to a mass-weighted, or even a
squared-mass-weighted PDF to be directly compared to the TDA distribution.
However, one can safely state that the DLS PDF weights more the larger objects as
compared to the TDA data.

Page 26 / 33
For all the samples studied here we find that the Rh distributions obtained by
TDA are clearly narrower than those obtained by DLS. For Dextran T500 and the
two glycogens (Figure 5a), TDA provides monomodal distributions in agreement with
the refractive index traces obtained by HPSEC and/or Asymmetrical Flow Field-Flow
Fractionation (AF4) in water50,53. Dextran T2000 sample exhibits a bimodal
distribution in TDA which reflects its particularly high dispersity in size (PDI=2.16)
and in molar mass (Mw/Mn= 2.41-3.49)41, 50, observed in HPSEC as a broad mode
with three maxima50 and as a broad mode with a shoulder toward larger sizes in AF4.
The maxima of the size distributions exhibit a significant shift toward lower values for
TDA as compared to DLS (as already observed for the average Rh values).
Concerning the differences between the distributions obtained by batch DLS and
TDA, we note that aggregation may play a significant role, in addition to the fact that
these methods intrinsically provide Rh distributions weighted in a different way.
Indeed, DLS data are obtained from samples that are more concentrated by a factor
of 10 than for TDA (1-4 g L-1 in DLS and 0.35/DF~0.1 g L-1 in TDA-UV-POD), and
hence more prone to aggregation.
Concerning the starch samples of Figures 5b, 5d, the Rh distributions obtained
by both TDA and DLS exhibit polymodal distributions or broad distribution with a
shoulder (Figure 5d) for cassava amylopectin. However, the shape of the
distributions is quite different. Distributions obtained by DLS in batch mode are
significantly broader and their maxima shifted to higher values of Rh, as compared to
those issued from TDA (compare panels b and d of Figure 5). The greatest
difference is seen for normal maize starch, whose PDF as retrieved by DLS contains
the largest species of all starch-based samples. This is in contrast with the TDA
data, for which amylose-free potato starch contains the largest objects. The

Page 27 / 33
discrepancy between TDA and batch DLS data could stem from the large dispersity
in size, molar mass and structure of the starch molecules, in particular for normal
maize, which is a mixture of amylose and amylopectin13, 35. The differences between
the TDA and DLS distributions are also likely due to the presence of aggregates.
Due to their large size and small number, aggregates do not contribute significantly
to the TDA signal, while they are detected by DLS. In addition, the aggregation
phenomenon is particularly relevant for starches as the huge aggregates present in
small proportion in starch solutions (Rh larger than 300 nm) may influence
significantly the outcome of the analysis of DLS data. Furthermore, it is known that
aggregation is enhanced in the batch mode (as in our DLS experiments), as
compared to in-flow measurements. Indeed, using a combination of AF4, MALS
and/or online DLS13, 35 previous studies found results closer to the TDA distributions
reported here. In particular, in references13, 41, it was found that the Rh distribution for
normal maize starch was bimodal with a population of small objects (Rh = 6-20 nm)
corresponding to amylose and another with Rh =70-300 nm corresponding to
amylopectin in agreement with TDA measurements. For amylose-free potato starch
and cassava amylopectin, monomodal Rh distributions ranging from 70 nm to 300
nm were obtained.
3.4. Sensitivity of detection in TDA-BSI and TDA-UV-POD
The (mass) sensitivity of detection of TDA-BSI and TDA-UV-POD (266 nm)
were plotted against the molar mass of the sample in Figure 6. Sensitivity (in y-axis)
was calculated from the front height (obtained by TDA in frontal mode) divided by the
injected mass concentration of the sample. Higher molar mass (or higher degree of
polymerization) leads to lower sensitivity for both TDA-UV-POD and TDA-BSI. In the

Page 28 / 33
case of BSI detection, the refractive index increment with the concentration is the
main parameter that controls the sensitivity of detection; while for UV-POD the yields
and kinetics of the photochemical reactions leading to the UV-absorbing species are
the key parameters. Despite quite low sensitivity at high molar mass, we
demonstrate in this work that the Rh distribution and average value can be derived
from both detection modes, although UV-POD leads to lower LOD.
Figure 6. Detection sensitivity obtained by TDA-BSI (a) ( mradL g-1) and by TDA-UV-POD
at 266 nm (b) (, mAUL g-1) vs the molar mass of (poly)saccharides and starches. The
(mass) sensitivity of detection of BSI and UV-POD detection modes decreased with the
molar mass of the solute. Experimental conditions as in Table 2 using frontal injection of the
sample.
4. Conclusions
In this work, we present the application to size characterization of
polysaccharides and starches by batch DLS and TDA coupled with two different
detection modes: backscattering interferometry (BSI) and UV-photooxidation

Page 29 / 33
detection (UV-POD). TDA-BSI employed water as eluent to perform the detection of
all polysaccharide samples without any chemical treatment. TDA-UV-POD used
strong alkaline eluents (130 mM NaOH or 1 M KOH for starches) to dissolve the
polysaccharides/starches and to ensure the photochemical reaction. Hydrodynamic
radius values obtained by TDA-BSI were in excellent agreement with those obtained
by TDA-UV-POD (266 nm), provided that the injected concentration for UV-POD
(266 nm) is carefully selected to remain in the linearity detection range. TDA results
were compared to batch DLS performed in the same conditions. Overall, TDA and
DLS are complementary techniques providing useful information on sample
polydispersity. The present results also confirm that TDA analysis is less sensitive to
aggregates than DLS measurements in batch mode54-55.
Acknowledgements
P.S. is thankful for the research project supported by Mahidol University (New
Researcher grant: A9/2561).
Supporting Information
- Dynamic Zimm plots obtained for Cassava amylopectin, Normal maize starch and
Amylose-free potato starch
- Taylorgrams obtained for glucose monohydrate and pullulan P400 by UV-POD
using large plug injections
- Linearity and signal response of polysaccharides and starch obtained from TDA-
UV-POD in frontal mode at 214 and 266 nm
- Taylorgrams of dextran T2000, pullulan P400, pullulan P800 and phytoglycogen
obtained by TDA-UV-POD at 266 nm and TDA-BSI
Page 30 / 33
References
1. Ju, H.; Zhang, X.; Wang, J., Carbohydrate Detection Using Nanostructured Biosensing. In NanoBiosensing: Principles, Development and Application, Springer New York: New York, NY, 2011; pp 393-424. 2. Gortatowsky, C., Sugar and Other Carbohydrates in Carbonated Beverages. In Use of Sugars and Other Carbohydrates in Food Industry, American Chemical Society: 1955; Vol. 12, pp 70-74. 3. Schoch, T. J.; Elder, A. L., Starches in the Food Industry. In Use of Sugars and Other Carbohydrates in Food Industry, American Chemical Society: 1955; Vol. 12, pp 21-34. 4. Burd, A.; Huang, L., Chapter 11 - Carbohydrates and Cutaneous Wound Healing A2 - Garg, Hari G. In Carbohydrate Chemistry, Biology and Medical Applications, Cowman, M. K., Hales, C. A., Eds. Elsevier: Oxford, 2008; pp 253-274. 5. Avila, L. Z.; Gianolio, D. A.; Konowicz, P. A.; Philbrook, M.; Santos, M. R.; Miller, R. J., Chapter 15 - Drug Delivery and Medical Applications of Chemically Modified Hyaluronan A2 - Garg, Hari G. In Carbohydrate Chemistry, Biology and Medical Applications, Cowman, M. K., Hales, C. A., Eds. Elsevier: Oxford, 2008; pp 333-357. 6. Striegel, A. M.; Isenberg, S. L.; Côté, G. L. An SEC/MALS study of alternan degradation during size-exclusion chromatographic analysis. Anal. Bioanal. Chem. 2009, 394 (7), 1887-1893. 7. Gaborieau, M.; Gilbert, R. G.; Gray-Weale, A.; Hernandez, J. M.; Castignolles, P. Theory of Multiple-Detection Size-Exclusion Chromatography of Complex Branched Polymers. Macromol. Theory Simul. 2007, 16 (1), 13-28. 8. Gaborieau, M.; Nicolas, J.; Save, M.; Charleux, B.; Vairon, J.-P.; Gilbert, R. G.; Castignolles, P. Separation of complex branched polymers by size-exclusion chromatography probed with multiple detection. J. Chromatogr. A 2008, 1190 (1), 215-223. 9. Rolland-Sabaté, A., High-Performance Size-Exclusion Chromatography coupled with on-line Multi-angle Laser Light Scattering (HPSEC-MALLS). Bentham Science Publishers: 2017; p 92-136 (45). 10. Rolland-Sabaté, A., Battu, S., Bonfils, F., Chelbi, K., Martin, M., Field-Flow Fractionation (FFF). In Advances in Physicochemical Properties of Biopolymers (Part 1), Bentham Science Publishers: 2017. 11. Giddings, J. C. A New Separation Concept Based on a Coupling of Concentration and Flow Nonuniformities. Sep Sci Technol 1966, 1 (1), 123-125. 12. Messaud, F. A.; Sanderson, R. D.; Runyon, J. R.; Otte, T.; Pasch, H.; Williams, S. K. R. An overview on field-flow fractionation techniques and their applications in the separation and characterization of polymers. Prog Polym Sci 2009, 34 (4), 351-368. 13. Rolland-Sabaté, A.; Colonna, P.; Mendez-Montealvo, M. G.; Planchot, V. Branching Features of Amylopectins and Glycogen Determined by Asymmetrical Flow Field Flow Fractionation Coupled with Multiangle Laser Light Scattering. Biomacromolecules 2007, 8 (8), 2520-2532. 14. Yohannes, G.; Jussila, M.; Hartonen, K.; Riekkola, M. L. Asymmetrical flow field-flow fractionation technique for separation and characterization of biopolymers and bioparticles. J. Chromatogr. A 2011, 1218 (27), 4104-4116. 15. Otte, T.; Pasch, H.; Macko, T.; Brüll, R.; Stadler, F. J.; Kaschta, J.; Becker, F.; Buback, M. Characterization of branched ultrahigh molar mass polymers by asymmetrical flow field-flow fractionation and size exclusion chromatography. J. Chromatogr. A 2011, 1218 (27), 4257-4267. 16. Leeman, M. S., Matilda Ulmius; Nilsson, Lars. Practical Applications of Asymmetrical Flow Field-Flow Fractionation (AF4): A Review. LCGC Europe 2015, 28 (12), 10. 17. Renard, M. A. M. D., Advances in Physicochemical Properties of Biopolymers. Bentham Science Publishers: 2017; p 46. 18. Renard, M. A. M. D., Advances in Physicochemical Properties of Biopolymers. Bentham Science Publishers: 2017; p 49. 19. Volpi, N.; Maccari, F.; Linhardt, R. J. Capillary electrophoresis of complex natural polysaccharides. Electrophoresis 2008, 29 (15), 3095-3106.

Page 31 / 33
20. Rovio, S.; Yli-Kauhaluoma, J.; Siren, H. Determination of neutral carbohydrates by CZE with direct UV detection. Electrophoresis 2007, 28 (17), 3129-3135. 21. Rovio, S.; Simolin, H.; Koljonen, K.; Siren, H. Determination of monosaccharide composition in plant fiber materials by capillary zone electrophoresis. J. Chromatogr. A 2008, 1185 (1), 139-144. 22. Sarazin, C.; Delaunay, N.; Costanza, C.; Eudes, V.; Mallet, J.-M.; Gareil, P. New Avenue for Mid-UV-Range Detection of Underivatized Carbohydrates and Amino Acids in Capillary Electrophoresis. Anal. Chem. 2011, 83 (19), 7381-7387. 23. Oliver, J. D.; Gaborieau, M.; Hilder, E. F.; Castignolles, P. Simple and robust determination of monosaccharides in plant fibers in complex mixtures by capillary electrophoresis and high performance liquid chromatography. J. Chromatogr. A 2013, 1291, 179-186. 24. Schmid, T.; Himmelsbach, M.; Oliver, J. D.; Gaborieau, M.; Castignolles, P.; Buchberger, W. Investigation of photochemical reactions of saccharides during direct ultraviolet absorbance detection in capillary electrophoresis. J. Chromatogr. A 2015, 1388, 259-266. 25. Schmid, T.; Himmelsbach, M.; Buchberger, W. W. Investigation of photochemical reaction products of glucose formed during direct UV detection in CE. Electrophoresis 2016, 37 (7-8), 947-953. 26. Oliver, J. D.; Rosser, A. A.; Fellows, C. M.; Guillaneuf, Y.; Clement, J.-L.; Gaborieau, M.; Castignolles, P. Understanding and improving direct UV detection of monosaccharides and disaccharides in free solution capillary electrophoresis. Anal. Chim. Acta 2014, 809, 183-193. 27. Sarazin, C.; Delaunay, N.; Costanza, C.; Eudes, V.; Gareil, P. Application of a new capillary electrophoretic method for the determination of carbohydrates in forensic, pharmaceutical, and beverage samples. Talanta 2012, 99, 202-206. 28. Sarazin, C.; Delaunay, N.; Costanza, C.; Eudes, V.; Gareil, P. On the use of capillary electrophoresis for the determination of inorganic anions and cations, and carbohydrates in residues collected after a simulated suicide bombing attack. Talanta 2013, 103, 301-305. 29. Toutounji, M. R.; Van Leeuwen, M. P.; Oliver, J. D.; Shrestha, A. K.; Castignolles, P.; Gaborieau, M. Quantification of sugars in breakfast cereals using capillary electrophoresis. Carbohydr. Res. 2015, 408, 134-141. 30. Alinat, E.; Jemmali, S.; Delaunay, N.; Archer, X.; Gareil, P. Analysis of underivatized cellodextrin oligosaccharides by capillary electrophoresis with direct photochemically induced UV-detection. Electrophoresis 2015, 36 (14), 1555-1563. 31. Phoonthawee Saetear, J. C., Michael N. Kammer, Thomas J. Manuel, Jean-Philippe Biron, Darryl J. Bornhop, Hervé Cottet, Taylor Dispersion Analysis of polysaccharides using backscattering interferometry. Anal. Chem. 2017, 89, 6710-6718. 32. Rolland-Sabaté, A.; Colonna, P.; Potocki-Véronèse, G.; Monsan, P.; Planchot, V. Elongation and insolubilisation of α-glucans by the action of Neisseria polysaccharea amylosucrase. J Cereal Sci 2004, 40 (1), 17-30. 33. Bornhop, D. J.; Latham, J. C.; Kussrow, A.; Markov, D. A.; Jones, R. D.; Sørensen, H. S. Free-Solution, Label-Free Molecular Interactions Studied by Back-Scattering Interferometry. Science 2007, 317 (5845), 1732-1736. 34. Bornhop, D. J.; Kammer, M. N.; Kussrow, A.; Flowers, R. A.; Meiler, J. Origin and prediction of free-solution interaction studies performed label-free. Proc. Natl. Acad. Sci. U.S.A. 2016, 113 (12), E1595-E1604. 35. Chamieh, J.; Cottet, H. Comparison of single and double detection points Taylor Dispersion Analysis for monodisperse and polydisperse samples. J. Chromatogr. A 2012, 1241, 123-127. 36. Cipelletti, L.; Biron, J.-P.; Martin, M.; Cottet, H. Measuring Arbitrary Diffusion Coefficient Distributions of Nano-Objects by Taylor Dispersion Analysis. Anal. Chem. 2015, 87 (16), 8489-8496. 37. Koppel, D. E. Analysis of Macromolecular Polydispersity in Intensity Correlation Spectroscopy: The Method of Cumulants. J. Chem. Phys.1972, 57 (11), 4814-4820. 38. CONTIN package. http://s-provencher.com/pub/contin/ 39. Provencher, S. W. A constrained regularization method for inverting data represented by linear algebraic or integral equations. Comput. Phys. Commun. 1982, 27 (3), 213-227.

Page 32 / 33
40. Roger, P.; Bello-Perez, L. A.; Colonna, P. Contribution of amylose and amylopectin to the light scattering behaviour of starches in aqueous solution. Polymer 1999, 40 (25), 6897-6909. 41. Rolland-Sabaté, A.; Guilois, S.; Jaillais, B.; Colonna, P. Molecular size and mass distributions of native starches using complementary separation methods: Asymmetrical Flow Field Flow Fractionation (A4F) and Hydrodynamic and Size Exclusion Chromatography (HDC-SEC). Anal. Bioanal. Chem. 2011, 399 (4), 1493-1505. 42. Cottet, H.; Biron, J.-P.; Martin, M. Taylor Dispersion Analysis of Mixtures. Anal. Chem. 2007, 79 (23), 9066-9073. 43. Cottet, H.; Biron, J.-P.; Martin, M. On the optimization of operating conditions for Taylor dispersion analysis of mixtures. Analyst 2014, 139 (14), 3552-3562. 44. Gidley, M. J.; Hanashiro, I.; Hani, N. M.; Hill, S. E.; Huber, A.; Jane, J.-L.; Liu, Q.; Morris, G. A.; Rolland-Sabaté, A.; Striegel, A. M.; Gilbert, R. G. Reliable measurements of the size distributions of starch molecules in solution: Current dilemmas and recommendations. Carbohydr. Polym. 2010, 79 (2), 255-261. 45. Latunde-Dada, S.; Bott, R.; Hampton, K.; Patel, J.; Leszczyszyn, O. I. Methodologies for the Taylor dispersion analysis for mixtures, aggregates and the mitigation of buffer mismatch effects. Anal. Methods 2015, 7 (24), 10312-10321. 46. Chamieh, J.; Leclercq, L.; Martin, M.; Slaoui, S.; Jensen, H.; Østergaard, J.; Cottet, H. Limits in Size of Taylor Dispersion Analysis: Representation of the Different Hydrodynamic Regimes and Application to the Size-Characterization of Cubosomes. Anal. Chem. 2017, 89 (24), 13487-13493. 47. Cottet, H.; Martin, M.; Papillaud, A.; Souaïd, E.; Collet, H.; Commeyras, A. Determination of Dendrigraft Poly-l-Lysine Diffusion Coefficients by Taylor Dispersion Analysis. Biomacromolecules 2007, 8 (10), 3235-3243. 48. Chamieh, J.; Jannin, V.; Demarne, F.; Cottet, H. Hydrodynamic size characterization of a self-emulsifying lipid pharmaceutical excipient by Taylor dispersion analysis with fluorescent detection. Int. J. Pharm. 2016, 513 (1), 262-269. 49. Chamieh, J.; Davanier, F.; Jannin, V.; Demarne, F.; Cottet, H. Size characterization of commercial micelles and microemulsions by Taylor dispersion analysis. Int. J. Pharm. 2015, 492 (1), 46-54. 50. Rolland-Sabaté, A.; Mendez-Montealvo, M. G.; Colonna, P.; Planchot, V. Online Determination of Structural Properties and Observation of Deviations from Power Law Behavior. Biomacromolecules 2008, 9 (7), 1719-1730. 51. Kerker, M., In The Scattering of Light and Other Electromagnetic Radiation. Academic Press: 1969. 52. Decaen, P.; Rolland-Sabaté, A.; Guilois, S.; Jury, V.; Allanic, N.; Colomines, G.; Lourdin, D.; Leroy, E. Choline chloride vs choline ionic liquids for starch thermoplasticization. Carbohydr. Polym. 2017, 177, 424-432. 53. Rolland-Sabaté, A.; Guilois, S.; Grimaud, F.; Lancelon-Pin, C.; Roussel, X.; Laguerre, S. ; Viksø-Nielsen, A. ; Putaux, J.-L.; D'Hulst, C.; Potocki-Véronèse, G. ; Buléon, A. Characterization of hyperbranched glycopolymers produced in vitro using enzymes. Anal. Bioanal. Chem. 2014, 406, 1607-1618. 54. Hawe, A.; Hulse, W. L.; Jiskoot, W.; Forbes, R. T. Taylor Dispersion Analysis Compared to Dynamic Light Scattering for the Size Analysis of Therapeutic Peptides and Proteins and Their Aggregates. Pharm. Res. 2011, 28, 2302-2310. 55. Cottet, H.; Martin, M.; Papillaud, A.; Souaïd, E.; Collet, H.; Commeyras, A. Determination of Dendrigraft Poly-l-Lysine Diffusion Coefficients by Taylor Dispersion Analysis. Biomacromolecules 2007, 8, 3235-3243.
For TOC only:

Page 33 / 33