Embed Size (px)
Citation preview

Slide 1Lesson 76
Graphing with Rates
Chapter 14
Lesson 76
RR.7 Understand that multiplication by rates and ratios can be used to transform an input into an output. Find the third when given two of the following: the input, the rate or ratio, the output.
EE.18 Find solutions to linear equations with two variables.
CP.1 Identify and plot ordered pairs on the coordinate plane.

Slide 2Lesson 76
Chapter 14
Lesson 76
CP.3 Represent proportional relationships on the coordinate plane as straight lines that pass through the origin.
CP.5 Know that the graph of an equation is the set of all points which are solutions to the equation.
CP.2 Plot solutions to linear equations on the coordinate plane.
CP.14 Graph linear equations.
Graphing with Rates

Slide 3Lesson 76
Objectives
• Plot the value of quantities whose ratios are always the same. Fit a line to the plot.
• Know and understand that a graph of an equation is a collection of all the points (order pairs) that represent solutions to the equation.
• Graph linear equations that pass through the origin on the coordinate plane.

Slide 4Lesson 76
Remember from Before
• How do you plot points to represent an input and an output?
• How do you use a table to organize solutions to an equation?

Slide 5Lesson 76
Get Your Brain in Gear
1. Find 4 solutions to each equation.

Slide 6Lesson 76
1 pineapple costs $2. To turn dollars into pineapples, we multiply by the following rate:
An input of 2 dollars results in an output of 1 pineapple:
How is an input of $2 and an output of 1 pineapple represented on the coordinate plane?
Slide 7Lesson 76
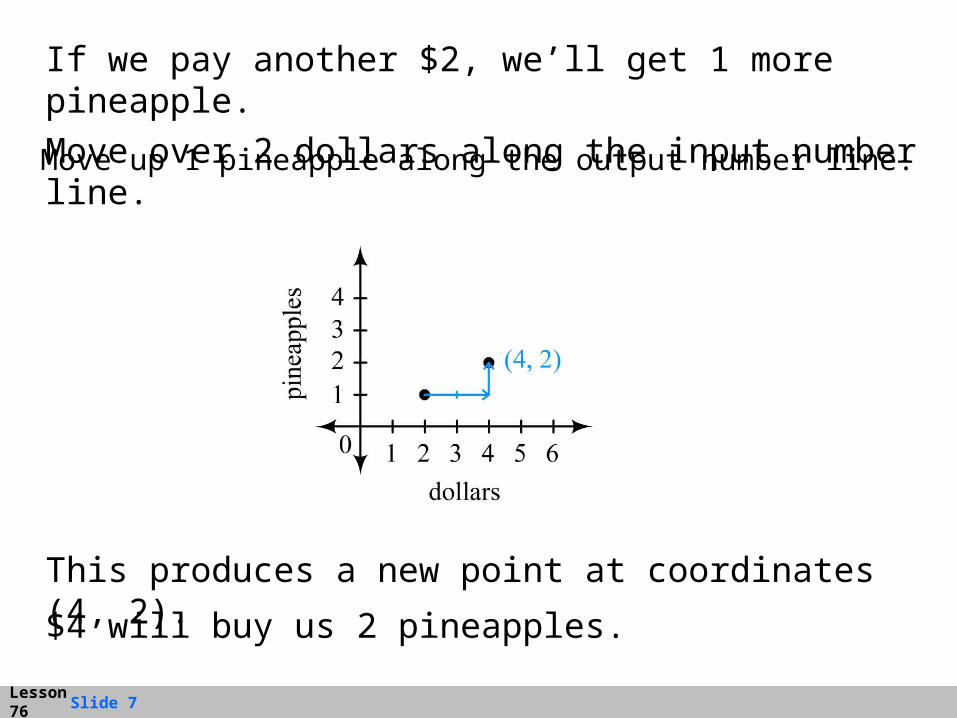
Move up 1 pineapple along the output number line.
If we pay another $2, we’ll get 1 more pineapple.
Move over 2 dollars along the input number line.
This produces a new point at coordinates (4, 2).
$4 will buy us 2 pineapples.
Slide 8Lesson 76
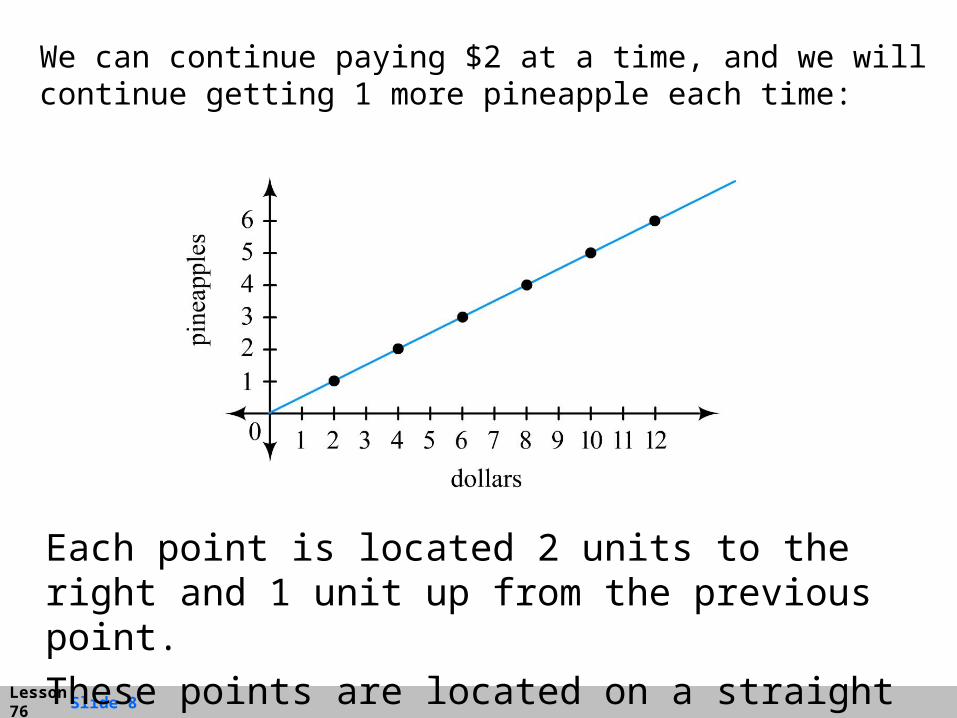
We can continue paying $2 at a time, and we will continue getting 1 more pineapple each time:
Each point is located 2 units to the right and 1 unit up from the previous point.
These points are located on a straight line:

Slide 9Lesson 76
What about input values that are not multiples of 2 dollars and output values that are not multiples of 1 pineapple?
Do those points also land on this line?
How many pineapples will we get for 1 dollar?$1 will buy us of a pineapple.12
We can plot this by placing a point located at (1, ): 12
This point lands on the same line.

Slide 10Lesson 76
What about when an input is a negative amount of money?
How many pineapples do we have to return to get a refund of 2 dollars?
We represent this as _
2 dollars.
The output is _1 pineapple.
We need to return 1 pineapple in order to get a refund of 2 dollars.

Slide 11Lesson 76
To plot an input of _
2 dollars and an output of _1
pineapple, place a point at coordinates (_2,
_1):
Every point along this line represents a solution to the following equation:

Slide 12Lesson 76
If we plot every solution to this equation, we get the following blue line:
This line continues on forever in both directions as indicated by the arrows.We call this line a graph of the equation.The graph of an equation is made up of all points on a coordinate plane that represent a solution to that equation.

Slide 13Lesson 76
Check for Understanding
1. Plot 5 solutions to the following equation. Treat gallons as the input and quarts as the output. Include two negative inputs, two positive inputs and also include an input of 0 gallons. After plotting the solutions, fit a line through the points to represent the graph of the equation.
Slide 14Lesson 76
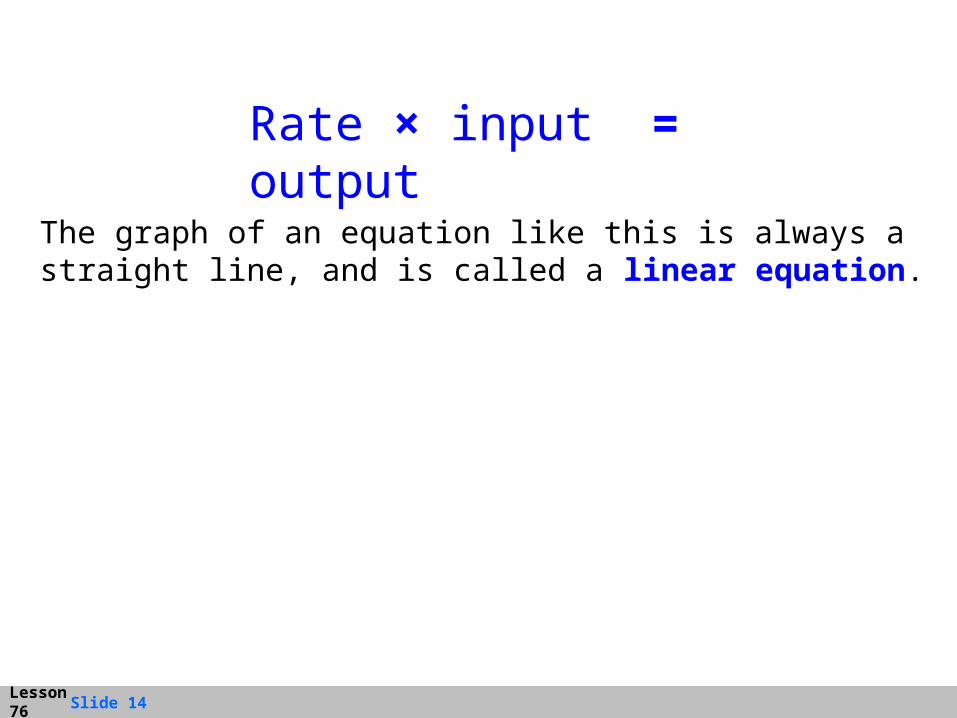
The graph of an equation like this is always a straight line, and is called a linear equation.
Rate × input = output

Slide 15Lesson 76
If a plant grows 3 inches every month, how many inches taller does it get after m number of months?We are turning months into inches of plant growth:How much will the plant grow after m months?Use the variable n to represent the number of inches of growth after m months.

Slide 16Lesson 76
Let’s find the solution to the equation when m equals 0:
Slide 17Lesson 76
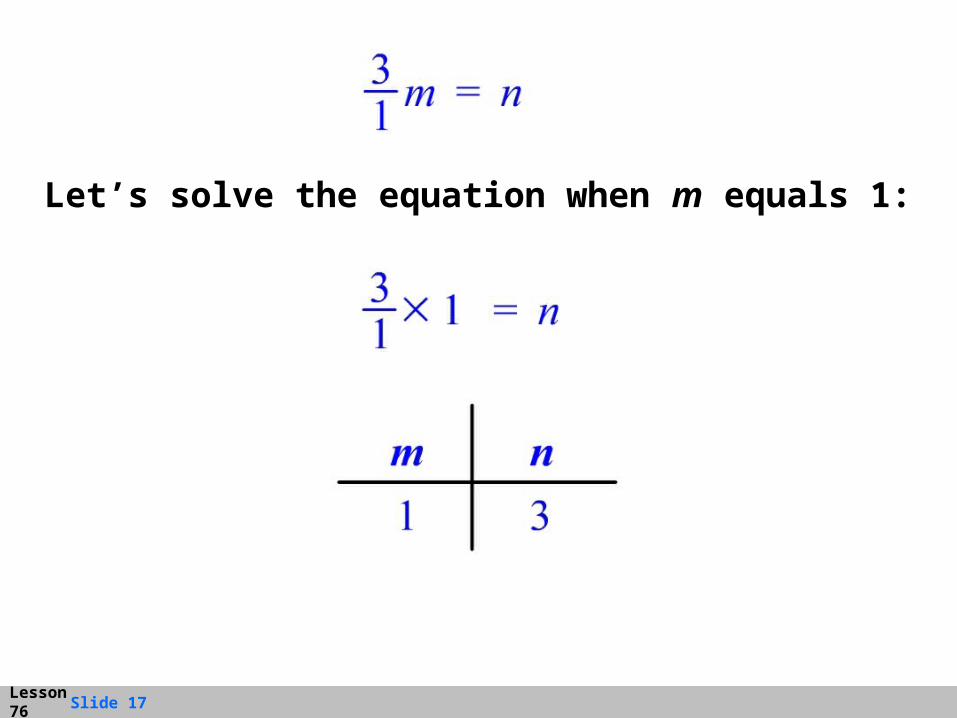
Let’s solve the equation when m equals 1:

Slide 18Lesson 76
Next let’s find the solution when m equals _1:
The solution means that if we go back in time by 1 month, the plant will be 3 inches shorter.

Slide 19Lesson 76
So far we have the following three solutions:
Let’s plot these on a coordinate plane:Because our equation is an input multiplied by a rate to produce an output, the graph is a straight line that passes through the origin:

Slide 20Lesson 76
Check for Understanding
2. Which of the following can be graphs of an equation where an input is multiplied by a rate to produce an output? Which cannot? Explain your reasoning.

Slide 21Lesson 76
Check for Understanding
3. Consider the following situation:
There are approximately 8 kilometers in 5 miles. How many kilometers are in m miles?
Write an equation that describes this situation. Use miles as the input and kilometers as the output. Plot several solutions to this equation. Since the situation is represented as an input multiplied by a rate to produce an output, you can fit a line through the points to represent the graph of the equation.

Slide 22Lesson 76
Check for Understanding4. Consider the following situation:
Right now Jim has no money, and he will get 3 more dollars into debt every 7 hours.
If we represent being in debt as a negative amount of money, we can describe how much money Jim has after a variable number of hours with the following equation:
Plot 5 different solutions to this equation. Since this is an input multiplied by a rate to produce an output, you can fit a line through the points to represent the graph of this equation.
Slide 23Lesson 76
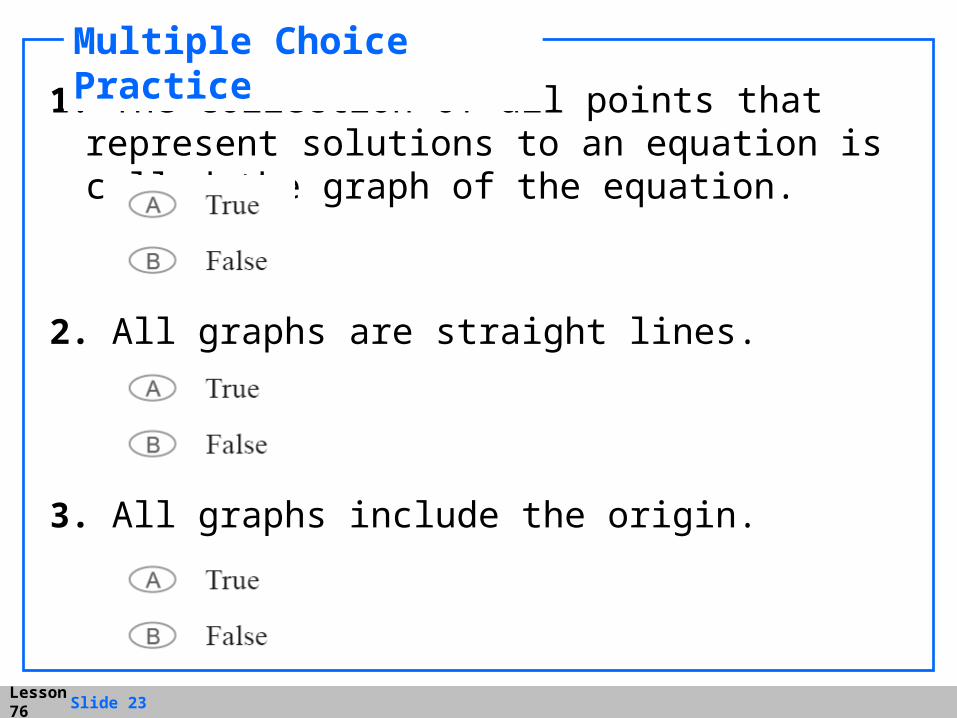
1. The collection of all points that represent solutions to an equation is called the graph of the equation.
Multiple Choice Practice
2. All graphs are straight lines.
3. All graphs include the origin.

Slide 24Lesson 76
4. If the equation is an input multiplied by a rate to produce an output, then the graph is a straight line that goes through the origin.
Multiple Choice Practice
5. The graph of a linear equation is always a straight line.

Slide 25Lesson 76
Find the ErrorsA student made 2 mistakes graphing the equations below. Identify and correct the mistakes.