Embed Size (px)
Citation preview

Slide 1
Saleh Abdalla
ECMWF, Reading, UK
TSUNAMI

Tsunami Slide 2
Main References:
G.F. Carrier (1971): “The Dynamics of Tsunamis”, in
“Mathematical Problems in the Geophysical Sciences”
by W.H. Reid (Ed.), American Mathematical Society,
157-187.
Z. Kowalik, W. Knight, T. Logan, and P. Whitmore
(2005): “Numerical Modeling of the Global Tsunami:
Indonesian Tsunami of 26 December 2004”, Science of
Tsunami Hazards, Vol. 23, No. 1, 40-56.
(freely available at: http://www.sthjournal.org/)
Tsunami Slide 3
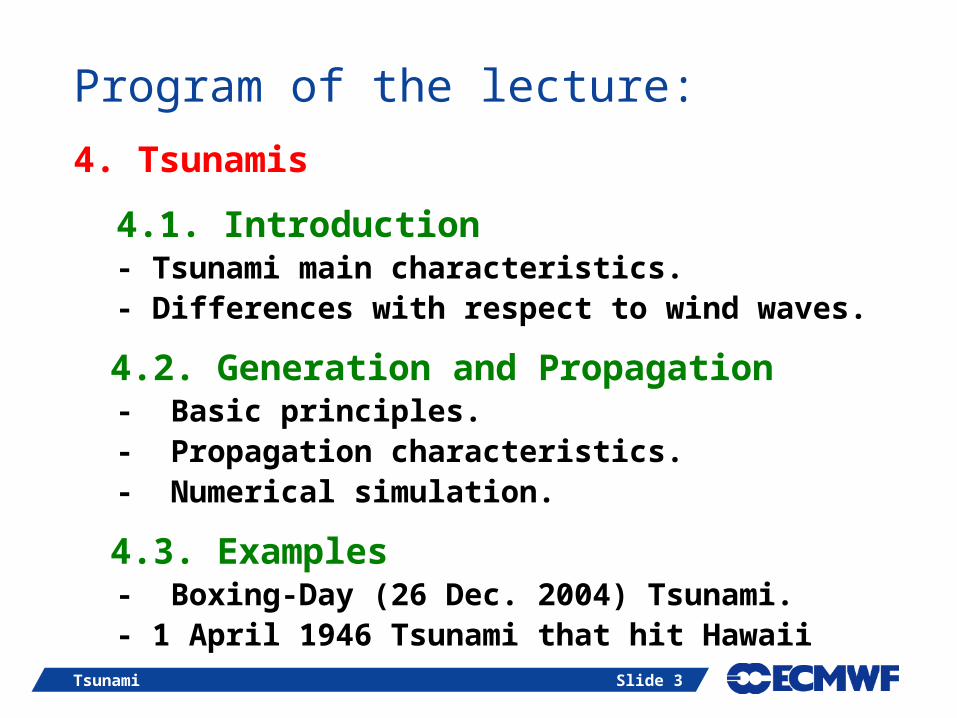
Program of the lecture:
4. Tsunamis
4.1. Introduction- Tsunami main characteristics.- Differences with respect to wind waves.
4.2. Generation and Propagation- Basic principles.- Propagation characteristics.- Numerical simulation.
4.3. Examples- Boxing-Day (26 Dec. 2004) Tsunami.- 1 April 1946 Tsunami that hit Hawaii
Slide 4
INTRODUCTION
Tsunami Slide 5
Introduction:
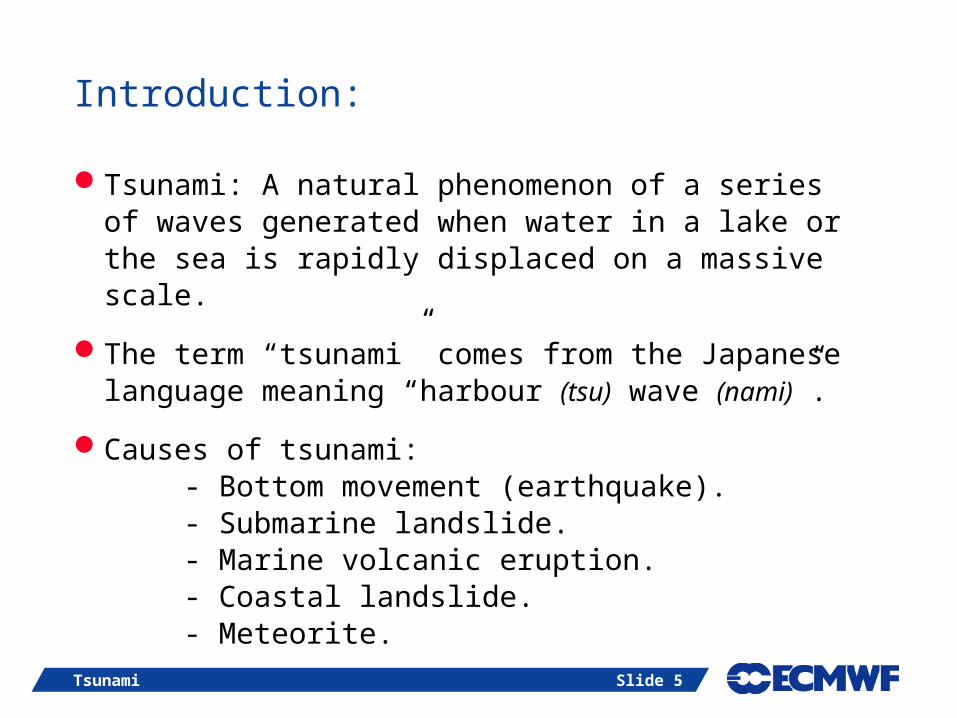
Tsunami: A natural phenomenon of a series of waves generated when water in a lake or the sea is rapidly displaced on a massive scale.
The term “tsunami” comes from the Japanese language meaning “harbour (tsu) wave (nami)”.
Causes of tsunami:- Bottom movement (earthquake).- Submarine landslide.- Marine volcanic eruption.- Coastal landslide.- Meteorite.

Tsunami Slide 6
Introduction (cont’d):
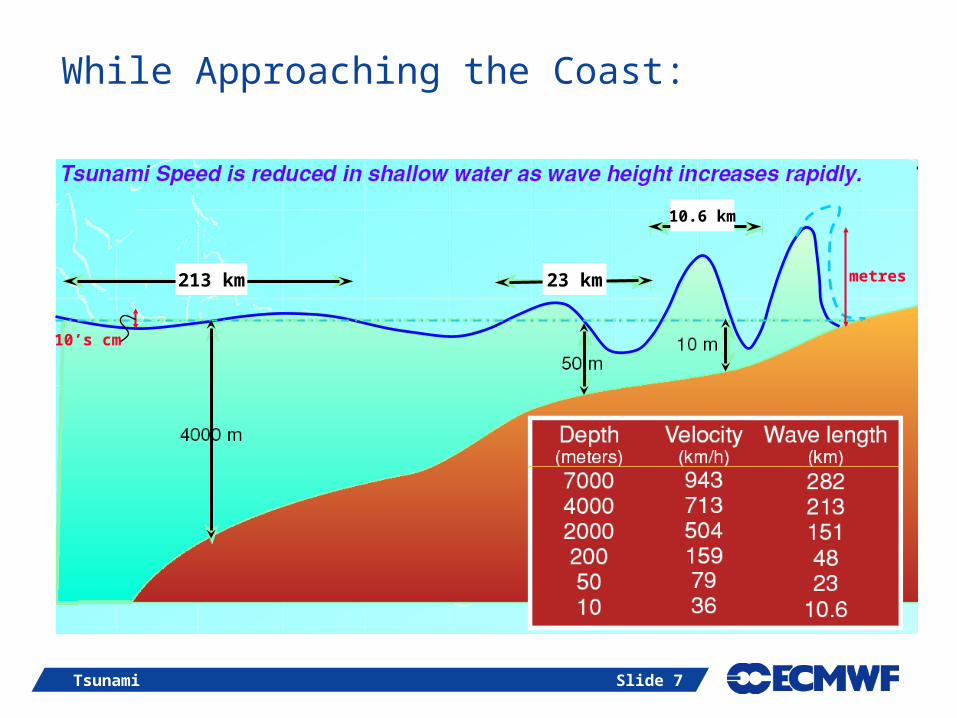
Tsunami typical dimensions:- wave length of several hundreds of kilometres,- wave period of several minutes (up to an hour),- wave height of several tens of centimetres.
Tsunami is a shallow water with wave speed of(g is acceleration due to gravity and D is the water depth) typical tsunami speed in an ocean with 4000 m depth
is 720 km/hr (200 m/s)
Near the coast, the tsunami speed is much lower (e.g. for 40 m depth, the speed is 20 m/s) shoaling (piling-up) while approaching the coast wave height increases (can reach as high as 30 m!)
Dgc
Tsunami Slide 7
While Approaching the Coast:
213 km 23 km
10.6 km
10’s cm
metres

Tsunami Slide 8
Wave Classes and Scales:
1.010.0 0.03 3x10⁻³ 2x10⁻⁵ 1x10⁻⁵
Frequency (Hz)
Forcing:wind
earthquakemoon/sun
Restoring:gravity
surface tension Coriolis force
12

Tsunami Slide 9
Differences between Tsunami and Wind Waves (in deep ocean):
Tsunami Wind-Wave
Generation: earthquake wind
Restoration: gravity + Coriolis gravity
Typical length: several 100’s km few cm’s-few 100 m’s
Typical period: several minutes several seconds
Typical speed: few 100 m/s few 10 m/s
Water motion: almost linear motion orbital motion over a rather
over the whole water “thin” layer at surfacecolumn.

Slide 10
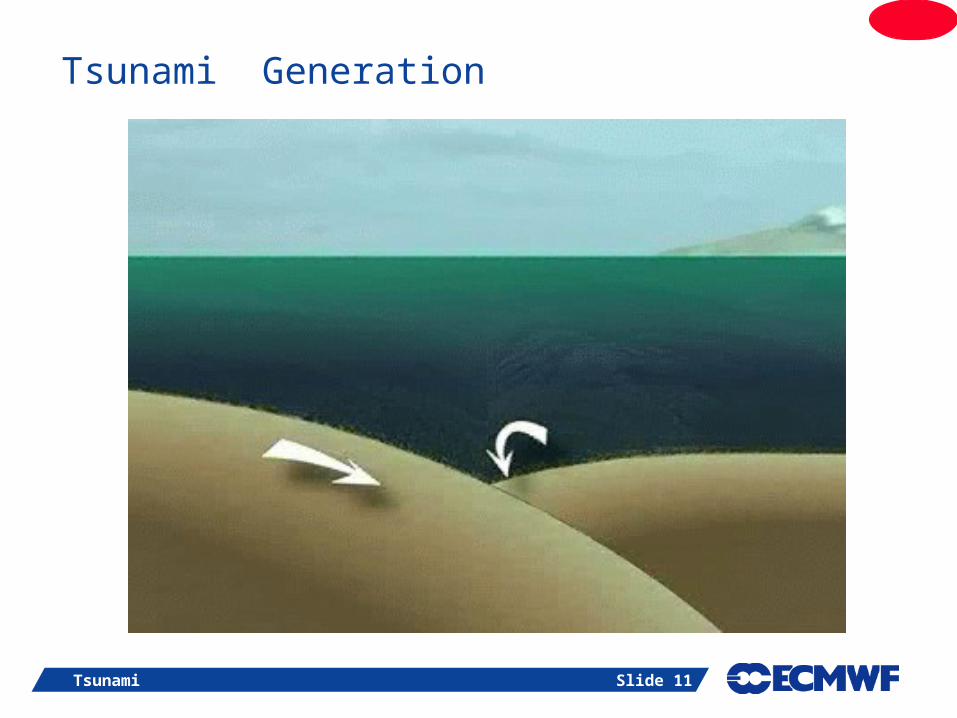
TSUNAMI GENERATION
Tsunami Slide 11
Tsunami Generation

Slide 12
TSUNAMI PROPAGATION
Tsunami Slide 13
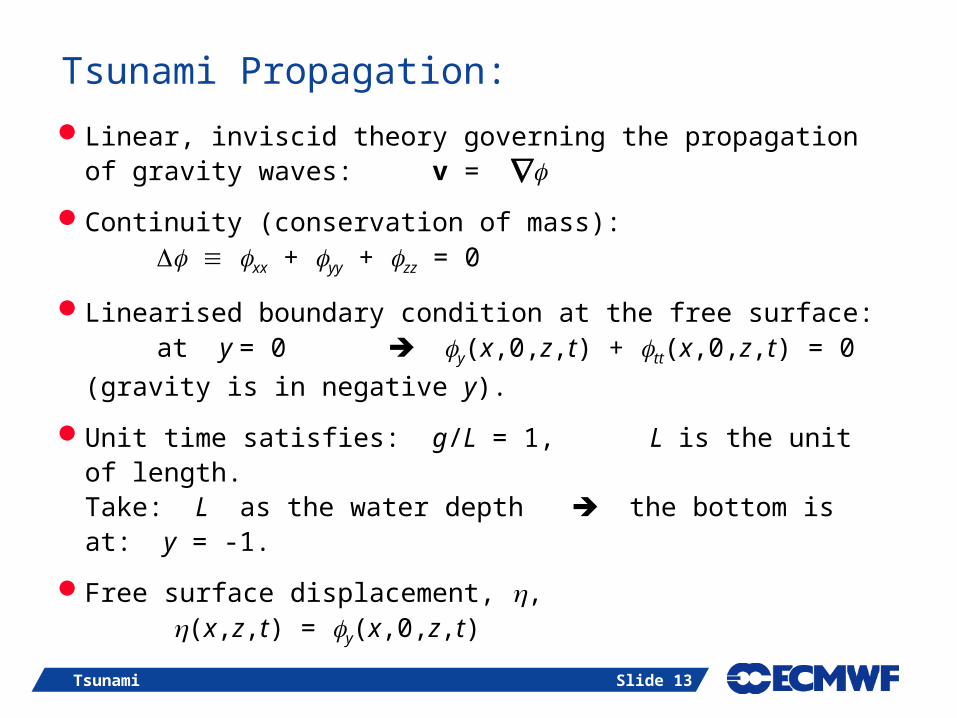
Tsunami Propagation:
Linear, inviscid theory governing the propagation of gravity waves: v =
Continuity (conservation of mass): xx + yy + zz = 0
Linearised boundary condition at the free surface:at y = 0 y(x,0,z,t) + tt(x,0,z,t) = 0
(gravity is in negative y).
Unit time satisfies: g/L = 1, L is the unit of length.Take: L as the water depth the bottom is at: y = -1.
Free surface displacement, , (x,z,t) = y(x,0,z,t)
Tsunami Slide 14
Tsunami Propagation (cont’d):
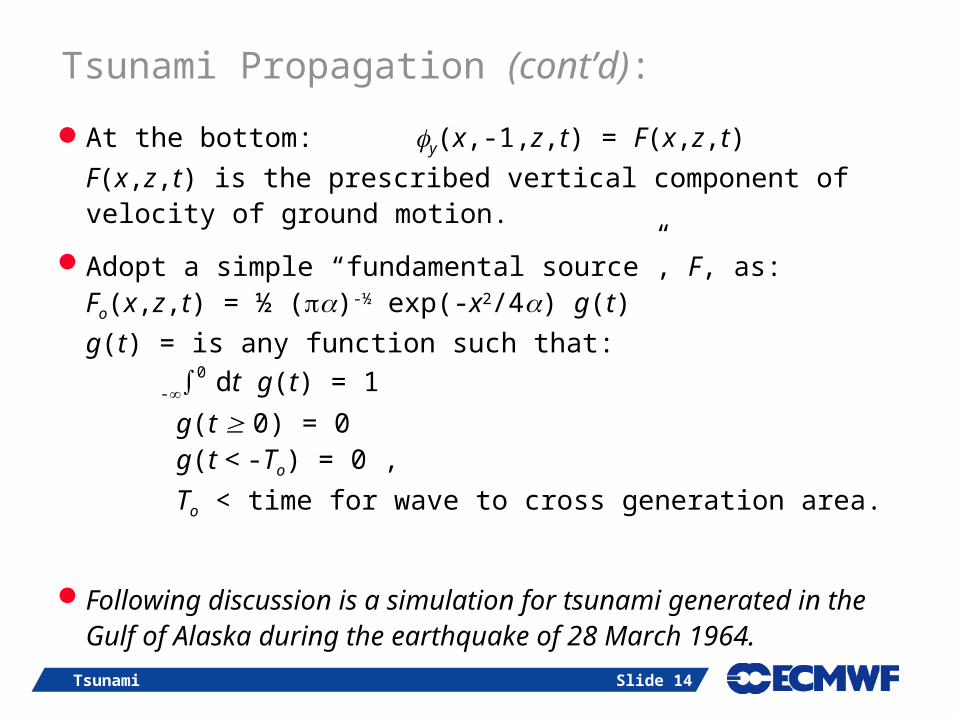
At the bottom: y(x,-1,z,t) = F(x,z,t)
F(x,z,t) is the prescribed vertical component of velocity of ground motion.
Adopt a simple “fundamental source”, F, as:Fo(x,z,t) = ½ ()-½ exp(-x2/4) g(t)
g(t) = is any function such that:
-0 dt g(t) = 1
g(t 0) = 0 g(t < -To) = 0 ,
To < time for wave to cross generation area.
Following discussion is a simulation for tsunami generated in the Gulf of Alaska during the earthquake of 28 March 1964.

Tsunami Slide 15

Tsunami Slide 16
Tsunami Propagation (cont’d):Area over which early wave motion takes place:
width = 4 ½ (in x-direction) length = 2 zo = 800 miles
Motion starts at -zo and
takes 5 min. to reach zo
Crest-line aligns with CD and proceeds as if the ground motion was simultaneous at all z in (-zo, zo)
but along CD line.
Ground motion did not occur for - < zo < equivalent to ground motion for the
whole range but with lower amplitude proportional to(A½/x)½ , A=generation area
x
zzo
-zo
4 ½
2zo
D
BC

Tsunami Slide 17
Tsunami Propagation (cont’d):Solution of the 3-D problem can be approximated as:
3D
(x,y,z,t) = (A½/x)½ 2D
(x,y,t)
for z in the wedge-shaped region z < x/3 , x > 2A½
This solution is adequate for tsunami motion.(not so for the whole radiation pattern).
Solution for: F (x,z,t) = Fo(x,z,t) - Fo(x+b,z,t)
with suitable and b values.
Using Fourier transform, by choosing g(t) = (t), by adopting the Boussinesque theory and by sacrificing some of the accuracy, it is possible to find:
where Ai denotes the Airy function.
= ½ (2/t)1/3 Ai {(2/t)1/3[x - t + (22/t)]} exp[(83/3t2)-(2 (t-x)/t)]

Tsunami Slide 18
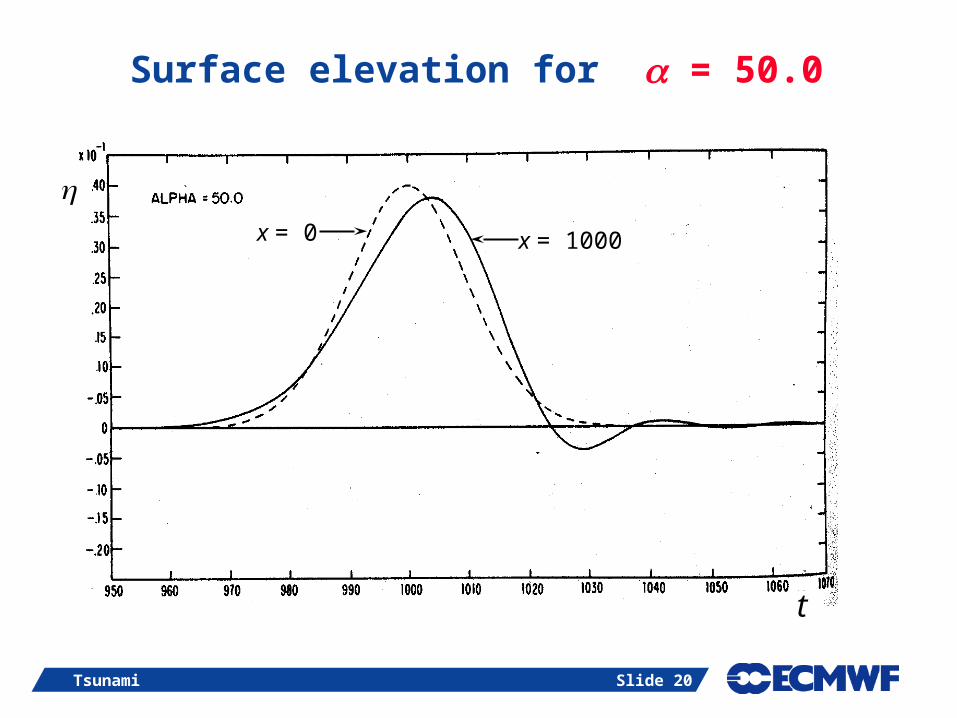
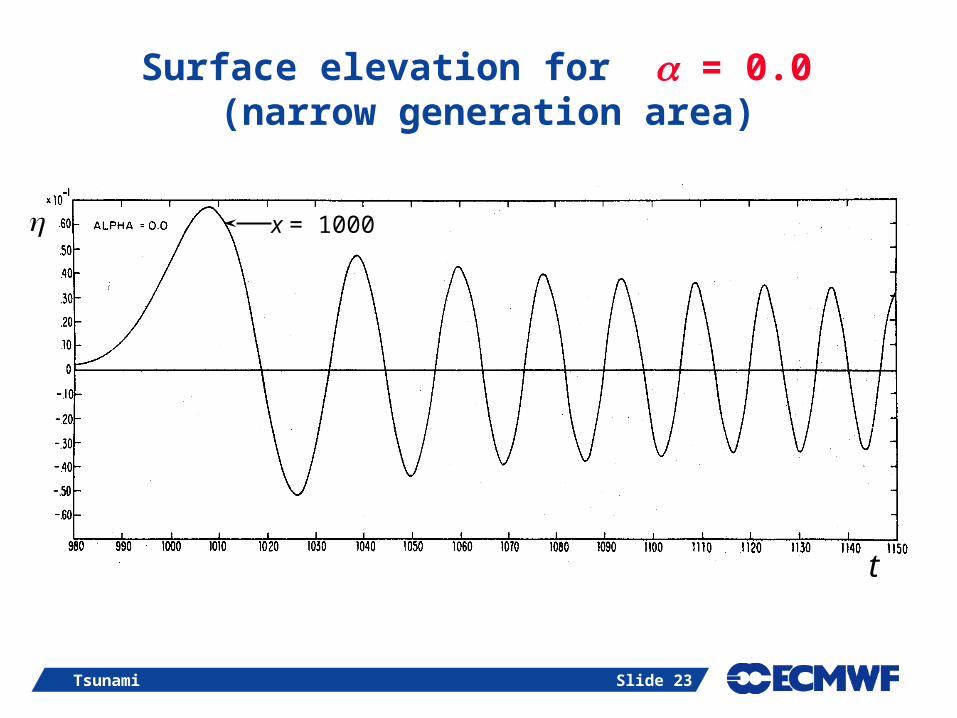
Tsunami Propagation (cont’d):Assessment of the effect of the lateral scale of the generating
ground motion: For a Gaussian(-like) initial ground displacement,
(0, t),
(1000, t) for = 90, 50, 30, 10, 0.
(for 3000 m depth, they correspond to widths of generating area of 114, 85, 65, 38 and 0 km, respectively).
For wide generating areas, the initial disturbance propagates without much of change.
For narrow generating areas, (directional) dispersion plays an important role in producing extra crests.
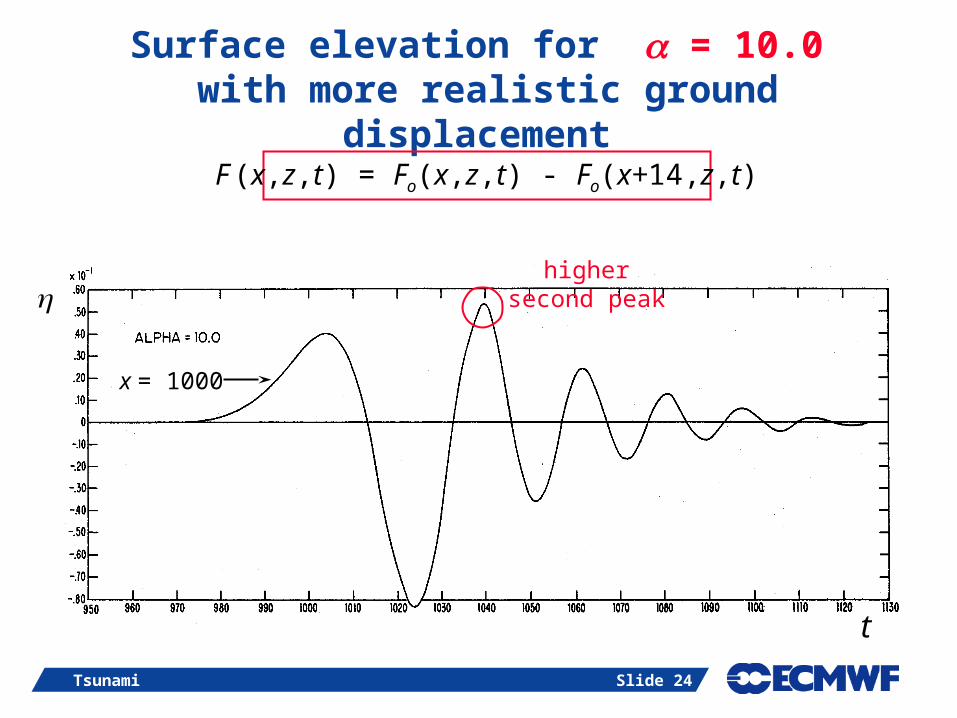
A more realistic forcing with: F (x,z,t) = Fo(x,z,t) - Fo(x+14,z,t)
produces a second crest which is higher than the first (consistent with observations at Hawaii).

Tsunami Slide 19
Surface elevation for = 90.0(wide generation area)
x = 0 x = 1000
t
Tsunami Slide 20
Surface elevation for = 50.0
x = 0 x = 1000
t

Tsunami Slide 21
Surface elevation for = 30.0
x = 0 x = 1000
t

Tsunami Slide 22
Surface elevation for = 10.0
x = 1000
t
Tsunami Slide 23
Surface elevation for = 0.0 (narrow generation area)
x = 1000
t
Tsunami Slide 24
Surface elevation for = 10.0 with more realistic ground displacement
x = 1000
highersecond peak
t
F (x,z,t) = Fo(x,z,t) - Fo(x+14,z,t)

Tsunami Slide 25
Actual Tsunami Record
December 26, 2004 Tsunamias Recorded on the Depth Gauge of the Ship Mercator
anchored 1 mile from coast of Phuket, Thailand.The time is in Hours and the depth in Meters.

Tsunami Slide 26
Actualrecord
Same recordbut flipped
trou
gh
crest
Tsunami Slide 27
Tsunami Propagation (cont’d):
Variable depth effects:
scattering by bottom irregularities may not be important for tsunami propagation.
submerged ridges may act as wave guides.
Slide 28
NUMERICAL MODELLING OF TSUNAMI PROPAGATION

Tsunami Slide 29
Numerical Modelling of Tsunami Propagation:
Navier-Stokes.
Spherical coordinates: = latitude, = longitude and R = distance from the Earth’s centre.
Define: z = R - Ro (Ro is the Earth radius = 6370 km)
Vertically averaged continuity and equations of motion:
0)cos(cos
1)(
cos
1
vDR
uDRtt oo
DR
gv
R
uu
R
vu
R
u
t
u
o
b
oooo
cossin
cos2
cos
DR
gu
R
uv
R
vv
R
u
t
v
o
b
oooo
sincos
2cos
Tsunami Slide 30
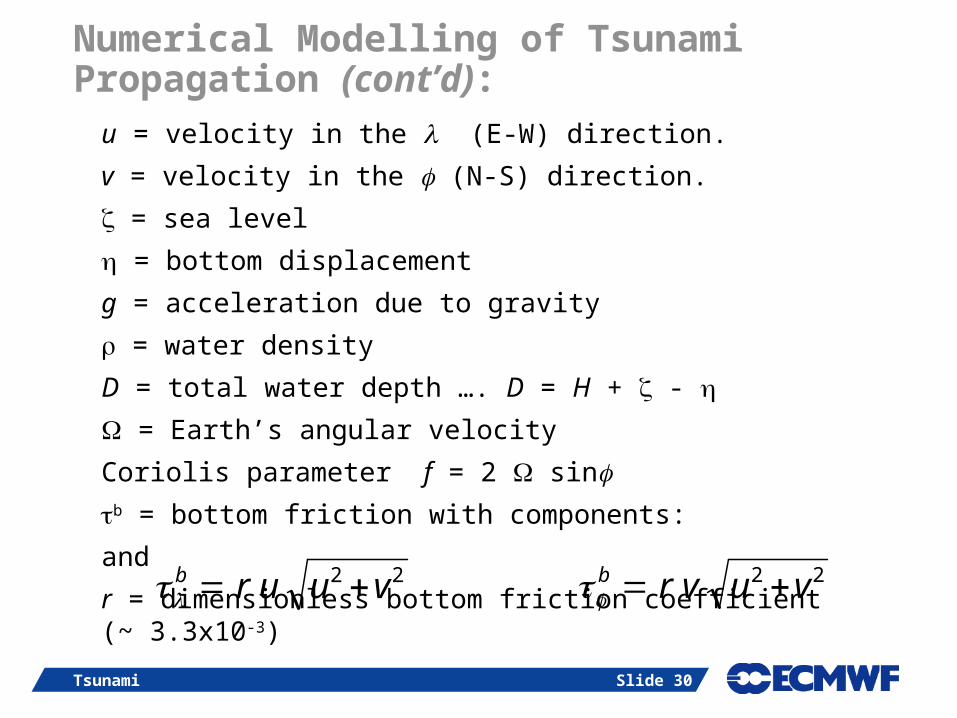
Numerical Modelling of Tsunami Propagation (cont’d):
u = velocity in the (E-W) direction.
v = velocity in the (N-S) direction.
= sea level
= bottom displacement
g = acceleration due to gravity
= water density
D = total water depth …. D = H + -
= Earth’s angular velocity
Coriolis parameter f = 2 sinb = bottom friction with components:
and
r = dimensionless bottom friction coefficient (~ 3.3x10⁻³)
22 vuurb 22 vuvrb

Tsunami Slide 31
Solution:
Numerical solution (e.g. finite difference).
Boundary conditions:- Dry points (land boundary):
normal velocity is zero.- Wet points (edge of computational domain):
radiation condition.
Treatment of dynamic wetting and drying.
For numerical considerations, time step is few seconds! excessive computational CPU time.

Tsunami Slide 32
Source Function:
Dislocation formulae require:- fault plane location, depth, strike, dip, slip, length & width- seismic moment and rigidity
Several approaches to estimate the total rupture extent.(early estimates which are usually refined later).
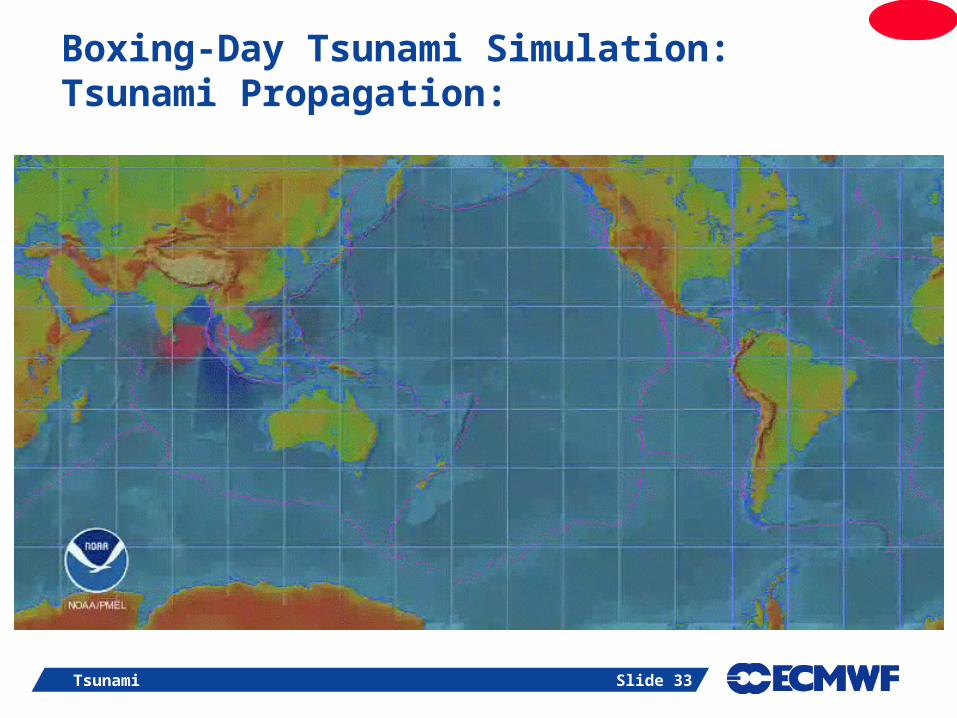
Tsunami Slide 33
Boxing-Day Tsunami Simulation:Tsunami Propagation:

Tsunami Slide 34
Boxing-Day Tsunami Simulation:Maximum Wave Height:
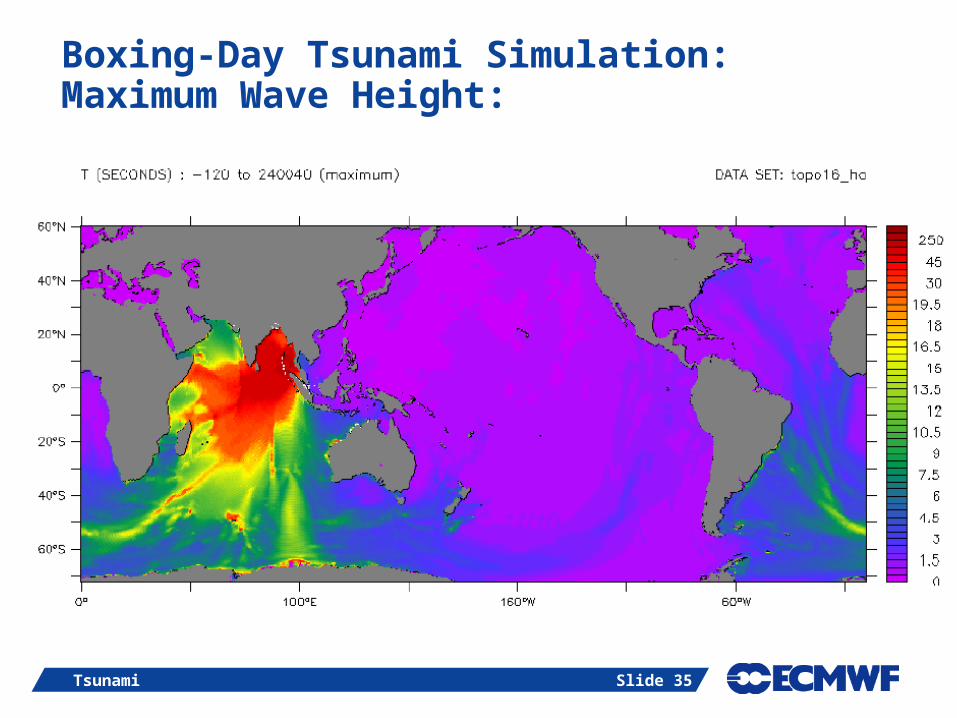
Tsunami Slide 35
Boxing-Day Tsunami Simulation:Maximum Wave Height:

Tsunami Slide 36
Boxing-Day Tsunami Simulation: Arrival Time(in hours)
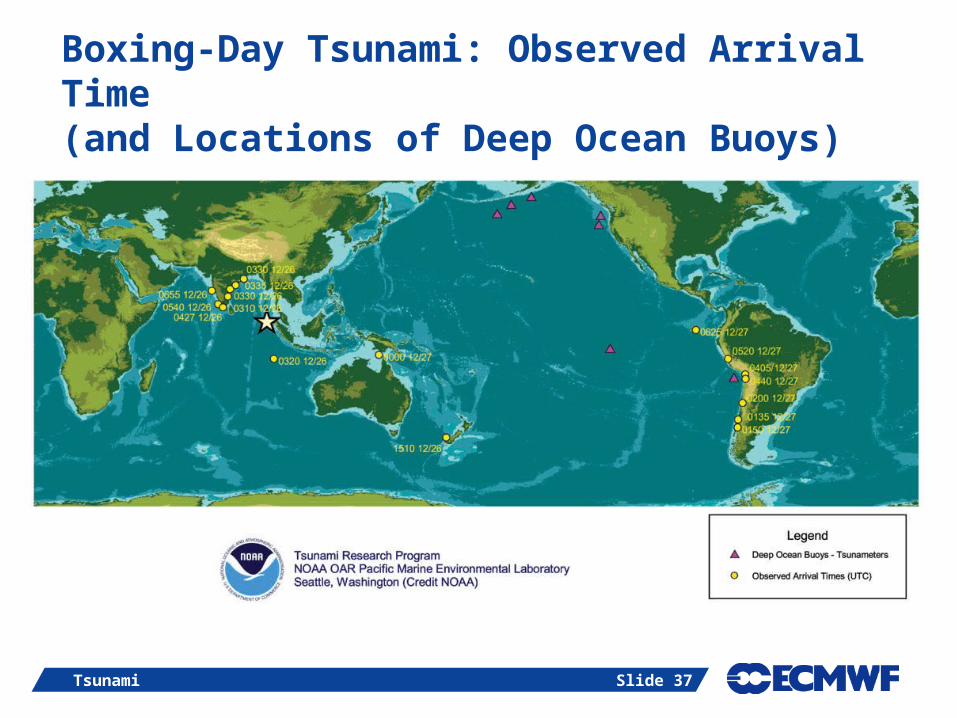
Tsunami Slide 37
Boxing-Day Tsunami: Observed Arrival Time(and Locations of Deep Ocean Buoys)

Tsunami Slide 38
Tsunami Detection: Tidal Gauges(Boxing-Day Tsunami)

Tsunami Slide 39
Tsunami Detection: Tidal Gauges(Boxing-Day Tsunami)

Tsunami Slide 40
Tsunami Detection: Tidal Gauges(Boxing-Day Tsunami)
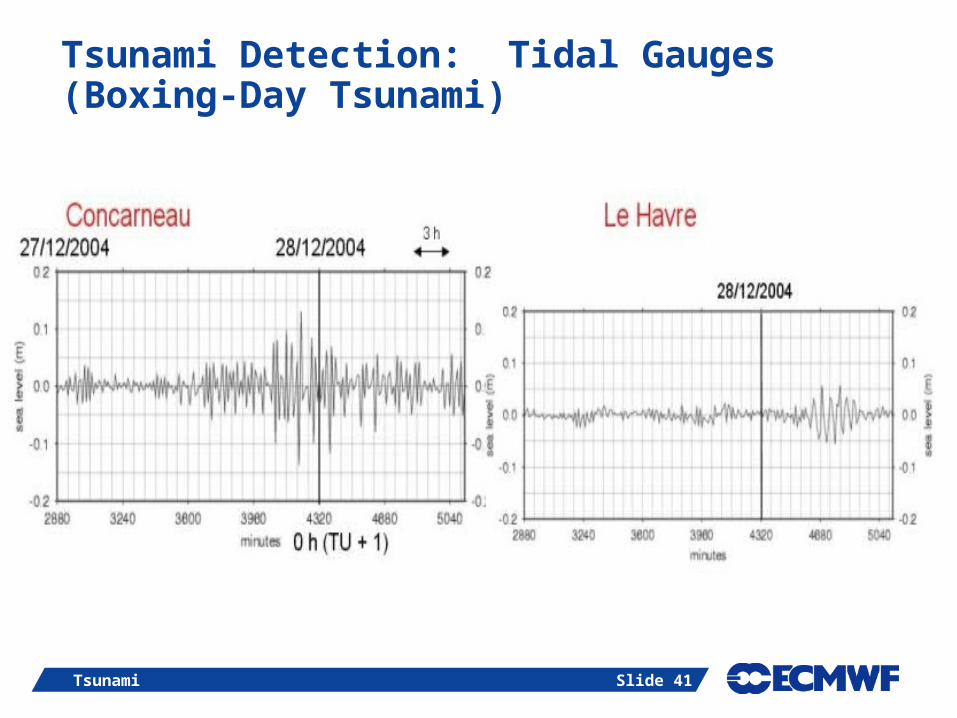
Tsunami Slide 41
Tsunami Detection: Tidal Gauges(Boxing-Day Tsunami)
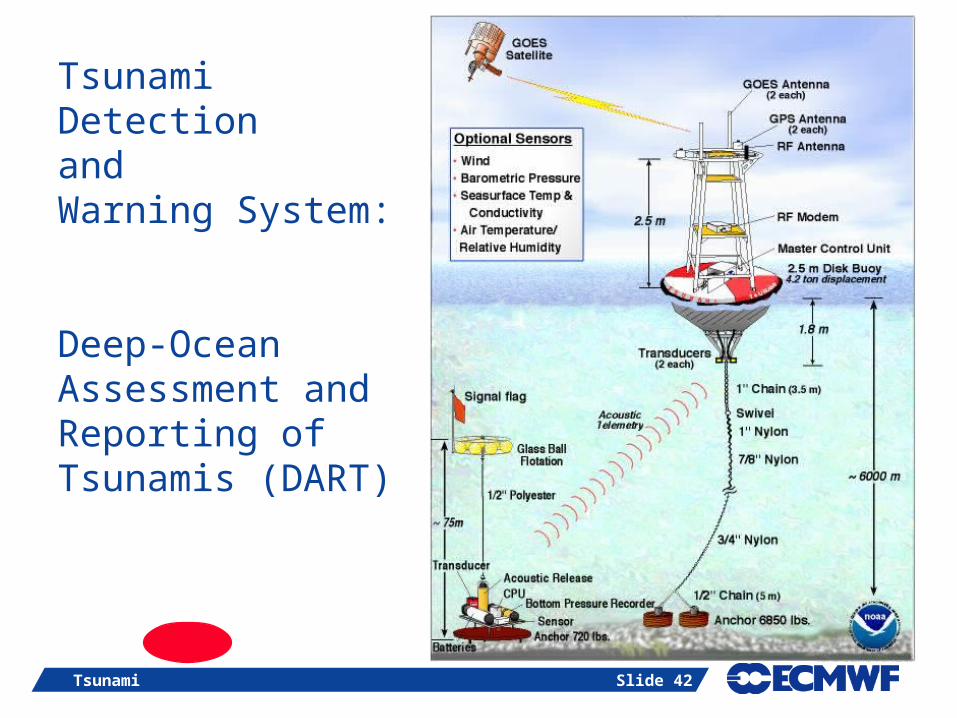
Tsunami Slide 42
Tsunami Detectionand Warning System:
Deep-Ocean Assessment and Reporting of Tsunamis (DART)

Tsunami Slide 43

Tsunami Slide 44
seafloor bottom pressure recording (BPR) system
(detects tsunamis of 1 cm) moored surface buoy forreal-time communications

Tsunami Slide 45

Tsunami Slide 46
Tsunami Detection System:

Tsunami Slide 47
Use of Satellites:
Jason Altimeter
(Boxing-Day Tsunami)
Slide 48
TSUNAMI DEVASTATION
Slide 49
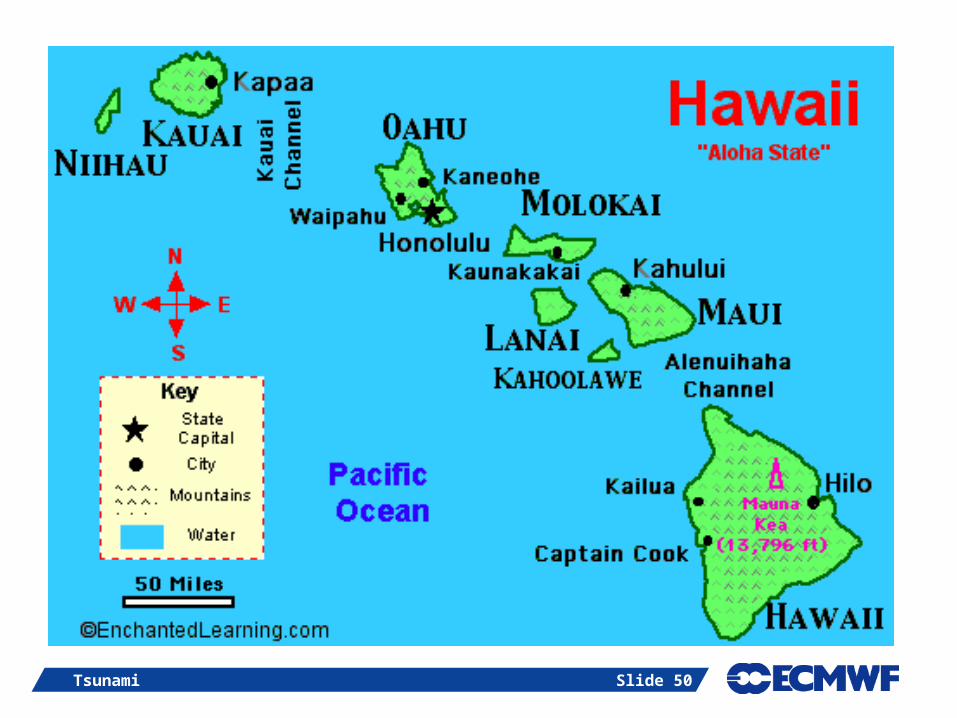
Tsunami Generated by Earthquake of April
1, 1946, Aleutian Islands, Alaska
and hit Hawaii
(maximum rise of water was ~8 m in Hilo
and as much as 12 m in other areas on the
island of Hawaii)
Tsunami Slide 50

Tsunami Slide 51

Tsunami Slide 52

Slide 54
Tsunami Generated by Earthquake of
December 26, 2004, West of Sumatra
(Boxing-Day Tsunami)
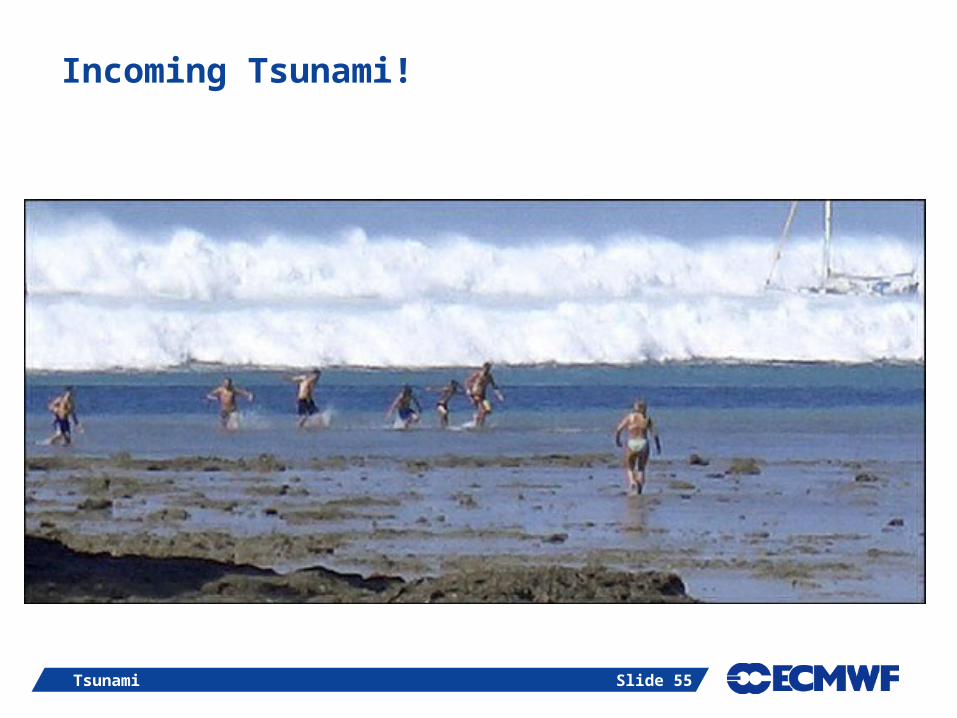
Tsunami Slide 55
Incoming Tsunami!
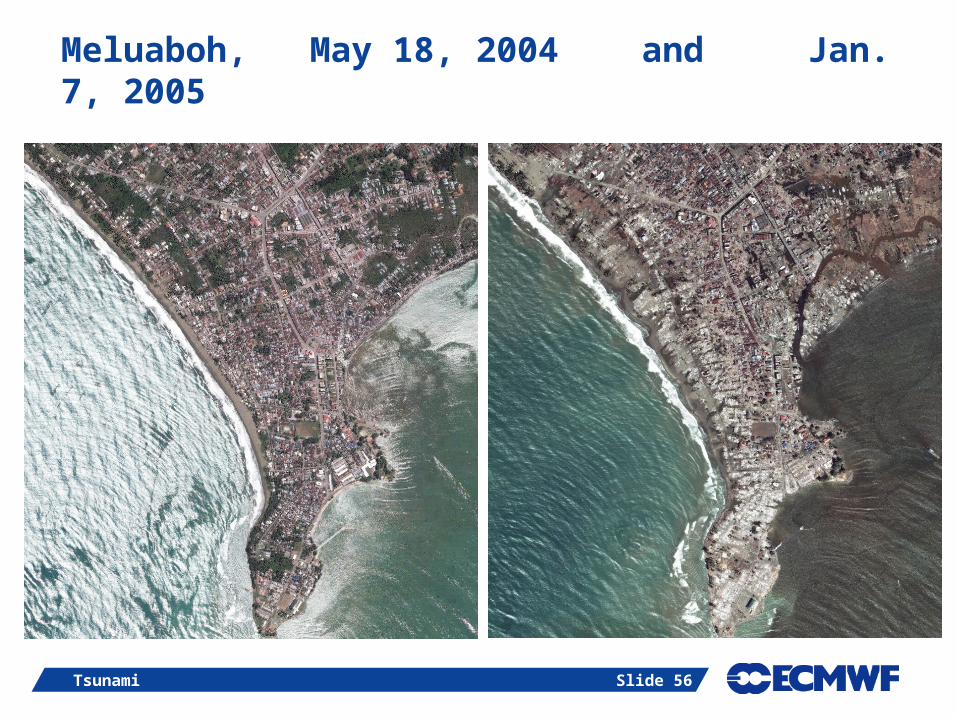
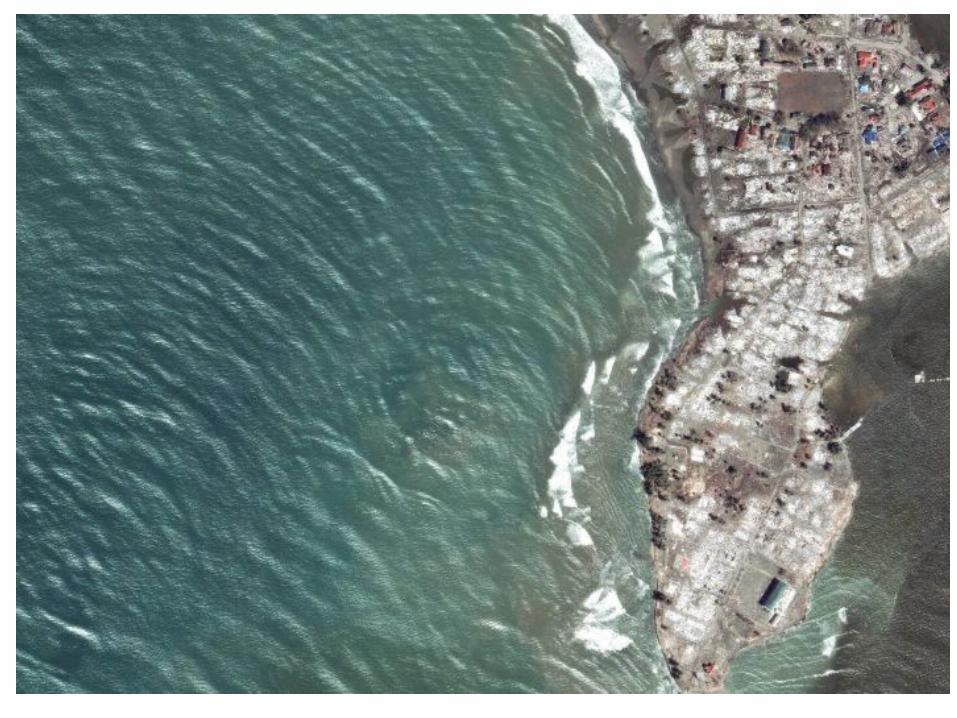
Tsunami Slide 56
Meluaboh, May 18, 2004 and Jan. 7, 2005
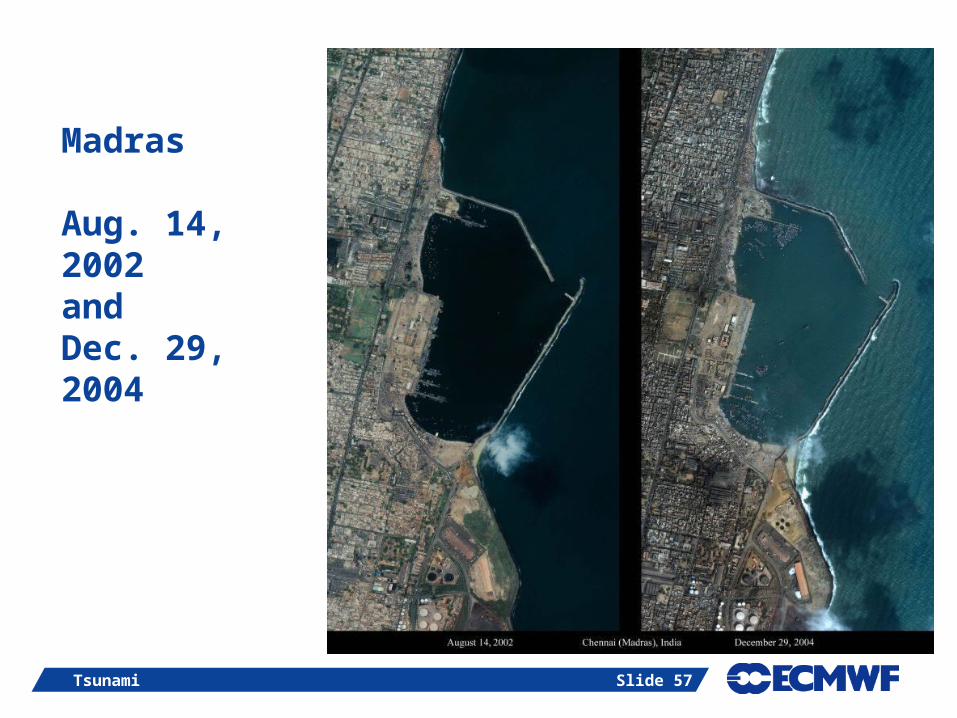
Tsunami Slide 57
Madras
Aug. 14, 2002andDec. 29, 2004

Tsunami Slide 58
Banda AcehNorthern Shore
June 23, 2004
and
Dec. 28, 2004

Tsunami Slide 59
Banda AcehNorthern Shore
June 23, 2004
and
Dec. 28, 2004

Tsunami Slide 60
Srilanka, Kalutara Beach, Dec. 26, 2004Receding Water from tsunami

Tsunami Slide 61
Srilanka, Kalutara Beach, Dec. 26, 2004Receding Water from tsunami

Tsunami Slide 62
No Tsunami Impact in Deep Open Sea:
Tsunami Slide 63
Slide 64
END


![Lídia abdalla [Português]](https://img.pdfslide.net/doc/110x75/58edb7071a28ab88398b45fd/lidia-abdalla-portugues.jpg)