Embed Size (px)
Citation preview
Small Molecule Ice Recrystallization Inhibitors and Their Use in Methane Clathrate Inhibition
Devin Tonelli B.Sc. Honours in Biopharmaceutical Science (Co-op). University of Ottawa, 2010
Thesis submitted to the Faculty of Graduate and Postdoctoral Studies
University of Ottawa in partial fulfillment of the requirements for the
M. Sc. Degree in the Ottawa/Carleton Chemistry Institute
Candidate Professor Devin Tonelli Professor Robert N. Ben
© Devin Tonelli, Ottawa, Canada 2013

ii
This work is dedicated to the teachers who guided me, the friends who stand by me, and the
family that inspired me.
“Somewhere, something incredible is waiting to be known.”
-Carl Sagan
iii
ABSTRACT
Inhibiting the formation of ice is an essential process commercially, industrially, and
medically. Compounds that work to stop the formation of ice have historically possessed
drawbacks such as toxicity or prohibitively high active concentrations. One class of molecules,
ice recrystallization inhibitors, work to reduce the damage caused by the combination of small
ice crystals into larger ones. Recent advances made by the Ben lab have identified small
molecule carbohydrate analogues that are highly active in the field of ice recrystallization and
have potential in the cryopreservation of living tissue.
A similar class of molecules, kinetic hydrate inhibitors, work to prevent the formation of
another type of ice – gas hydrate. Gas hydrates are formed by the encapsulation of a molecule
of a hydrocarbon inside a growing ice crystal. These compounds become problematic in high
pressure and low temperature areas where methane is present - such as an oil pipeline.
A recent study has highlighted the effects of antifreeze glycoprotein, a biological ice
recrystallization inhibitor, in the inhibition of methane clathrates. Connecting these two fields
through the synthesis and testing of small molecule ice recrystallization inhibitors in the
inhibition of methane hydrates is unprecedented and may lead to a novel class of compounds.
iv
ACKNOWLEDGEMENTS
First and foremost I would like to thank Professor Robert Ben for providing me with the
opportunity to be a part of his research group. His guidance, insight, and encouragement
throughout my degree have been deeply appreciated. Rob’s enthusiasm and attitude went a
long way in shaping the environment of the lab into something inviting and enjoyable.
I would also like to thank Dr. Mathieu Leclère for guiding me through the process of
joining a lab, assisting me in my first few experiments, and being a constant source of help and
information.
As well, I greatly appreciate my fellow lab members who offered me assistance and
shared ideas throughout my studies: Malay Doshi for maintaining my excitement towards
chemistry and for participating in a large number of hilarious (and deeply useless)
conversations; Anna Balcerzak for assistance in keeping our bay from degenerating into an
order-less mess and keeping me current on the political climate of Ottawa; and Chantelle
Capicciotti for providing me with countless compounds and countless clever remarks. These
and other lab members, with special thanks Jennie Briard for proofing my thesis and Matthew
Alteen for taking over my project, have been an incredible source of inspiration, knowledge,
and friendship. Without them the experience would not have been the same.
Additionally I would like to thank past members: John Trant, Taz Cheema, Ross Mancini,
and Evan Perley-Robertson; as well as honorary lab members Tom Markiewicz and Francis
Loiseau for helping me along the way.
I acknowledge the support of Dr. John Ripmeester of the National Research Council in
allowing me to use his DSC facilities, and Dr. Steven Lang for his mechanical assistance as well
as the University of Ottawa and NSERC in providing me with the funding required to carry out
this research.
My deepest appreciation goes out to my mother, father, and sister in providing me with
a life that allowed me to pursue my goals and ambitions as well as instilling within in me a
desire to learn. Finally I would like to thank Christine Sheppard who provides me with
encouragement, support, and motivation at all times.
v
TABLE OF CONTENTS
ABSTRACT………………………………………………………………………………………………………………………. iii ACKNOWLEDGEMENTS…………………………………………………………………………………………………… iv TABLE OF CONTENTS………………………………………………………………………………………………………. v LIST OF FIGURES……………………………………………………………………………………………………………… viii LIST OF GRAPHS……………………………………………………………………………………………………………… ix LIST OF TABLES………………………………………………………………………………………………………………. x LIST OF SCHEMES……………………………………………………………………………………………………………. xi LIST OF ABBREVIATIONS…………………………………………………………………………………………………. xii 1.0 CHAPTER 1 GENERAL INTRODUCTION 1.1 Ice Recrystalization Inhibition ………………………………………………………………………………….. 2
1.1.1 Antifreeze Background ……………………………………………………………………………. 2 1.1.2 Biological Antifreezes ……………………………………………………………………………… 2 1.1.3 Biological Properties of Antifreezes ………………………………………………………… 4 1.1.4 Use of Antifreezes in Cryopreservation …..………………………………………………. 5 1.1.5 History of Ice Recrystalization Inhibitors …………………………………………………. 7 1.1.6 Mechanism of Small Molecule Ice Recrystalization Inhibition …………………. 8 1.1.7 Potent Small Molecule Ice Recrystalization Inhibitors ……………………………… 9
1.2 Inhibiting the Formation of Clathrate Hydrates ………………………………………………………… 10
1.2.1 Clathrates ……………………………………………………………………………………………….. 10 1.2.2 Gas Hydrates …………………………………………………………………………………………… 12 1.2.3 Methane Clathrates ………………………………………………………………………………… 13 1.2.4 Thermodynamic Hydrate Inhibition ………………..………………………………………. 14 1.2.5 Low Dosage Hydrate Inhibition (LDHI) …………………………………………………….. 15
1.2.5.1 Antiagglomerants …………………………………………………………… 16 1.2.5.2 Kinetic Hydrate Inhibitors ………………………………………………. 17
1.2.6 Application of LDHI 17
1.3 Biological Antifreezes as Inhibitors of Clathrate Formation ……………………………………… 18
vi
1.3.1 Introduction ……………………………………………………………………………………………. 18 1.3.2 AFGP Inhibition of Clathrate Hydrates …………………………………………………….. 19 1.3.3 Small Molecule Inhibition of Methane Hydrate ………………………………………. 20
References …………………………………………………………………………………………………………………….. 21
2.0 CHAPTER 2 SYNTHESIS OF AMINE CARBOHYDRATES 2.1 Hydration and Ice Recrystalization Inhibition …………………………………………………………… 26
2.2 Preparation of Amino Carbohydrates ………………………………………………………………………. 31
2.2.1 Retrosynthetic Analysis …………………………………………………………………………… 31 2.2.1.1 Retrosynthesis of C2 and C4 Amino Carbohydrates ………… 32 2.2.1.2 Retrosynthesis of C6 Amino Carbohydrates ……………………. 33 2.2.1.3 Retrosynthesis of C3 Amino Carbohydrates ……………………. 33
2.2.2 Synthesis of Amino-D-Galactose Derivatives …………………………………………… 34 2.2.2.1 C2 and C4 Amino-D-Galactose Derivatives ……………………… 34 2.2.2.2 C6 Amino-D-Galactose Derivatives …………………………………. 35 2.2.2.3 C5 Amino-D-Galactose Derivatives …………………………………. 36 2.2.2.4 C3 Amino-D-Galactose Derivatives …………………………………. 37
2.2.3 C3 Regioselectivity through Stannylene Protection …………………………………. 38 2.2.4 Preparation of C3 Amine through Triflate Intermediates ………………………… 40 2.2.5 Preparation of C3 Amine through Reductive Amination ………………………….. 42
References ………………………………………………………………………………………………………………………… 44 3.0 CHAPTER 3 ICE RECRYSTALIZATION INHIBITION ACTIVITY OF CARBOHYDRATES AND CARBOHYDRATE DERIVATIVES 3.1 Assessing Ice Recrystallization Inhibition Activity ………………………………………………….... 46
3.2 IRI Activity of Amino Carbohydrates ………………………………………………………………………... 47
3.3 IRI Activity in Other Small Molecules ……………………………………………………………………….. 50
3.3.1 Azasugars ………………………………………………………………………………………………… 50 3.3.2 Pyranose Sugars .…………………………………………………………………………………….. 52 3.3.3 Gluconamides …………………………………………………………………………………………. 55
References …………………………………………………………………………………………………………………….. 58 4.0 CHAPTER 4 METHANE CLATHRATE INHIBITION 4.1 Differential Scanning Calorimetry……………………………………………………………………………… 60
vii
4.2 Clathrate Inhibitory Potential of Small Molecules…………………………………………………….. 63
4.2.1 Existing Clathrate Inhibitors……………………………………………………………………… 63 4.2.2 Gluconamides………………………………………………………………………………………..... 64 4.2.3 Pyranose Sugars………………………………………………………………………………………. 68 4.2.4 Azasugars………………………………………………………………………………………………… 70 4.2.5 Small Molecule Clathrate Inhibitors…………………………………………………………. 72
4.3 Correlation of IRI Ability and Clathrate Inhibition……………………………………………………… 73 References …………………………………………………………………………………………………………………….. 79 5.0 CHAPTER 5 EXPERIMENTAL PROCEDURES 5.1 Chapter 2 Experimental Procedures………………………………………………………………………….. 81
5.1.1 General Experimental Conditions…………………………………………………………….. 81 5.1.2 Experimental Reaction Conditions Toward the Synthesis of Amine
Carbohydrates…………………………………………………………………………………………. 81
5.2 Chapter 3 Experimental Procedures………………………………………………………………………….. 87
5.2.1 Procedure for Ice Recrystallization Inhibition Assay…………………………………. 87 5.2.2 Experimental Conditions Towards Pyranose and Gluconamide Sugars…….. 88
5.3 Chapter 4 Experimental Procedures…………………………………………………………………………. 92
5.3.1 Procedure for Clathrate Inhibition Assay…………………………………………………. 92 References……………………………………………………………………………………………………………………… 94 APPENDIX………………………………………………………………………………………………………………………. 95
viii
LIST OF FIGURES
Figure 1.1 Example AFGP containing carbohydrate and peptide moieties ……………….. 3 Figure 1.2 Effect of AFGP on the freezing temperature of water compared to
colligative materials ………………………………………………………………………………… 3 Figure 1.3 Ice crystals grown in the absence and presence of TH active compounds 4 Figure 1.4 Comparison of ice crystal size between solution containing IR inhibitor
AFGP 8 and PBS control …………………………………………………………………………… 5 Figure 1.5 Cytotoxicity comparison of TH active AFGP 8 with TH inactive Analogue 1 7 Figure 1.6 Ice recystalization inhibition activity compared to the hydration number
of various monosaccharides and disaccharides ………………………………………. 9 Figure 1.7 Modern potent IRI active small molecules ………………………………………………. 10 Figure 1.8 Clathrate forms ………………………………………………………………………………………. 11 Figure 1.9 Type I and Type II clathrate hydrates ………………………………………………………. 12 Figure 1.10 Pipeline plug due to formation of methane hydrates ……………………………… 14 Figure 1.11 Progression of gas hydrate crystal formation ………………………………………….. 16 Figure 1.12 Cumulative heat of freezing for the formation of methane hydrate ………… 19 Figure 2.1 α-allyl-D-galactose deoxy analogues tested for IRI ability ……………………….. 27 Figure 2.2 α-allyl-D-galactose methoxy analogues tested for IRI ability …………………… 29 Figure 2.3 N-acetyl-Dgalactosamine and D-galactosamine ………………………………………. 30 Figure 2.4 Possible alternative pathway for undesired azide reactivity ……………………. 41 Figure 3.1 Visual comparison of wafer between IRI active compound 3-amino-
galacto-pyranoside and PBS control ………………………………………………………… 47 Figure 3.2 Amino Carbohydrates ……………………………………………………………………………… 48 Figure 3.3 Azasugar compound family tested for IRI potential …………………………………. 52 Figure 3.4 Small molecules in the pyranose sugar family tested for IRI ability …………. 53 Figure 4.1 Polyvinylpyrrolidone……………………………………………………………………………...... 63
ix
LIST OF GRAPHS
Graph 2.1 IRI activity of α-allyl-D-galactose deoxy analogues ………………………………….. 28 Graph 2.2 IRI activity of α-allyl-D-galactose methoxy analogues ……………………………… 29
Graph 2.3 Effect of C2 substituents on IRI activity (MGS) ………………………………………… 31 Graph 3.1 Effect of replacing hydroxyl groups with amino substituents at each
position on the galactopyranose ring relative to PBS ………………………………. 48 Graph 3.2 IRI potential (%MGS) of the azasugar family of compounds ……………………. 50 Graph 3.3 IRI potential (%MGS) of the pyranose sugar family of compounds ………….. 54 Graph 4.1 DSC curve representative of a single test run of PVP 10…………………………… 62 Graph 4.2 Cumulative heat of freezing of NOG at a variety of concentrations…………. 66 Graph 4.3 Cumulative heat of freezing of gluconamide family…………………………………. 67 Graph 4.4 Cumulative heat of freezing of pyranose sugar family……………………………… 69 Graph 4.5 Cumulative heat of freezing of azasugar family………………………………………… 71 Graph 4.6 Comparison of IRI activity with clathrate inhibition activity in pyranose
sugars………………………………………………………………………………………………………. 74 Graph 4.7 Comparison of IRI activity with clathrate inhibition activity in azasugars…. 75
x
LIST OF TABLES
Table 3.1 Small molecules in the gluconamide family tested for IRI abilitiy ……………. 56 Table 4.1 Small molecules in the gluconamide family……………………………………………… 64 Table 4.2 Small molecules in the pyranose sugar family………………………………………….. 68 Table 4.3 Small molecules in the azasugar family……………………………………………………. 70 Table 4.4 Comparison of clathrate inhibition and ice recrystallization inhibition in
the gluconamide family……………………………………………………………………………. 77
xi
LIST OF SCHEMES
Scheme 2.1 General retrosynthesis of amino substituted monosaccharides ………………………… 32 Scheme 2.2 Retrosynthesis of 4-amino-4-deoxy-D-galactopyranoside ………………………. 33
Scheme 2.3 Retrosynthesis of 6-amino-6-deoxy-D-galactopyranoside ……………………….. 33 Scheme 2.4 Retrosynthesis of 3-amino-3-deoxy-D-galactopyranoside ……………………….. 34 Scheme 2.5 Synthesis of 4-amino-4-deoxy-D-galactopyranoside ……………………………….. 35 Scheme 2.6 Synthesis of 6-amino-6-deoxy-D-galactopyranoside ……………………………….. 36 Scheme 2.7 Synthesis of 1-deoxy-D-azagalactose ………………………………………………………. 36 Scheme 2.8 Retrosynthesis of D-gulose derivative via stannylene intermediate ………… 38 Scheme 2.9 Selective protection of C3 hydroxyl in α-methoxy-galactopyronoside …….. 39 Scheme 2.10 Isomerization and subsequent deprotection of allyl group ……………………… 40 Scheme 2.11 Triflate intermediate route to C3 amine …………………………………………………. 40 Scheme 2.12 Retrosynthesis of 3-amino-3-deoxy-D-galactopyranoside via reductive
amination ……………………………………………………………………………………………….. 42 Scheme 2.13 Reductive amination route to C3 amine …………………………………………………. 42
xii
LIST OF ABBREVIATIONS
AA Antiagglomerant
AFGP Antifreeze glycoproteins
AFP Antifreeze protiens
DMSO Dimethyl sulfoxide
DSC Differential scanning calorimetry
FSH Follicle-stimulating hormone
IRI Ice recrystallization inhibition
J Coupling constant
KHI Kinetic hydrate inhibitor
LDHI Low dosage hydrate inhibitor
LH Luteinizing hormone
MGS Mean grain size
MHF Maximum heat of formation
MS Mass spectroscopy
NIS N-iodosuccinamide
NMO N-methyl morpholine
NMR Nuclear magnetic resonance
PBS Phosphate buffered saline
PMP para-methoxyl phenyl
PVCAP Polyvinyl caprolactam
PVP Polyvinyl pyrrolidone
TBAI Tetrabutylammonium iodide
xiii
TPAP Tetrapropylammonium perruthenate
TH Thermal hysteresis
THI Thermodynamic hydrate inhibitor

Chapter 1
General Introduction
2
1.1 Ice Recrystallization Inhibition
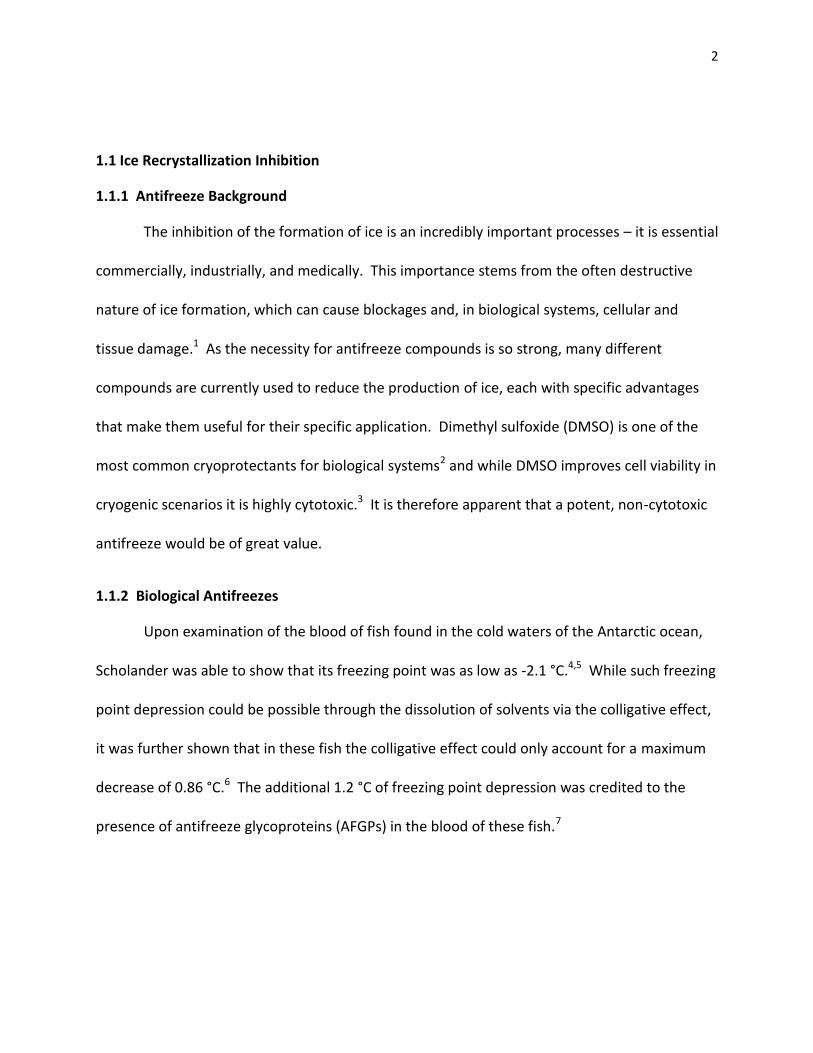
1.1.1 Antifreeze Background
The inhibition of the formation of ice is an incredibly important processes – it is essential
commercially, industrially, and medically. This importance stems from the often destructive
nature of ice formation, which can cause blockages and, in biological systems, cellular and
tissue damage.1 As the necessity for antifreeze compounds is so strong, many different
compounds are currently used to reduce the production of ice, each with specific advantages
that make them useful for their specific application. Dimethyl sulfoxide (DMSO) is one of the
most common cryoprotectants for biological systems2 and while DMSO improves cell viability in
cryogenic scenarios it is highly cytotoxic.3 It is therefore apparent that a potent, non-cytotoxic
antifreeze would be of great value.
1.1.2 Biological Antifreezes
Upon examination of the blood of fish found in the cold waters of the Antarctic ocean,
Scholander was able to show that its freezing point was as low as -2.1 °C.4,5 While such freezing
point depression could be possible through the dissolution of solvents via the colligative effect,
it was further shown that in these fish the colligative effect could only account for a maximum
decrease of 0.86 °C.6 The additional 1.2 °C of freezing point depression was credited to the
presence of antifreeze glycoproteins (AFGPs) in the blood of these fish.7
3
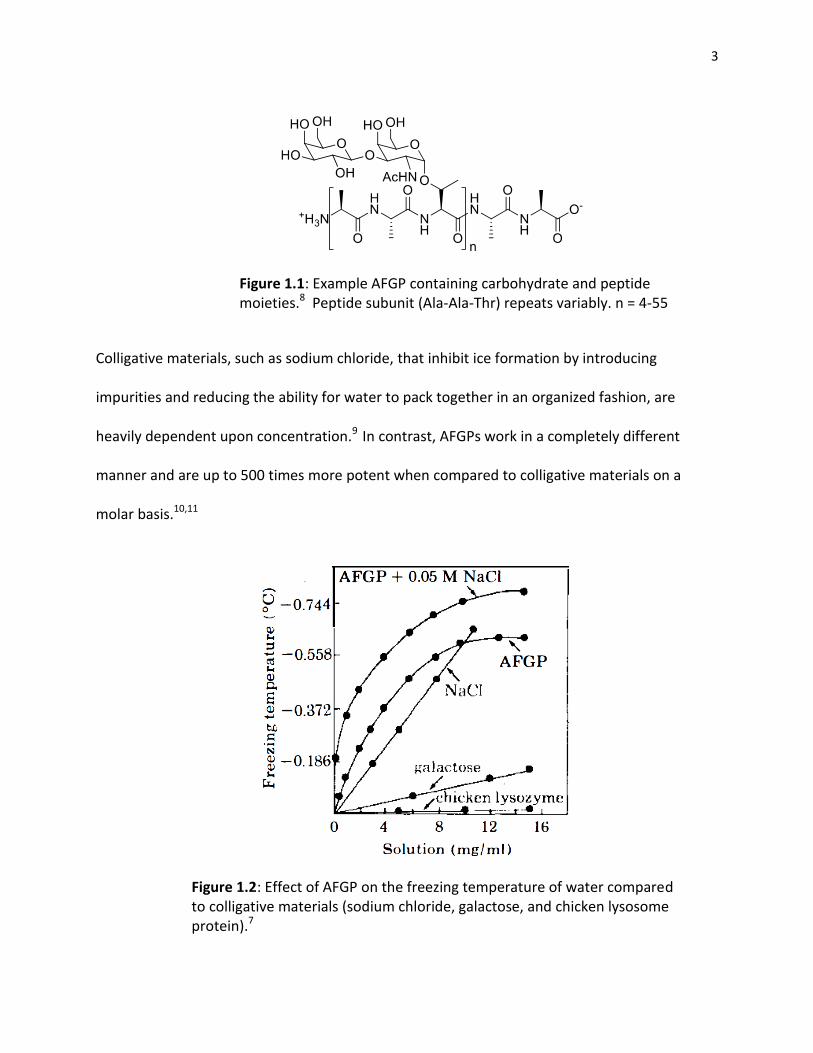
Figure 1.1: Example AFGP containing carbohydrate and peptide moieties.8 Peptide subunit (Ala-Ala-Thr) repeats variably. n = 4-55
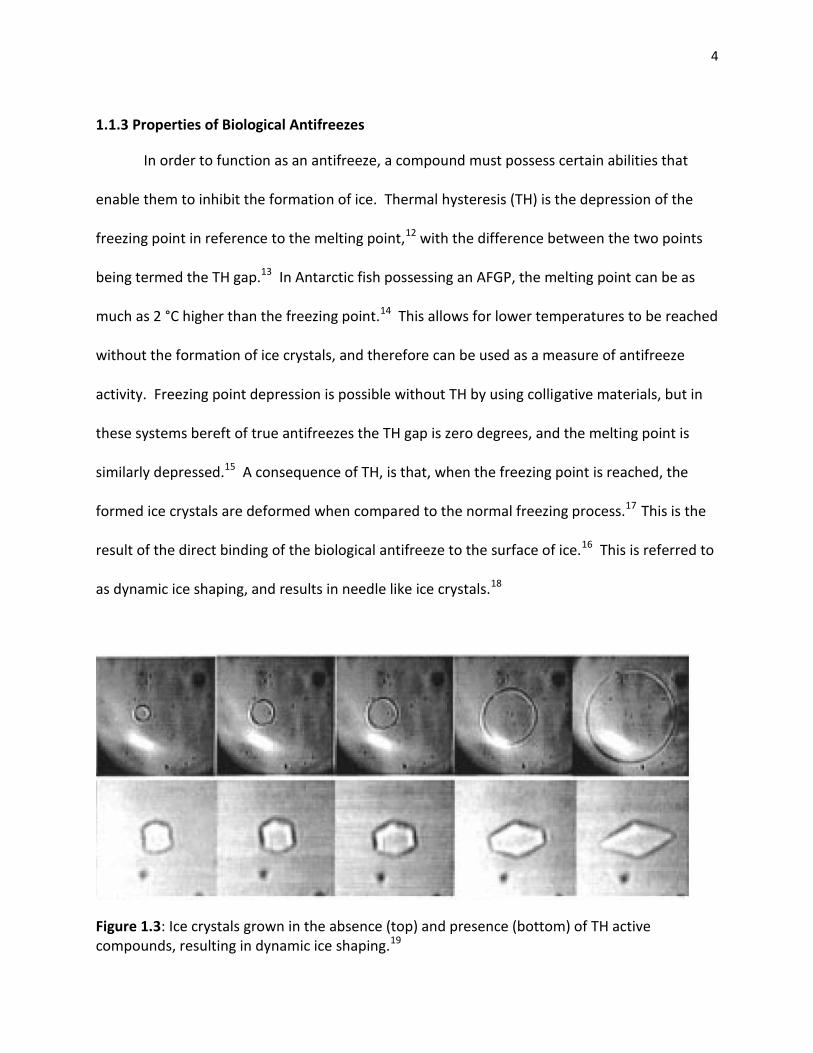
Colligative materials, such as sodium chloride, that inhibit ice formation by introducing
impurities and reducing the ability for water to pack together in an organized fashion, are
heavily dependent upon concentration.9 In contrast, AFGPs work in a completely different
manner and are up to 500 times more potent when compared to colligative materials on a
molar basis.10,11
Figure 1.2: Effect of AFGP on the freezing temperature of water compared to colligative materials (sodium chloride, galactose, and chicken lysosome protein).7
4
1.1.3 Properties of Biological Antifreezes
In order to function as an antifreeze, a compound must possess certain abilities that
enable them to inhibit the formation of ice. Thermal hysteresis (TH) is the depression of the
freezing point in reference to the melting point,12 with the difference between the two points
being termed the TH gap.13 In Antarctic fish possessing an AFGP, the melting point can be as
much as 2 °C higher than the freezing point.14 This allows for lower temperatures to be reached
without the formation of ice crystals, and therefore can be used as a measure of antifreeze
activity. Freezing point depression is possible without TH by using colligative materials, but in
these systems bereft of true antifreezes the TH gap is zero degrees, and the melting point is
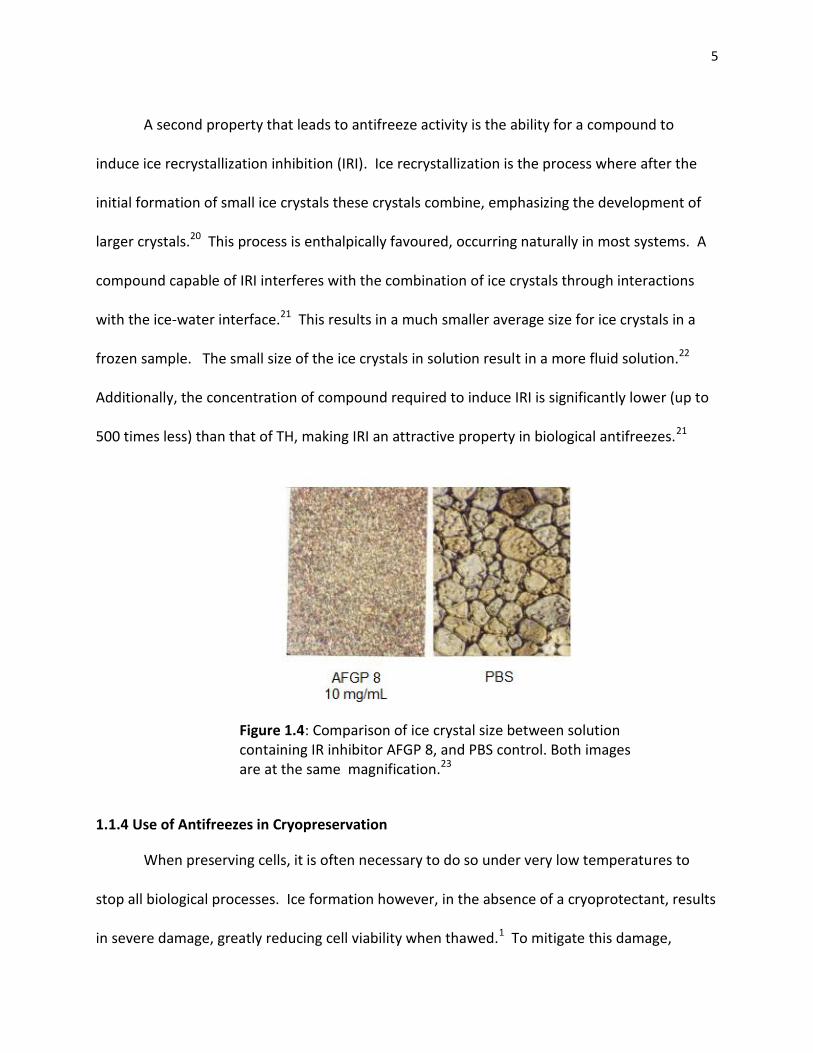
similarly depressed.15 A consequence of TH, is that, when the freezing point is reached, the
formed ice crystals are deformed when compared to the normal freezing process.17 This is the
result of the direct binding of the biological antifreeze to the surface of ice.16 This is referred to
as dynamic ice shaping, and results in needle like ice crystals.18
Figure 1.3: Ice crystals grown in the absence (top) and presence (bottom) of TH active compounds, resulting in dynamic ice shaping.19
5
A second property that leads to antifreeze activity is the ability for a compound to
induce ice recrystallization inhibition (IRI). Ice recrystallization is the process where after the
initial formation of small ice crystals these crystals combine, emphasizing the development of
larger crystals.20 This process is enthalpically favoured, occurring naturally in most systems. A
compound capable of IRI interferes with the combination of ice crystals through interactions
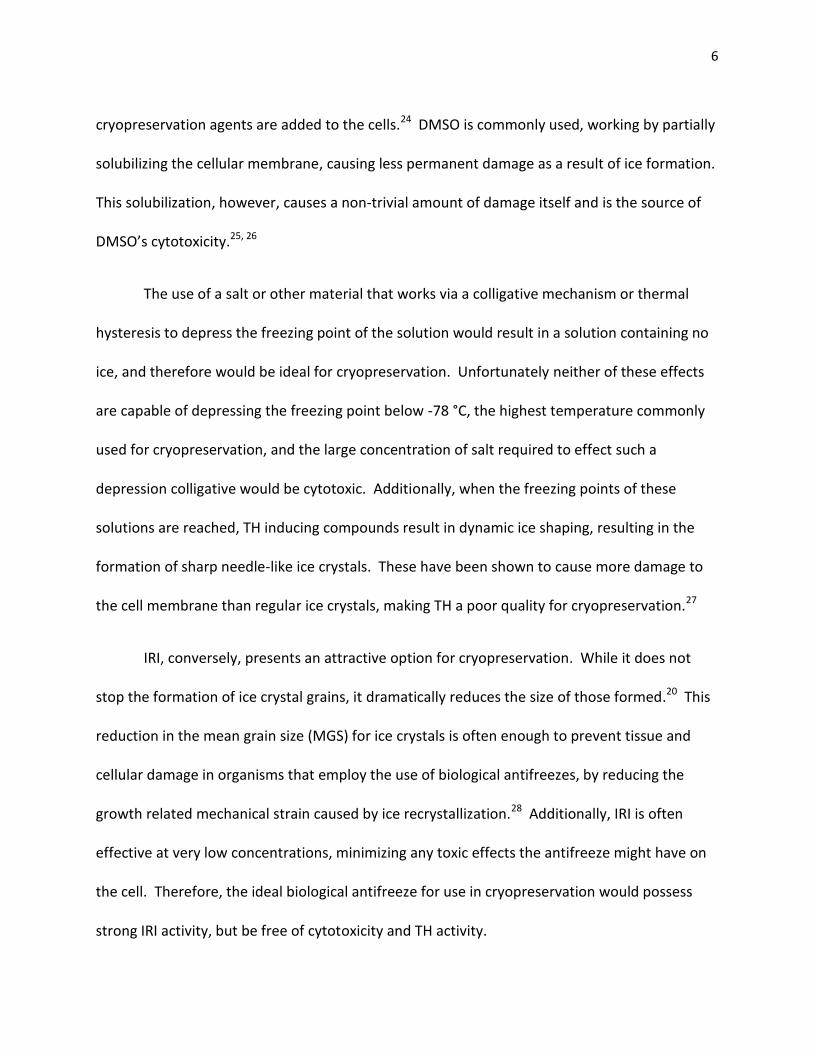
with the ice-water interface.21 This results in a much smaller average size for ice crystals in a
frozen sample. The small size of the ice crystals in solution result in a more fluid solution.22
Additionally, the concentration of compound required to induce IRI is significantly lower (up to
500 times less) than that of TH, making IRI an attractive property in biological antifreezes.21
Figure 1.4: Comparison of ice crystal size between solution containing IR inhibitor AFGP 8, and PBS control. Both images are at the same magnification.23
1.1.4 Use of Antifreezes in Cryopreservation
When preserving cells, it is often necessary to do so under very low temperatures to
stop all biological processes. Ice formation however, in the absence of a cryoprotectant, results
in severe damage, greatly reducing cell viability when thawed.1 To mitigate this damage,
6
cryopreservation agents are added to the cells.24 DMSO is commonly used, working by partially
solubilizing the cellular membrane, causing less permanent damage as a result of ice formation.
This solubilization, however, causes a non-trivial amount of damage itself and is the source of
DMSO’s cytotoxicity.25, 26
The use of a salt or other material that works via a colligative mechanism or thermal
hysteresis to depress the freezing point of the solution would result in a solution containing no
ice, and therefore would be ideal for cryopreservation. Unfortunately neither of these effects
are capable of depressing the freezing point below -78 °C, the highest temperature commonly
used for cryopreservation, and the large concentration of salt required to effect such a
depression colligative would be cytotoxic. Additionally, when the freezing points of these
solutions are reached, TH inducing compounds result in dynamic ice shaping, resulting in the
formation of sharp needle-like ice crystals. These have been shown to cause more damage to
the cell membrane than regular ice crystals, making TH a poor quality for cryopreservation.27
IRI, conversely, presents an attractive option for cryopreservation. While it does not
stop the formation of ice crystal grains, it dramatically reduces the size of those formed.20 This
reduction in the mean grain size (MGS) for ice crystals is often enough to prevent tissue and
cellular damage in organisms that employ the use of biological antifreezes, by reducing the
growth related mechanical strain caused by ice recrystallization.28 Additionally, IRI is often
effective at very low concentrations, minimizing any toxic effects the antifreeze might have on
the cell. Therefore, the ideal biological antifreeze for use in cryopreservation would possess
strong IRI activity, but be free of cytotoxicity and TH activity.
7
1.1.5 History of Ice Recrystallization Inhibitors
Biological antifreezes are potent inhibitors of ice recrystallization; however, while IRI is
the ideal property for use in cryopreservation, all biological antifreezes currently known display
both IRI and TH,29 making them unusable. This has led researchers to investigate materials
possessing similar qualities to the antifreezes devised by nature hoping to retain the desirable
IRI properties but eliminate TH.30 A variety of IR inhibitors were discovered, primarily consisting
of AFGP analogues and high molecular weight polymers; however, many of these compounds
still possessed TH activity, disqualifying them from practical use. Research by Ben in 2008
produced custom tailored AFGP analogues capable of IRI without TH,31 presenting the first
AFGP analogue capable of cryoprotection.32
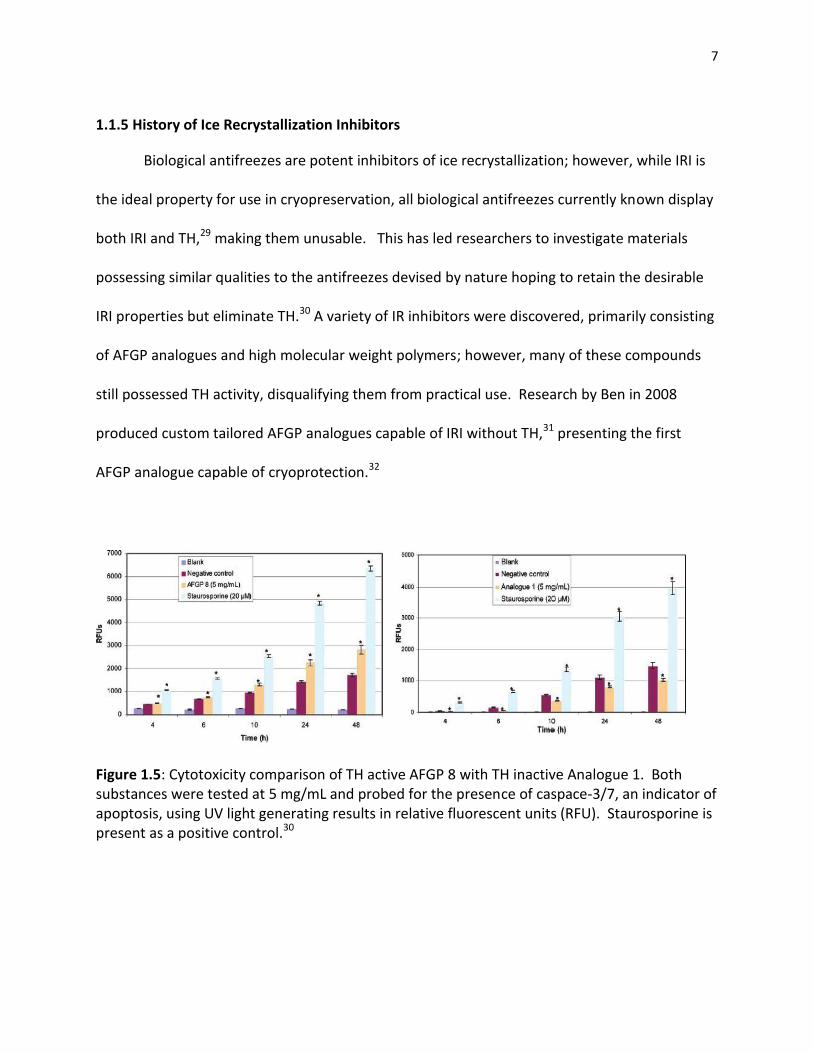
Figure 1.5: Cytotoxicity comparison of TH active AFGP 8 with TH inactive Analogue 1. Both substances were tested at 5 mg/mL and probed for the presence of caspace-3/7, an indicator of apoptosis, using UV light generating results in relative fluorescent units (RFU). Staurosporine is present as a positive control.30
8
AFGPs and their analogues are, however, large molecules with cost and time prohibitive
syntheses. Fortunately, carbohydrates have been proven to act as mild cryoprotectants,
showing modest IRI properties.33 Ben’s group was able to expand on this ability in simple mono-
and disaccharides by investigating their structural properties and capacity for practical use.34
This functionality is limited, requiring the addition of DMSO in order for cells to maintain
viability after a freeze-thaw cycle, but showed possibilities for the development of more potent
small molecule IR inhibitors.
1.1.6 Mechanism of Small Molecule Ice Recrystallization Inhibition
The Ostwald ripening that triggers ice recrystallization is a thermodynamic process; by
reducing the number of individual particles, the surface area of ice to water is reduced over all,
which in turn reduces the free energy associated with this interaction.20 One possible
mechanism for inhibition of this pathway involves disrupting the nature of the water at this
barrier by the adsorption of molecules onto the ice surface.21 Increasing the entropy of the
water around the small ice crystals reduces its ability to organize into the required
conformation for the formation of ice, resulting in the inhibition of IR. Through examining the
presence of IRI activity in simple carbohydrates, a correlation was made to the hydration
number of the compound.31 Hydration number represents the ability of the compound to bind
and hold water molecules while in a solution, with higher hydration numbered compounds
binding a greater number of water molecules.35,36 Binding water in this way allows these
compounds to interfere with the organization of the surrounding bulk water.37 This
disorganization has clear implications for the formation of ice crystals, and hydration number
9
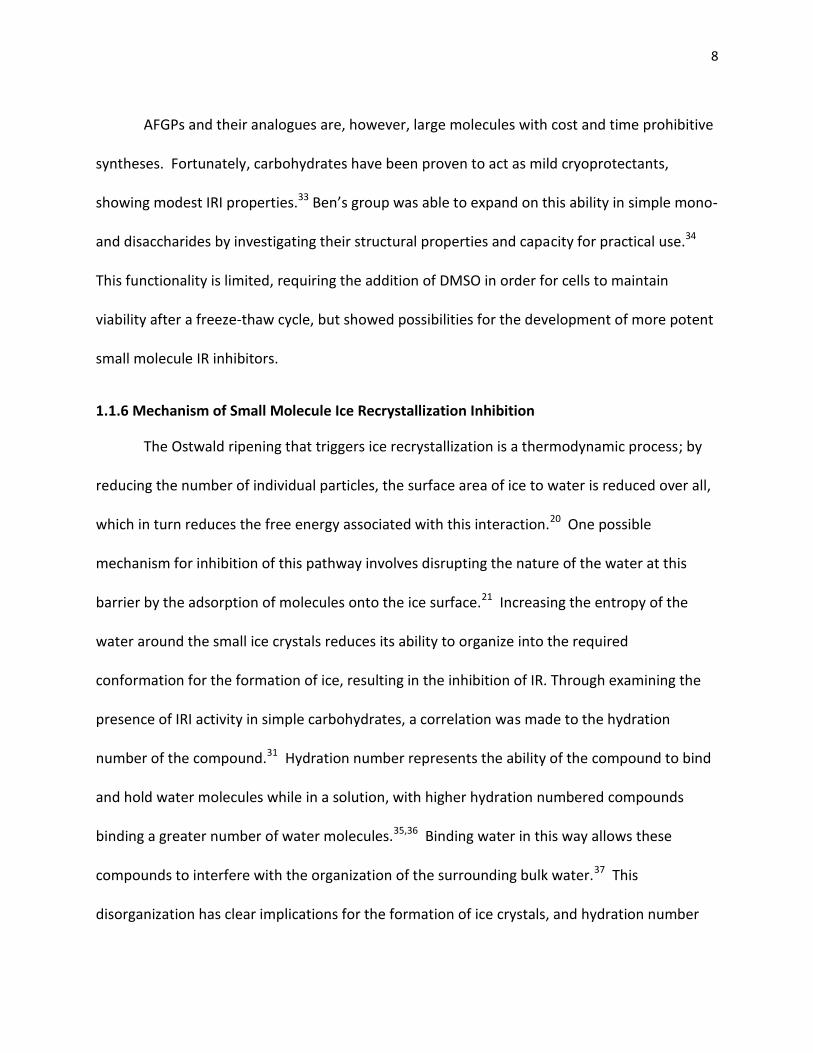
has been shown to have a degree of correlation with IRI activity, however the relationship
degrades when applied to larger molecules such as disaccharides (Figure 1.6).38
Figure 1.6: Ice recrystallization inhibition activity (MGS) compared to the hydration number of
various monosaccharides and disaccharides. Compounds tested at 22 mM concentration in
PBS.38
It is known that stereochemistry of carbohydrates controls their hydration number;
however molecular size also generally increases the hydration number of a compound.39 To
account for this, a “hydration index” was proposed, characterized as the hydration number
divided by the molar volume of the compound.38 This produces a scale that more concretely
corresponds with IRI potential, and can be used for estimations with all forms of sugars.
1.1.7 Potent Small Molecule Ice Recrystallization Inhibitors
Disturbing the arrangement of bulk water was shown to correspond with the ability for
a compound to inhibit IR, therefore surfactants and gelators were investigated for their
10
capacity for IRI. Surfactants are compounds that act at the barrier between two materials,40
and therefore were a logical choice to disrupt water around the forming solid ice crystal and the
surrounding bulk water. Monosaccharides had previously demonstrated limited activity, and
the structural properties related to their IRI activity had been investigated. Therefore
carbohydrate based surfactants were the first compounds to be tested. In the non-ionic
surfactant n-octyl-β-D-galactopyranoside (β-octyl gal), Ben (2012) was able to demonstrate the
first example of a highly potent and selective small molecule ice recrystallization inhibitor.41
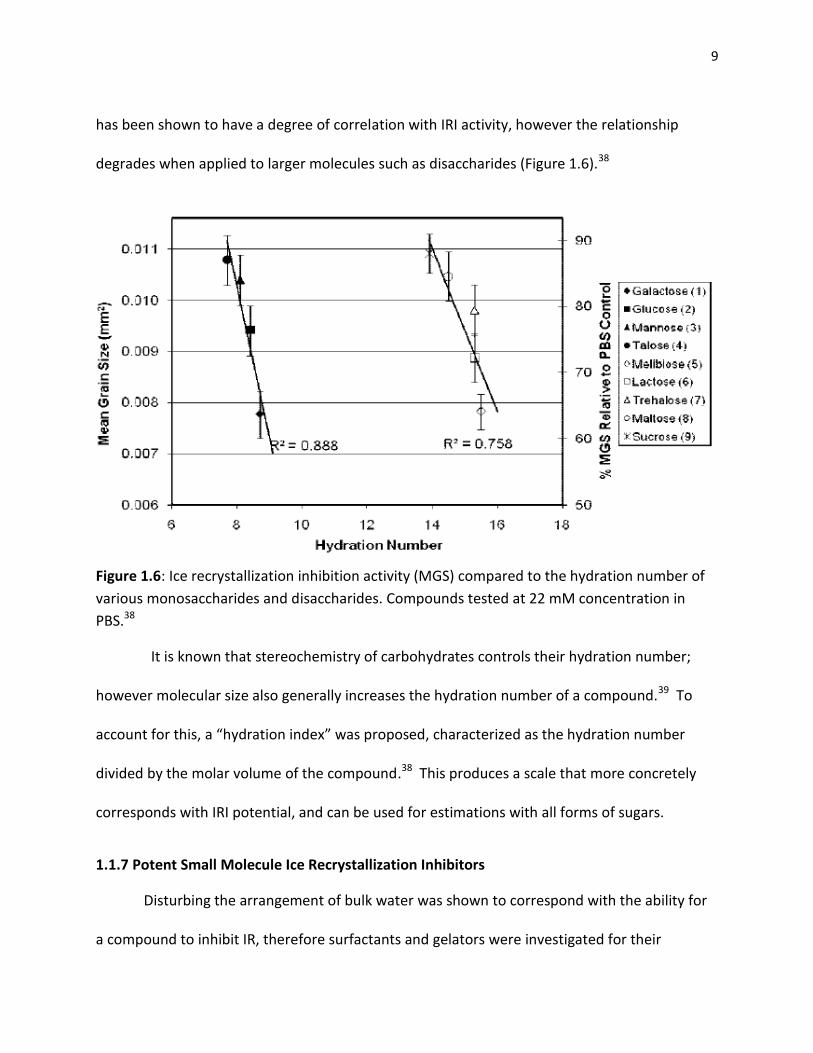
Since then many small molecules (Figure 1.7) have been developed by the Ben group with
varying degrees of IRI activity.
Figure 1.7: Modern potent IRI active small molecules. A (β-octyl gal), B (N-octyl glc), C (azagal), D (N-octanol glc), E (PMP-glc).
1.2 Inhibiting the Formation of Clathrate Hydrates
1.2.1 Clathrates
11
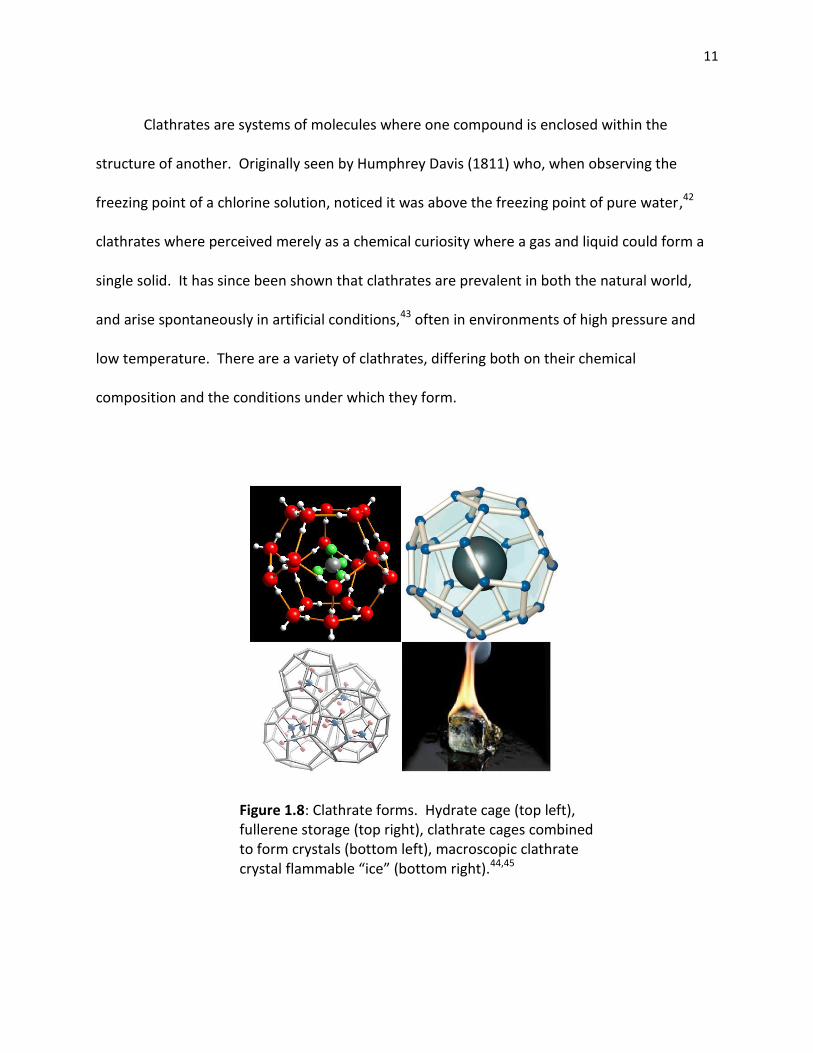
Clathrates are systems of molecules where one compound is enclosed within the
structure of another. Originally seen by Humphrey Davis (1811) who, when observing the
freezing point of a chlorine solution, noticed it was above the freezing point of pure water,42
clathrates where perceived merely as a chemical curiosity where a gas and liquid could form a
single solid. It has since been shown that clathrates are prevalent in both the natural world,
and arise spontaneously in artificial conditions,43 often in environments of high pressure and
low temperature. There are a variety of clathrates, differing both on their chemical
composition and the conditions under which they form.
Figure 1.8: Clathrate forms. Hydrate cage (top left), fullerene storage (top right), clathrate cages combined to form crystals (bottom left), macroscopic clathrate crystal flammable “ice” (bottom right).44,45
12
It is important to note when considering clathrates, that the relationship between the
cage and the enclosed molecule is not comprised of covalent bonding, and does not necessarily
proceed in a stoichiometric fashion.45 Clathrates do, however, create predictable structural
forms depending on the nature of the compounds involved.
1.2.2 Gas Hydrates
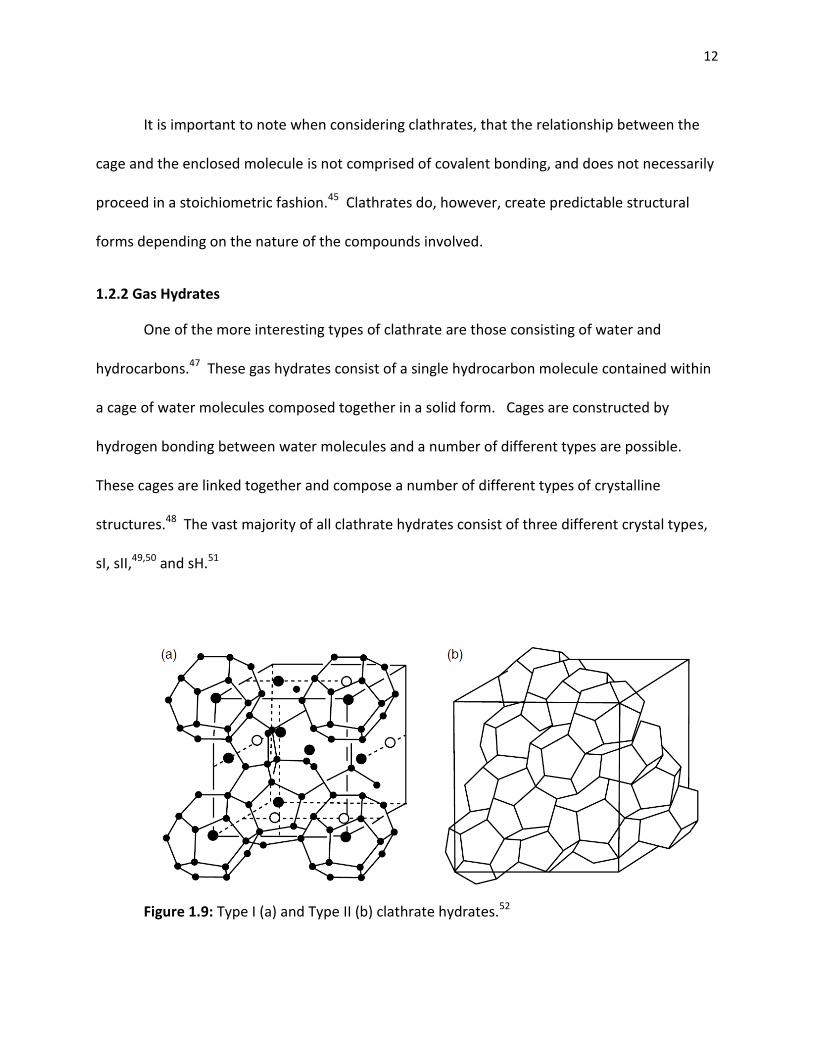
One of the more interesting types of clathrate are those consisting of water and
hydrocarbons.47 These gas hydrates consist of a single hydrocarbon molecule contained within
a cage of water molecules composed together in a solid form. Cages are constructed by
hydrogen bonding between water molecules and a number of different types are possible.
These cages are linked together and compose a number of different types of crystalline
structures.48 The vast majority of all clathrate hydrates consist of three different crystal types,
sI, sII,49,50 and sH.51
Figure 1.9: Type I (a) and Type II (b) clathrate hydrates.52
13
Type sI clathrates exist in systems where the guest molecule is between 4.2 and 6 Å in
diameter, including molecules such as methane. Type sII predominates when very small
molecules (<4.2 Å) such as helium, or larger butane sized molecules (>6 Å) are present.43 Finally,
type sH, the last major hydrate type to be discovered, can only exist when both a small and
large guest molecule is present.53 These preferences are due to the thermodynamic stability
afforded by the trapping of each size of guest molecule, and multiple forms can exist in the
same crystal for mixtures of gasses. Each type of hydrate possesses different physical
properties, with sI having a lower melting point than sII.43 However if each hydrate was filled to
maximum capacity with guest molecules, the mole fraction of guest to water would be identical
(0.85).54 In the majority of cases, however, the maximum capacity of a clathrate is not reached,
and it consists of a higher mole fraction of water.
1.2.3 Methane Clathrate
The simplest hydrocarbon, methane, is a particularly interesting example in the field of
hydrates. Methane, a small molecule, when hydrated exists primarily in the sI form, with only a
small amount (<1%) occurring as sII.55 These structures contain anywhere from 5.81 to 6.10
molecules of water per molecule of methane,55 making them rich in hydrocarbons. Originally it
was thought these materials existed naturally only in deep space where the methane
atmospheres and low temperatures required for their formation are prevalent. Exploration of
the oceans, however, revealed the presence of these methane hydrates below the sea floor, a
cold location under great pressure – ideal for clathrate formation.56 It has since been
determined that these compounds are extremely common and likely contain more bound
14
hydrocarbon than all current reserves on Earth.57 This makes them a very attractive resource
and many companies specializing in fuels have expanded their programs to account for this
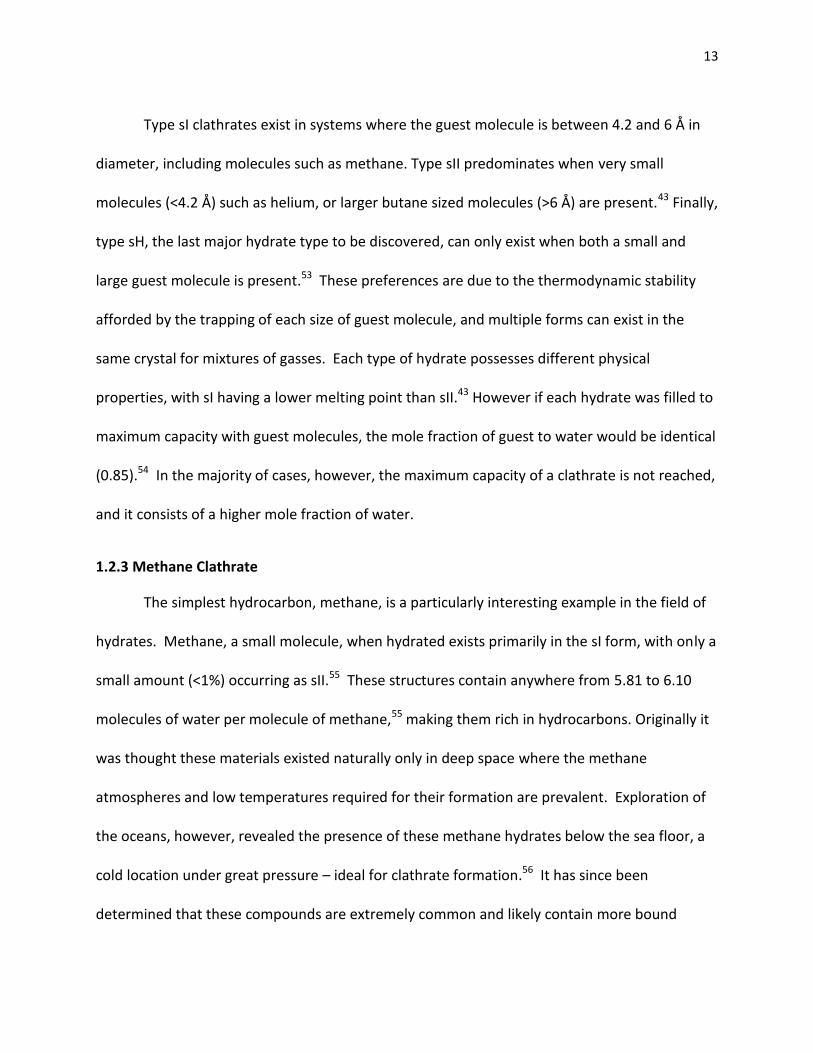
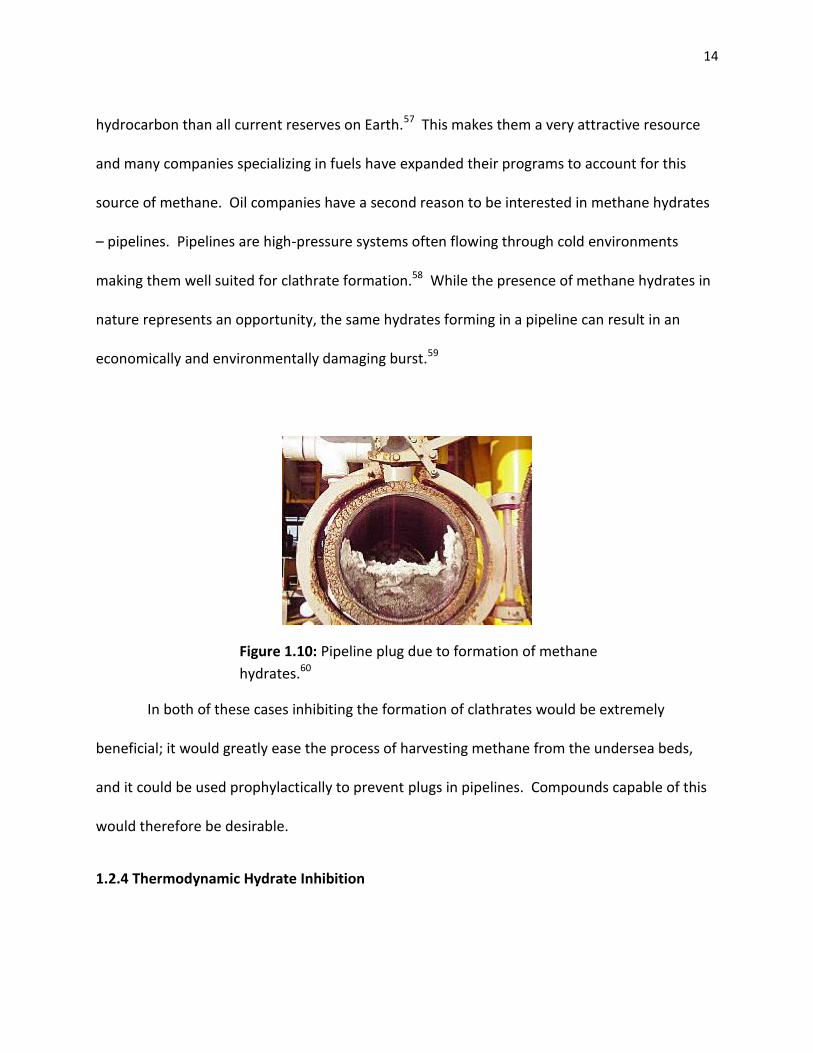
source of methane. Oil companies have a second reason to be interested in methane hydrates
– pipelines. Pipelines are high-pressure systems often flowing through cold environments
making them well suited for clathrate formation.58 While the presence of methane hydrates in
nature represents an opportunity, the same hydrates forming in a pipeline can result in an
economically and environmentally damaging burst.59
Figure 1.10: Pipeline plug due to formation of methane
hydrates.60
In both of these cases inhibiting the formation of clathrates would be extremely
beneficial; it would greatly ease the process of harvesting methane from the undersea beds,
and it could be used prophylactically to prevent plugs in pipelines. Compounds capable of this
would therefore be desirable.
1.2.4 Thermodynamic Hydrate Inhibition
15
The easiest way to inhibit clathrate formation is to add a compound that will lower the
freezing point of the methane clathrate, ideally lowering the freezing point below that of the
environmental surroundings, making clathrate formation thermodynamically disfavoured at
that temperature. Compounds that work in this manner, thermodynamic hydrate inhibitors
(THI), are similar to colligative compounds as they work relative to concentration and require
large volumes to be effective.61 Due to their innate limitations, using THIs is costly and
environmentally unfriendly. The most commonly used THI, methanol, cost oil companies $500
million on pipelines alone in 1995.62 In addition, using methanol in the harvesting process of
seabed clathrates would inject large volumes of a substance toxic to most animals into the
ocean. Much like the demand for IR inhibitors, a compound capable of inhibiting clathrate
formation reliably at low concentration would be extremely useful.
1.2.5 Low Dosage Hydrate Inhibition
As a result of the desire for a low dosage hydrate inhibitor (LDHI) a great deal of
research was carried out investigating compounds for these properties. A number of
compounds were discovered, with most of them falling into one of two classes:
antiagglomerants (AA) and kinetic hydrate inhibitors (KHI).63
16
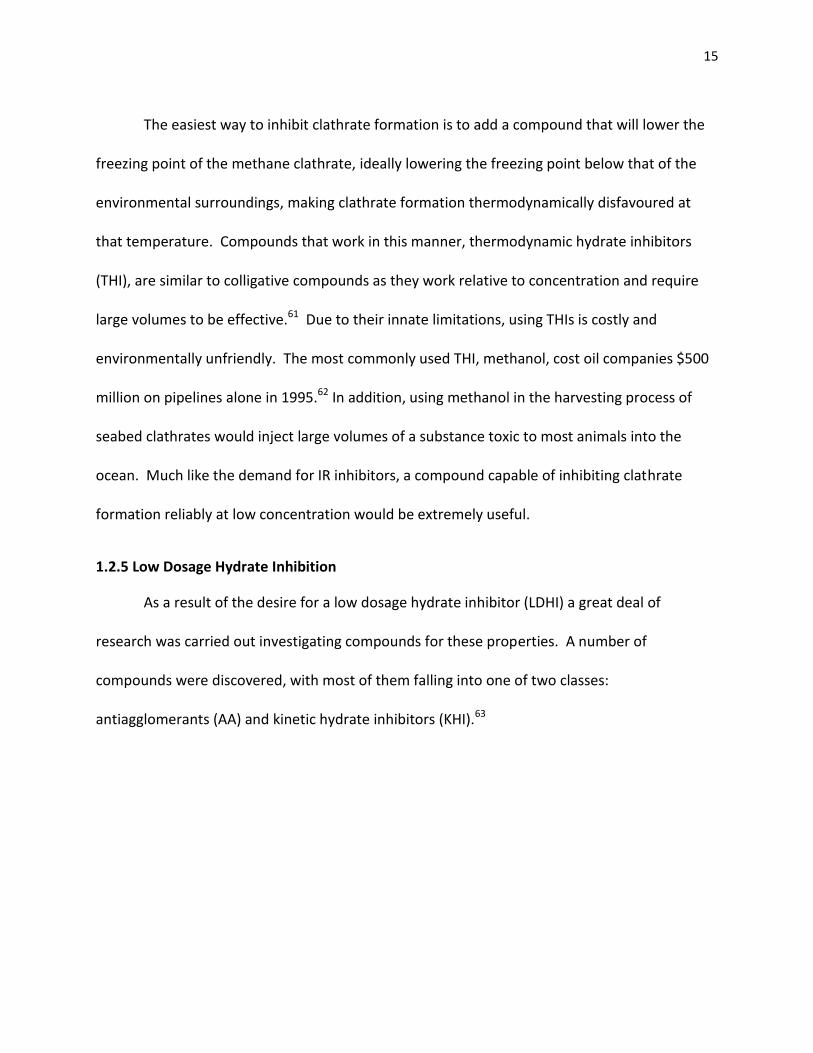
Figure 1.11: Progression of gas hydrate crystal formation. Inhibition occurs after cage formation (step A-B) disrupting the formation of crystal structures, as well as after structure formation (step B-C) disrupting the crystallization of macroscopic materials62.
1.2.5.1 Antiagglomerants
Antiagglomerants do not have any bearing on the formation of clathrates either in the
short term or the long term. However, they restrict the ability for the formed crystals to
interact with one another. The majority of antiagglomerants are either long chain polymers64
or ionic surfactants,65 and work by binding both to the formed crystal and to the surrounding
water. This restricts the amalgamation of crystals into larger crystals, resulting in a slurry
rather than a solid plug.66 The major drawback in the application of antiagglomerants is the
requirement for perpetual turbulence to maintain their activity.67 Without agitation the
crystals are allowed to settle together and their proximity will eventually outweigh the steric
repulsion afforded by the AA. This limits the application profile of AA compounds, leaving their
usage almost exclusively to the high flow environment of oil pipelines.
17
1.2.5.2 Kinetic Hydrate Inhibitors
Kinetic hydrate inhibitors (KHIs) work by interfering with the formation and initial
nucleation of the hydrate crystals.59 The complexes formed are not as stable as the undesired
hydrate but they are easier to form, greatly reducing the rate of clathrate formation. KHIs are
generally long chain polymers and function by introducing a piece of their structure into the
forming cages.68 This results in a cage incapable of binding to other cages, unable to accept the
guest methane molecule.69 These clathrates are therefore unable to arrange themselves into
the desired sI form for methane hydrates and thus are unable to crystallize into a solid. This
reduction in rate of nucleation would then prevent the formation of plugs in a pipeline
environment, as well as enable sea floor hydrates to be kept in the liquid phase.
1.2.6 Application of LDHI
While KHIs have notable advantages over THIs, until recently they have not been used
extensively in commercial settings. THIs have the advantage of being more established, with
existing equipment for their use in current oil recovery and pipelines.70 Additionally they have
a more studied and predictable mechanism of action while LDHI act in a more random
fashion.71 Therefore, to justify the adoption of KHIs into commercial processes disrupting the
industry, the economic and environmental benefits have to be extreme. The economic benefits
have begun to materialize in oil pipelines throughout the United States and Mexico,72-74 with
the use of polyvinyl pyrrolidone (PVP), polyvinyl caprolactam (PVCAP), and branched polyester
amides appearing as KHIs. Shell has also started to use AAs in their undersea pipelines, due to
concerns that constant exposure to low pressure and low temperatures would eventually
18
outweigh the properties of KHI.75 These materials have been shown to significantly reduce the
amount of methanol required to maintain flow rates and also decrease the requirement to
remove the methanol from the obtained materials. Additionally they have been shown to
increase the flow rate above that of THIs, making them not only economically superior from a
waste perspective but from a performance perspective as well.76 One issue remaining is that
environmental policies in many regions require the use of biodegradable materials when
dealing with ocean related practices.77 The majority of KHIs and AAs are high molecular weight
polymers and thus do not often meet these qualifications. A variety of biodegradable polymers
have been synthesized, but these materials are significantly less potent than previous KHIs.
1.3 Biological Antifreezes as Inhibitors of Clathrate Formation
1.3.1 Introduction
Biodegradable polymers link instinctively to proteins, one of the most obvious classes of
biological polymers. While hydrates are not a biological system, it is not a stretch to compare
the ability to inhibit ice with the ability to inhibit solid systems composed primarily of water. In
this regard investigations were made into the link between AFGPs and KHI. It was found that
AFGPs often possess potent KHI activity, consistent with the activity of the popular KHI PVCAP,
with the notable disadvantage of being more difficult to synthesize.78,79 Many of the tests
concerning the activity of AFGPs, however, were tested in systems using THF clathrate, which is
similar but not identical to the largely methane systems that will be encountered in practical
applications.
19
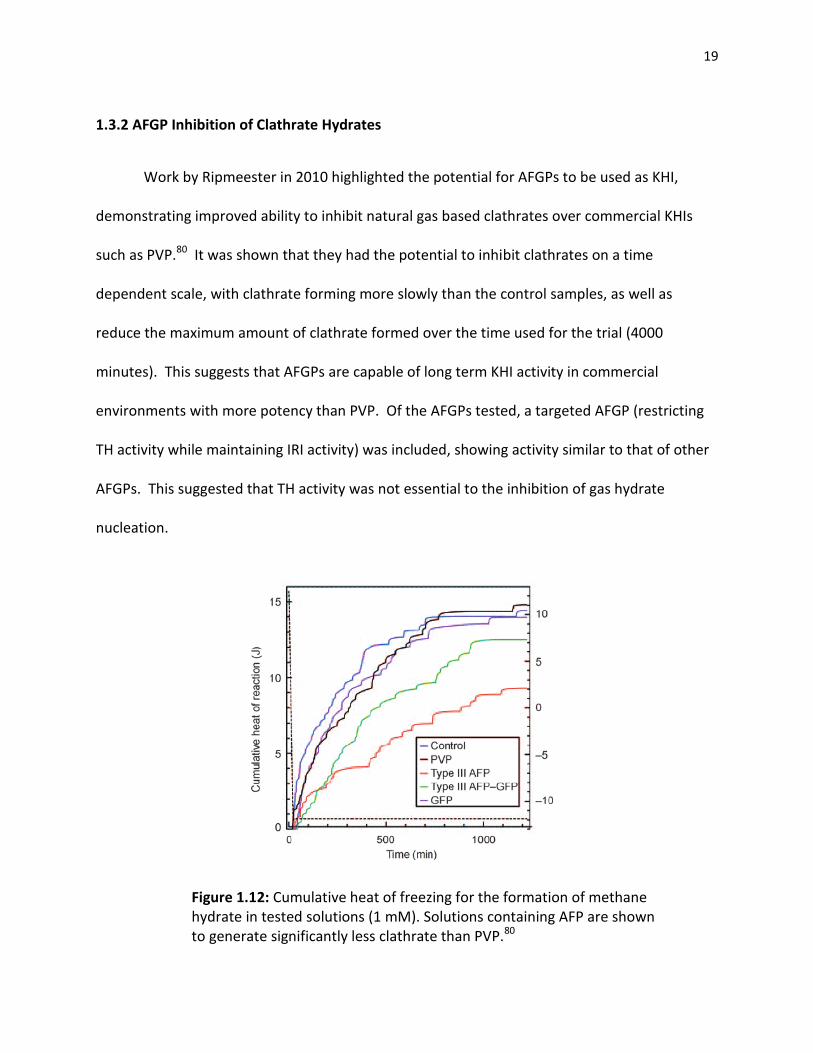
1.3.2 AFGP Inhibition of Clathrate Hydrates
Work by Ripmeester in 2010 highlighted the potential for AFGPs to be used as KHI,
demonstrating improved ability to inhibit natural gas based clathrates over commercial KHIs
such as PVP.80 It was shown that they had the potential to inhibit clathrates on a time
dependent scale, with clathrate forming more slowly than the control samples, as well as
reduce the maximum amount of clathrate formed over the time used for the trial (4000
minutes). This suggests that AFGPs are capable of long term KHI activity in commercial
environments with more potency than PVP. Of the AFGPs tested, a targeted AFGP (restricting
TH activity while maintaining IRI activity) was included, showing activity similar to that of other
AFGPs. This suggested that TH activity was not essential to the inhibition of gas hydrate
nucleation.
Figure 1.12: Cumulative heat of freezing for the formation of methane hydrate in tested solutions (1 mM). Solutions containing AFP are shown to generate significantly less clathrate than PVP.80
20
1.3.3 Small Molecule Inhibition of Methane Hydrate
All work on hydrate inhibition thus far has focused on the ability for polymers and
proteins to disrupt the forming clathrate crystal. However, these compounds have problems
with synthesis, isolation, and biodegradability. The ideal solution to this problem would be an
environmentally friendly small molecule hydrate inhibitor with similar potency profiles as
current KHI. If these compounds were able to work within the same molar basis, not only
would they be easier to develop commercially, but one would require a smaller mass percent of
active compound to solution. Interested in the possibilities presented by clathrate inhibition
using IRI specific AFGPs, the use of small molecule IRI active compounds were tested with
respect to their KHI potential.
21
References
1. Pegg, D.E. Semin. Reprod. Med. 2002, 20, 5
2. Baust, J.M., Van Buskirk, R., Baust, J.C. In Vitro Cell Dev. Biol. 2000, 36, 262
3. Yamashita S., Furubayashi T., Kataoka M., Sakane T., Sezaki H., Tokuda H., Eur. J. Pharm.
Sci. 2000, 10, 19
4. Cheng, C.H., Davies, P.L., Shear, M.A., Fletcher, G.L. Eur. J. Biochem. 1987, 168, 629
5. Feeny, R.E., Burcham, T.S., Yeh, Y. Ann. Rev. Biophys. Biophys. Chem. 1986, 15, 59
6. Scholander, P.F., Van Dam, L., Kanwisher, J.W., Hammel, H.T., Gordon, M.S. J. Cell Comp.
Phys. 1959, 49, 5
7. DeVries, A.L., Komatsu, S.K., Feeny, R.E. J. Biol. Chem. 1970, 245. 2901
8. Harding, M.M., Anderber, P.I., Heymet, A.D., Eur. J. Biochem. 2003, 270, 1381
9. DeVries, A.L., Wohlschlag, D. E. Science, 1969, 163, 1073
10. Duman, J.G., DeVries, A.L. Cryobiology 1972, 9, 469 �
11. Feeney, R.E., Yeh, Y. Adv. Protein Chem. 1978, 32, 191
12. Fletcher, G.L., Hew, C.L., Devrise, P.L. Annu. Rev. Phys.2001, 63, 35
13. Tysenko, M.G., Doucet, D., Davies, P.L., Walker, V.K., Nat. Biotech. 1997, 15, 887
14. Dumas, J.G. Annu. Rev. Phys. 2001, 63, 327
15. Hammel, H.T. Science 1976, 192, 748
16. Tomimatsu, Y., Scherer, J., Yeh, Y., Feeney, R.E. J. Biol. Chem. 1976, 251, 2290
17. Yang, D.S.C., Sax, M., Chakarbartty, A., Hew, C.L. Nature 1988, 333, 232
18. DeVries, A.L., Science, 1971, 172, 1152
19. Haymet, A.D.J., Ward,L.G., Harding, M.M. J. Am. Chem. Soc. 1999, 121, 941
20. Kuiper, M.J., Davies, P.L., Walker, V.K. Biophys. J.2001, 81, 3560
21. Knight, C.A., Wen, D., Laursen, R.A., Cryobiology 1995, 32, 23
22. Chao, H., Davies, P.L., Carpenter, J.F. J. Exp. Biol. 1996, 199, 2071.
23. Enaide, A., Ben, R.N. Biomacromolecules 2001, 2, 557
24. A.M. Karow, J. Pharm. Pharmac. 1969 21, 209-223.
22
25. Liseth, K., Abrahamsen, J. F., Bjørsvik, S., Grøttebø, K., and Bruserud, Ø. Cytotherapy,
2005, 7, 328
26. Konuma, T., Ooi, J., Takahashi, S., Tomonori, A., Tsukada, T.,Kobayashi, T., Sato, S., Kato,
S., S., K., Ebihara, Y., Nagamura-Inoue, T.,Tsuji, K., Tojo, A., and Asano, S. Bone Marrow
Transplant 2008, 41, 861
27. Wang, T., Zhu, Q., Yang, X., Layne, J. R., and Devries, A. L. Cryobiology, 1994, 31, 185
28. Carpenter, J. F., and Hansen, T. N. Proc. Natl. Acad. Sci. U.S.A. 1992, 89,8953
29. Ben, R. N. ChemBioChem 2001, 2, 161
30. Liu, S., Wang, W., vonMoos, E., Jackman, J., Mealing, G., Monette, R., Ben, R. N.
Biomacromolecules 2007, 8, 1456
31. Czechura, P., Tam, R., Dimitrivjevic, E., Murphy, A.V., Ben, R. N. J. Am. Chem. Soc. 2008,
130, 2928.
32. Leclere, M., Kwok, B., Wu, L.K., Allan, D.S., Ben, R.N. Bioconjugate Chemistry 2011, 22,
1804
33. Yeh, Y., Feeney, R. E. Chem. Rev. 1996, 96, 601
34. Chaytor, J.L., Ben, R.N. Bioorg. Med. Chem. Lett. 2010, 20, 5251
35. Danford, M. D.; Levy, H. A. J. Am. Chem. Soc. 1962, 84, 3965
36. Warner, D. T. Nature 1962, 196, 1055
37. Galema, S. A., Høiland, H. J. Phys. Chem. 1991, 95, 5321
38. Tam, R., Czechura, P., Ferreria, S. S., Chaytor, J., Ben, R. N., J. Am. Chem. Soc. 2008, 130,
17494
39. Walkinshaw, M. D. J. Chem. Soc., Perkin Trans. 2 1987, 1903
40. Lorber,B., Bishop, J.B., DeLucas, L.G., Biochim. Biophys. Acta, Biomembr. 1990, 1023, 254
41. Capicciotti, C.J., Leclere, M., Perras, F.A., Bryce, D.L., Paulin, H., Harden, J., Lui, Y., Ben,
R.N. Chem. Sci. 2012, 3, 1408
42. Davy, H., Phil. Trans. Roy. Soc. Lond.,1811, 101, 1
43. Sloan, E. D., Koh, C, 1997, Clathrate Hydrates of Natural Gases, Third Edition
44. Fletcher, G.L., Hew, C.L., Devrise, P.L. Annu. Rev. Phys.2001, 63, 35
23
45. Kelland, M.A., Svartås, T.M., Ovsthus, J., Tomita, T., Chosa, J. Chem. Eng. Sci. 2006, 61,
4048
46. Roberts, O. L., Brownscombe, E. R., Howe, L. S., Ramser, H. Petrol. Eng. 1941, 12, 56
47. Villard, P., Compt. Rend.1896, 123, 337
48. von Stackelberg, M., Müller, H.R., Naturwiss, 1951, 38, 456
49. Pauling, L., Marsh, R.E., Proc. Natl Acad. Sci. USA, 1952, 38, 112
50. Claussen,W.F., J. Chem. Phys., 1951, 19, 662
51. Ripmeester, J. A., Tse, J. S., Ratcliffe, C. I. and Powell, B. M., Nature, 1987, 325, 135
52. McMullan, R.K., Jeffrey, G.A., J. Chem. Phys. 1965, 42, 2725
53. Udachin, K.A., Enright, G.D., Ratcliffe, C.I., Ripmeester, J.A., J. Am. Chem. Soc. 1997, 119,
11481
54. Jeffrey, G.A., McMullan, R.K., Prog. Inorg. Chem., 1967, 8, 43
55. Circone, S., Kirby, S.H., Stern, L.A. J. Phys. Chem. B 2005, 109, 9468
56. Kvenvolden, K., Organic Geochemistry, 1995, 23, 997
57. Mahajan. D, Taylor, C.E., Mansoori, G.A., J. Pet. Sci. Eng., 2007, 56, 1
58. Hammerschmidt,E.G., Industrial Engineering & Chemistry, 1934, 26, 851
59. Kelland, M.A, Energy Fuels, 2006, 20, 825
60. Villano, L. D., Kommedal, R., Kelland, M. A. Energy Fuels 2008,22, 3143
61. Kelland, M.; Svartaas, T. M.; Dybik, L. SPE Offshore Europe Conference; Aberdeen, 1995
(SPE 30420)
62. Lederhos, J.P., Long, J. P., Sum,A., Christiansen, R.L, Sloan Jr., E.D., Chem. Eng. Sci. 1996,
51, 1221
63. Kelland, M.A., Svartås, T.M., Ovsthus, J., Tomita, T., Mizuta, K. Chem. Eng. Sci. 2006, 61,
4290
64. Behar, P., Kessel, D., Sugier, A., Thomas, A., 1991. “Advances in hydrate control.”
Proceedings of the 70th gas processors association conference, San Antonio, March 11–
12.
65. Kelland, M.A., Svartås, T.M., Ovsthus, J., Tomita, T., Chosa, J. Chem. Eng. Sci. 2006, 61,
4048
24
66. Huo, Z., Freer, E., Lamar, M., Sannigrahi, B., Knauss, D.M., Sloan, E.D., Chem. Eng. Sci.
2001, 56, 4979.
67. Kelland, M.A., Svartås, T.M., Andersen, L.D., J. Pet. Sci. Eng., 2009, 64, 1
68. Kvamme, B., Kuznetsova, T., Aasoldesen, K. J. Mol. Graph. Mod. 2005, 23, 524
69. Ajiro, H., Takemoto, Y., Akashi, M., Chua P.C., Kelland, M.A. Energy Fuels 2010, 24, 6400
70. Villano, L. D., Kommedal, R., Kelland, M. A. Energy Fuels 2008,22, 3143
71. Jensen, L., Thomsen, K., von Solms, N., Energy Fuels, 2011, 25, 17
72. Argo, C. B.; Blaine, R. A.; Osborne, C. G. ; Priestly, I. C. In Proceedings of the SPE
International Symposium on Oilfield Chemistry,Houston, TX, February 1997; SPE 37255.
73. Talley, L. D.; Mitchell, G. F. In Proceedings of the 30th Annual Offshore Technology
Conference, Houston TX, May 3-6, 1998; OTC 11036.
74. Fu, S. B.; Cenegy, L. M.; Neff, C. In Proceedings of the SPE International Symposium on
Oilfield Chemistry, Houston, TX, Feb 13-16, 2001; SPE 65022
75. Klomp, U.C., Kruka, V.C., Reijnhart, R., 1995. World Patent Application WO 95/17579.
76. Phillips, N., “Case Study on ETAP”, Controlling Hydrates, Waxes and Asphaltenes, IBC
Conference, Oslo, 7-8 December 1998
77. Villano, L.D., Kommedal, R., Fijten, M.W.M., Schubert, U.S., Hoogenboom, R., Kelland,
M.A., Energy and Fuels 2009, 23, 3665
78. H. Zeng, L. D. Wilson, V. K. Walker, J. A. Ripmeester, Can. J. Phys. 2003, 81, 17
79. H. Zeng, L. D. Wilson, V. K. Walker, J. A. Ripmeester, J. Am. Chem. Soc. 2006, 128, 2844
80. Ohno, H., Susilo, R., Gordienko, R., Ripmeester, J., Walker, V.K. Chem. Eur. J. 2010, 16,
10409
25
Chapter 2
Synthesis of Amine Carbohydrates
26
2.1 – Hydration and Ice Recrystallization Inhibition
Assessing the ability of various carbohydrates to inhibit ice recrystallization has
suggested that the degree of hydration of the molecule influences its capacitance for IRI
activity.1 Historically, hydration number, which corresponds to the number of water molecules
that are hydrogen bonded per molecule, has been used to represent hydration.2 However,
research by our lab has shown that the relationship between hydration number and IRI
degrades when larger molecules are considered.3 It can be shown that disaccharides exhibit
twice the hydration number of their respective monosaccharides, but with equal capacity for
IRI. To account for this, “hydration index”, or hydration number divided by partial molar
volume, was devised as a more accurate predictor of IRI.4 Increases in the hydration index, or
lower ability to fit the carbohydrate within bulk water, correlate with increased IRI ability.5
Previous work has highlighted the importance of carbohydrate stereochemistry in its
relationship with bulk water resulting in differences in hydration of the molecule.6 Specifically,
the ability of a carbohydrate to “fit” within the three dimensional hydrogen bonded network of
water structure depends on the orientation between the hydroxyl groups on the pyranose ring.
If the distances between the groups correspond to the distances between the hydroxyls in bulk
water then the carbohydrate is easily incorporated into the structure of water, resulting in a
low hydration number.7 These distances have been shown to depend largely on the orientation
of the C2 and C4 hydroxyls in pyranose rings, with the three possible distances relating to three
different hydrations.6 When the C2 hydroxyl is equatorial and C4 hydroxyl is axial, as in
galactose (1), the fit with bulk water is very poor, resulting in an increased hydration. Our
laboratory has demonstrated that this translates directly to a high degree of IRI activity. Given
27
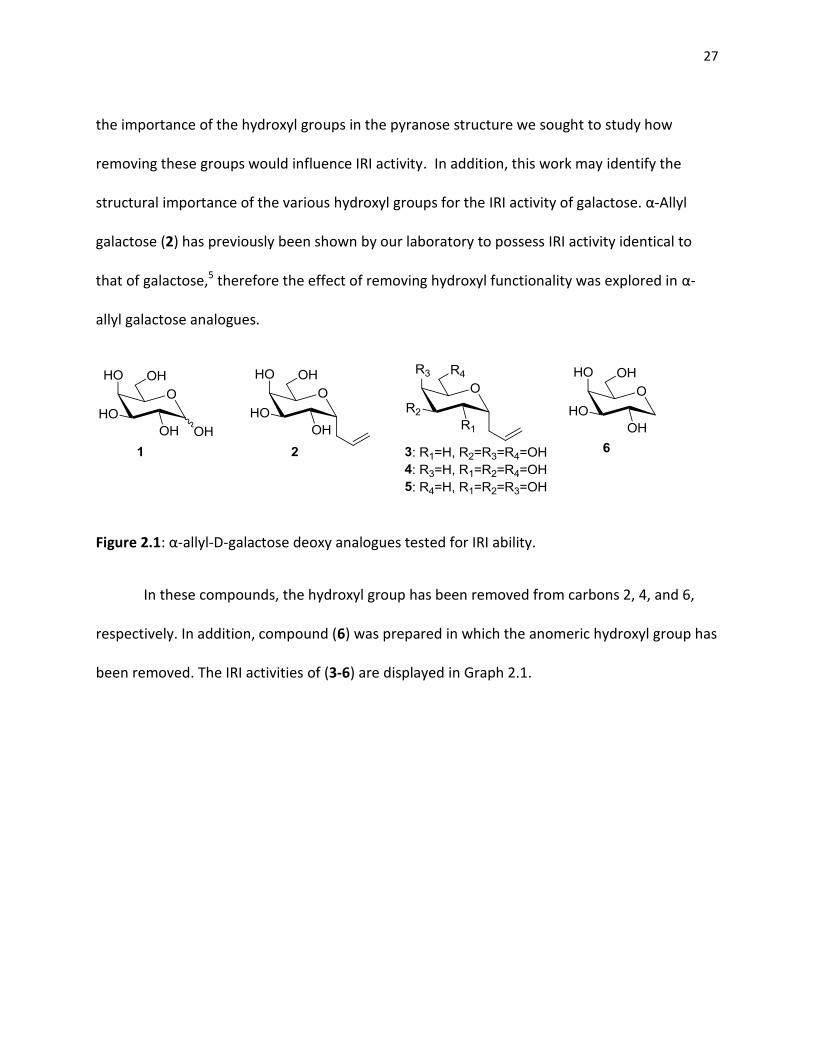
the importance of the hydroxyl groups in the pyranose structure we sought to study how
removing these groups would influence IRI activity. In addition, this work may identify the
structural importance of the various hydroxyl groups for the IRI activity of galactose. α-Allyl
galactose (2) has previously been shown by our laboratory to possess IRI activity identical to
that of galactose,5 therefore the effect of removing hydroxyl functionality was explored in α-
allyl galactose analogues.
Figure 2.1: α-allyl-D-galactose deoxy analogues tested for IRI ability.
In these compounds, the hydroxyl group has been removed from carbons 2, 4, and 6,
respectively. In addition, compound (6) was prepared in which the anomeric hydroxyl group has
been removed. The IRI activities of (3-6) are displayed in Graph 2.1.
28
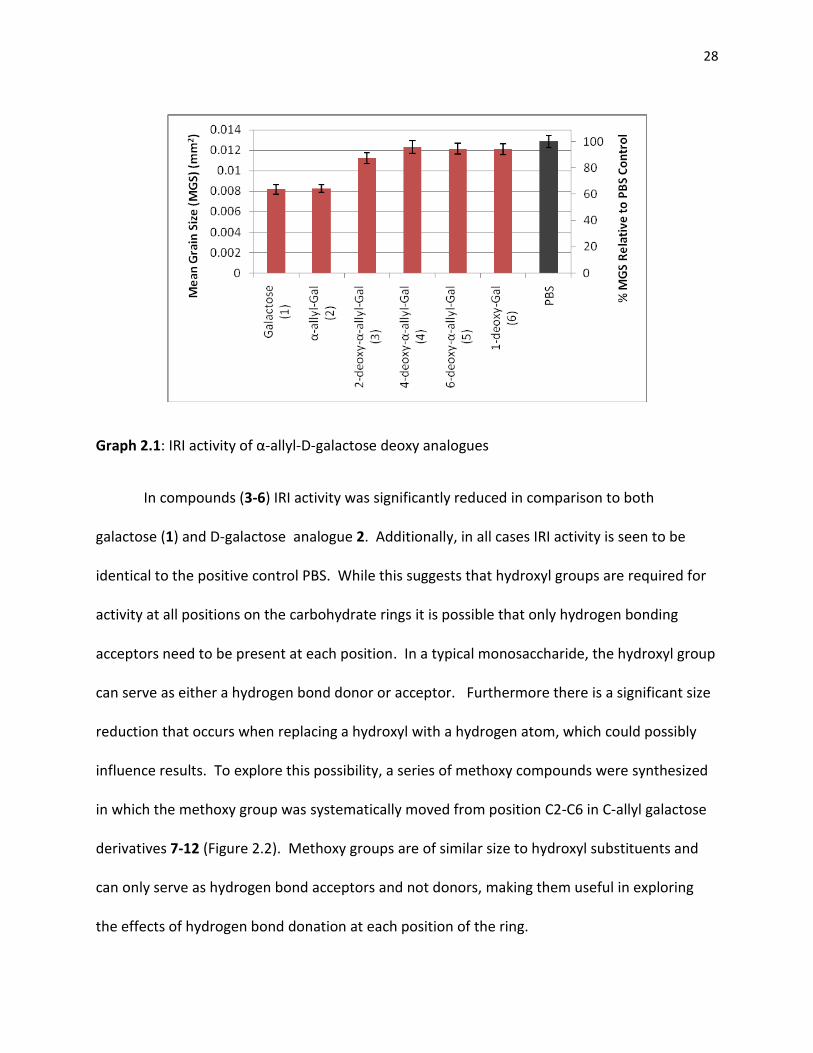
Graph 2.1: IRI activity of α-allyl-D-galactose deoxy analogues
In compounds (3-6) IRI activity was significantly reduced in comparison to both
galactose (1) and D-galactose analogue 2. Additionally, in all cases IRI activity is seen to be
identical to the positive control PBS. While this suggests that hydroxyl groups are required for
activity at all positions on the carbohydrate rings it is possible that only hydrogen bonding
acceptors need to be present at each position. In a typical monosaccharide, the hydroxyl group
can serve as either a hydrogen bond donor or acceptor. Furthermore there is a significant size
reduction that occurs when replacing a hydroxyl with a hydrogen atom, which could possibly
influence results. To explore this possibility, a series of methoxy compounds were synthesized
in which the methoxy group was systematically moved from position C2-C6 in C-allyl galactose
derivatives 7-12 (Figure 2.2). Methoxy groups are of similar size to hydroxyl substituents and
can only serve as hydrogen bond acceptors and not donors, making them useful in exploring
the effects of hydrogen bond donation at each position of the ring.
29
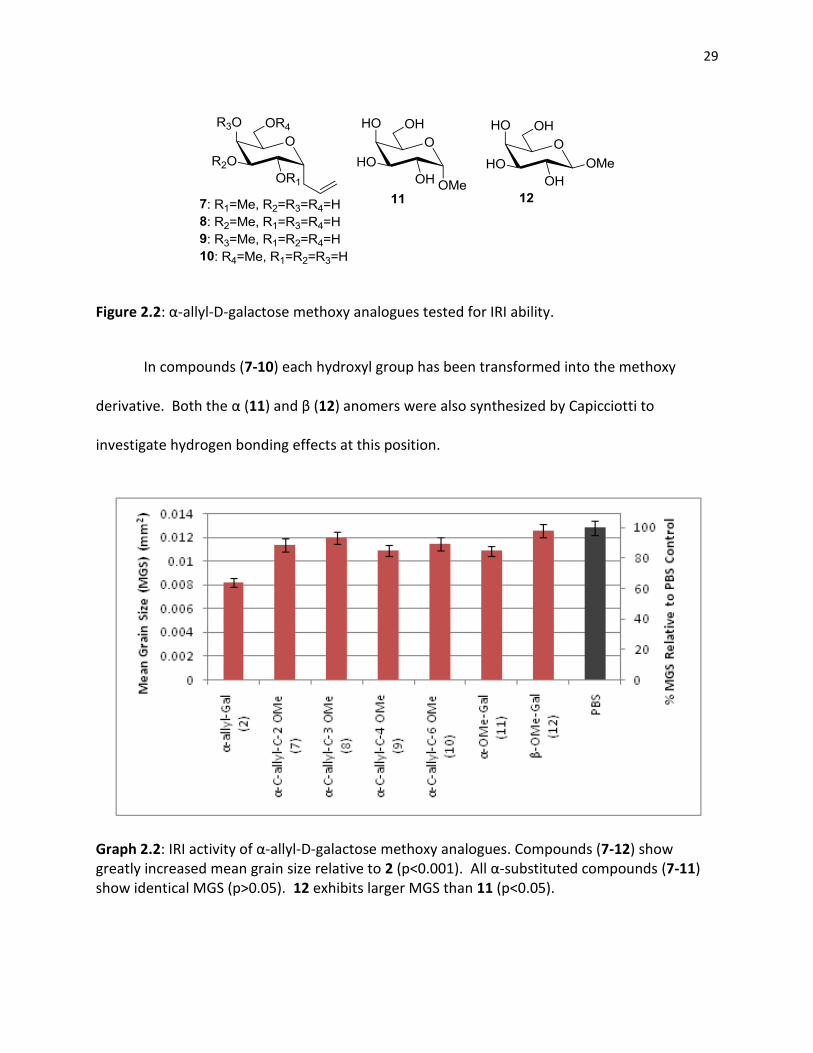
Figure 2.2: α-allyl-D-galactose methoxy analogues tested for IRI ability.
In compounds (7-10) each hydroxyl group has been transformed into the methoxy
derivative. Both the α (11) and β (12) anomers were also synthesized by Capicciotti to
investigate hydrogen bonding effects at this position.
Graph 2.2: IRI activity of α-allyl-D-galactose methoxy analogues. Compounds (7-12) show greatly increased mean grain size relative to 2 (p<0.001). All α-substituted compounds (7-11) show identical MGS (p>0.05). 12 exhibits larger MGS than 11 (p<0.05).
30
All tested compounds (7-12) demonstrated significantly less IRI activity than galactose
(1). The IRI activity differences seen between (11) and (12) were predicted by their hydration
numbers as calculated by Galema,6 with the β derivative displaying both lower hydration
number and IRI ability. Additionally no regiospecific effects were seen with respect to the ring
hydrogen as compounds (7-10) showed statistically identical activities, suggesting a
requirement for hydrogen bond donation for the presence of IRI activity. It is known, however,
that the presence of hydrophobic regions on a molecule increases the ordering of water around
the molecule7, resulting in the degree of hydration being decreased in more hydrophobic
compounds. In this regard the presence of the methyl group may not reduce IRI through the
inhibition of the hydrogen bond donation, but instead through its own hydrophobic ordering of
bulk water. Unfortunately it is not possible to investigate the effects of substituting
hydrophobic groups without inhibiting the capacity for oxygen to donate hydrogen bonds. In
this regard N-acetyl derivatives, which contain both a large hydrophobic region and the capacity
to donate hydrogen bonds, and their respective amines were considered for investigation.
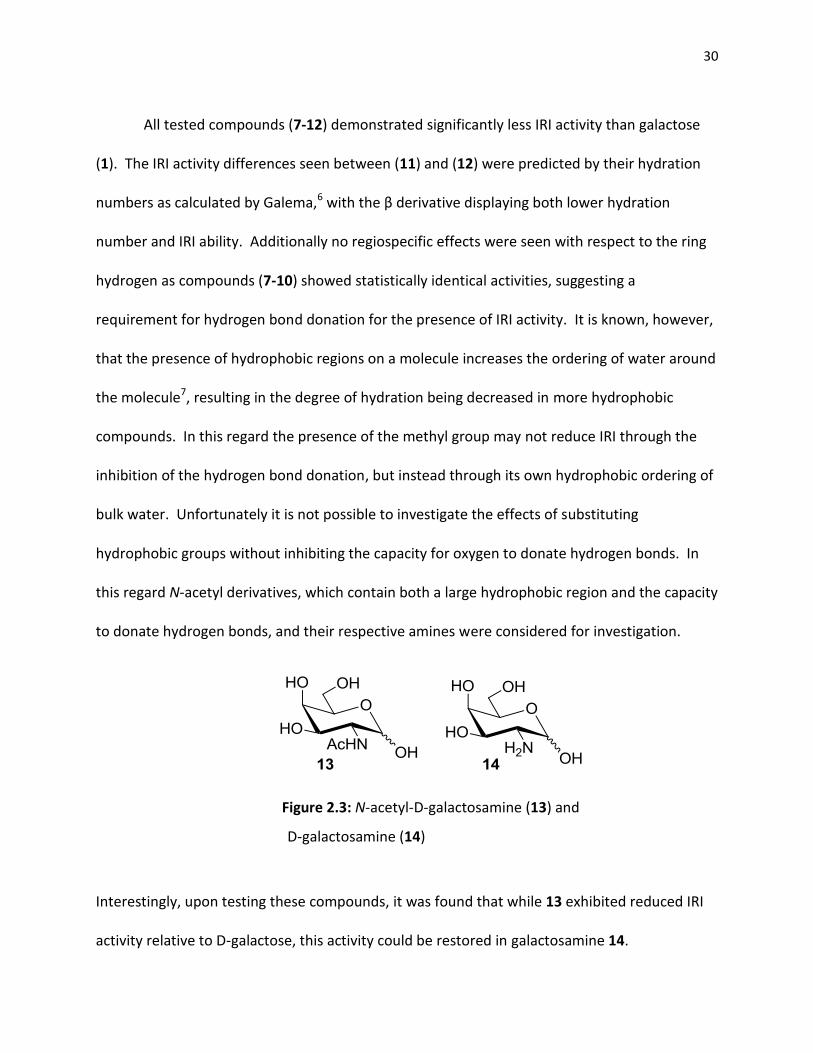
Figure 2.3: N-acetyl-D-galactosamine (13) and
D-galactosamine (14)
Interestingly, upon testing these compounds, it was found that while 13 exhibited reduced IRI
activity relative to D-galactose, this activity could be restored in galactosamine 14.
31
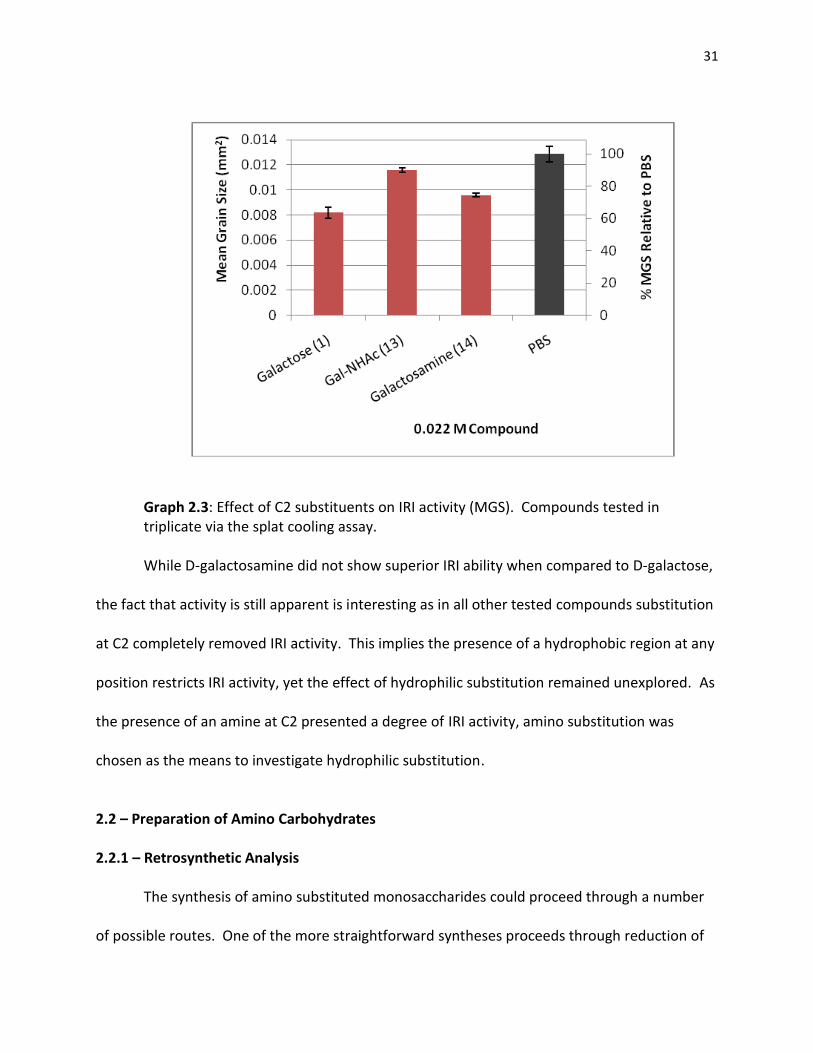
Graph 2.3: Effect of C2 substituents on IRI activity (MGS). Compounds tested in triplicate via the splat cooling assay.
While D-galactosamine did not show superior IRI ability when compared to D-galactose,
the fact that activity is still apparent is interesting as in all other tested compounds substitution
at C2 completely removed IRI activity. This implies the presence of a hydrophobic region at any
position restricts IRI activity, yet the effect of hydrophilic substitution remained unexplored. As
the presence of an amine at C2 presented a degree of IRI activity, amino substitution was
chosen as the means to investigate hydrophilic substitution.
2.2 – Preparation of Amino Carbohydrates
2.2.1 – Retrosynthetic Analysis
The synthesis of amino substituted monosaccharides could proceed through a number
of possible routes. One of the more straightforward syntheses proceeds through reduction of
32
an analogous azide, which are easily generated though displacement of a triflate via lithium
azide.
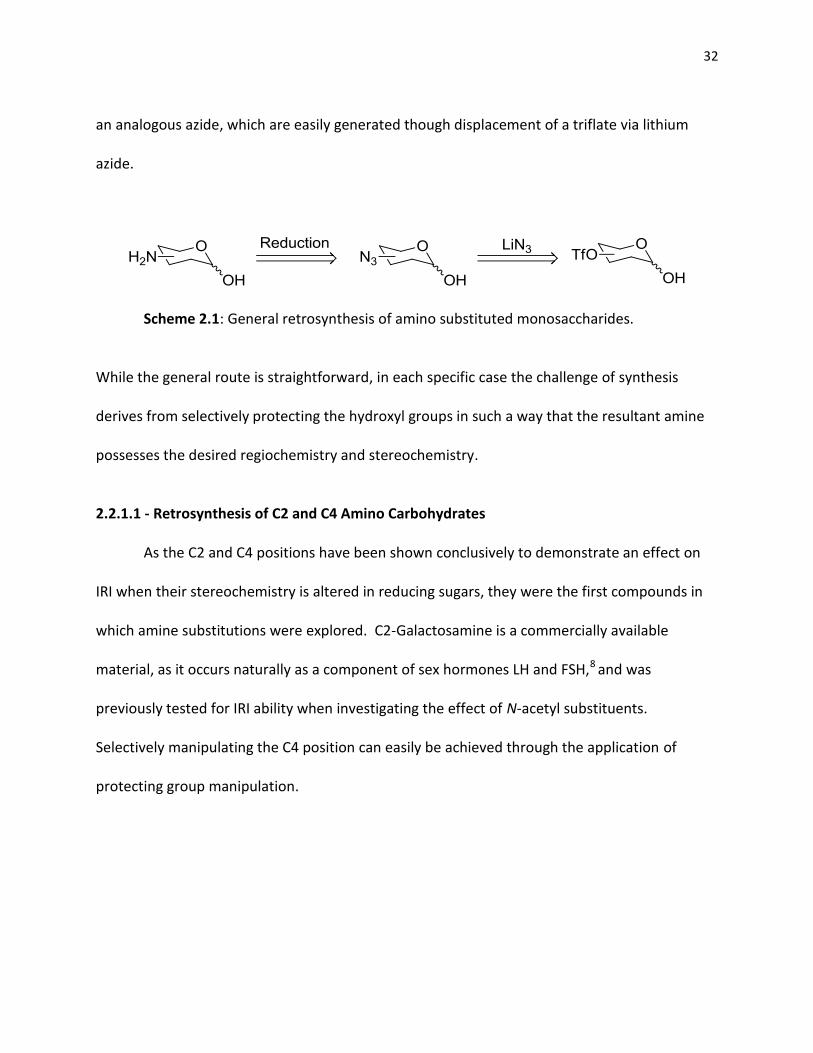
Scheme 2.1: General retrosynthesis of amino substituted monosaccharides.
While the general route is straightforward, in each specific case the challenge of synthesis
derives from selectively protecting the hydroxyl groups in such a way that the resultant amine
possesses the desired regiochemistry and stereochemistry.
2.2.1.1 - Retrosynthesis of C2 and C4 Amino Carbohydrates
As the C2 and C4 positions have been shown conclusively to demonstrate an effect on
IRI when their stereochemistry is altered in reducing sugars, they were the first compounds in
which amine substitutions were explored. C2-Galactosamine is a commercially available
material, as it occurs naturally as a component of sex hormones LH and FSH,8 and was
previously tested for IRI ability when investigating the effect of N-acetyl substituents.
Selectively manipulating the C4 position can easily be achieved through the application of
protecting group manipulation.
33
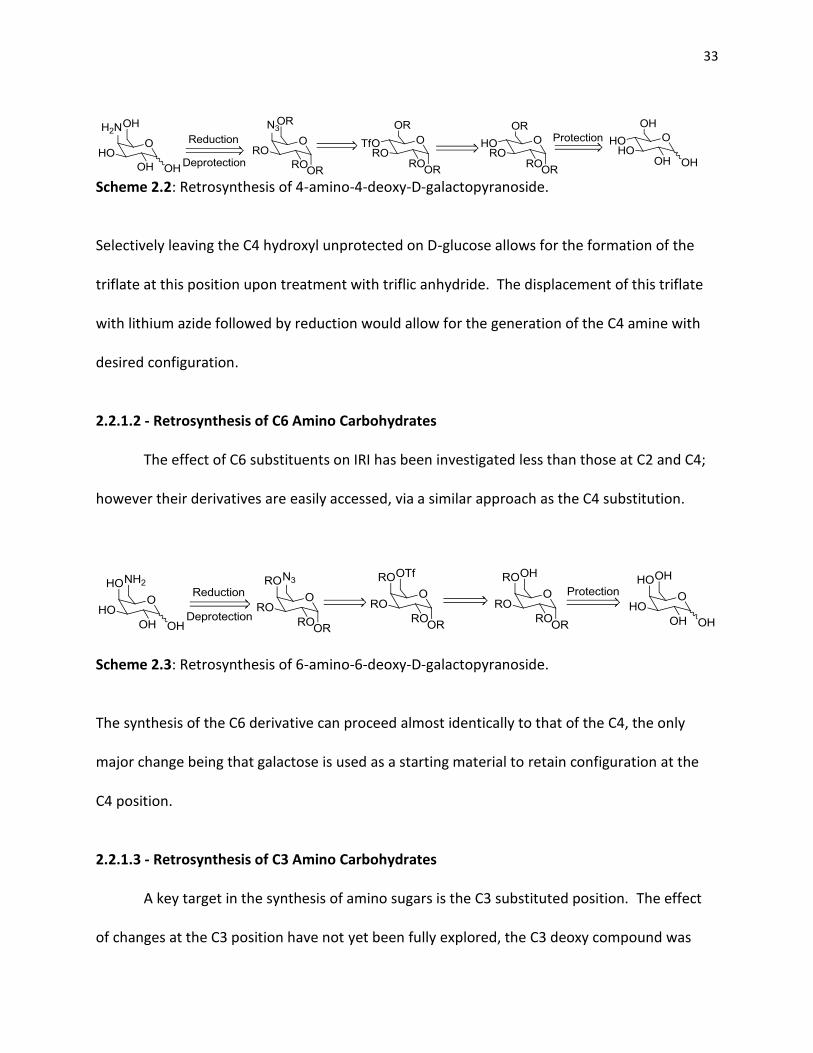
Scheme 2.2: Retrosynthesis of 4-amino-4-deoxy-D-galactopyranoside.
Selectively leaving the C4 hydroxyl unprotected on D-glucose allows for the formation of the
triflate at this position upon treatment with triflic anhydride. The displacement of this triflate
with lithium azide followed by reduction would allow for the generation of the C4 amine with
desired configuration.
2.2.1.2 - Retrosynthesis of C6 Amino Carbohydrates
The effect of C6 substituents on IRI has been investigated less than those at C2 and C4;
however their derivatives are easily accessed, via a similar approach as the C4 substitution.
Scheme 2.3: Retrosynthesis of 6-amino-6-deoxy-D-galactopyranoside.
The synthesis of the C6 derivative can proceed almost identically to that of the C4, the only
major change being that galactose is used as a starting material to retain configuration at the
C4 position.
2.2.1.3 - Retrosynthesis of C3 Amino Carbohydrates
A key target in the synthesis of amino sugars is the C3 substituted position. The effect
of changes at the C3 position have not yet been fully explored, the C3 deoxy compound was
34
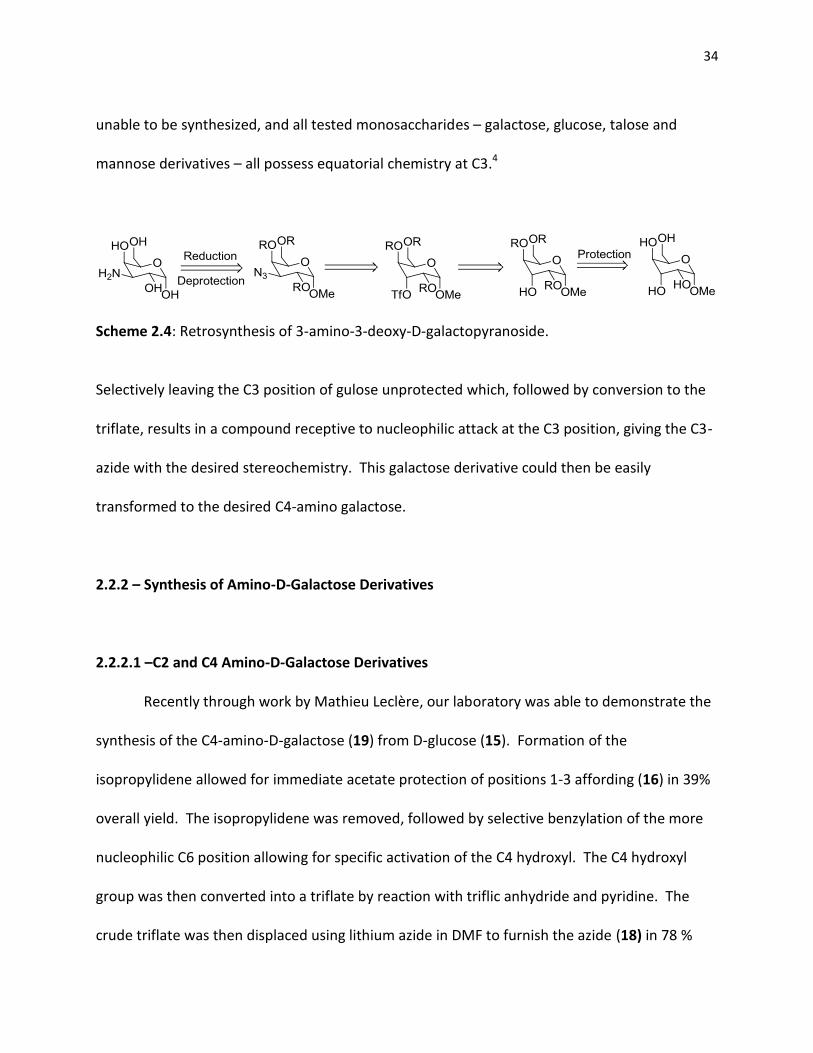
unable to be synthesized, and all tested monosaccharides – galactose, glucose, talose and
mannose derivatives – all possess equatorial chemistry at C3.4
Scheme 2.4: Retrosynthesis of 3-amino-3-deoxy-D-galactopyranoside.
Selectively leaving the C3 position of gulose unprotected which, followed by conversion to the
triflate, results in a compound receptive to nucleophilic attack at the C3 position, giving the C3-
azide with the desired stereochemistry. This galactose derivative could then be easily
transformed to the desired C4-amino galactose.
2.2.2 – Synthesis of Amino-D-Galactose Derivatives
2.2.2.1 –C2 and C4 Amino-D-Galactose Derivatives
Recently through work by Mathieu Leclère, our laboratory was able to demonstrate the
synthesis of the C4-amino-D-galactose (19) from D-glucose (15). Formation of the
isopropylidene allowed for immediate acetate protection of positions 1-3 affording (16) in 39%
overall yield. The isopropylidene was removed, followed by selective benzylation of the more
nucleophilic C6 position allowing for specific activation of the C4 hydroxyl. The C4 hydroxyl
group was then converted into a triflate by reaction with triflic anhydride and pyridine. The
crude triflate was then displaced using lithium azide in DMF to furnish the azide (18) in 78 %
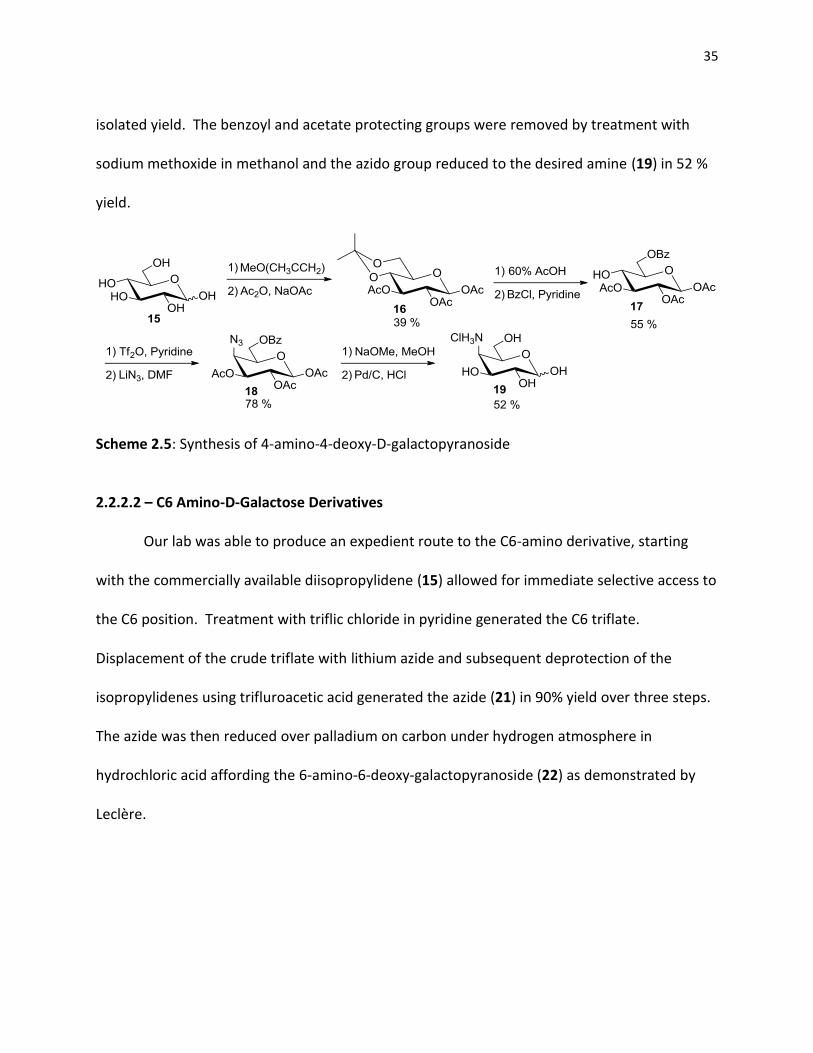
35
isolated yield. The benzoyl and acetate protecting groups were removed by treatment with
sodium methoxide in methanol and the azido group reduced to the desired amine (19) in 52 %
yield.
Scheme 2.5: Synthesis of 4-amino-4-deoxy-D-galactopyranoside
2.2.2.2 – C6 Amino-D-Galactose Derivatives
Our lab was able to produce an expedient route to the C6-amino derivative, starting
with the commercially available diisopropylidene (15) allowed for immediate selective access to
the C6 position. Treatment with triflic chloride in pyridine generated the C6 triflate.
Displacement of the crude triflate with lithium azide and subsequent deprotection of the
isopropylidenes using trifluroacetic acid generated the azide (21) in 90% yield over three steps.
The azide was then reduced over palladium on carbon under hydrogen atmosphere in
hydrochloric acid affording the 6-amino-6-deoxy-galactopyranoside (22) as demonstrated by
Leclère.
36
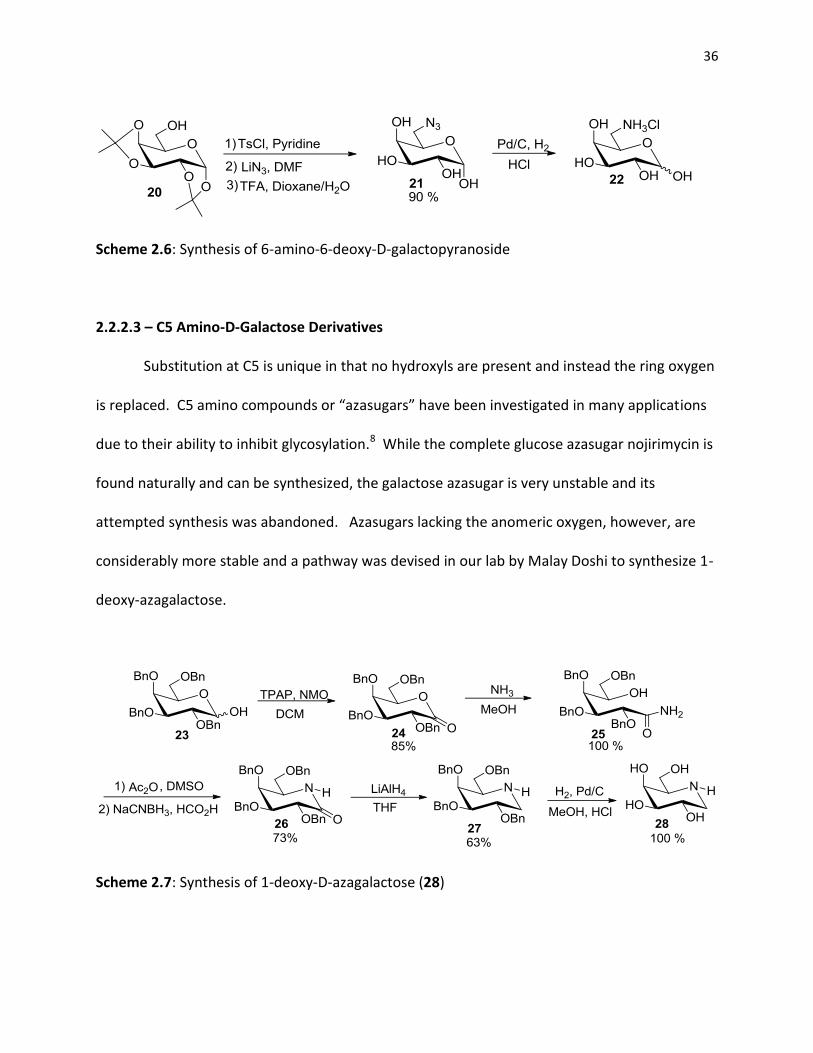
Scheme 2.6: Synthesis of 6-amino-6-deoxy-D-galactopyranoside
2.2.2.3 – C5 Amino-D-Galactose Derivatives
Substitution at C5 is unique in that no hydroxyls are present and instead the ring oxygen
is replaced. C5 amino compounds or “azasugars” have been investigated in many applications
due to their ability to inhibit glycosylation.8 While the complete glucose azasugar nojirimycin is
found naturally and can be synthesized, the galactose azasugar is very unstable and its
attempted synthesis was abandoned. Azasugars lacking the anomeric oxygen, however, are
considerably more stable and a pathway was devised in our lab by Malay Doshi to synthesize 1-
deoxy-azagalactose.
Scheme 2.7: Synthesis of 1-deoxy-D-azagalactose (28)
37
Starting with tetrabenzylated galactose(23), the anomeric position was oxidized using
tetrapropylammonium ruthenate and NMO to generate the lactone (24) in 85% yield. The
lactone ring was then easily opened through treatment with ammonia affording the amide (25)
in quantitative yield. Oxidation of the now free C5 hydroxyl via reaction with acetic anhydride
and DMSO, followed by reductive amination with sodium cyanoborohydride in formic acid,
yielded the lactam (26) in 73% isolated yield. The lactam was further reduced with lithium
aluminum hydride producing the C1 deoxy analogue (27) in 63 % yield. The perbenzylated
azasugar was finally deprotected with palladium on carbon under hydrogen atmosphere to
quantitatively generate the desired azasugar (28).
2.2.2.4 – C3 Amino-D-Galactose Derivatives
While the general route suggests a simple synthesis towards the C3 amino
carbohydrate, selectively manipulating the C3 position in galactose is more difficult than
manipulations at C4 and C6. Isopropylidenes that leave the C3 position accessible are not
commercially available and their synthesis is not trivial. A number of possible routes were
investigated for this transformation.
38
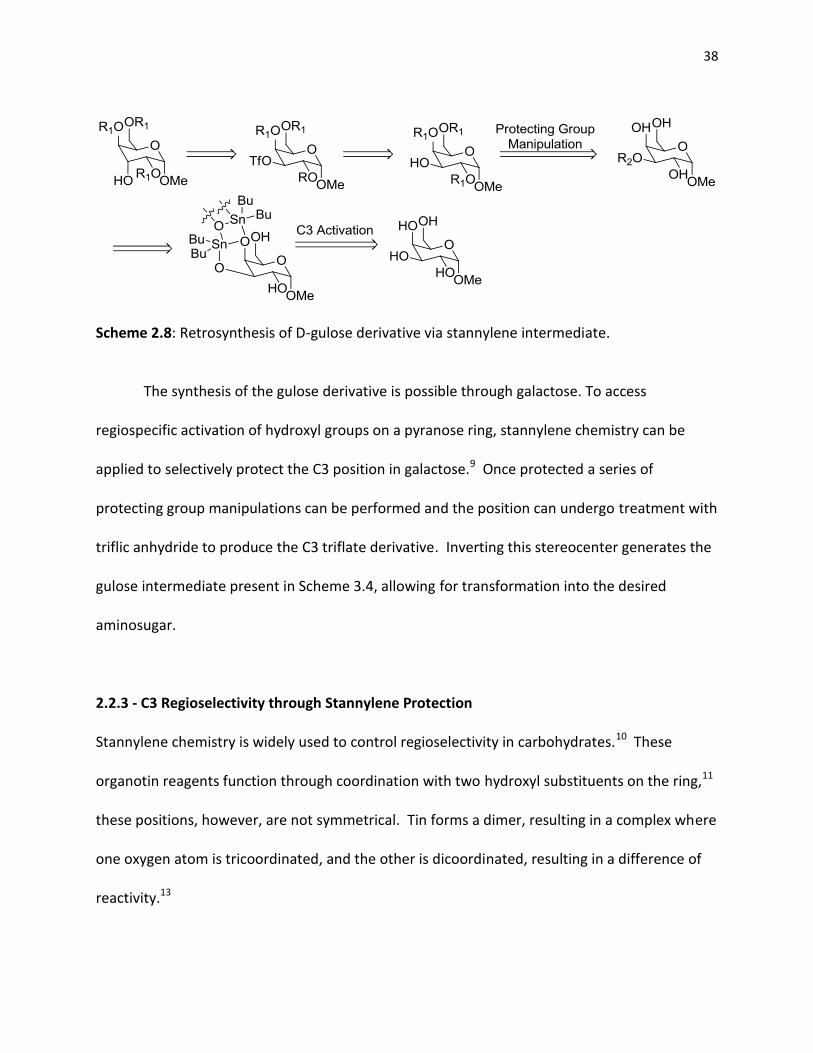
Scheme 2.8: Retrosynthesis of D-gulose derivative via stannylene intermediate.
The synthesis of the gulose derivative is possible through galactose. To access
regiospecific activation of hydroxyl groups on a pyranose ring, stannylene chemistry can be
applied to selectively protect the C3 position in galactose.9 Once protected a series of
protecting group manipulations can be performed and the position can undergo treatment with
triflic anhydride to produce the C3 triflate derivative. Inverting this stereocenter generates the
gulose intermediate present in Scheme 3.4, allowing for transformation into the desired
aminosugar.
2.2.3 - C3 Regioselectivity through Stannylene Protection
Stannylene chemistry is widely used to control regioselectivity in carbohydrates.10 These
organotin reagents function through coordination with two hydroxyl substituents on the ring,11
these positions, however, are not symmetrical. Tin forms a dimer, resulting in a complex where
one oxygen atom is tricoordinated, and the other is dicoordinated, resulting in a difference of
reactivity.13
39
Stannylene ethers prefer to form in the cis configuration, which on a pyranose ring
implies one equatorial and one axial hydroxyl form the desired oxygen-tin bonds.13 In these
scenarios it has been shown that the equatorial, or dicoordinate, position possesses greater
nucleophilicity14 due to minimization of steric interactions, reduction of electron sharing
between the additional tin atom, and the subsequent orientation that leads to an increased
reactivity.15
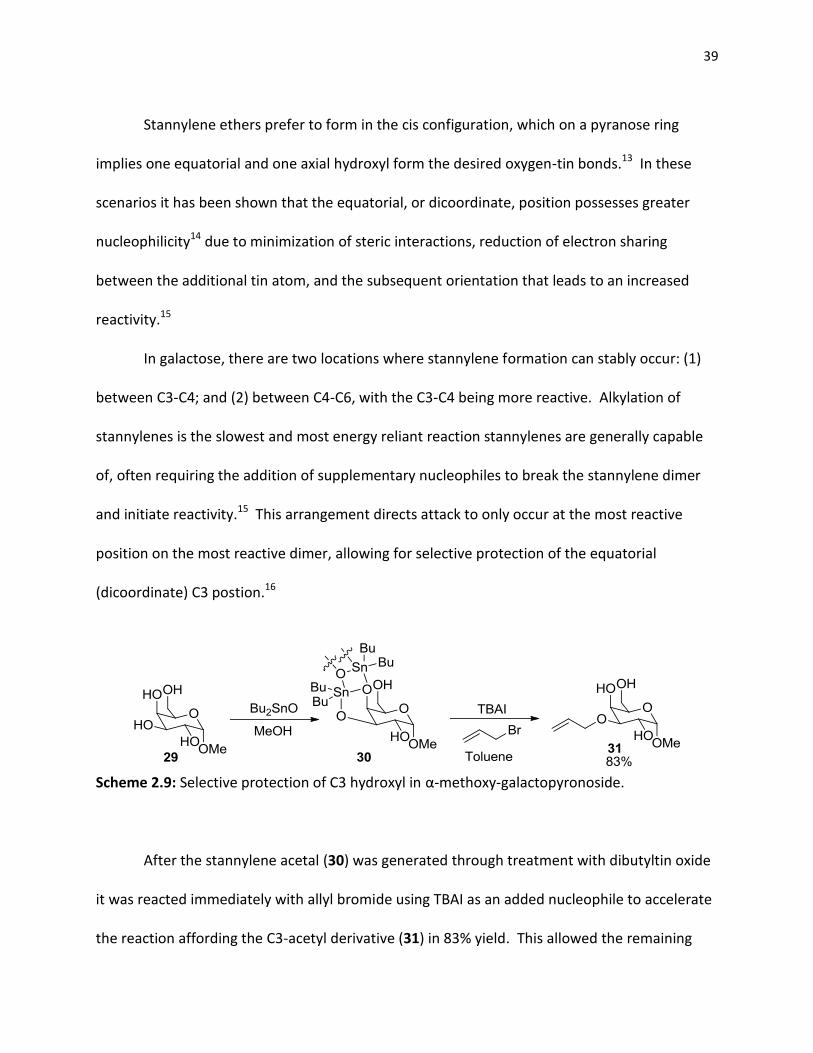
In galactose, there are two locations where stannylene formation can stably occur: (1)
between C3-C4; and (2) between C4-C6, with the C3-C4 being more reactive. Alkylation of
stannylenes is the slowest and most energy reliant reaction stannylenes are generally capable
of, often requiring the addition of supplementary nucleophiles to break the stannylene dimer
and initiate reactivity.15 This arrangement directs attack to only occur at the most reactive
position on the most reactive dimer, allowing for selective protection of the equatorial
(dicoordinate) C3 postion.16
Scheme 2.9: Selective protection of C3 hydroxyl in α-methoxy-galactopyronoside.
After the stannylene acetal (30) was generated through treatment with dibutyltin oxide
it was reacted immediately with allyl bromide using TBAI as an added nucleophile to accelerate
the reaction affording the C3-acetyl derivative (31) in 83% yield. This allowed the remaining
40
hydroxyls to be protected and the C3 position manipulated specifically. Both acetate and
benzyl protected derivatives were synthesized with each used for different pathways to
develop the desired amino sugar.
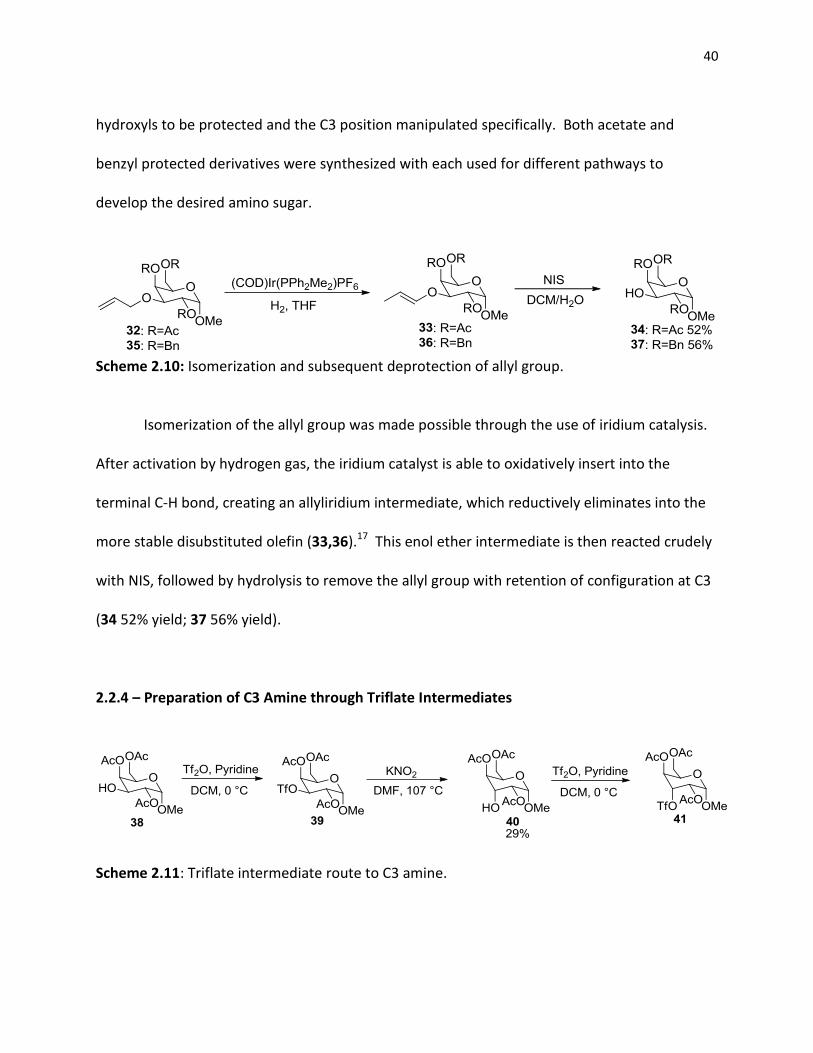
Scheme 2.10: Isomerization and subsequent deprotection of allyl group.
Isomerization of the allyl group was made possible through the use of iridium catalysis.
After activation by hydrogen gas, the iridium catalyst is able to oxidatively insert into the
terminal C-H bond, creating an allyliridium intermediate, which reductively eliminates into the
more stable disubstituted olefin (33,36).17 This enol ether intermediate is then reacted crudely
with NIS, followed by hydrolysis to remove the allyl group with retention of configuration at C3
(34 52% yield; 37 56% yield).
2.2.4 – Preparation of C3 Amine through Triflate Intermediates
Scheme 2.11: Triflate intermediate route to C3 amine.
41
The acetate protected sugar (38) then underwent treatment with triflic anhydride in
pyridine generating the triflate (39). The triflate was then treated with potassium nitrite
affording the Lattrell-Dax18 inversion product (40) in 29% isolated yield. A second reaction with
triflic anhydride was performed and the resultant triflate (41) was treated with lithium azide in
an attempt to place an azide on the C3 position, which could be reduced to afford our desired
product. Direct synthesis of the protected gulose intermediate (40) formed by the Lattrell-Dax
inversion was not attempted as its stereochemistry restricts access to the C3 position using
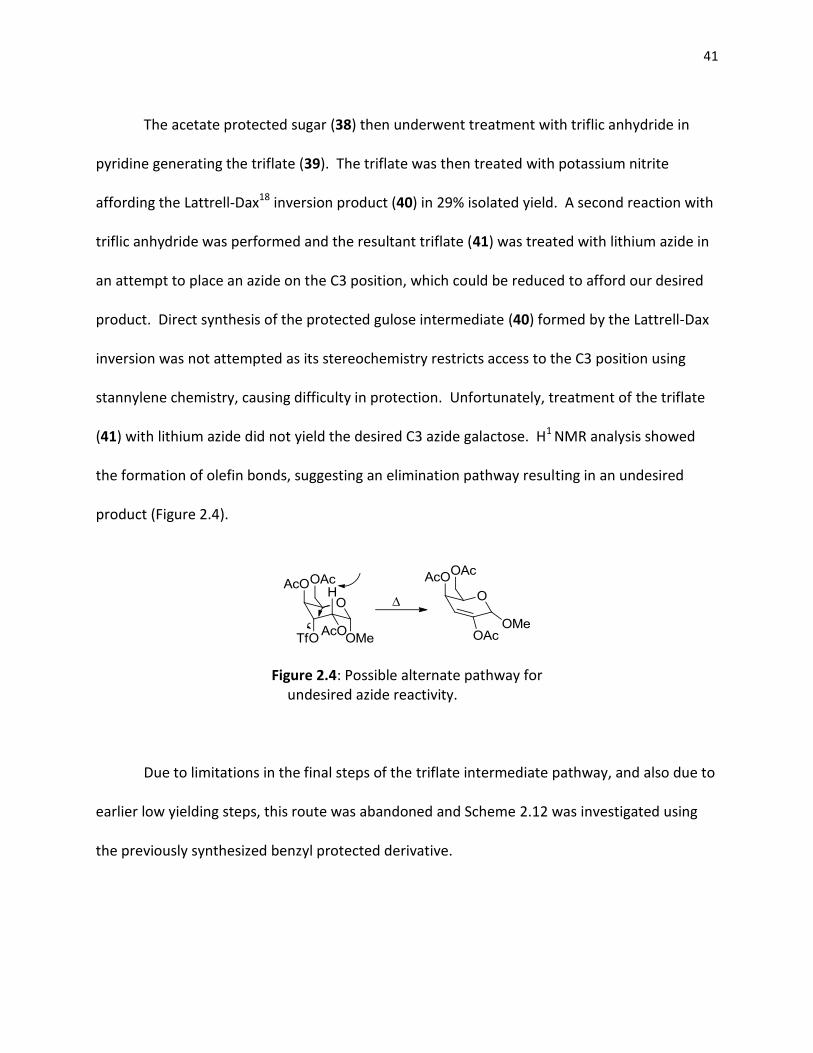
stannylene chemistry, causing difficulty in protection. Unfortunately, treatment of the triflate
(41) with lithium azide did not yield the desired C3 azide galactose. H1 NMR analysis showed
the formation of olefin bonds, suggesting an elimination pathway resulting in an undesired
product (Figure 2.4).
Figure 2.4: Possible alternate pathway for undesired azide reactivity.
Due to limitations in the final steps of the triflate intermediate pathway, and also due to
earlier low yielding steps, this route was abandoned and Scheme 2.12 was investigated using
the previously synthesized benzyl protected derivative.
42
2.2.5 – Preparation of C3 Amine through Reductive Amination
Access to C3 amines has been accomplished previously in disaccharides19 with a
galactose derived subunit through reductive amination20 and the route has been optimized
through use of an oxime intermediate.21 Starting with the C3 deprotected galactose
intermediate accessible via Scheme 2.10, oxidation followed by reductive amination generates
the equatorial C3 positions selectively.
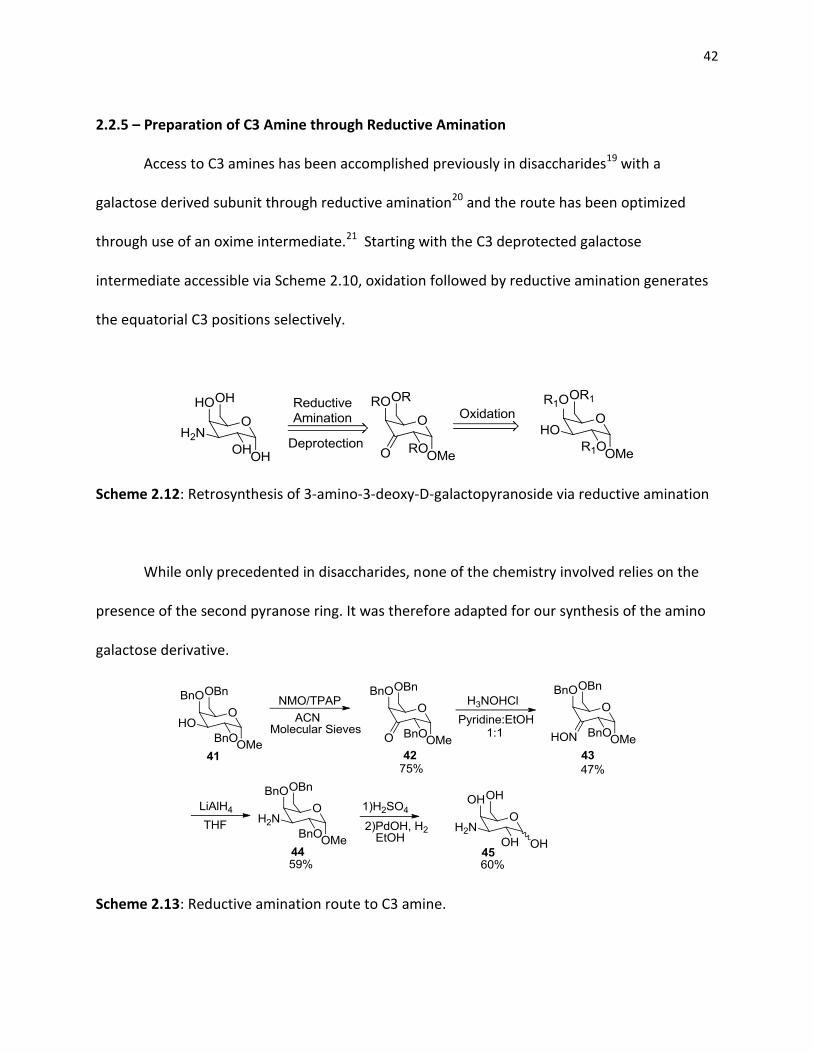
Scheme 2.12: Retrosynthesis of 3-amino-3-deoxy-D-galactopyranoside via reductive amination
While only precedented in disaccharides, none of the chemistry involved relies on the
presence of the second pyranose ring. It was therefore adapted for our synthesis of the amino
galactose derivative.
Scheme 2.13: Reductive amination route to C3 amine.
43
While Norberg’s route uses the Swern oxidation to form the C3-keto intermediate (42),
it was found that using tetrapropylammonium perruthenate (TPAP) as an oxidative catalyst
with N-methyl morpholine (NMO) as a stochiometric oxidant to recover the TPAP22 was a more
reliable and productive oxidation generating (42) in 75% isolated yield. This oxidation produces
water as a by-product that interferes with reactivity; thus molecular sieves were added to
minimize this effect.
Once oxidation was achieved, the ketone (42) was treated with hydroxylamine
hydrochloride in pyridine and ether, affording the oxime (43) in 47% yield through
condensation. Reducing the oxime selectively through treatment with lithium aluminum
hydride forms the amine (44) in 59% yield with desired configuration. The equatorial position is
generated specifically due to the difficulty of attack on the bulky oxime from the top face,
which is blocked by very large axial benzyl groups.
Deprotection of (44) was carried out through treatment with sulfuric acid, affording the
free hydroxyl at the C1 position. The crude material was then treated with palladium hydroxide
and hydrogen at high pressures allowing for easy isolation after the removal of the remaining
benzyl groups, due to the extreme shift in polarity – allowing the desired amine (45) to be
quickly isolated from the mixture using a C18 cartridge in 60% yield over two steps. The pure 3-
amino-galactopyranose was then tested for IRI ability and compared to the previously
synthesized aminosugars.
44
References
1. Walkinshaw, M. D. J. Chem. Soc., Perkin Trans. 2 1987, 1903
2. Stokes, R. H.; Robinson, R. A. J. Phys. Chem. 1966, 70, 2126
3. Chakrabartty, A.; Hew, C. L. Eur. J. Biochem. 1991, 202, 1057
4. Tam, R., Czechura, P., Ferreria, S. S., Chaytor, J., Ben, R. N., J. Am. Chem. Soc. 2008, 130,
17494
5. Czechura, P., Tam, R., Dimitrivjevic, E., Murphy, A.V., Ben, R. N. J. Am. Chem. Soc. 2008,
130, 2928.
6. Galema, S.A.; Eduardo, H.; Engberts, J.B.F.N.; Grigera,R. J. Carbohydr. Res. 1994, 265,215
7. Galema, S.A.; Engberts, J.B.F.N.; Høiland, H.; Førland, G.M. J. Phys.Chem. 1993, 97, 6885
8. Graham, E.R.B., Neuberger, A. Biochem J. 1968, 109, 645
9. Miyajima, K., Machida, K., Nagagaki, M. Bull. Chem. Soc. Jpn.1985,58, 2595
10. David, S., Pascard., C., Cesario, M. Nouveau J. Chim. 1979, 3, 63
11. Zhang, Z., Magnusson, G. J. Org. Chem. 1996, 61, 2383
12. Hodosi, G., Kovac, P. Carb. Res. 1997, 303, 239
13. David, S., Hanessian, S. Tetrahedron 1985, 41, 643
14. David, S., Malleron, A., Carb. Res. 2000, 329, 215
15. Youssef, R. H., Silwanis, B. A., EI-Sokkary, R. I., Nematalla, A.S., Nashed, M. A. Carb. Res.
1993, 240, 287
16. Danishefsky, S.J., Hungate, R., Schulte, G., J. Am. Chem. Soc., 1988, 110, 7434
17. Patnam, R., Jaurez-Ruiz, J.M., Roy, R. Org. Lett. 2006, 8, 2691
18. Albert, R.; Dax, K.; Link, R. W.; Stutz, A. E. Carbohydr. Res. 1983, 118, C5–C6
19. Polt, R., Sames, D., Chruma, J. J. Org. Chem. 1999, 64, 6147
20. Dong, H., Zhou, Y., Pan, X., Cui, F., Liu, W., Liu, J., Ramstrom, O. J. Org. Chem. 2012, 77,
1457
21. Westerlind, U., Hagback, P., Tidback, B., Wiik, L., Blixt, O., Razi, N., Norberg, T. Carb. Res.
2004, 340, 221
22. Griffith, W.P., Vey, S.V., Whitcombe, G.P., White, A.D. J. Chem. Soc., Chem. Commun.,
1987, 21, 1625
45
Chapter 3
Ice Recrystallization Inhibition Activity of Carbohydrates and
Carbohydrate Derivatives
46
3.1 – Assessing Ice Recrystallization Inhibition Activity
Upon isolation of a compound with potential IRI activity it is important to be able to
perform a test to quantify this ability. In this regard the standardized “splat cooling” assay1 was
performed. Compounds tested in this way are first dissolved in phosphate buffered saline (PBS,
a positive control for ice recrystallization), at the desired concentration. A 10 μL aliquot of this
solution is then dropped onto a cooled aluminum block (-78 °C) via micropipette from a height
of two metres. The droplet immediately freezes upon hitting the pre-cooled block, resulting in
an ice wafer 20 μm thick and 1 cm in diameter. The wafer is then removed from the block and
transferred to a cooled microscope stage held at -6.4 °C and left to anneal for 30 minutes. After
this period of time the wafer is photographed three times in three different areas. These
pictures are then analyzed using novel domain recognition software (Doman3) developed at the
National Research Council of Canada2, that allows the user to mark boundaries and compare
the areas of marked regions relative to one another. The mean grain size (MGS) of each
compound is determined by averaging this photographic surface area of the ice crystals for a
specific sample. IRI ability of a sample is calculated as a normalized value (% MGS) relative to
PBS control.
47
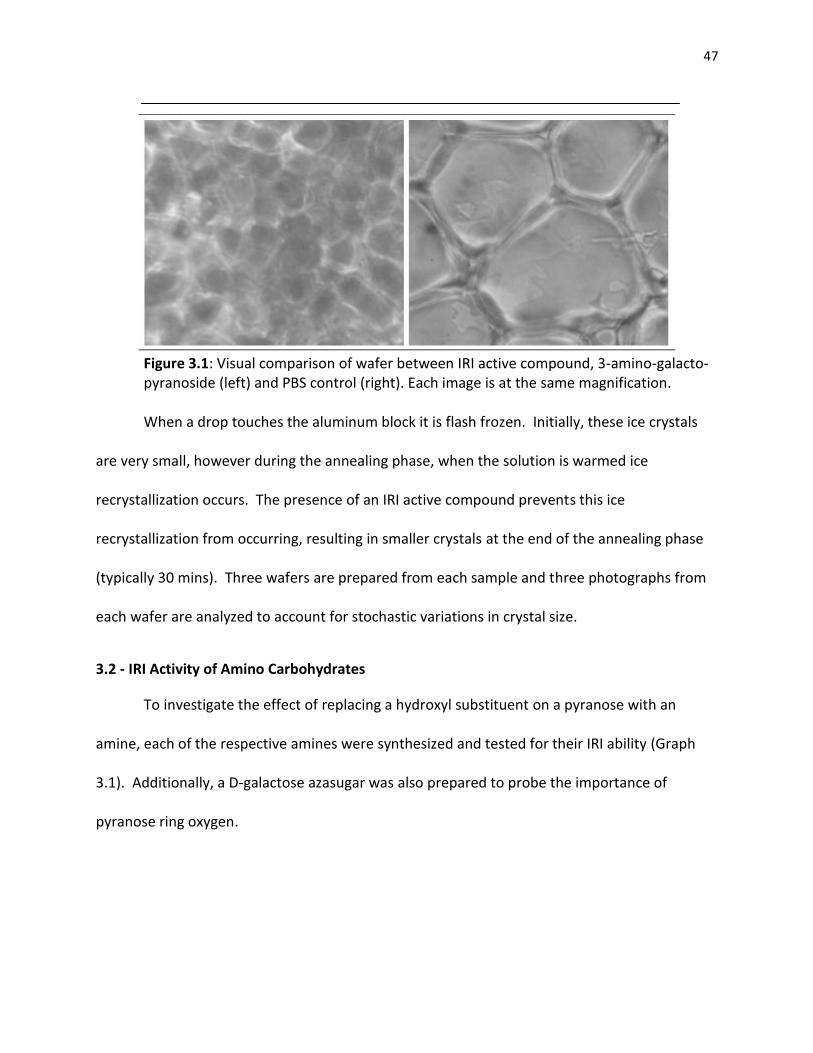
Figure 3.1: Visual comparison of wafer between IRI active compound, 3-amino-galacto- pyranoside (left) and PBS control (right). Each image is at the same magnification.
When a drop touches the aluminum block it is flash frozen. Initially, these ice crystals
are very small, however during the annealing phase, when the solution is warmed ice
recrystallization occurs. The presence of an IRI active compound prevents this ice
recrystallization from occurring, resulting in smaller crystals at the end of the annealing phase
(typically 30 mins). Three wafers are prepared from each sample and three photographs from
each wafer are analyzed to account for stochastic variations in crystal size.
3.2 - IRI Activity of Amino Carbohydrates
To investigate the effect of replacing a hydroxyl substituent on a pyranose with an
amine, each of the respective amines were synthesized and tested for their IRI ability (Graph
3.1). Additionally, a D-galactose azasugar was also prepared to probe the importance of
pyranose ring oxygen.
48
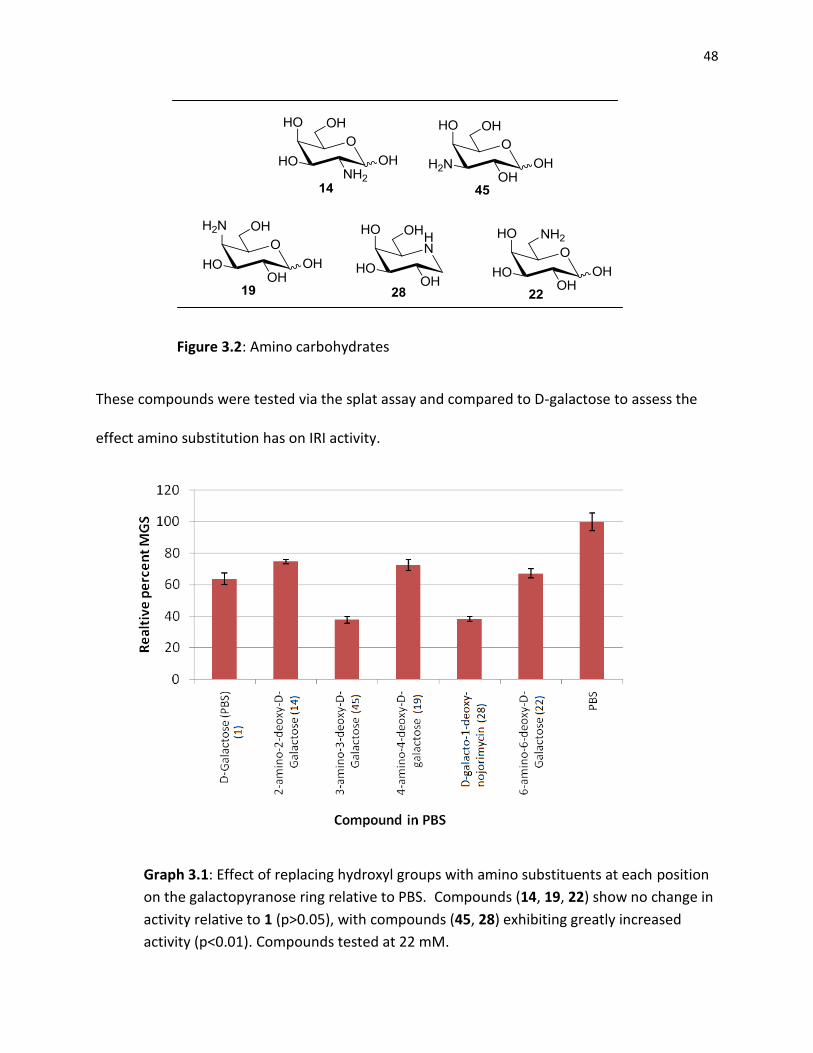
Figure 3.2: Amino carbohydrates
These compounds were tested via the splat assay and compared to D-galactose to assess the
effect amino substitution has on IRI activity.
Graph 3.1: Effect of replacing hydroxyl groups with amino substituents at each position
on the galactopyranose ring relative to PBS. Compounds (14, 19, 22) show no change in
activity relative to 1 (p>0.05), with compounds (45, 28) exhibiting greatly increased
activity (p<0.01). Compounds tested at 22 mM.
49
As shown in Graph 3.1 replacement of a hydroxyl group with an amino group generally
results in no significant change in the ability of the compound to inhibit ice recrystallization
(relative to D-galactose). Amino substitution at C3 and C5, however, increase IRI potential
compared to galactose by almost 50%.
These changes cannot be explained conclusively without visualization of their
interaction with the ice crystal, but likely stem from differences in hydration between the
various positional substitutions. This change in hydration stems from the different potential for
oxygen and nitrogen to form hydrogen bonds3. Furthermore, at physiological pH amino groups
are protonated, effecting their hydration shells.4 It is known that monosaccharide hydration is
highly dependent on the C2 and C4 positions5 and our lab has correlated changes in IRI activity
to changes in stereochemistry at these positions on a pyranose ring.6 Disruptions in hydration
shells through replacement of the hydroxyls with amines could therefore have a similar effect,
accounting for the dramatic drop in IRI activity. Changes at C6 may evince a smaller response
due to the relative mobility of this position in comparison to the other hydroxyls. As C6 is more
flexible than the ring positions its interaction with bulk water may be less dependent upon
composition, resulting in a smaller effect on IRI when altered. C5 constitutes a ring position
which is significantly different structurally from hydroxyl oxygen. Changes at this position may
affect hydration in a manner differently than a hydroxyl, potentially explaining the large change
obtained in substitution at this position. These results alone cannot speak conclusively to the
effect of C5 substitution, however, due to the lack of the C1 hydroxyl. The increase in activity
due to C3 substitution is more difficult to explain due to a lack of current knowledge regarding
50
the effect of this position on hydration, and, along with the other positions, require further
investigation via solid-state NMR.7 and other analytical techniques to demonstrate conclusively.
Regardless, the result suggests that amino substitution at the C3 position is greatly beneficial in
terms of IRI activity.
3.3 – IRI Activity in Other Small Molecules
3.3.1 Azasugars
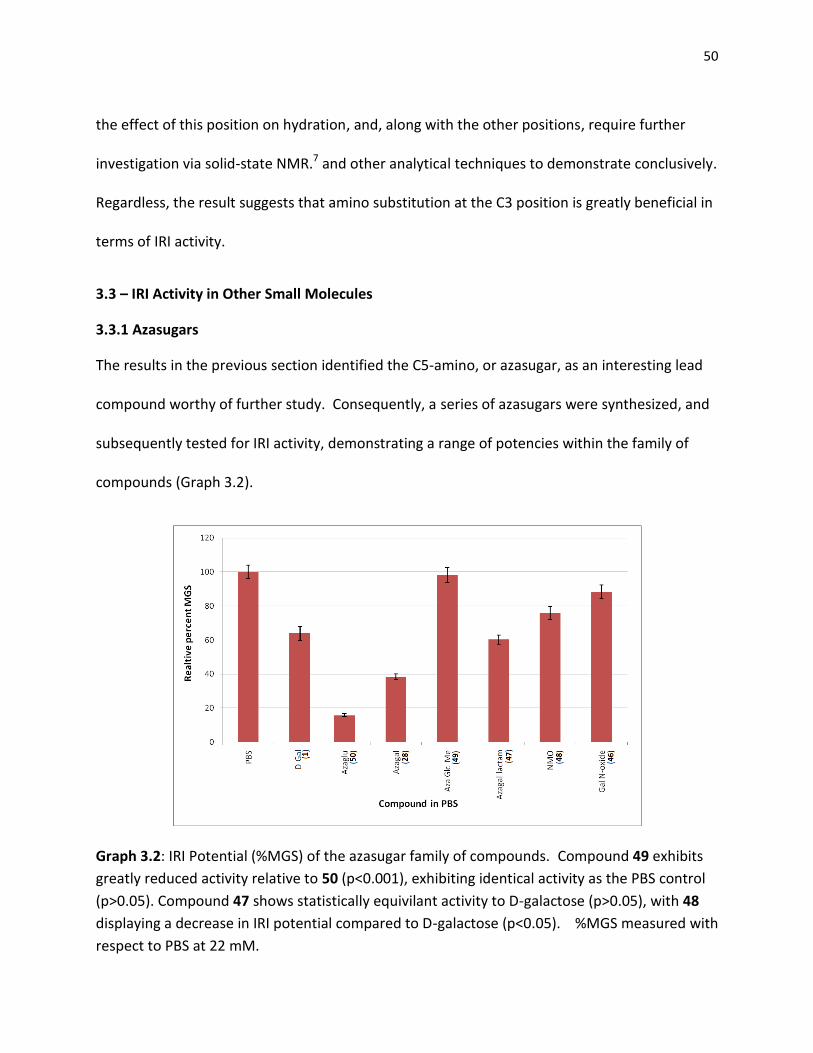
The results in the previous section identified the C5-amino, or azasugar, as an interesting lead
compound worthy of further study. Consequently, a series of azasugars were synthesized, and
subsequently tested for IRI activity, demonstrating a range of potencies within the family of
compounds (Graph 3.2).
Graph 3.2: IRI Potential (%MGS) of the azasugar family of compounds. Compound 49 exhibits
greatly reduced activity relative to 50 (p<0.001), exhibiting identical activity as the PBS control
(p>0.05). Compound 47 shows statistically equivilant activity to D-galactose (p>0.05), with 48
displaying a decrease in IRI potential compared to D-galactose (p<0.05). %MGS measured with
respect to PBS at 22 mM.
51
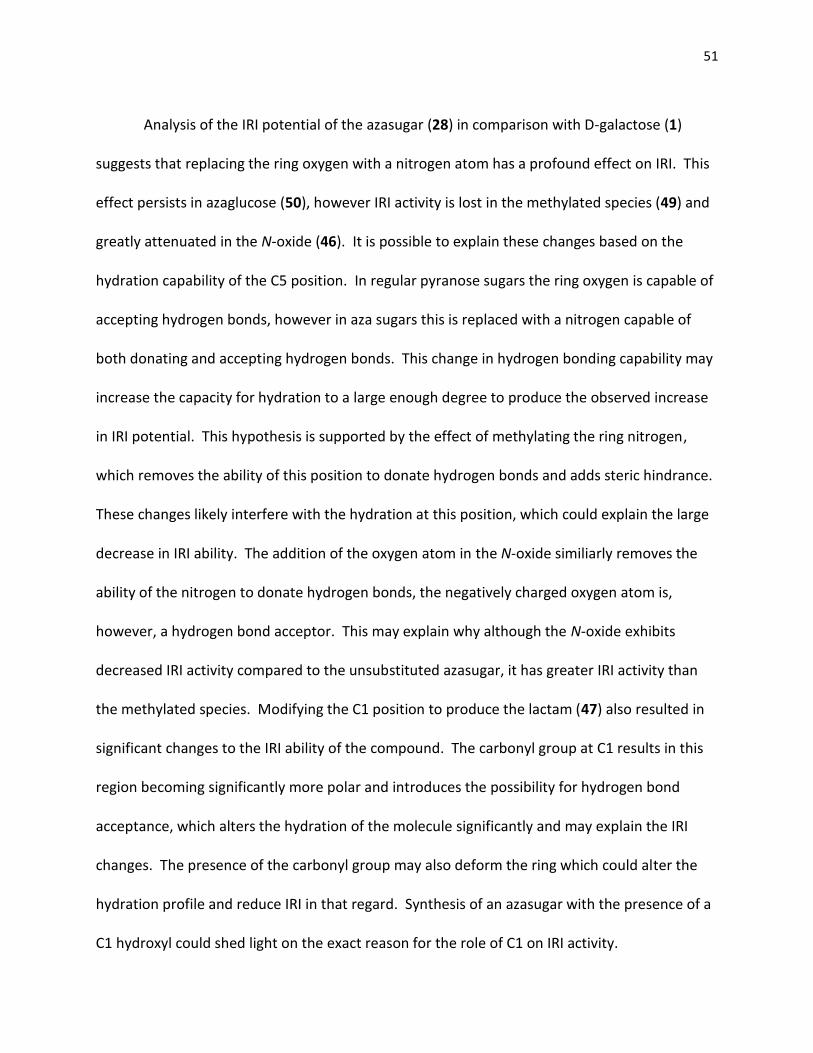
Analysis of the IRI potential of the azasugar (28) in comparison with D-galactose (1)
suggests that replacing the ring oxygen with a nitrogen atom has a profound effect on IRI. This
effect persists in azaglucose (50), however IRI activity is lost in the methylated species (49) and
greatly attenuated in the N-oxide (46). It is possible to explain these changes based on the
hydration capability of the C5 position. In regular pyranose sugars the ring oxygen is capable of
accepting hydrogen bonds, however in aza sugars this is replaced with a nitrogen capable of
both donating and accepting hydrogen bonds. This change in hydrogen bonding capability may
increase the capacity for hydration to a large enough degree to produce the observed increase
in IRI potential. This hypothesis is supported by the effect of methylating the ring nitrogen,
which removes the ability of this position to donate hydrogen bonds and adds steric hindrance.
These changes likely interfere with the hydration at this position, which could explain the large
decrease in IRI ability. The addition of the oxygen atom in the N-oxide similiarly removes the
ability of the nitrogen to donate hydrogen bonds, the negatively charged oxygen atom is,
however, a hydrogen bond acceptor. This may explain why although the N-oxide exhibits
decreased IRI activity compared to the unsubstituted azasugar, it has greater IRI activity than
the methylated species. Modifying the C1 position to produce the lactam (47) also resulted in
significant changes to the IRI ability of the compound. The carbonyl group at C1 results in this
region becoming significantly more polar and introduces the possibility for hydrogen bond
acceptance, which alters the hydration of the molecule significantly and may explain the IRI
changes. The presence of the carbonyl group may also deform the ring which could alter the
hydration profile and reduce IRI in that regard. Synthesis of an azasugar with the presence of a
C1 hydroxyl could shed light on the exact reason for the role of C1 on IRI activity.
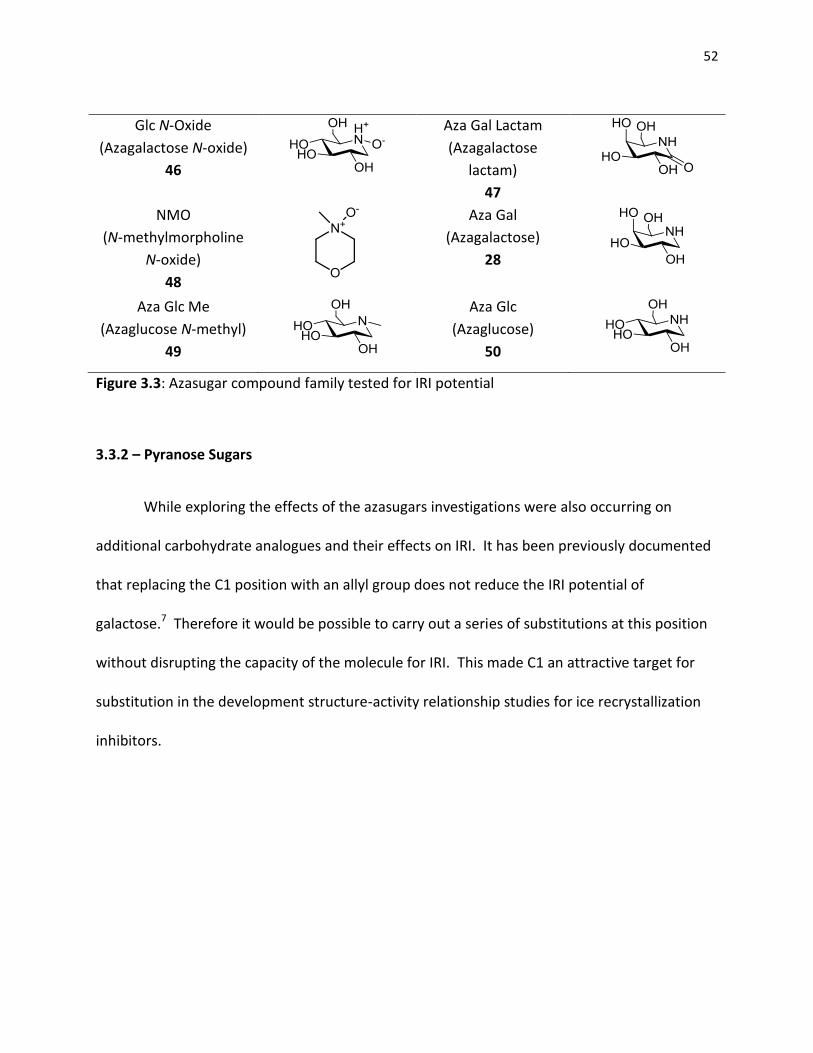
52
Glc N-Oxide
(Azagalactose N-oxide)
46
Aza Gal Lactam
(Azagalactose
lactam)
47
NMO
(N-methylmorpholine
N-oxide)
48
Aza Gal
(Azagalactose)
28
Aza Glc Me
(Azaglucose N-methyl)
49
Aza Glc
(Azaglucose)
50
Figure 3.3: Azasugar compound family tested for IRI potential
3.3.2 – Pyranose Sugars
While exploring the effects of the azasugars investigations were also occurring on
additional carbohydrate analogues and their effects on IRI. It has been previously documented
that replacing the C1 position with an allyl group does not reduce the IRI potential of
galactose.7 Therefore it would be possible to carry out a series of substitutions at this position
without disrupting the capacity of the molecule for IRI. This made C1 an attractive target for
substitution in the development structure-activity relationship studies for ice recrystallization
inhibitors.
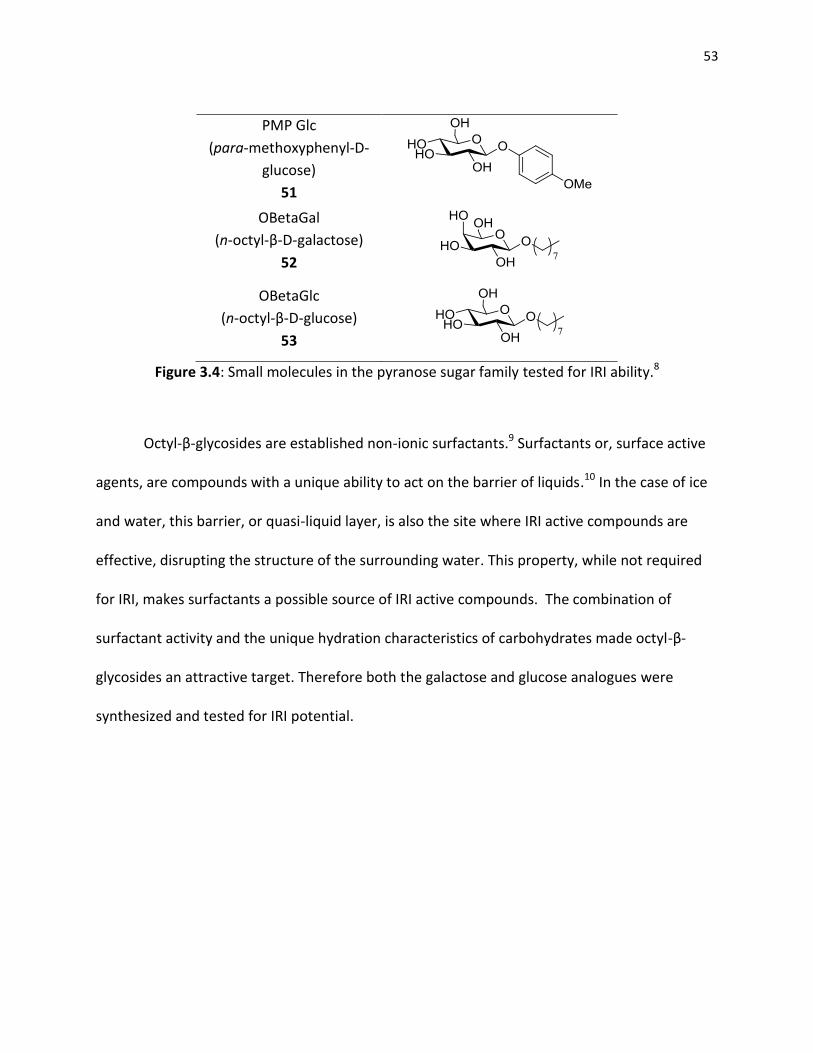
53
PMP Glc
(para-methoxyphenyl-D-
glucose)
51
OBetaGal
(n-octyl-β-D-galactose)
52
OBetaGlc
(n-octyl-β-D-glucose)
53
Figure 3.4: Small molecules in the pyranose sugar family tested for IRI ability.8
Octyl-β-glycosides are established non-ionic surfactants.9 Surfactants or, surface active
agents, are compounds with a unique ability to act on the barrier of liquids.10 In the case of ice
and water, this barrier, or quasi-liquid layer, is also the site where IRI active compounds are
effective, disrupting the structure of the surrounding water. This property, while not required
for IRI, makes surfactants a possible source of IRI active compounds. The combination of
surfactant activity and the unique hydration characteristics of carbohydrates made octyl-β-
glycosides an attractive target. Therefore both the galactose and glucose analogues were
synthesized and tested for IRI potential.
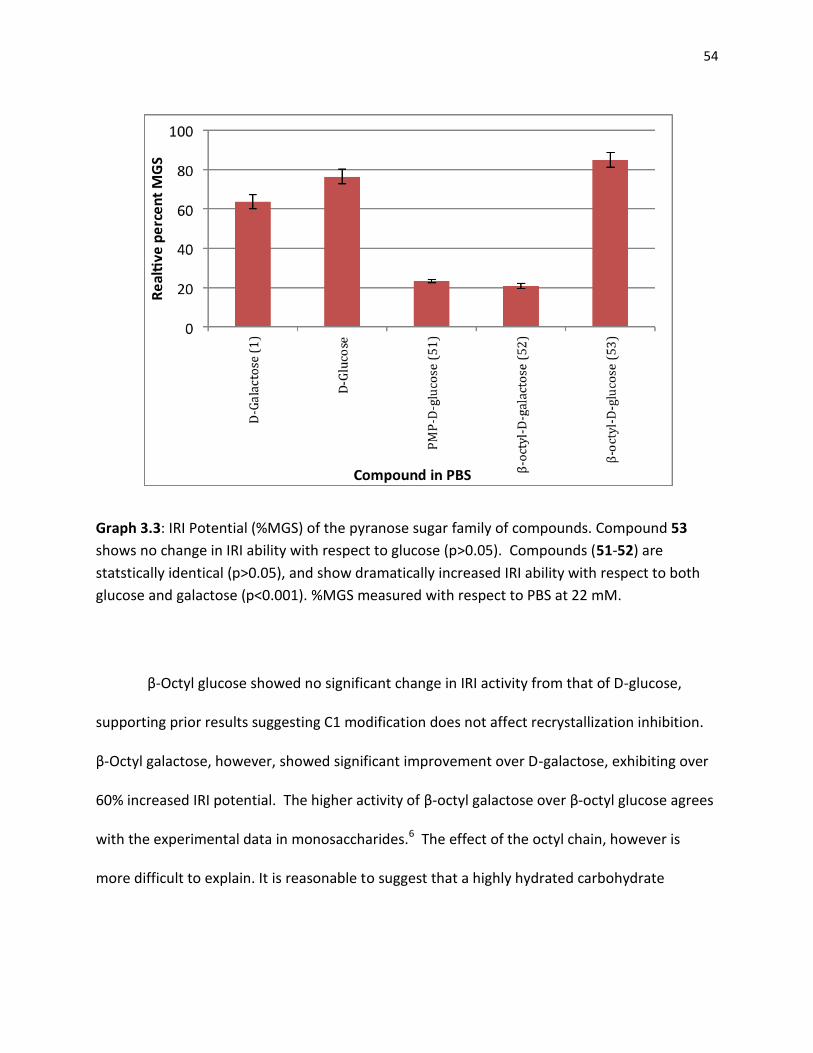
54
Graph 3.3: IRI Potential (%MGS) of the pyranose sugar family of compounds. Compound 53
shows no change in IRI ability with respect to glucose (p>0.05). Compounds (51-52) are
statstically identical (p>0.05), and show dramatically increased IRI ability with respect to both
glucose and galactose (p<0.001). %MGS measured with respect to PBS at 22 mM.
β-Octyl glucose showed no significant change in IRI activity from that of D-glucose,
supporting prior results suggesting C1 modification does not affect recrystallization inhibition.
β-Octyl galactose, however, showed significant improvement over D-galactose, exhibiting over
60% increased IRI potential. The higher activity of β-octyl galactose over β-octyl glucose agrees
with the experimental data in monosaccharides.6 The effect of the octyl chain, however is
more difficult to explain. It is reasonable to suggest that a highly hydrated carbohydrate
55
improves activity in IRI, but the mechanism behind the octyl chain increasing activity in
galactopyranosides but not in glucopyranosides is currently unknown.
Due to the success of β-octyl galactose, a wide variety of C1 substituted compounds
were synthesized, with varying success. One of the more anomalous results is present in the
compound para-methoxyphenylglucose (PMP-glc). PMP glucose derivative shows greater
activity than PMP galactose derivative, which is unprecedented in prior studies. The nature of
this activity is not currently well understood, but it suggests that the IRI activity of compounds
substituted at C1 is unlikely to be a highly predictable quantity. To determine more
conclusively the effect of this position the hydration numbers of substituted compounds would
be required.
3.3.3 – Gluconamides
With the strong activity of β-octyl galactose being discovered, the effect of octyl chain
substitution on other compounds capable of high levels of hydration was explored. It has been
shown that the alditol analogues of glucose and galactose, sorbitol and dulcitol, exhibit
significantly lower IRI activity than their pyranose forms.8 This stems naturally from the loss of
the rigid structure, and its ability to disrupt surrounding bulk water. However, the N-octyl-
aldonamides, are a known class of hydrogelators11, compounds that self-organize in water. This
property suggests an ability to disrupt the organization of water, presenting hydrogelators as a
possible source of IRI active compounds. To investigate this a variety of N-octyl-aldonamides
were synthesized. Our group has previously shown that N-octyl-gluconamide is significantly
more IRI active than N-octyl-galactonamide.8 This effect was again unexpected and in conflict
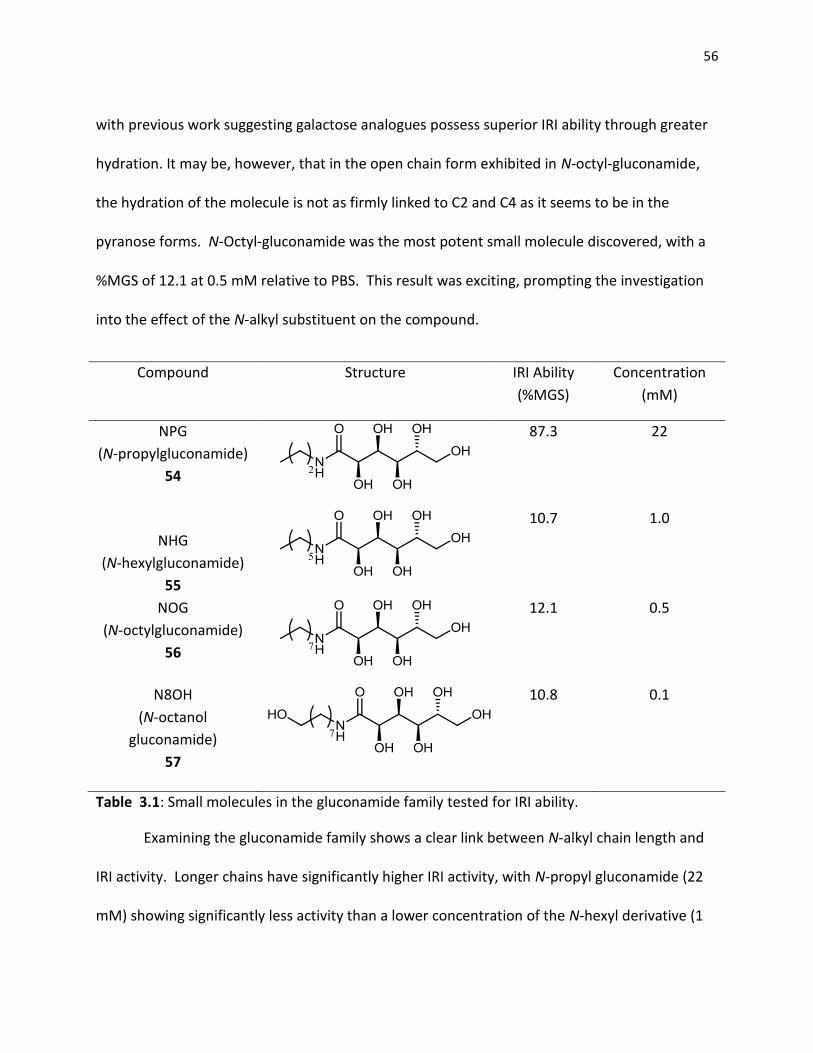
56
with previous work suggesting galactose analogues possess superior IRI ability through greater
hydration. It may be, however, that in the open chain form exhibited in N-octyl-gluconamide,
the hydration of the molecule is not as firmly linked to C2 and C4 as it seems to be in the
pyranose forms. N-Octyl-gluconamide was the most potent small molecule discovered, with a
%MGS of 12.1 at 0.5 mM relative to PBS. This result was exciting, prompting the investigation
into the effect of the N-alkyl substituent on the compound.
Compound Structure IRI Ability
(%MGS)
Concentration
(mM)
NPG
(N-propylgluconamide)
54
87.3 22
NHG
(N-hexylgluconamide)
55
10.7 1.0
NOG
(N-octylgluconamide)
56
12.1 0.5
N8OH
(N-octanol
gluconamide)
57
10.8 0.1
Table 3.1: Small molecules in the gluconamide family tested for IRI ability.
Examining the gluconamide family shows a clear link between N-alkyl chain length and
IRI activity. Longer chains have significantly higher IRI activity, with N-propyl gluconamide (22
mM) showing significantly less activity than a lower concentration of the N-hexyl derivative (1
57
mM) and N-octyl exhibiting similar activity to N-hexyl at half its concentration. Unfortunately
chains longer than eight carbons begin to display low solubility in water. N-octyl gluconamide
itself exhibits low solubility at concentrations as low as 5 mM, requiring heating of the solution
prior to testing. In an effort to account for this the derivative N-octanol gluconamide was
synthesized, possessing a hydroxyl group on the alkyl chain and increasing the solubility of the
molecule. Incredibly, this molecule exhibited even greater IRI ability, possessing the same %
MGS as 1 mM of N-hexyl gluconamide at one tenth its concentration. The effect of substituents
on the alkyl chain has not been further explored, but it stands to reason that these groups form
hydrogen bonds with the surrounding water and while the hydroxyl is not rigidly confined to a
specific structure, it may result in a dramatic effect in the hydration of the molecule
contributing to the extreme improvement of IRI activity.
In synthesizing and examining the IRI potential of these three families’ compounds it is
hoped that the structural features that contribute to activity can be determined. It also
develops a library of compounds with known IRI ability allowing one to test these compounds
for additional uses, and examine the link between IRI and this second property. In this regard
this library of compounds was examined for potential in clathrate inhibition.
58
References
1. C. A. Knight, J. Hallett and A. L. DeVries, Cryobiology, 1988, 25, 55.
2. J. Jackman, M. Noestheden, D. Moffat, J. P. Pezacki, S. Findlay and R. N. Ben, Biochem.
Biophys. Res. Commun., 2007, 354, 340.
3. Arunan, E., Desiraju, G.R., et al. Pure Appl. Chem., 2011, 83, 1637
4. Koneshan, S., Rasaiah, J. C., Lynden-Bell, R. M., Lee, S. H. J. Phys. Chem. B 1998, 102,
4193
5. J. L. Dashnau, K. A. Sharp and J. M. Vanderkooi, J. Phys. Chem. B, 2005, 109, 24152.
6. R. Y. Tam, S. S. Ferreira, P. Czechura, J. L. Chaytor and R. N. Ben, J. Am. Chem. Soc., 2008,
130, 17494
7. A. B. Siemer, K.-Y. Huang and A. E. McDermott, Proc. Natl. Acad. Sci. U. S. A., 2010, 107,
17580
8. Capicciotti, C.J., Leclere, M., Perras, F.A., Bryce, D.L., Paulin, H., Harden, J., Lui, Y., Ben,
R.N. Chem. Sci. 2012, 3, 1408
9. B. Lorber, J. B. Bishop and L. J. DeLucas, Biochim. Biophys. Acta, Biomembr., 1990, 1023,
254
10. Berlot,I., Labbé, P., Letellier, P., Moutet, J.C., Segal, D. J. Phys. Chem. A 1999, 103, 1463
11. Fuhrhop, J. H., Svenson,S., Boettcher, C., Roessler,E., Vieth, H.M. J. Am. Chem. Soc. 1990,
112, 4307
59
Chapter 4
Methane Clathrate Inhibition
60
4.1 – Differential Scanning Calorimetry
If ice recrystallization inhibitors also possess the ability to inhibit clathrate formation it
would be an enormous breakthrough in the field of gas hydrates. There are currently no
examples of small molecules capable of disrupting the formation of clathrates. In this study
the formation of clathrates was observed using differential scanning calorimetry (DSC).1 A DSC
is a device capable of very sensitive detection of changes in heat to an isolated system,
resulting in an output in the form of peaks2. Each peak released corresponds to an increase or
a decrease in the total heat in the system, denoted by positive or negative peaks respectively.
As freezing, both in the formation of ice and in the formation of hydrates, is an exothermic
process, it is possible to detect hydrate nucleation in the system. Furthermore, as hydrate
growth continues to proceed exothermically, the total heat released in a sample corresponds
directly with the total amount of clathrate formed.
As previously discussed, thermodynamic routes of clathrate inhibition require large
quantities of material and high concentrations to be effective. In contrast, low dosage hydrate
inhibitors (LDHIs) function through kinetic means by slowing the growth of clathrate crystals
(known as KHIs), or disrupting their agglomeration (known as AAs). Work from the Ripmeester
group has demonstrated that AFPs were capable of acting as a KHI, inhibiting clathrate hydrate
formation kinetically at low concentrations1. As IRI active proteins were shown to kinetically
inhibit the formation of gas hydrates a potential relationship between IRI and clathrate
inhibition activity materialized. In this regard, our IRI active small molecules were examined
through DSC analysis to investigate their potential as KHIs.
61
There exist two widely used methods of investigating kinetic processes in DSC use:
temperature ramping and isothermal scanning.3 Temperature ramping involves slowly bringing
the system to a specific temperature, while examining the system isothermically requires rapid
heating or cooling to the desired temperature before taking measurements, minimizing the
effect of temperature change. Each method has specific advantages; ramping allows for
temperature dependent effects to be seen, while isothermal shows the kinetic properties more
clearly by minimizing variables. While testing compounds at a range of temperatures may yield
interesting results, in testing our small molecules via DSC it was decided to explore clathrate
inhibition through isothermal trials. This allows for a more direct investigation into whether the
KHI potential demonstrated by IRI active proteins is present in our small molecules.
In this assay, solutions of the tested compounds were suspended in silica gel and run for
20 hours at -12 °C generating a curve consisting of a series of peaks. Each exothermic peak
corresponds to a nucleation event, allowing each sample to be monitored for hydrate
nucleation. The presence of negative endothermic peaks can also be detected, corresponding
to a melting event. These peaks are generally only seen at the end of the trial when the sample
is heated and can be used to identify the structures formed during the DSC run. Each hydrate
structure has a distinctive temperature range at which melting occurs - allowing specific crystal
forms to be detected. In our trials the negative peak representing clathrate crystal structure sII
was detected as the major negative peak in each run, suggesting little contamination of our
results by the presence of unwanted clathrate forms or the generation of water ice.
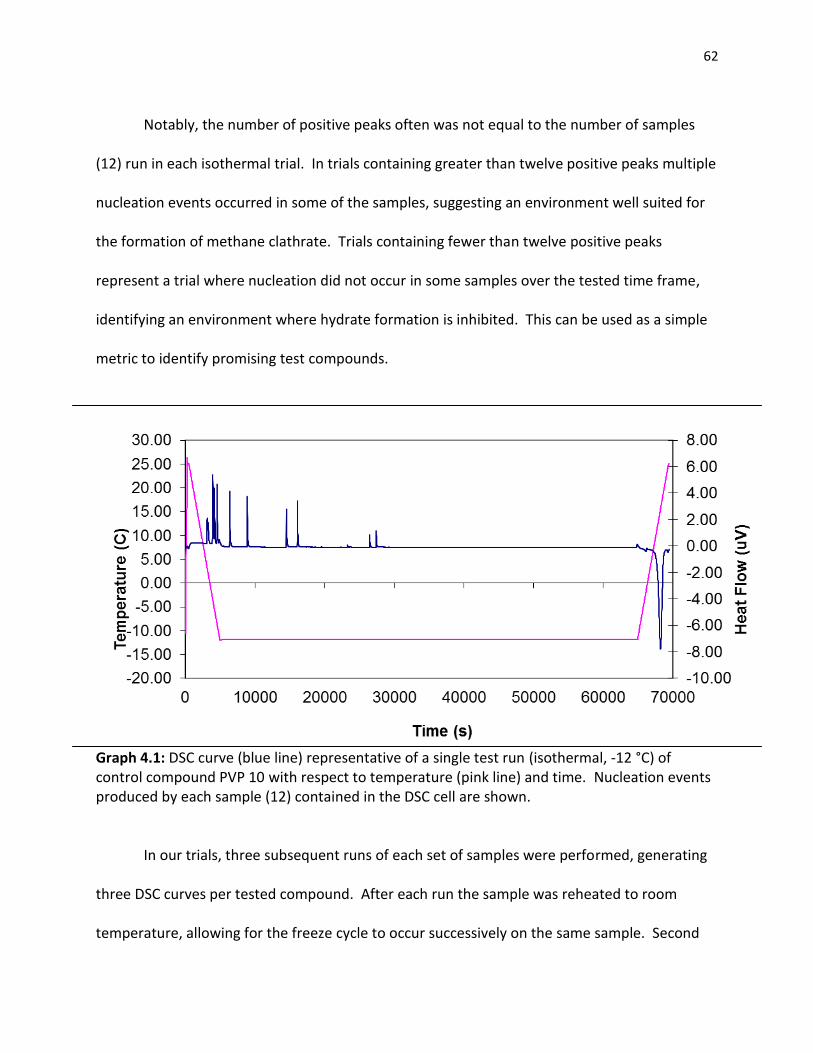
62
Notably, the number of positive peaks often was not equal to the number of samples
(12) run in each isothermal trial. In trials containing greater than twelve positive peaks multiple
nucleation events occurred in some of the samples, suggesting an environment well suited for
the formation of methane clathrate. Trials containing fewer than twelve positive peaks
represent a trial where nucleation did not occur in some samples over the tested time frame,
identifying an environment where hydrate formation is inhibited. This can be used as a simple
metric to identify promising test compounds.
Graph 4.1: DSC curve (blue line) representative of a single test run (isothermal, -12 °C) of control compound PVP 10 with respect to temperature (pink line) and time. Nucleation events produced by each sample (12) contained in the DSC cell are shown.
In our trials, three subsequent runs of each set of samples were performed, generating
three DSC curves per tested compound. After each run the sample was reheated to room
temperature, allowing for the freeze cycle to occur successively on the same sample. Second
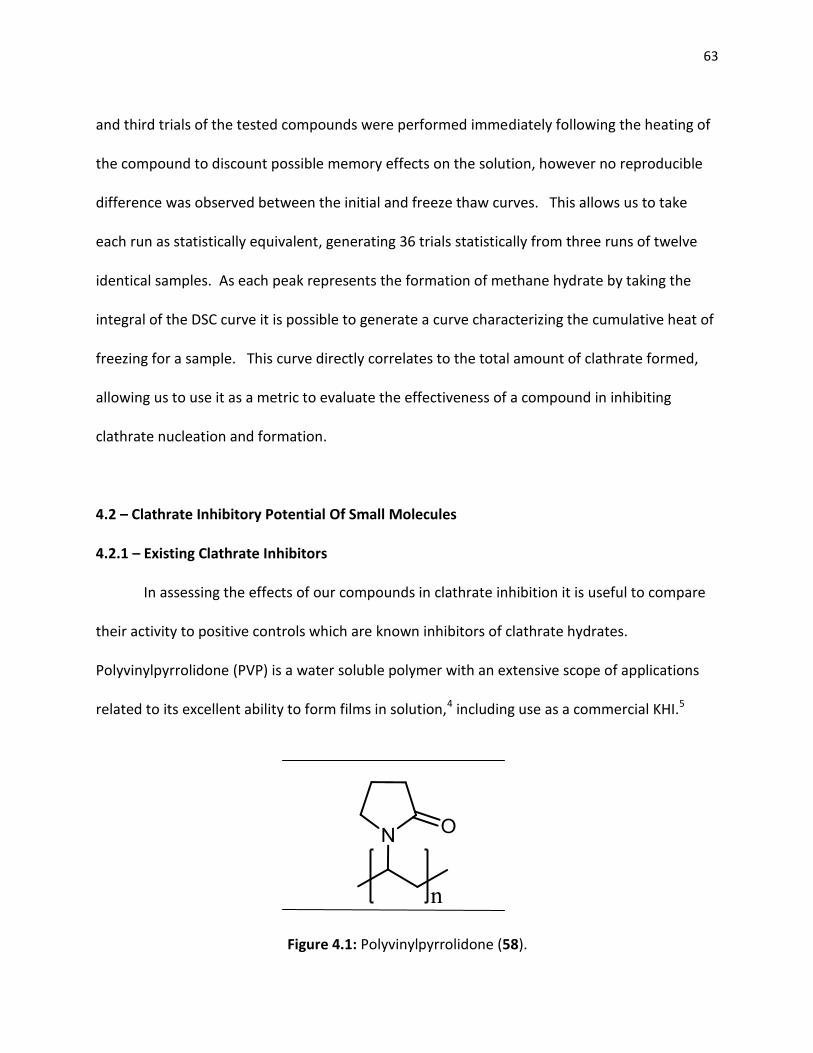
63
and third trials of the tested compounds were performed immediately following the heating of
the compound to discount possible memory effects on the solution, however no reproducible
difference was observed between the initial and freeze thaw curves. This allows us to take
each run as statistically equivalent, generating 36 trials statistically from three runs of twelve
identical samples. As each peak represents the formation of methane hydrate by taking the
integral of the DSC curve it is possible to generate a curve characterizing the cumulative heat of
freezing for a sample. This curve directly correlates to the total amount of clathrate formed,
allowing us to use it as a metric to evaluate the effectiveness of a compound in inhibiting
clathrate nucleation and formation.
4.2 – Clathrate Inhibitory Potential Of Small Molecules
4.2.1 – Existing Clathrate Inhibitors
In assessing the effects of our compounds in clathrate inhibition it is useful to compare
their activity to positive controls which are known inhibitors of clathrate hydrates.
Polyvinylpyrrolidone (PVP) is a water soluble polymer with an extensive scope of applications
related to its excellent ability to form films in solution,4 including use as a commercial KHI.5
Figure 4.1: Polyvinylpyrrolidone (58).
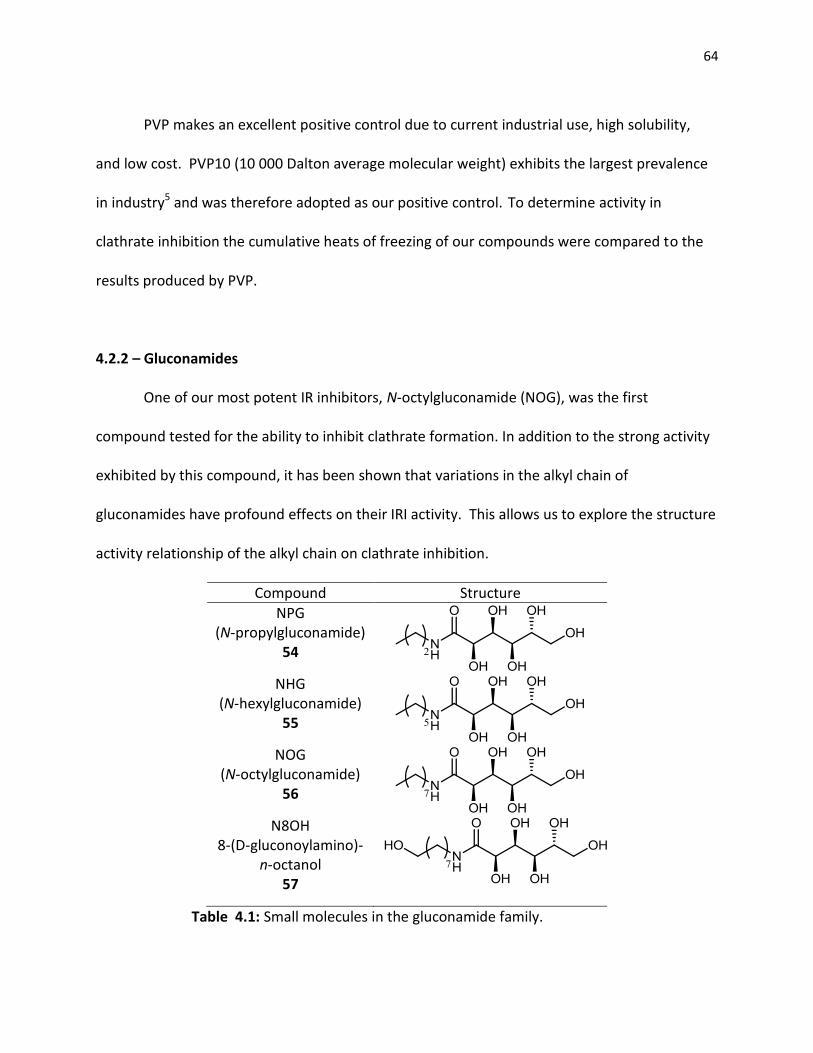
64
PVP makes an excellent positive control due to current industrial use, high solubility,
and low cost. PVP10 (10 000 Dalton average molecular weight) exhibits the largest prevalence
in industry5 and was therefore adopted as our positive control. To determine activity in
clathrate inhibition the cumulative heats of freezing of our compounds were compared to the
results produced by PVP.
4.2.2 – Gluconamides
One of our most potent IR inhibitors, N-octylgluconamide (NOG), was the first
compound tested for the ability to inhibit clathrate formation. In addition to the strong activity
exhibited by this compound, it has been shown that variations in the alkyl chain of
gluconamides have profound effects on their IRI activity. This allows us to explore the structure
activity relationship of the alkyl chain on clathrate inhibition.
Compound Structure
NPG (N-propylgluconamide)
54
NHG (N-hexylgluconamide)
55
NOG (N-octylgluconamide)
56
N8OH 8-(D-gluconoylamino)-
n-octanol 57
Table 4.1: Small molecules in the gluconamide family.
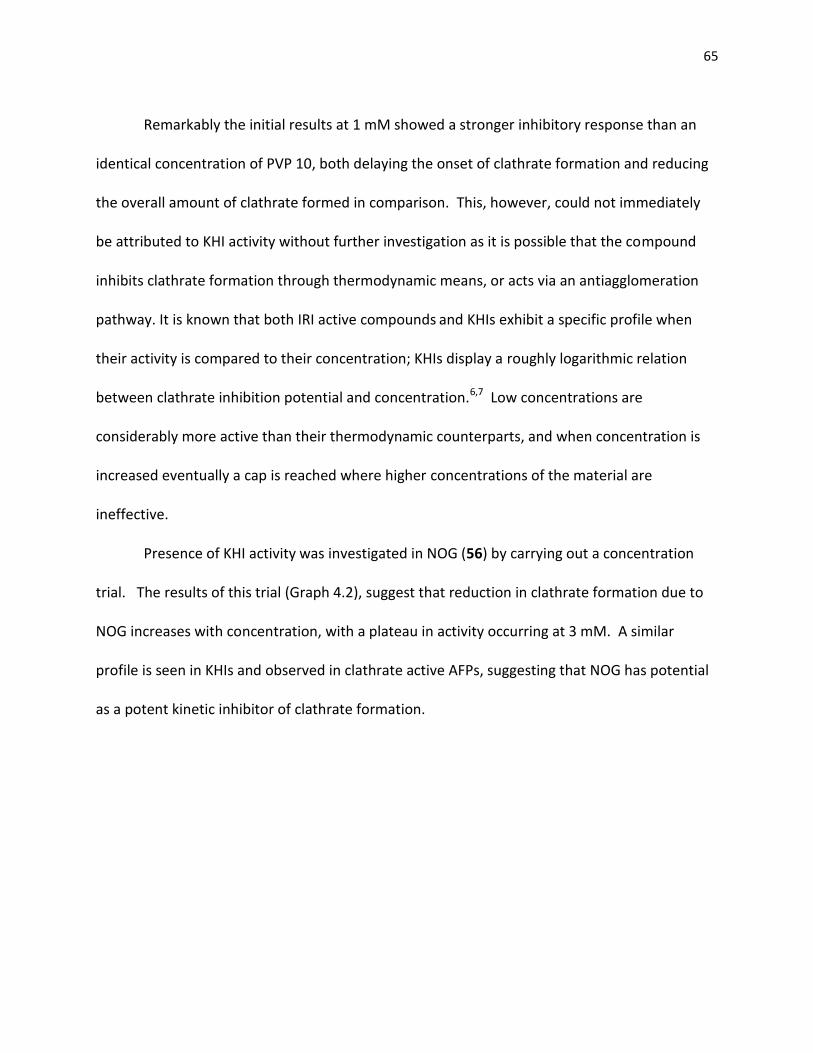
65
Remarkably the initial results at 1 mM showed a stronger inhibitory response than an
identical concentration of PVP 10, both delaying the onset of clathrate formation and reducing
the overall amount of clathrate formed in comparison. This, however, could not immediately
be attributed to KHI activity without further investigation as it is possible that the compound
inhibits clathrate formation through thermodynamic means, or acts via an antiagglomeration
pathway. It is known that both IRI active compounds and KHIs exhibit a specific profile when
their activity is compared to their concentration; KHIs display a roughly logarithmic relation
between clathrate inhibition potential and concentration.6,7 Low concentrations are
considerably more active than their thermodynamic counterparts, and when concentration is
increased eventually a cap is reached where higher concentrations of the material are
ineffective.
Presence of KHI activity was investigated in NOG (56) by carrying out a concentration
trial. The results of this trial (Graph 4.2), suggest that reduction in clathrate formation due to
NOG increases with concentration, with a plateau in activity occurring at 3 mM. A similar
profile is seen in KHIs and observed in clathrate active AFPs, suggesting that NOG has potential
as a potent kinetic inhibitor of clathrate formation.
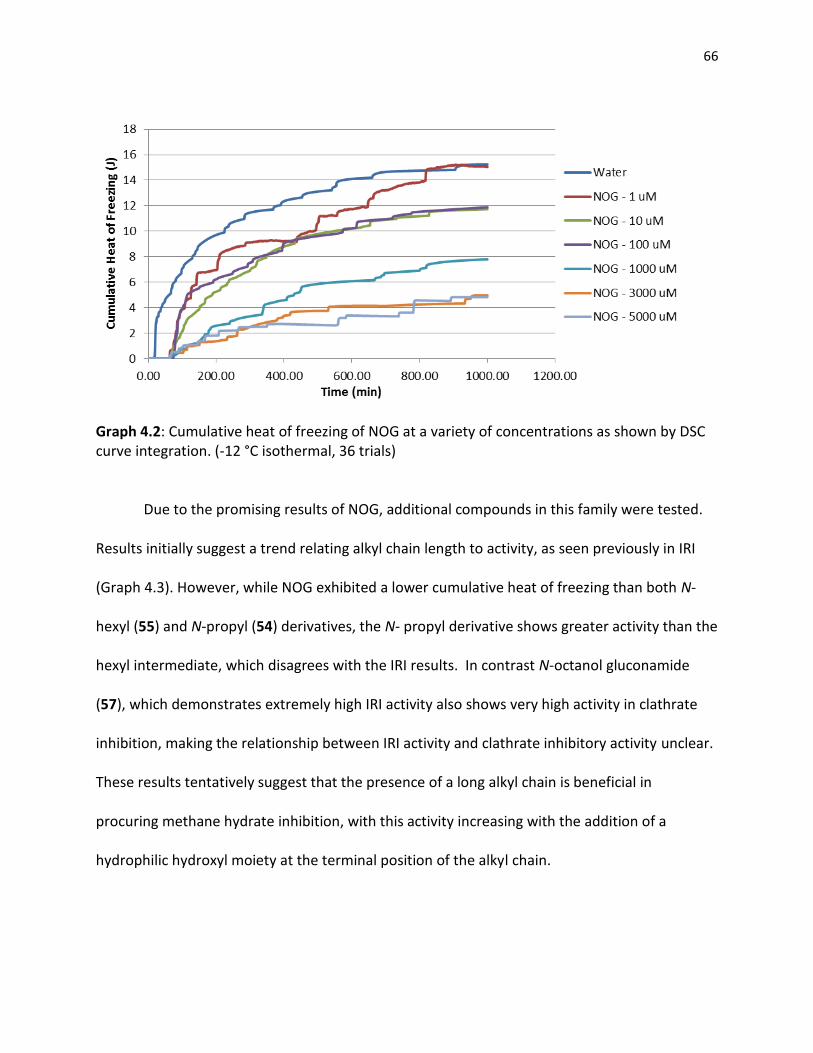
66
Graph 4.2: Cumulative heat of freezing of NOG at a variety of concentrations as shown by DSC curve integration. (-12 °C isothermal, 36 trials)
Due to the promising results of NOG, additional compounds in this family were tested.
Results initially suggest a trend relating alkyl chain length to activity, as seen previously in IRI
(Graph 4.3). However, while NOG exhibited a lower cumulative heat of freezing than both N-
hexyl (55) and N-propyl (54) derivatives, the N- propyl derivative shows greater activity than the
hexyl intermediate, which disagrees with the IRI results. In contrast N-octanol gluconamide
(57), which demonstrates extremely high IRI activity also shows very high activity in clathrate
inhibition, making the relationship between IRI activity and clathrate inhibitory activity unclear.
These results tentatively suggest that the presence of a long alkyl chain is beneficial in
procuring methane hydrate inhibition, with this activity increasing with the addition of a
hydrophilic hydroxyl moiety at the terminal position of the alkyl chain.
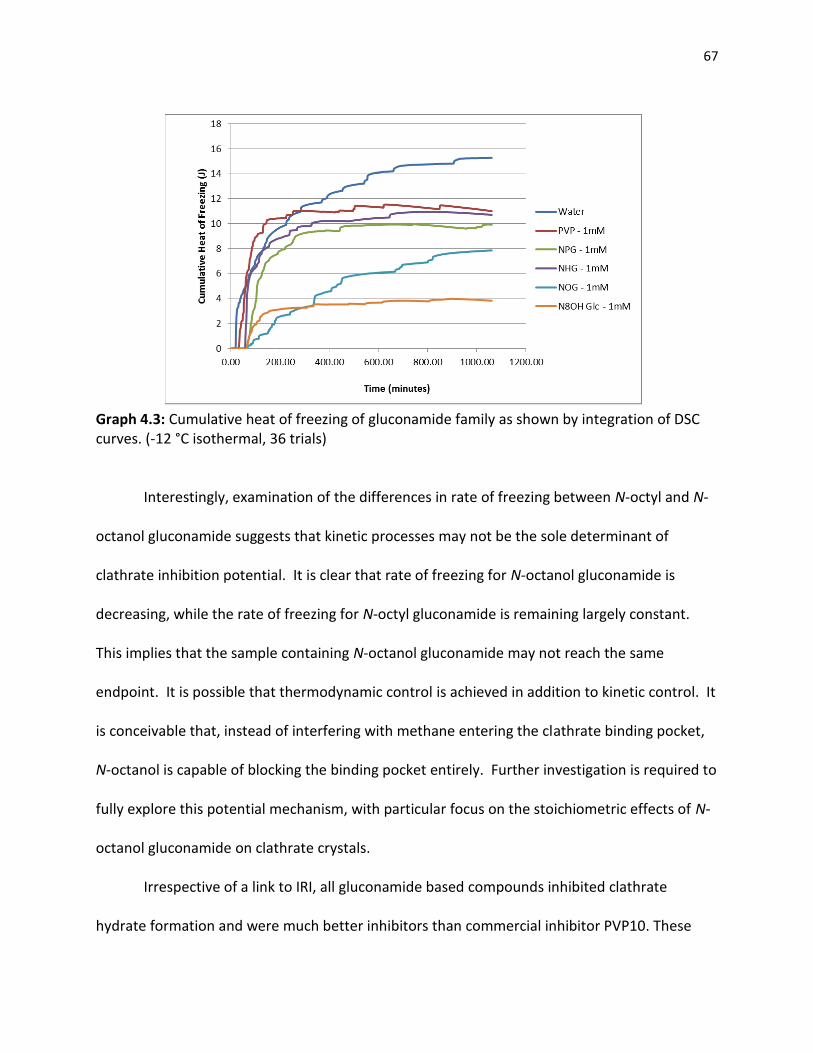
67
Graph 4.3: Cumulative heat of freezing of gluconamide family as shown by integration of DSC curves. (-12 °C isothermal, 36 trials)
Interestingly, examination of the differences in rate of freezing between N-octyl and N-
octanol gluconamide suggests that kinetic processes may not be the sole determinant of
clathrate inhibition potential. It is clear that rate of freezing for N-octanol gluconamide is
decreasing, while the rate of freezing for N-octyl gluconamide is remaining largely constant.
This implies that the sample containing N-octanol gluconamide may not reach the same
endpoint. It is possible that thermodynamic control is achieved in addition to kinetic control. It
is conceivable that, instead of interfering with methane entering the clathrate binding pocket,
N-octanol is capable of blocking the binding pocket entirely. Further investigation is required to
fully explore this potential mechanism, with particular focus on the stoichiometric effects of N-
octanol gluconamide on clathrate crystals.
Irrespective of a link to IRI, all gluconamide based compounds inhibited clathrate
hydrate formation and were much better inhibitors than commercial inhibitor PVP10. These
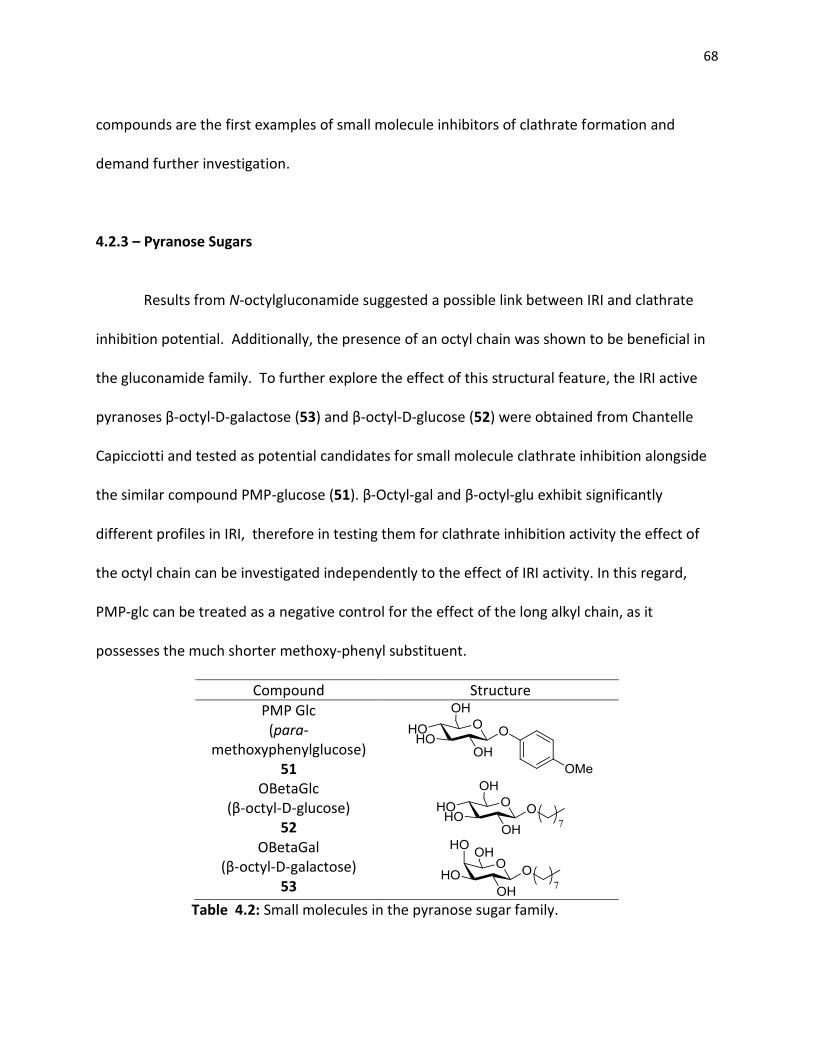
68
compounds are the first examples of small molecule inhibitors of clathrate formation and
demand further investigation.
4.2.3 – Pyranose Sugars
Results from N-octylgluconamide suggested a possible link between IRI and clathrate
inhibition potential. Additionally, the presence of an octyl chain was shown to be beneficial in
the gluconamide family. To further explore the effect of this structural feature, the IRI active
pyranoses β-octyl-D-galactose (53) and β-octyl-D-glucose (52) were obtained from Chantelle
Capicciotti and tested as potential candidates for small molecule clathrate inhibition alongside
the similar compound PMP-glucose (51). β-Octyl-gal and β-octyl-glu exhibit significantly
different profiles in IRI, therefore in testing them for clathrate inhibition activity the effect of
the octyl chain can be investigated independently to the effect of IRI activity. In this regard,
PMP-glc can be treated as a negative control for the effect of the long alkyl chain, as it
possesses the much shorter methoxy-phenyl substituent.
Compound Structure
PMP Glc (para-
methoxyphenylglucose) 51
OBetaGlc (β-octyl-D-glucose)
52 OBetaGal
(β-octyl-D-galactose) 53
Table 4.2: Small molecules in the pyranose sugar family.
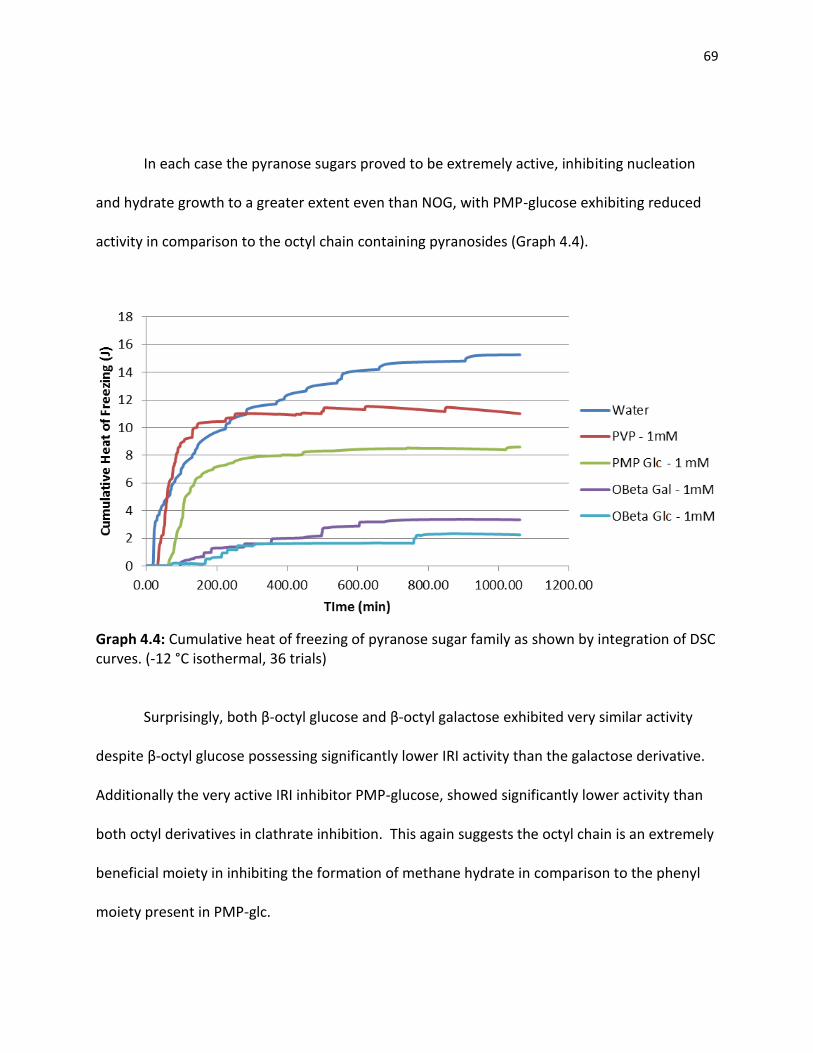
69
In each case the pyranose sugars proved to be extremely active, inhibiting nucleation
and hydrate growth to a greater extent even than NOG, with PMP-glucose exhibiting reduced
activity in comparison to the octyl chain containing pyranosides (Graph 4.4).
Graph 4.4: Cumulative heat of freezing of pyranose sugar family as shown by integration of DSC curves. (-12 °C isothermal, 36 trials)
Surprisingly, both β-octyl glucose and β-octyl galactose exhibited very similar activity
despite β-octyl glucose possessing significantly lower IRI activity than the galactose derivative.
Additionally the very active IRI inhibitor PMP-glucose, showed significantly lower activity than
both octyl derivatives in clathrate inhibition. This again suggests the octyl chain is an extremely
beneficial moiety in inhibiting the formation of methane hydrate in comparison to the phenyl
moiety present in PMP-glc.
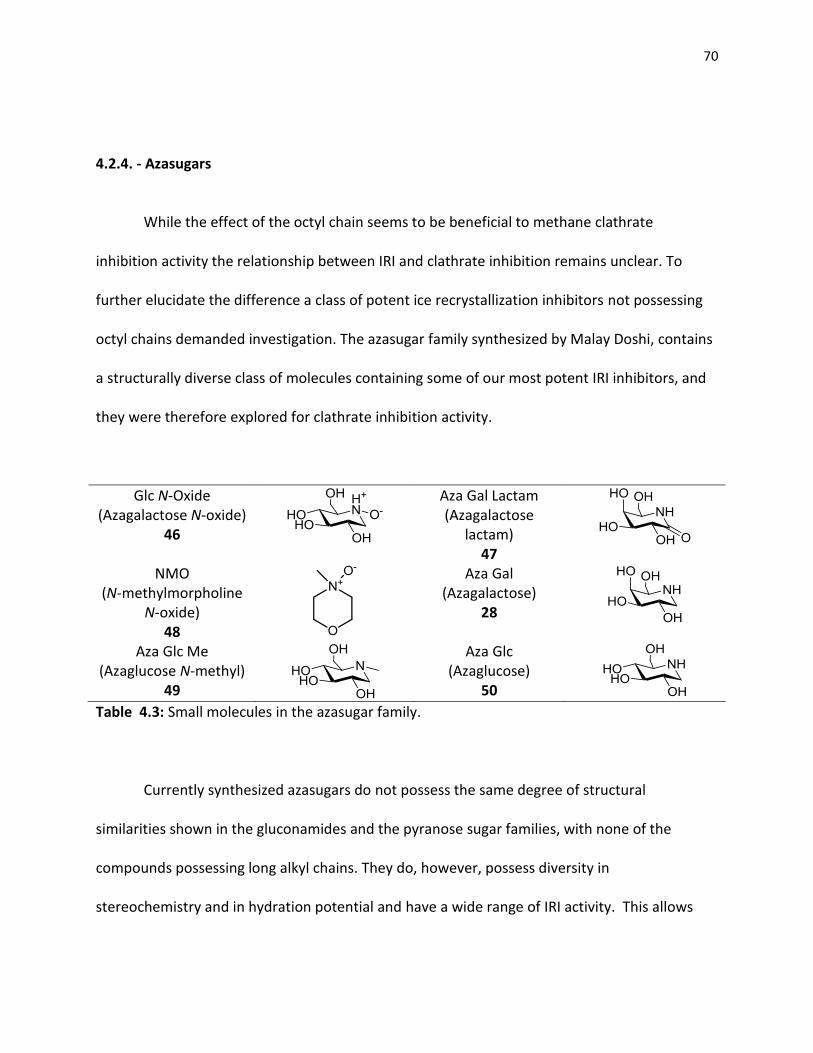
70
4.2.4. - Azasugars
While the effect of the octyl chain seems to be beneficial to methane clathrate
inhibition activity the relationship between IRI and clathrate inhibition remains unclear. To
further elucidate the difference a class of potent ice recrystallization inhibitors not possessing
octyl chains demanded investigation. The azasugar family synthesized by Malay Doshi, contains
a structurally diverse class of molecules containing some of our most potent IRI inhibitors, and
they were therefore explored for clathrate inhibition activity.
Glc N-Oxide (Azagalactose N-oxide)
46
Aza Gal Lactam (Azagalactose
lactam) 47
NMO (N-methylmorpholine
N-oxide) 48
Aza Gal (Azagalactose)
28
Aza Glc Me (Azaglucose N-methyl)
49
Aza Glc (Azaglucose)
50 Table 4.3: Small molecules in the azasugar family.
Currently synthesized azasugars do not possess the same degree of structural
similarities shown in the gluconamides and the pyranose sugar families, with none of the
compounds possessing long alkyl chains. They do, however, possess diversity in
stereochemistry and in hydration potential and have a wide range of IRI activity. This allows
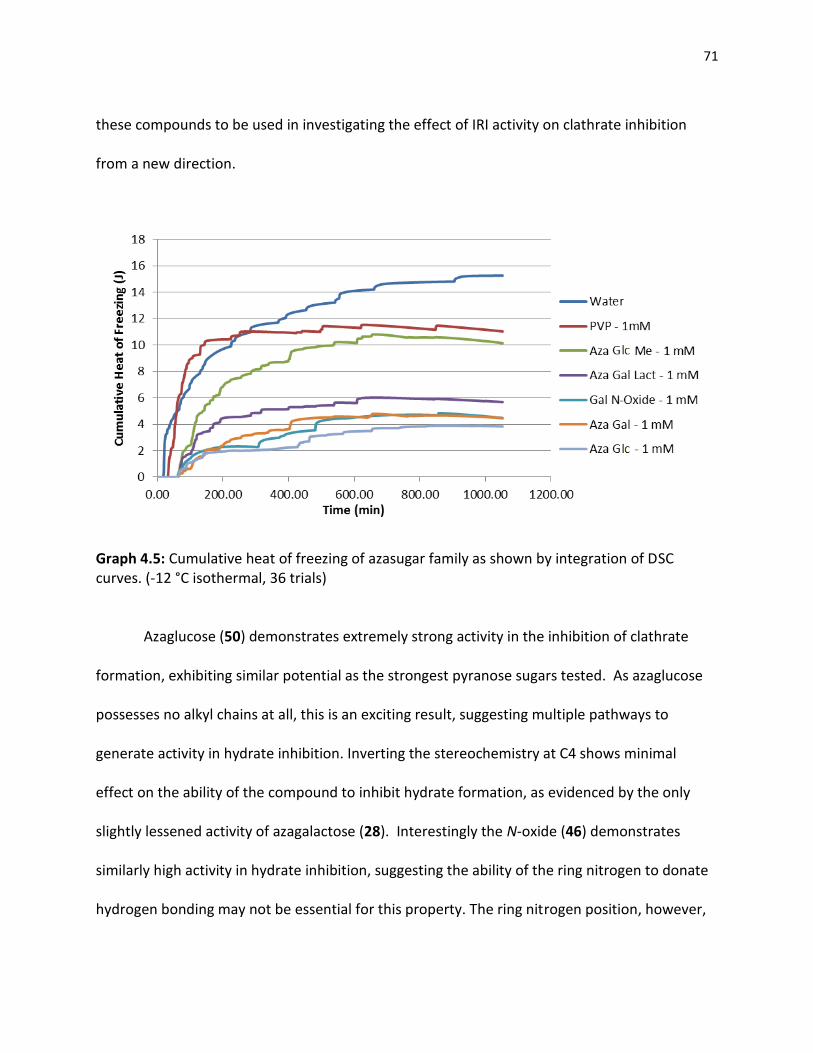
71
these compounds to be used in investigating the effect of IRI activity on clathrate inhibition
from a new direction.
Graph 4.5: Cumulative heat of freezing of azasugar family as shown by integration of DSC curves. (-12 °C isothermal, 36 trials)
Azaglucose (50) demonstrates extremely strong activity in the inhibition of clathrate
formation, exhibiting similar potential as the strongest pyranose sugars tested. As azaglucose
possesses no alkyl chains at all, this is an exciting result, suggesting multiple pathways to
generate activity in hydrate inhibition. Inverting the stereochemistry at C4 shows minimal
effect on the ability of the compound to inhibit hydrate formation, as evidenced by the only
slightly lessened activity of azagalactose (28). Interestingly the N-oxide (46) demonstrates
similarly high activity in hydrate inhibition, suggesting the ability of the ring nitrogen to donate
hydrogen bonding may not be essential for this property. The ring nitrogen position, however,
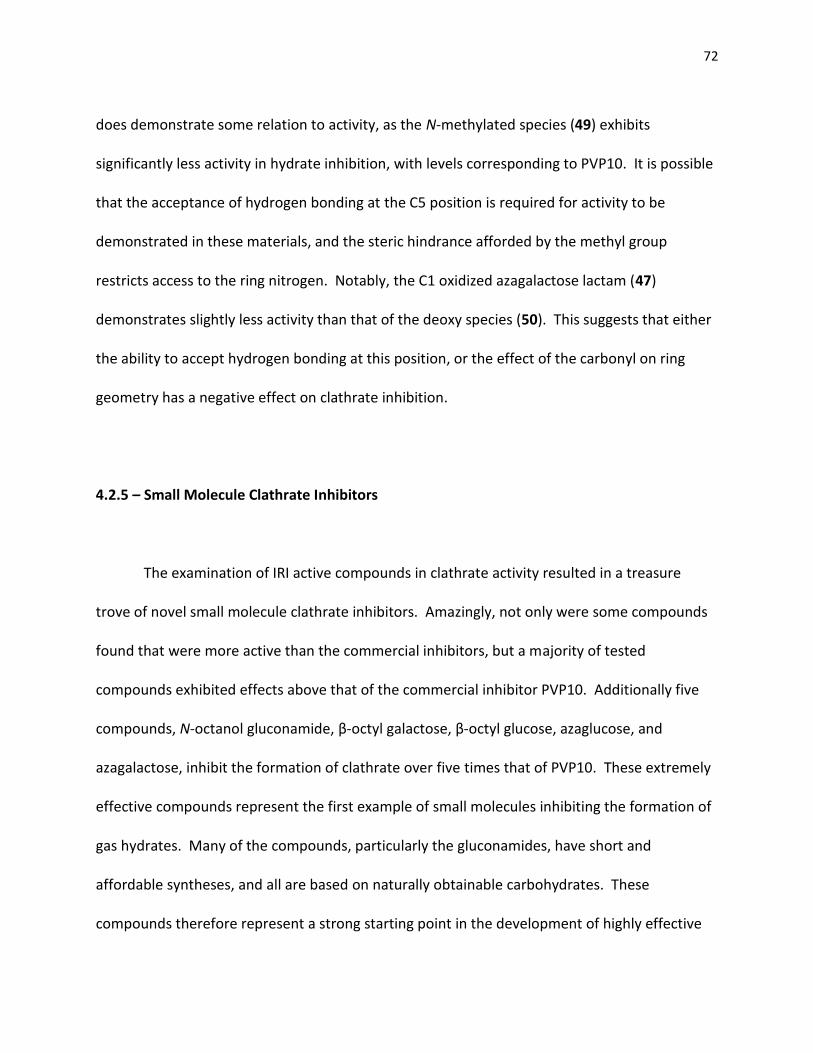
72
does demonstrate some relation to activity, as the N-methylated species (49) exhibits
significantly less activity in hydrate inhibition, with levels corresponding to PVP10. It is possible
that the acceptance of hydrogen bonding at the C5 position is required for activity to be
demonstrated in these materials, and the steric hindrance afforded by the methyl group
restricts access to the ring nitrogen. Notably, the C1 oxidized azagalactose lactam (47)
demonstrates slightly less activity than that of the deoxy species (50). This suggests that either
the ability to accept hydrogen bonding at this position, or the effect of the carbonyl on ring
geometry has a negative effect on clathrate inhibition.
4.2.5 – Small Molecule Clathrate Inhibitors
The examination of IRI active compounds in clathrate activity resulted in a treasure
trove of novel small molecule clathrate inhibitors. Amazingly, not only were some compounds
found that were more active than the commercial inhibitors, but a majority of tested
compounds exhibited effects above that of the commercial inhibitor PVP10. Additionally five
compounds, N-octanol gluconamide, β-octyl galactose, β-octyl glucose, azaglucose, and
azagalactose, inhibit the formation of clathrate over five times that of PVP10. These extremely
effective compounds represent the first example of small molecules inhibiting the formation of
gas hydrates. Many of the compounds, particularly the gluconamides, have short and
affordable syntheses, and all are based on naturally obtainable carbohydrates. These
compounds therefore represent a strong starting point in the development of highly effective
73
and environmentally friendly classes of KHIs and have recently been patented for their use in
industry8.
4.3 – Correlation of IRI Ability and Clathrate Inhibition
In testing IRI active compounds for their use in clathrates a number of anomalous
results have been seen. While certain aspects of IRI inhibition seem to have no effect on
clathrate inhibition, there is too much overlap to discount the effects of one having an effect on
the other. To effectively compare clathrate inhibition potential to IRI potential in a quantifiable
manner for the compounds tested a single value has to be given to represent the ability of the
compound to restrict hydrate formation. The maximum heat of freezing (MHF) reached by
each compound in a DSC curve shows the total amount of heat released by a system during a
trial run in Joules (J), which represents the degree to which a compound is able to restrict
clathrate formation over a 20 hour period. While limitations arise when compounds slow the
formation of clathrates, but do not restrict the total amount formed over a 20 hour period, it is
likely these compounds are ill suited to practical use due to their very short time frame of
activity. This allows maximum heat of freezing to be used as the ideal “clathrate inhibition”
value.
Interestingly, despite similar compounds exhibiting activity in both areas, IRI
effectiveness measured by percent mean grain size (MGS) and the ability to inhibit the
formation of methane clathrates measured by MHF do not appear to be directly analogous.
While galactose is more effective than glucose in both ice recrystallization inhibition9 and in the
74
inhibition of hydrate formation1, PVP has been shown to not possess any capacity for antifreeze
activity.10
Graph 4.6: Comparison of IRI activity (%MGS) with clathrate inhibition activity (MHF) in pyranose sugars. %MGS analyzed with respect to PBS at 22 mM.
* %MGS measured at 0.5 mM in NOG for solubility reasons.
Graph 4.6 shows that while PMP-glc and β-octyl-gal are both potent IRI inhibitors, PMP
is significantly less active than β-octyl-gal in clathrate inhibition exhibiting similar activity to
NOG. In contrast, while β-octyl-glc exhibits strong activity comparable to β-octyl-gal in
clathrate inhibition, it is significantly worse in terms of IRI ability. Interestingly when β-octyl-gal
is compared to the stereochemically different β-octyl-glc the MHF changes only slightly, while
the IRI potential changes dramatically. Additionally, when β-octyl-gal is compared to a
compound with a different alkyl substituent, PMP-Glc, the IRI potential remains consistent and
the MHF increases to a large extent. While an overarching conclusion cannot be reached from
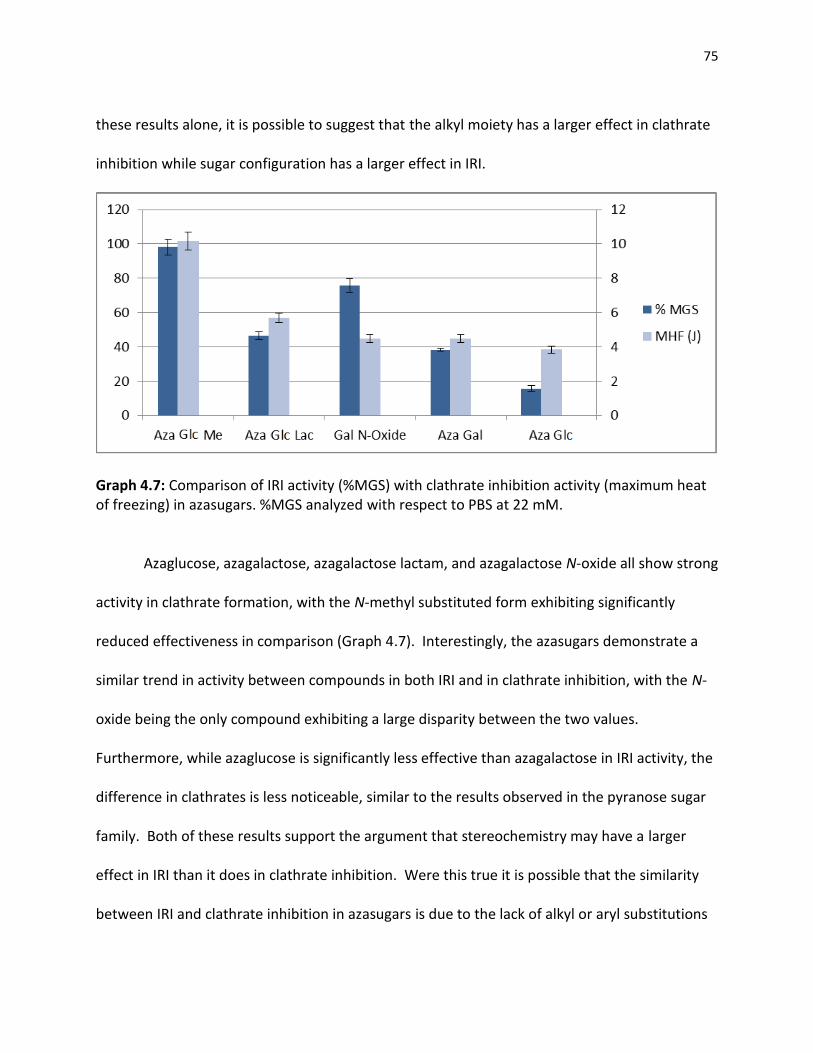
75
these results alone, it is possible to suggest that the alkyl moiety has a larger effect in clathrate
inhibition while sugar configuration has a larger effect in IRI.
Graph 4.7: Comparison of IRI activity (%MGS) with clathrate inhibition activity (maximum heat of freezing) in azasugars. %MGS analyzed with respect to PBS at 22 mM.
Azaglucose, azagalactose, azagalactose lactam, and azagalactose N-oxide all show strong
activity in clathrate formation, with the N-methyl substituted form exhibiting significantly
reduced effectiveness in comparison (Graph 4.7). Interestingly, the azasugars demonstrate a
similar trend in activity between compounds in both IRI and in clathrate inhibition, with the N-
oxide being the only compound exhibiting a large disparity between the two values.
Furthermore, while azaglucose is significantly less effective than azagalactose in IRI activity, the
difference in clathrates is less noticeable, similar to the results observed in the pyranose sugar
family. Both of these results support the argument that stereochemistry may have a larger
effect in IRI than it does in clathrate inhibition. Were this true it is possible that the similarity
between IRI and clathrate inhibition in azasugars is due to the lack of alkyl or aryl substitutions
76
on these compounds, which would cause larger changes in MHF than in IRI resulting in a greater
disparity between these values. Also of interest is the complete lack of activity of N-methyl
azagal in both clathrate inhibition and in IRI. This suggests that while certain structural
differences are more important in the different fields, certain major changes (such as blocking
the capacity for hydrogen bonds to form at the C5 position) are essential to both IRI and
clathrate inhibition.
The gluconamide family also shows a disconnect between clathrate activity and IRI
activity, unfortunately the solubility of these compounds in water is extremely limited requiring
concentrations lower than the standard 22 mM to be used in their testing. This restricts the
ability to compare IRI activity between compounds reliably. It is, however, possible to show
that NPG is almost completely inactive in IRI, compared to the high activity afforded by both
NHG and NOG. NPG is, in contrast, slightly more active in clathrate inhibition than NHG. NOG
maintains high activity in both assays (Table 4.5). This shows that chain length, while a direct
predictor of IRI ability in these compounds, is not as reliable an indicator of hydrate inhibition.
Of particular interest is the compound N-octanol gluconamide which exhibits the highest IRI
ability of all discussed compounds, and additionally displays extremely potent hydrate
inhibitory potential. It is possible that the presence of the long alkyl chain combined with the
terminal hydroxyl moiety is a particularly beneficial structure.
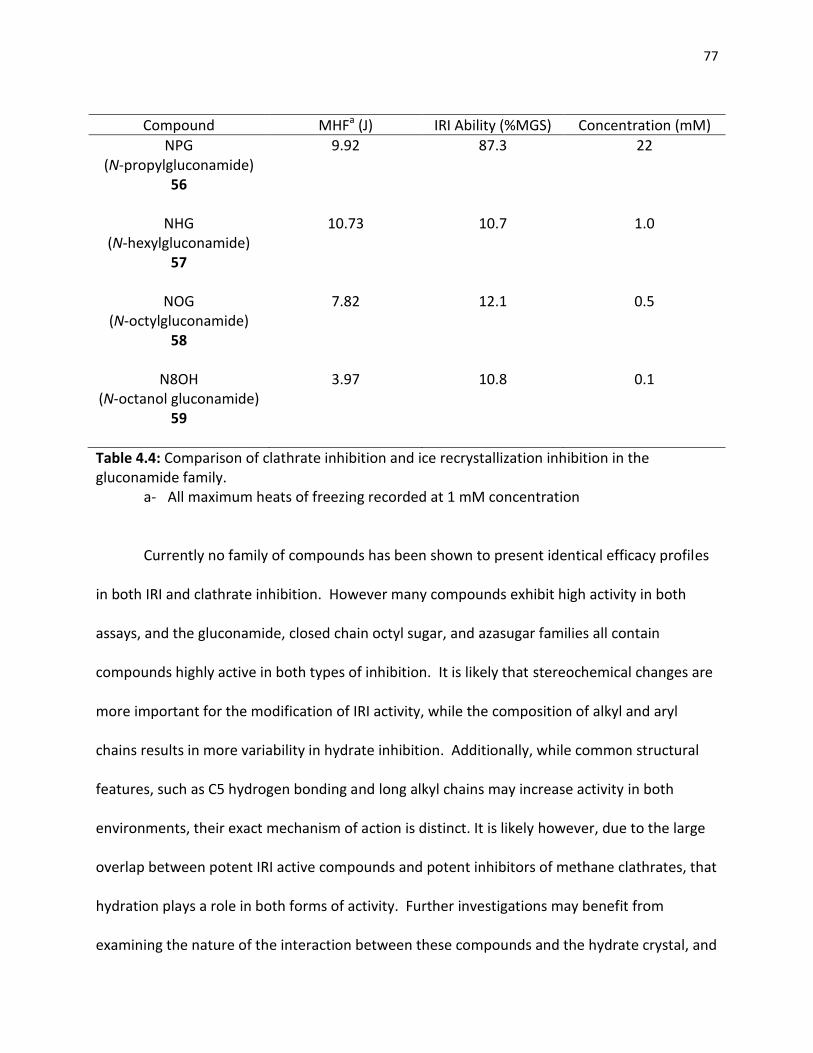
77
Compound MHFa (J) IRI Ability (%MGS) Concentration (mM)
NPG (N-propylgluconamide)
56
9.92 87.3 22
NHG
(N-hexylgluconamide) 57
10.73
10.7
1.0
NOG
(N-octylgluconamide) 58
7.82
12.1
0.5
N8OH (N-octanol gluconamide)
59
3.97 10.8 0.1
Table 4.4: Comparison of clathrate inhibition and ice recrystallization inhibition in the gluconamide family.
a- All maximum heats of freezing recorded at 1 mM concentration
Currently no family of compounds has been shown to present identical efficacy profiles
in both IRI and clathrate inhibition. However many compounds exhibit high activity in both
assays, and the gluconamide, closed chain octyl sugar, and azasugar families all contain
compounds highly active in both types of inhibition. It is likely that stereochemical changes are
more important for the modification of IRI activity, while the composition of alkyl and aryl
chains results in more variability in hydrate inhibition. Additionally, while common structural
features, such as C5 hydrogen bonding and long alkyl chains may increase activity in both
environments, their exact mechanism of action is distinct. It is likely however, due to the large
overlap between potent IRI active compounds and potent inhibitors of methane clathrates, that
hydration plays a role in both forms of activity. Further investigations may benefit from
examining the nature of the interaction between these compounds and the hydrate crystal, and
78
investigating the effect of hydration in environments containing high concentrations of natural
gasses. Examining the effects of these molecules in environments containing both hydrates and
water ice may also prove essential, particularly in those compounds active in both
environments.
79
References
1. Ohno, H., Susilo, R., Gordienko, R., Ripmeester, J., Walker, V.K. Chem. Eur. J. 2010, 16,
10409
2. O'Neill, M.J. Anal. Chem. 1964 36, 1238
3. Gonzalez, L., Ramis, X., Salla, J.M., Mantecon, A., Serra, A. Thermochem. Acta 2007, 464,
35
4. F. Haaf, A. Sanner and F. Straub Polymer J. 1985, 17, 143
5. H. Zeng, L. D. Wilson, V. K. Walker, J. A. Ripmeester, Can. J. Phys. 2003, 81, 17
6. Duman, J.G., DeVries, A.L. Cryobiology 1972, 9, 469
7. Jensen, L., Ramlov, H., Thomsen, K., von Solms, N. Ind. Eng. Chem. Res. 2010, 49, 1486
8. Provisional Patent Ben, R.N., Tonelli, D. “Inhibitors of Clathrate Hydrate Formation”
2012, SN 61/648999.
9. Tam, R., Czechura, P., Ferreria, S. S., Chaytor, J., Ben, R. N., J. Am. Chem. Soc. 2008, 130,
17494
10. H. Zeng, L. D. Wilson, V. K. Walker, J. A. Ripmeester, J. Am.Chem. Soc. 2006, 128, 2844

80
Chapter 5
Experimental Procedures
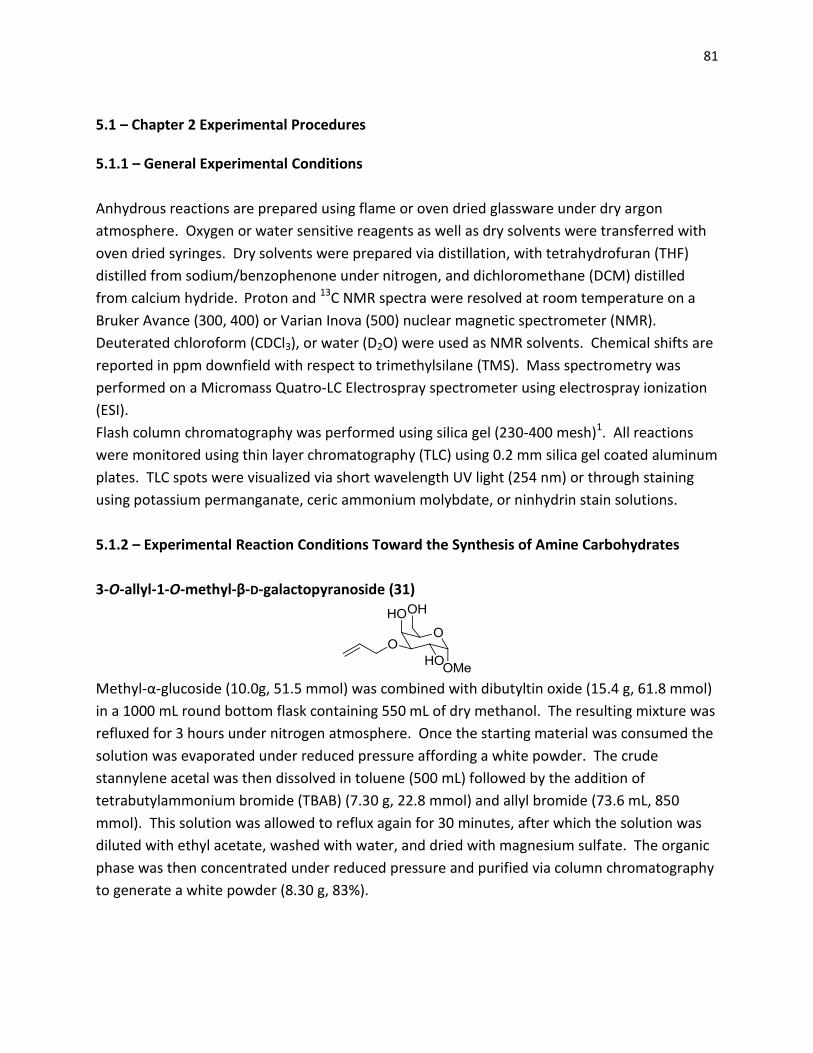
81
5.1 – Chapter 2 Experimental Procedures 5.1.1 – General Experimental Conditions
Anhydrous reactions are prepared using flame or oven dried glassware under dry argon
atmosphere. Oxygen or water sensitive reagents as well as dry solvents were transferred with
oven dried syringes. Dry solvents were prepared via distillation, with tetrahydrofuran (THF)
distilled from sodium/benzophenone under nitrogen, and dichloromethane (DCM) distilled
from calcium hydride. Proton and 13C NMR spectra were resolved at room temperature on a
Bruker Avance (300, 400) or Varian Inova (500) nuclear magnetic spectrometer (NMR).
Deuterated chloroform (CDCl3), or water (D2O) were used as NMR solvents. Chemical shifts are
reported in ppm downfield with respect to trimethylsilane (TMS). Mass spectrometry was
performed on a Micromass Quatro-LC Electrospray spectrometer using electrospray ionization
(ESI).
Flash column chromatography was performed using silica gel (230-400 mesh)1. All reactions
were monitored using thin layer chromatography (TLC) using 0.2 mm silica gel coated aluminum
plates. TLC spots were visualized via short wavelength UV light (254 nm) or through staining
using potassium permanganate, ceric ammonium molybdate, or ninhydrin stain solutions.
5.1.2 – Experimental Reaction Conditions Toward the Synthesis of Amine Carbohydrates
3-O-allyl-1-O-methyl-β-D-galactopyranoside (31)
Methyl-α-glucoside (10.0g, 51.5 mmol) was combined with dibutyltin oxide (15.4 g, 61.8 mmol)
in a 1000 mL round bottom flask containing 550 mL of dry methanol. The resulting mixture was
refluxed for 3 hours under nitrogen atmosphere. Once the starting material was consumed the
solution was evaporated under reduced pressure affording a white powder. The crude
stannylene acetal was then dissolved in toluene (500 mL) followed by the addition of
tetrabutylammonium bromide (TBAB) (7.30 g, 22.8 mmol) and allyl bromide (73.6 mL, 850
mmol). This solution was allowed to reflux again for 30 minutes, after which the solution was
diluted with ethyl acetate, washed with water, and dried with magnesium sulfate. The organic
phase was then concentrated under reduced pressure and purified via column chromatography
to generate a white powder (8.30 g, 83%).
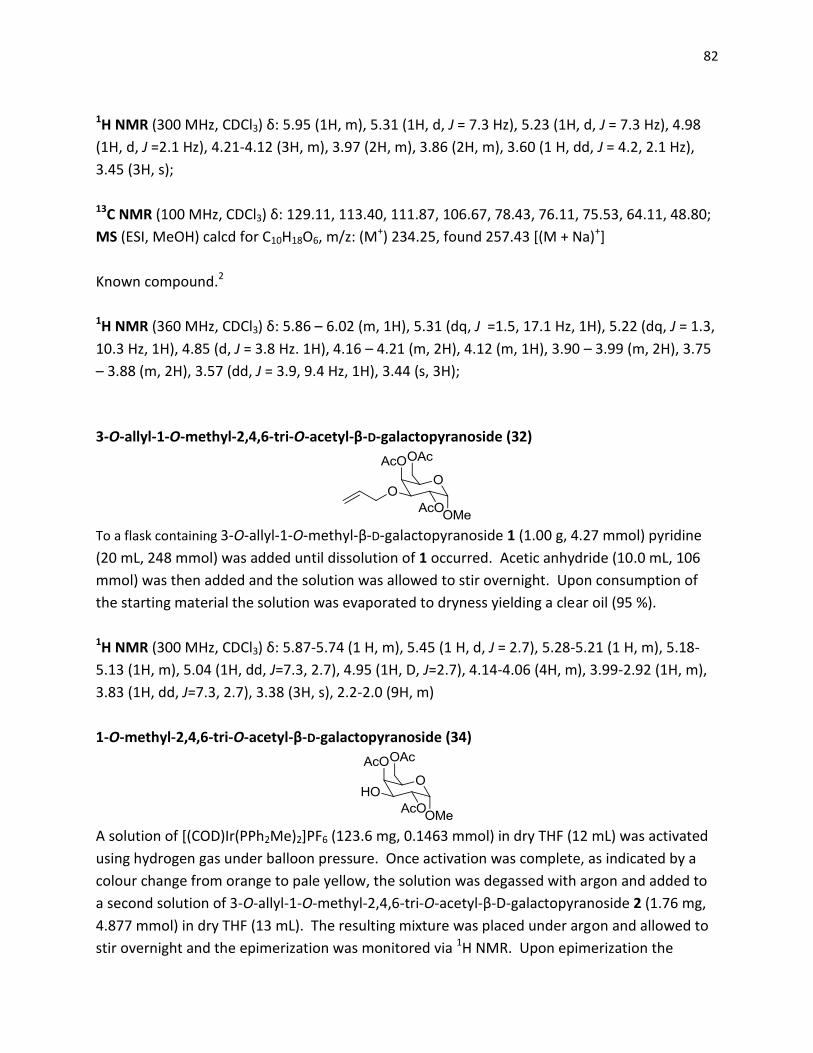
82
1H NMR (300 MHz, CDCl3) δ: 5.95 (1H, m), 5.31 (1H, d, J = 7.3 Hz), 5.23 (1H, d, J = 7.3 Hz), 4.98
(1H, d, J =2.1 Hz), 4.21-4.12 (3H, m), 3.97 (2H, m), 3.86 (2H, m), 3.60 (1 H, dd, J = 4.2, 2.1 Hz),
3.45 (3H, s);
13C NMR (100 MHz, CDCl3) δ: 129.11, 113.40, 111.87, 106.67, 78.43, 76.11, 75.53, 64.11, 48.80;
MS (ESI, MeOH) calcd for C10H18O6, m/z: (M+) 234.25, found 257.43 [(M + Na)+]
Known compound.2
1H NMR (360 MHz, CDCl3) δ: 5.86 – 6.02 (m, 1H), 5.31 (dq, J =1.5, 17.1 Hz, 1H), 5.22 (dq, J = 1.3,
10.3 Hz, 1H), 4.85 (d, J = 3.8 Hz. 1H), 4.16 – 4.21 (m, 2H), 4.12 (m, 1H), 3.90 – 3.99 (m, 2H), 3.75
– 3.88 (m, 2H), 3.57 (dd, J = 3.9, 9.4 Hz, 1H), 3.44 (s, 3H);
3-O-allyl-1-O-methyl-2,4,6-tri-O-acetyl-β-D-galactopyranoside (32)
To a flask containing 3-O-allyl-1-O-methyl-β-D-galactopyranoside 1 (1.00 g, 4.27 mmol) pyridine
(20 mL, 248 mmol) was added until dissolution of 1 occurred. Acetic anhydride (10.0 mL, 106
mmol) was then added and the solution was allowed to stir overnight. Upon consumption of
the starting material the solution was evaporated to dryness yielding a clear oil (95 %).
1H NMR (300 MHz, CDCl3) δ: 5.87-5.74 (1 H, m), 5.45 (1 H, d, J = 2.7), 5.28-5.21 (1 H, m), 5.18-
5.13 (1H, m), 5.04 (1H, dd, J=7.3, 2.7), 4.95 (1H, D, J=2.7), 4.14-4.06 (4H, m), 3.99-2.92 (1H, m),
3.83 (1H, dd, J=7.3, 2.7), 3.38 (3H, s), 2.2-2.0 (9H, m)
1-O-methyl-2,4,6-tri-O-acetyl-β-D-galactopyranoside (34)
A solution of [(COD)Ir(PPh2Me)2]PF6 (123.6 mg, 0.1463 mmol) in dry THF (12 mL) was activated
using hydrogen gas under balloon pressure. Once activation was complete, as indicated by a
colour change from orange to pale yellow, the solution was degassed with argon and added to
a second solution of 3-O-allyl-1-O-methyl-2,4,6-tri-O-acetyl-β-D-galactopyranoside 2 (1.76 mg,
4.877 mmol) in dry THF (13 mL). The resulting mixture was placed under argon and allowed to
stir overnight and the epimerization was monitored via 1H NMR. Upon epimerization the
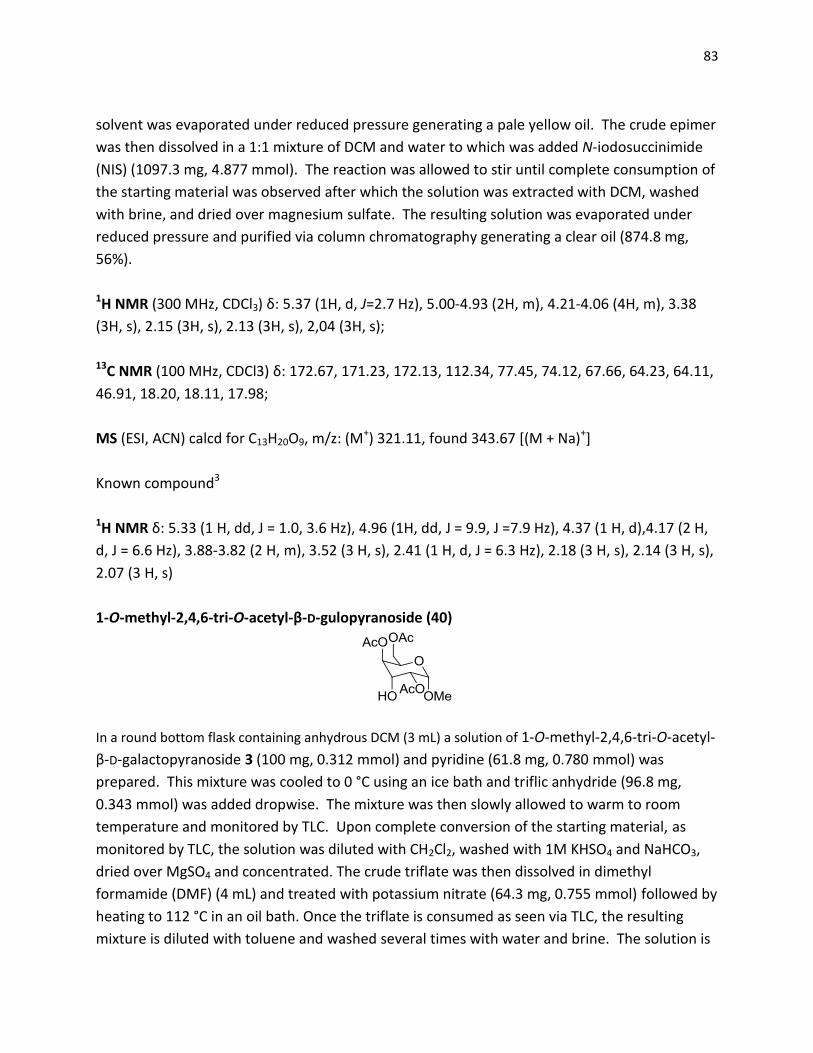
83
solvent was evaporated under reduced pressure generating a pale yellow oil. The crude epimer
was then dissolved in a 1:1 mixture of DCM and water to which was added N-iodosuccinimide
(NIS) (1097.3 mg, 4.877 mmol). The reaction was allowed to stir until complete consumption of
the starting material was observed after which the solution was extracted with DCM, washed
with brine, and dried over magnesium sulfate. The resulting solution was evaporated under
reduced pressure and purified via column chromatography generating a clear oil (874.8 mg,
56%).
1H NMR (300 MHz, CDCl3) δ: 5.37 (1H, d, J=2.7 Hz), 5.00-4.93 (2H, m), 4.21-4.06 (4H, m), 3.38
(3H, s), 2.15 (3H, s), 2.13 (3H, s), 2,04 (3H, s);
13C NMR (100 MHz, CDCl3) δ: 172.67, 171.23, 172.13, 112.34, 77.45, 74.12, 67.66, 64.23, 64.11,
46.91, 18.20, 18.11, 17.98;
MS (ESI, ACN) calcd for C13H20O9, m/z: (M+) 321.11, found 343.67 [(M + Na)+]
Known compound3
1H NMR δ: 5.33 (1 H, dd, J = 1.0, 3.6 Hz), 4.96 (1H, dd, J = 9.9, J =7.9 Hz), 4.37 (1 H, d),4.17 (2 H,
d, J = 6.6 Hz), 3.88-3.82 (2 H, m), 3.52 (3 H, s), 2.41 (1 H, d, J = 6.3 Hz), 2.18 (3 H, s), 2.14 (3 H, s),
2.07 (3 H, s)
1-O-methyl-2,4,6-tri-O-acetyl-β-D-gulopyranoside (40)
In a round bottom flask containing anhydrous DCM (3 mL) a solution of 1-O-methyl-2,4,6-tri-O-acetyl-
β-D-galactopyranoside 3 (100 mg, 0.312 mmol) and pyridine (61.8 mg, 0.780 mmol) was
prepared. This mixture was cooled to 0 °C using an ice bath and triflic anhydride (96.8 mg,
0.343 mmol) was added dropwise. The mixture was then slowly allowed to warm to room
temperature and monitored by TLC. Upon complete conversion of the starting material, as
monitored by TLC, the solution was diluted with CH2Cl2, washed with 1M KHSO4 and NaHCO3,
dried over MgSO4 and concentrated. The crude triflate was then dissolved in dimethyl
formamide (DMF) (4 mL) and treated with potassium nitrate (64.3 mg, 0.755 mmol) followed by
heating to 112 °C in an oil bath. Once the triflate is consumed as seen via TLC, the resulting
mixture is diluted with toluene and washed several times with water and brine. The solution is
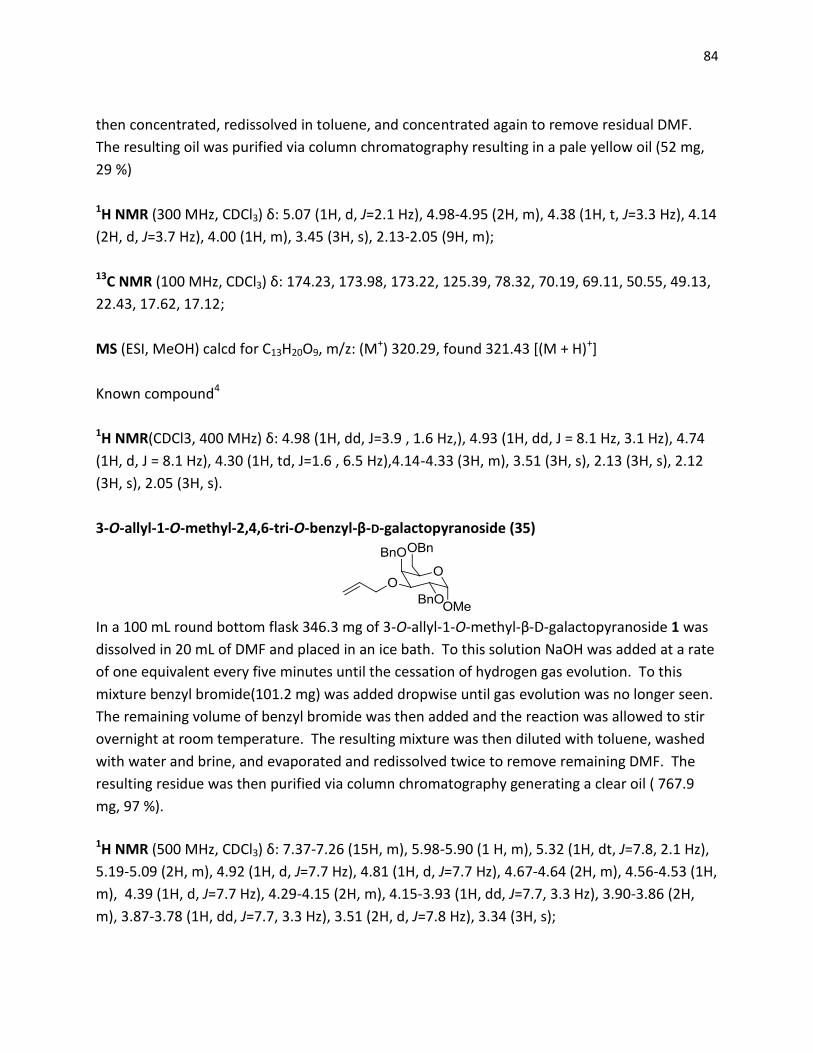
84
then concentrated, redissolved in toluene, and concentrated again to remove residual DMF.
The resulting oil was purified via column chromatography resulting in a pale yellow oil (52 mg,
29 %)
1H NMR (300 MHz, CDCl3) δ: 5.07 (1H, d, J=2.1 Hz), 4.98-4.95 (2H, m), 4.38 (1H, t, J=3.3 Hz), 4.14
(2H, d, J=3.7 Hz), 4.00 (1H, m), 3.45 (3H, s), 2.13-2.05 (9H, m);
13C NMR (100 MHz, CDCl3) δ: 174.23, 173.98, 173.22, 125.39, 78.32, 70.19, 69.11, 50.55, 49.13,
22.43, 17.62, 17.12;
MS (ESI, MeOH) calcd for C13H20O9, m/z: (M+) 320.29, found 321.43 [(M + H)+]
Known compound4
1H NMR(CDCl3, 400 MHz) δ: 4.98 (1H, dd, J=3.9 , 1.6 Hz,), 4.93 (1H, dd, J = 8.1 Hz, 3.1 Hz), 4.74
(1H, d, J = 8.1 Hz), 4.30 (1H, td, J=1.6 , 6.5 Hz),4.14-4.33 (3H, m), 3.51 (3H, s), 2.13 (3H, s), 2.12
(3H, s), 2.05 (3H, s).
3-O-allyl-1-O-methyl-2,4,6-tri-O-benzyl-β-D-galactopyranoside (35)
In a 100 mL round bottom flask 346.3 mg of 3-O-allyl-1-O-methyl-β-D-galactopyranoside 1 was
dissolved in 20 mL of DMF and placed in an ice bath. To this solution NaOH was added at a rate
of one equivalent every five minutes until the cessation of hydrogen gas evolution. To this
mixture benzyl bromide(101.2 mg) was added dropwise until gas evolution was no longer seen.
The remaining volume of benzyl bromide was then added and the reaction was allowed to stir
overnight at room temperature. The resulting mixture was then diluted with toluene, washed
with water and brine, and evaporated and redissolved twice to remove remaining DMF. The
resulting residue was then purified via column chromatography generating a clear oil ( 767.9
mg, 97 %).
1H NMR (500 MHz, CDCl3) δ: 7.37-7.26 (15H, m), 5.98-5.90 (1 H, m), 5.32 (1H, dt, J=7.8, 2.1 Hz),
5.19-5.09 (2H, m), 4.92 (1H, d, J=7.7 Hz), 4.81 (1H, d, J=7.7 Hz), 4.67-4.64 (2H, m), 4.56-4.53 (1H,
m), 4.39 (1H, d, J=7.7 Hz), 4.29-4.15 (2H, m), 4.15-3.93 (1H, dd, J=7.7, 3.3 Hz), 3.90-3.86 (2H,
m), 3.87-3.78 (1H, dd, J=7.7, 3.3 Hz), 3.51 (2H, d, J=7.8 Hz), 3.34 (3H, s);
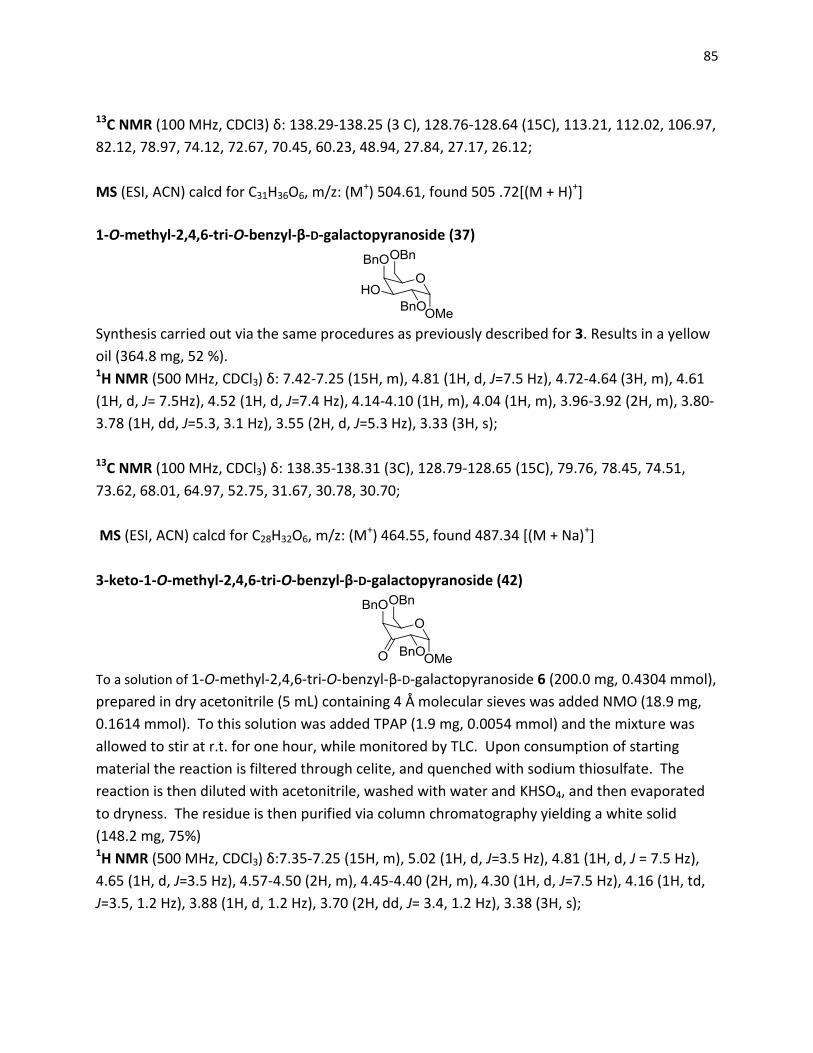
85
13C NMR (100 MHz, CDCl3) δ: 138.29-138.25 (3 C), 128.76-128.64 (15C), 113.21, 112.02, 106.97,
82.12, 78.97, 74.12, 72.67, 70.45, 60.23, 48.94, 27.84, 27.17, 26.12;
MS (ESI, ACN) calcd for C31H36O6, m/z: (M+) 504.61, found 505 .72[(M + H)+]
1-O-methyl-2,4,6-tri-O-benzyl-β-D-galactopyranoside (37)
Synthesis carried out via the same procedures as previously described for 3. Results in a yellow
oil (364.8 mg, 52 %). 1H NMR (500 MHz, CDCl3) δ: 7.42-7.25 (15H, m), 4.81 (1H, d, J=7.5 Hz), 4.72-4.64 (3H, m), 4.61
(1H, d, J= 7.5Hz), 4.52 (1H, d, J=7.4 Hz), 4.14-4.10 (1H, m), 4.04 (1H, m), 3.96-3.92 (2H, m), 3.80-
3.78 (1H, dd, J=5.3, 3.1 Hz), 3.55 (2H, d, J=5.3 Hz), 3.33 (3H, s);
13C NMR (100 MHz, CDCl3) δ: 138.35-138.31 (3C), 128.79-128.65 (15C), 79.76, 78.45, 74.51,
73.62, 68.01, 64.97, 52.75, 31.67, 30.78, 30.70;
MS (ESI, ACN) calcd for C28H32O6, m/z: (M+) 464.55, found 487.34 [(M + Na)+]
3-keto-1-O-methyl-2,4,6-tri-O-benzyl-β-D-galactopyranoside (42)
To a solution of 1-O-methyl-2,4,6-tri-O-benzyl-β-D-galactopyranoside 6 (200.0 mg, 0.4304 mmol),
prepared in dry acetonitrile (5 mL) containing 4 Å molecular sieves was added NMO (18.9 mg,
0.1614 mmol). To this solution was added TPAP (1.9 mg, 0.0054 mmol) and the mixture was
allowed to stir at r.t. for one hour, while monitored by TLC. Upon consumption of starting
material the reaction is filtered through celite, and quenched with sodium thiosulfate. The
reaction is then diluted with acetonitrile, washed with water and KHSO4, and then evaporated
to dryness. The residue is then purified via column chromatography yielding a white solid
(148.2 mg, 75%) 1H NMR (500 MHz, CDCl3) δ:7.35-7.25 (15H, m), 5.02 (1H, d, J=3.5 Hz), 4.81 (1H, d, J = 7.5 Hz),
4.65 (1H, d, J=3.5 Hz), 4.57-4.50 (2H, m), 4.45-4.40 (2H, m), 4.30 (1H, d, J=7.5 Hz), 4.16 (1H, td,
J=3.5, 1.2 Hz), 3.88 (1H, d, 1.2 Hz), 3.70 (2H, dd, J= 3.4, 1.2 Hz), 3.38 (3H, s);
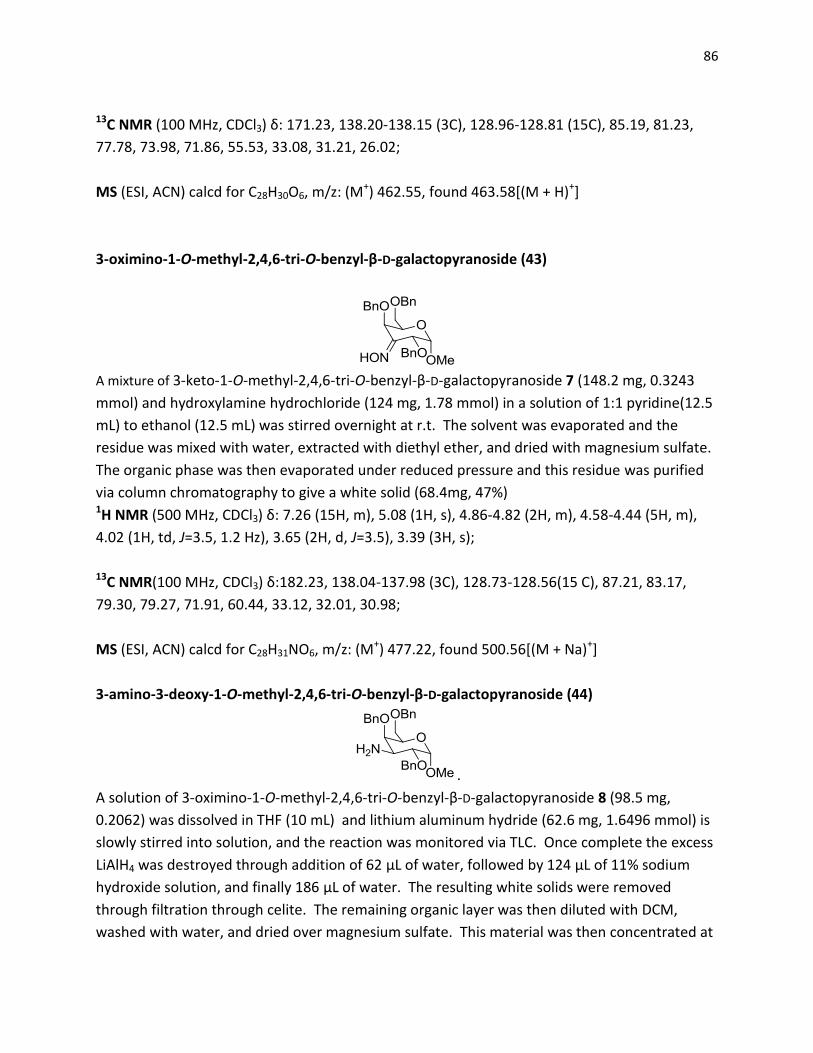
86
13C NMR (100 MHz, CDCl3) δ: 171.23, 138.20-138.15 (3C), 128.96-128.81 (15C), 85.19, 81.23,
77.78, 73.98, 71.86, 55.53, 33.08, 31.21, 26.02;
MS (ESI, ACN) calcd for C28H30O6, m/z: (M+) 462.55, found 463.58[(M + H)+]
3-oximino-1-O-methyl-2,4,6-tri-O-benzyl-β-D-galactopyranoside (43)
A mixture of 3-keto-1-O-methyl-2,4,6-tri-O-benzyl-β-D-galactopyranoside 7 (148.2 mg, 0.3243
mmol) and hydroxylamine hydrochloride (124 mg, 1.78 mmol) in a solution of 1:1 pyridine(12.5
mL) to ethanol (12.5 mL) was stirred overnight at r.t. The solvent was evaporated and the
residue was mixed with water, extracted with diethyl ether, and dried with magnesium sulfate.
The organic phase was then evaporated under reduced pressure and this residue was purified
via column chromatography to give a white solid (68.4mg, 47%) 1H NMR (500 MHz, CDCl3) δ: 7.26 (15H, m), 5.08 (1H, s), 4.86-4.82 (2H, m), 4.58-4.44 (5H, m),
4.02 (1H, td, J=3.5, 1.2 Hz), 3.65 (2H, d, J=3.5), 3.39 (3H, s);
13C NMR(100 MHz, CDCl3) δ:182.23, 138.04-137.98 (3C), 128.73-128.56(15 C), 87.21, 83.17,
79.30, 79.27, 71.91, 60.44, 33.12, 32.01, 30.98;
MS (ESI, ACN) calcd for C28H31NO6, m/z: (M+) 477.22, found 500.56[(M + Na)+]
3-amino-3-deoxy-1-O-methyl-2,4,6-tri-O-benzyl-β-D-galactopyranoside (44)
.
A solution of 3-oximino-1-O-methyl-2,4,6-tri-O-benzyl-β-D-galactopyranoside 8 (98.5 mg,
0.2062) was dissolved in THF (10 mL) and lithium aluminum hydride (62.6 mg, 1.6496 mmol) is
slowly stirred into solution, and the reaction was monitored via TLC. Once complete the excess
LiAlH4 was destroyed through addition of 62 µL of water, followed by 124 µL of 11% sodium
hydroxide solution, and finally 186 µL of water. The resulting white solids were removed
through filtration through celite. The remaining organic layer was then diluted with DCM,
washed with water, and dried over magnesium sulfate. This material was then concentrated at
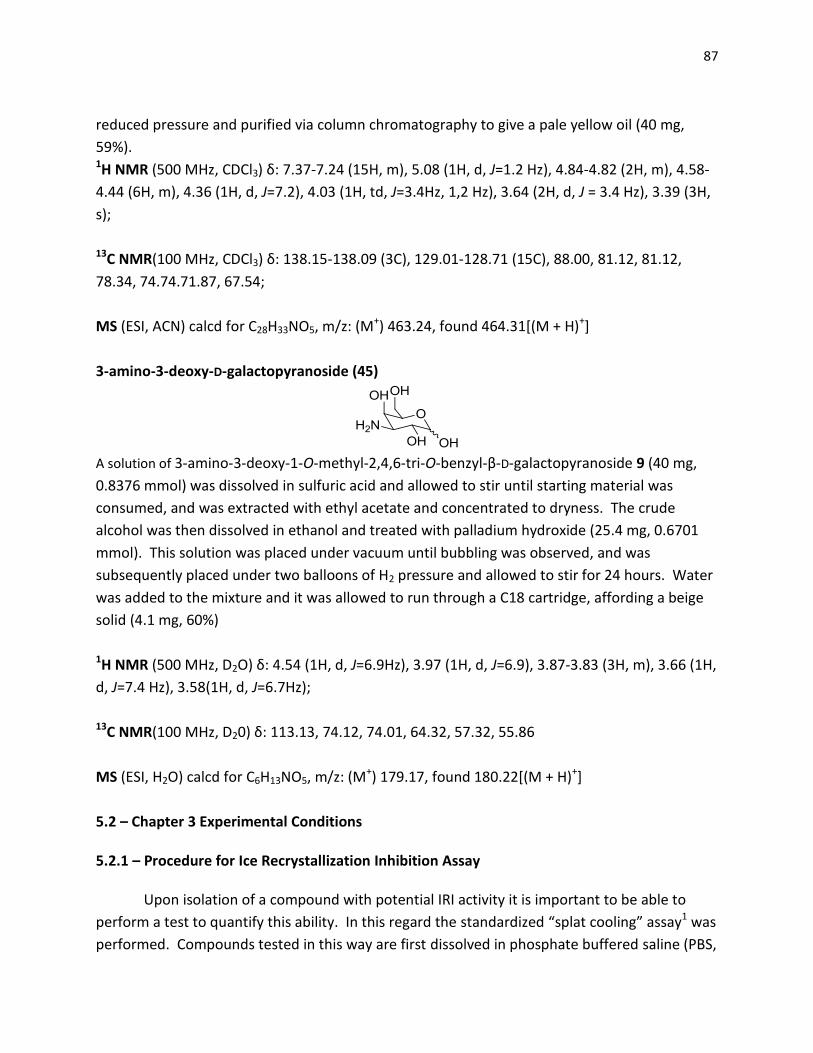
87
reduced pressure and purified via column chromatography to give a pale yellow oil (40 mg,
59%). 1H NMR (500 MHz, CDCl3) δ: 7.37-7.24 (15H, m), 5.08 (1H, d, J=1.2 Hz), 4.84-4.82 (2H, m), 4.58-
4.44 (6H, m), 4.36 (1H, d, J=7.2), 4.03 (1H, td, J=3.4Hz, 1,2 Hz), 3.64 (2H, d, J = 3.4 Hz), 3.39 (3H,
s);
13C NMR(100 MHz, CDCl3) δ: 138.15-138.09 (3C), 129.01-128.71 (15C), 88.00, 81.12, 81.12,
78.34, 74.74.71.87, 67.54;
MS (ESI, ACN) calcd for C28H33NO5, m/z: (M+) 463.24, found 464.31[(M + H)+]
3-amino-3-deoxy-D-galactopyranoside (45)
A solution of 3-amino-3-deoxy-1-O-methyl-2,4,6-tri-O-benzyl-β-D-galactopyranoside 9 (40 mg,
0.8376 mmol) was dissolved in sulfuric acid and allowed to stir until starting material was
consumed, and was extracted with ethyl acetate and concentrated to dryness. The crude
alcohol was then dissolved in ethanol and treated with palladium hydroxide (25.4 mg, 0.6701
mmol). This solution was placed under vacuum until bubbling was observed, and was
subsequently placed under two balloons of H2 pressure and allowed to stir for 24 hours. Water
was added to the mixture and it was allowed to run through a C18 cartridge, affording a beige
solid (4.1 mg, 60%)
1H NMR (500 MHz, D2O) δ: 4.54 (1H, d, J=6.9Hz), 3.97 (1H, d, J=6.9), 3.87-3.83 (3H, m), 3.66 (1H,
d, J=7.4 Hz), 3.58(1H, d, J=6.7Hz);
13C NMR(100 MHz, D20) δ: 113.13, 74.12, 74.01, 64.32, 57.32, 55.86
MS (ESI, H2O) calcd for C6H13NO5, m/z: (M+) 179.17, found 180.22[(M + H)+]
5.2 – Chapter 3 Experimental Conditions 5.2.1 – Procedure for Ice Recrystallization Inhibition Assay
Upon isolation of a compound with potential IRI activity it is important to be able to
perform a test to quantify this ability. In this regard the standardized “splat cooling” assay1 was
performed. Compounds tested in this way are first dissolved in phosphate buffered saline (PBS,
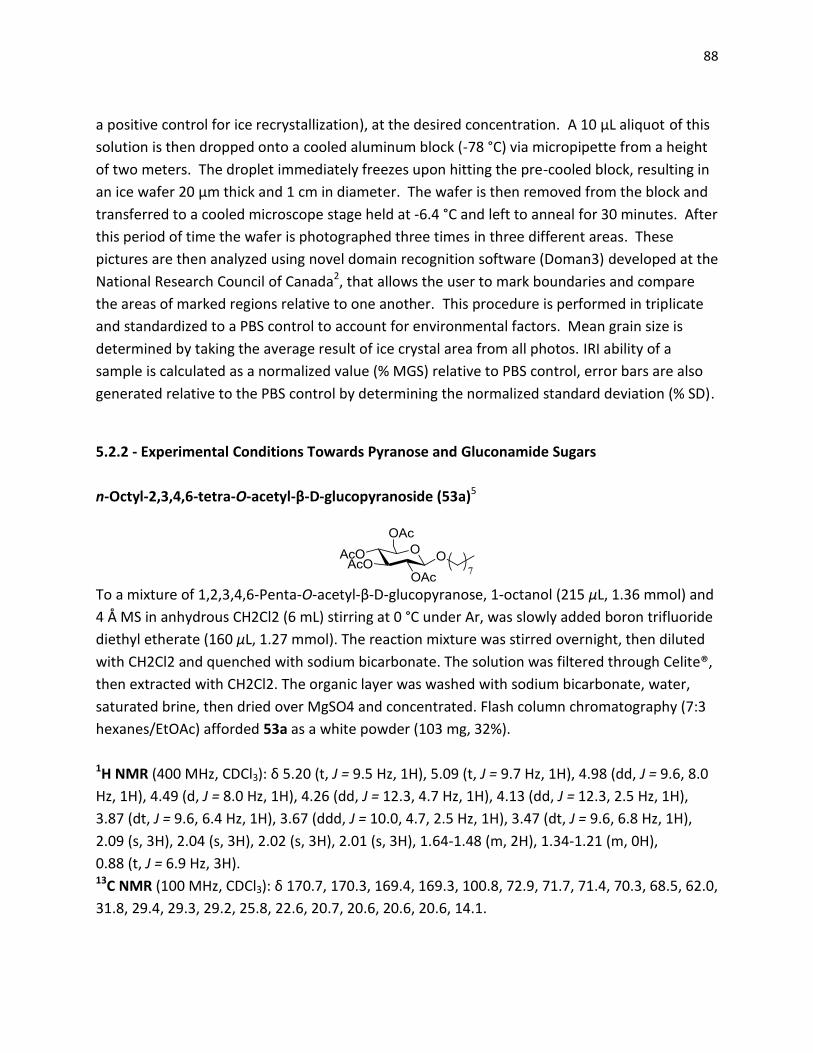
88
a positive control for ice recrystallization), at the desired concentration. A 10 μL aliquot of this
solution is then dropped onto a cooled aluminum block (-78 °C) via micropipette from a height
of two meters. The droplet immediately freezes upon hitting the pre-cooled block, resulting in
an ice wafer 20 μm thick and 1 cm in diameter. The wafer is then removed from the block and
transferred to a cooled microscope stage held at -6.4 °C and left to anneal for 30 minutes. After
this period of time the wafer is photographed three times in three different areas. These
pictures are then analyzed using novel domain recognition software (Doman3) developed at the
National Research Council of Canada2, that allows the user to mark boundaries and compare
the areas of marked regions relative to one another. This procedure is performed in triplicate
and standardized to a PBS control to account for environmental factors. Mean grain size is
determined by taking the average result of ice crystal area from all photos. IRI ability of a
sample is calculated as a normalized value (% MGS) relative to PBS control, error bars are also
generated relative to the PBS control by determining the normalized standard deviation (% SD).
5.2.2 - Experimental Conditions Towards Pyranose and Gluconamide Sugars
n-Octyl-2,3,4,6-tetra-O-acetyl-β-D-glucopyranoside (53a)5
To a mixture of 1,2,3,4,6-Penta-O-acetyl-β-D-glucopyranose, 1-octanol (215 μL, 1.36 mmol) and
4 Å MS in anhydrous CH2Cl2 (6 mL) stirring at 0 °C under Ar, was slowly added boron trifluoride
diethyl etherate (160 μL, 1.27 mmol). The reaction mixture was stirred overnight, then diluted
with CH2Cl2 and quenched with sodium bicarbonate. The solution was filtered through Celite®,
then extracted with CH2Cl2. The organic layer was washed with sodium bicarbonate, water,
saturated brine, then dried over MgSO4 and concentrated. Flash column chromatography (7:3
hexanes/EtOAc) afforded 53a as a white powder (103 mg, 32%).
1H NMR (400 MHz, CDCl3): δ 5.20 (t, J = 9.5 Hz, 1H), 5.09 (t, J = 9.7 Hz, 1H), 4.98 (dd, J = 9.6, 8.0
Hz, 1H), 4.49 (d, J = 8.0 Hz, 1H), 4.26 (dd, J = 12.3, 4.7 Hz, 1H), 4.13 (dd, J = 12.3, 2.5 Hz, 1H),
3.87 (dt, J = 9.6, 6.4 Hz, 1H), 3.67 (ddd, J = 10.0, 4.7, 2.5 Hz, 1H), 3.47 (dt, J = 9.6, 6.8 Hz, 1H),
2.09 (s, 3H), 2.04 (s, 3H), 2.02 (s, 3H), 2.01 (s, 3H), 1.64-1.48 (m, 2H), 1.34-1.21 (m, 0H),
0.88 (t, J = 6.9 Hz, 3H). 13C NMR (100 MHz, CDCl3): δ 170.7, 170.3, 169.4, 169.3, 100.8, 72.9, 71.7, 71.4, 70.3, 68.5, 62.0,
31.8, 29.4, 29.3, 29.2, 25.8, 22.6, 20.7, 20.6, 20.6, 20.6, 14.1.
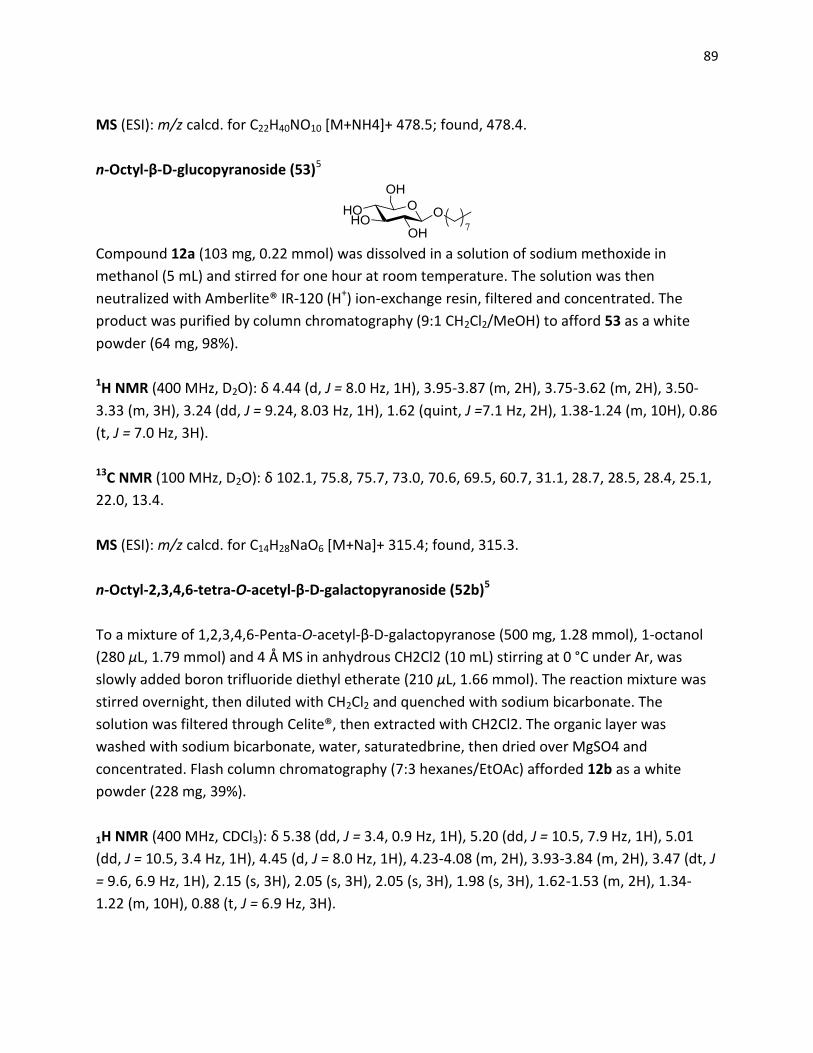
89
MS (ESI): m/z calcd. for C22H40NO10 [M+NH4]+ 478.5; found, 478.4.
n-Octyl-β-D-glucopyranoside (53)5
Compound 12a (103 mg, 0.22 mmol) was dissolved in a solution of sodium methoxide in
methanol (5 mL) and stirred for one hour at room temperature. The solution was then
neutralized with Amberlite® IR-120 (H+) ion-exchange resin, filtered and concentrated. The
product was purified by column chromatography (9:1 CH2Cl2/MeOH) to afford 53 as a white
powder (64 mg, 98%).
1H NMR (400 MHz, D2O): δ 4.44 (d, J = 8.0 Hz, 1H), 3.95-3.87 (m, 2H), 3.75-3.62 (m, 2H), 3.50-
3.33 (m, 3H), 3.24 (dd, J = 9.24, 8.03 Hz, 1H), 1.62 (quint, J =7.1 Hz, 2H), 1.38-1.24 (m, 10H), 0.86
(t, J = 7.0 Hz, 3H).
13C NMR (100 MHz, D2O): δ 102.1, 75.8, 75.7, 73.0, 70.6, 69.5, 60.7, 31.1, 28.7, 28.5, 28.4, 25.1,
22.0, 13.4.
MS (ESI): m/z calcd. for C14H28NaO6 [M+Na]+ 315.4; found, 315.3.
n-Octyl-2,3,4,6-tetra-O-acetyl-β-D-galactopyranoside (52b)5
To a mixture of 1,2,3,4,6-Penta-O-acetyl-β-D-galactopyranose (500 mg, 1.28 mmol), 1-octanol
(280 μL, 1.79 mmol) and 4 Å MS in anhydrous CH2Cl2 (10 mL) stirring at 0 °C under Ar, was
slowly added boron trifluoride diethyl etherate (210 μL, 1.66 mmol). The reaction mixture was
stirred overnight, then diluted with CH2Cl2 and quenched with sodium bicarbonate. The
solution was filtered through Celite®, then extracted with CH2Cl2. The organic layer was
washed with sodium bicarbonate, water, saturatedbrine, then dried over MgSO4 and
concentrated. Flash column chromatography (7:3 hexanes/EtOAc) afforded 12b as a white
powder (228 mg, 39%).
1H NMR (400 MHz, CDCl3): δ 5.38 (dd, J = 3.4, 0.9 Hz, 1H), 5.20 (dd, J = 10.5, 7.9 Hz, 1H), 5.01
(dd, J = 10.5, 3.4 Hz, 1H), 4.45 (d, J = 8.0 Hz, 1H), 4.23-4.08 (m, 2H), 3.93-3.84 (m, 2H), 3.47 (dt, J
= 9.6, 6.9 Hz, 1H), 2.15 (s, 3H), 2.05 (s, 3H), 2.05 (s, 3H), 1.98 (s, 3H), 1.62-1.53 (m, 2H), 1.34-
1.22 (m, 10H), 0.88 (t, J = 6.9 Hz, 3H).
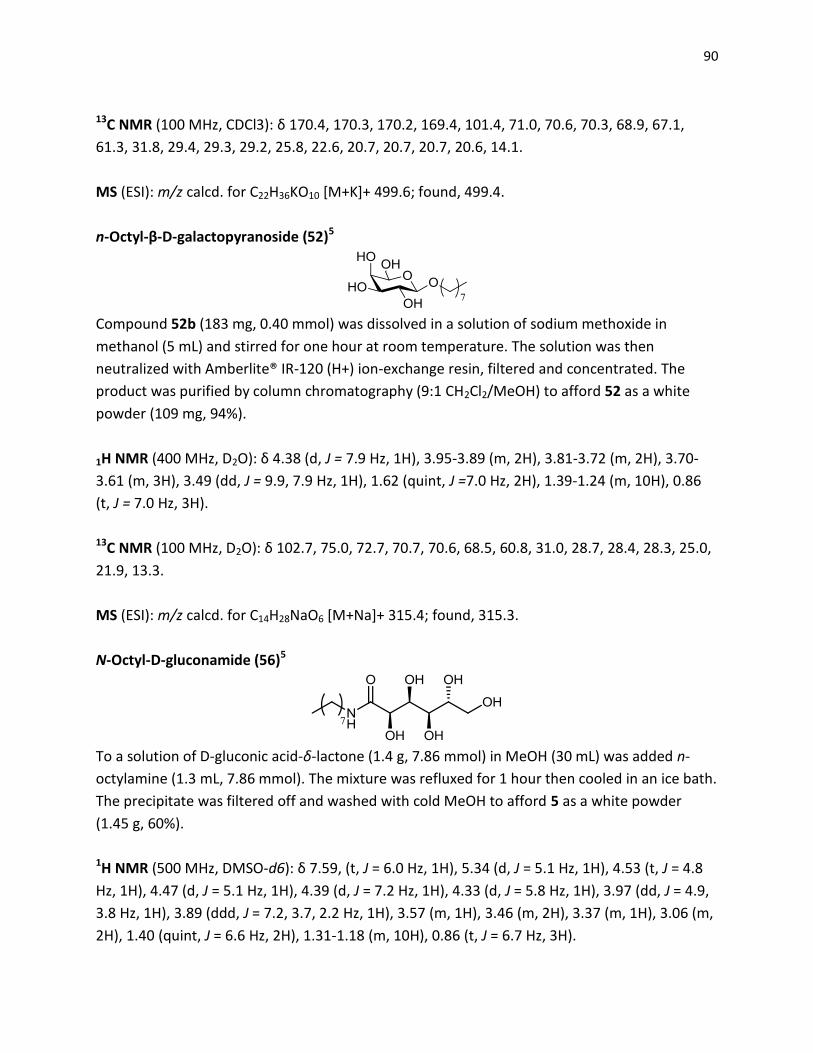
90
13C NMR (100 MHz, CDCl3): δ 170.4, 170.3, 170.2, 169.4, 101.4, 71.0, 70.6, 70.3, 68.9, 67.1,
61.3, 31.8, 29.4, 29.3, 29.2, 25.8, 22.6, 20.7, 20.7, 20.7, 20.6, 14.1.
MS (ESI): m/z calcd. for C22H36KO10 [M+K]+ 499.6; found, 499.4.
n-Octyl-β-D-galactopyranoside (52)5
Compound 52b (183 mg, 0.40 mmol) was dissolved in a solution of sodium methoxide in
methanol (5 mL) and stirred for one hour at room temperature. The solution was then
neutralized with Amberlite® IR-120 (H+) ion-exchange resin, filtered and concentrated. The
product was purified by column chromatography (9:1 CH2Cl2/MeOH) to afford 52 as a white
powder (109 mg, 94%).
1H NMR (400 MHz, D2O): δ 4.38 (d, J = 7.9 Hz, 1H), 3.95-3.89 (m, 2H), 3.81-3.72 (m, 2H), 3.70-
3.61 (m, 3H), 3.49 (dd, J = 9.9, 7.9 Hz, 1H), 1.62 (quint, J =7.0 Hz, 2H), 1.39-1.24 (m, 10H), 0.86
(t, J = 7.0 Hz, 3H).
13C NMR (100 MHz, D2O): δ 102.7, 75.0, 72.7, 70.7, 70.6, 68.5, 60.8, 31.0, 28.7, 28.4, 28.3, 25.0,
21.9, 13.3.
MS (ESI): m/z calcd. for C14H28NaO6 [M+Na]+ 315.4; found, 315.3.
N-Octyl-D-gluconamide (56)5
To a solution of D-gluconic acid-δ-lactone (1.4 g, 7.86 mmol) in MeOH (30 mL) was added n-
octylamine (1.3 mL, 7.86 mmol). The mixture was refluxed for 1 hour then cooled in an ice bath.
The precipitate was filtered off and washed with cold MeOH to afford 5 as a white powder
(1.45 g, 60%).
1H NMR (500 MHz, DMSO-d6): δ 7.59, (t, J = 6.0 Hz, 1H), 5.34 (d, J = 5.1 Hz, 1H), 4.53 (t, J = 4.8
Hz, 1H), 4.47 (d, J = 5.1 Hz, 1H), 4.39 (d, J = 7.2 Hz, 1H), 4.33 (d, J = 5.8 Hz, 1H), 3.97 (dd, J = 4.9,
3.8 Hz, 1H), 3.89 (ddd, J = 7.2, 3.7, 2.2 Hz, 1H), 3.57 (m, 1H), 3.46 (m, 2H), 3.37 (m, 1H), 3.06 (m,
2H), 1.40 (quint, J = 6.6 Hz, 2H), 1.31-1.18 (m, 10H), 0.86 (t, J = 6.7 Hz, 3H).
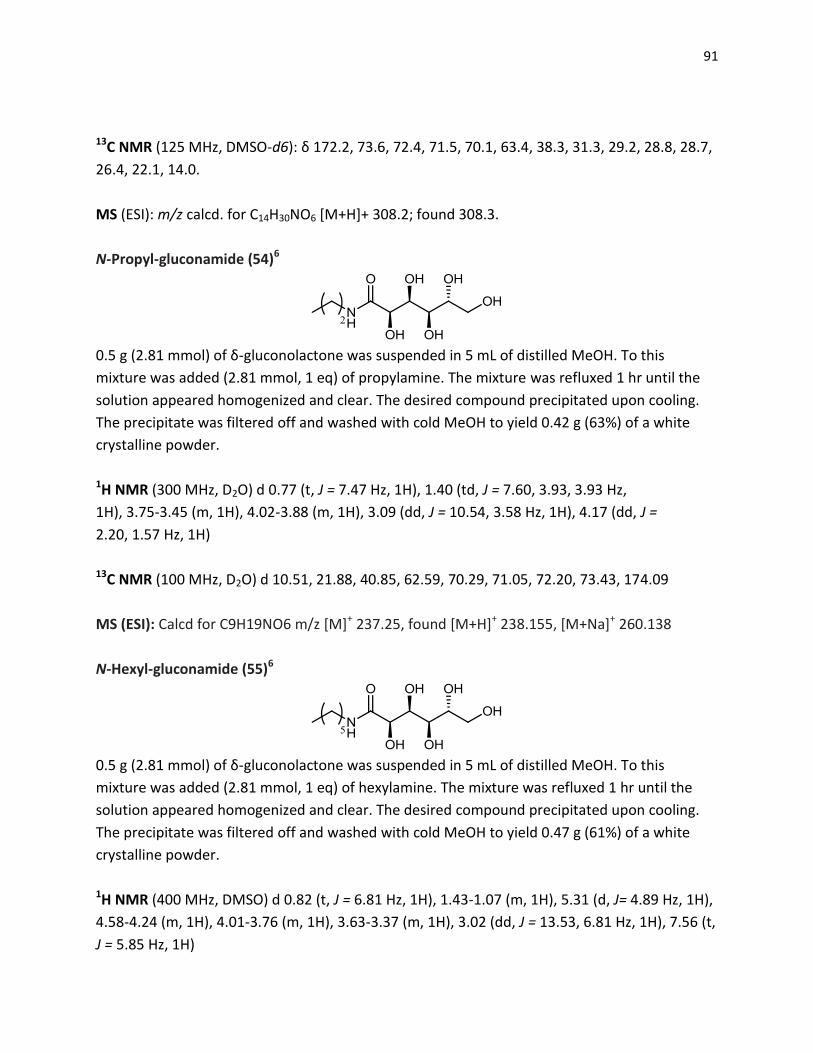
91
13C NMR (125 MHz, DMSO-d6): δ 172.2, 73.6, 72.4, 71.5, 70.1, 63.4, 38.3, 31.3, 29.2, 28.8, 28.7,
26.4, 22.1, 14.0.
MS (ESI): m/z calcd. for C14H30NO6 [M+H]+ 308.2; found 308.3.
N-Propyl-gluconamide (54)6
0.5 g (2.81 mmol) of δ-gluconolactone was suspended in 5 mL of distilled MeOH. To this
mixture was added (2.81 mmol, 1 eq) of propylamine. The mixture was refluxed 1 hr until the
solution appeared homogenized and clear. The desired compound precipitated upon cooling.
The precipitate was filtered off and washed with cold MeOH to yield 0.42 g (63%) of a white
crystalline powder.
1H NMR (300 MHz, D2O) d 0.77 (t, J = 7.47 Hz, 1H), 1.40 (td, J = 7.60, 3.93, 3.93 Hz,
1H), 3.75-3.45 (m, 1H), 4.02-3.88 (m, 1H), 3.09 (dd, J = 10.54, 3.58 Hz, 1H), 4.17 (dd, J =
2.20, 1.57 Hz, 1H)
13C NMR (100 MHz, D2O) d 10.51, 21.88, 40.85, 62.59, 70.29, 71.05, 72.20, 73.43, 174.09
MS (ESI): Calcd for C9H19NO6 m/z [M]+ 237.25, found [M+H]+ 238.155, [M+Na]+ 260.138
N-Hexyl-gluconamide (55)6
0.5 g (2.81 mmol) of δ-gluconolactone was suspended in 5 mL of distilled MeOH. To this
mixture was added (2.81 mmol, 1 eq) of hexylamine. The mixture was refluxed 1 hr until the
solution appeared homogenized and clear. The desired compound precipitated upon cooling.
The precipitate was filtered off and washed with cold MeOH to yield 0.47 g (61%) of a white
crystalline powder.
1H NMR (400 MHz, DMSO) d 0.82 (t, J = 6.81 Hz, 1H), 1.43-1.07 (m, 1H), 5.31 (d, J= 4.89 Hz, 1H),
4.58-4.24 (m, 1H), 4.01-3.76 (m, 1H), 3.63-3.37 (m, 1H), 3.02 (dd, J = 13.53, 6.81 Hz, 1H), 7.56 (t,
J = 5.85 Hz, 1H)
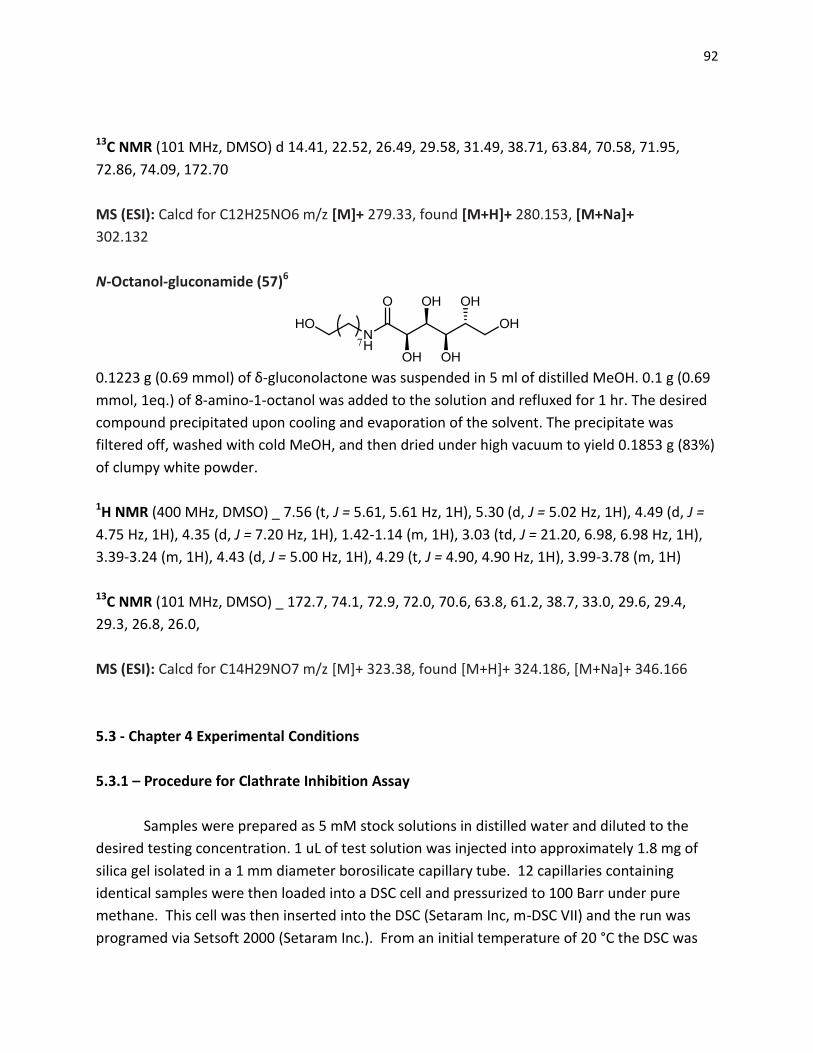
92
13C NMR (101 MHz, DMSO) d 14.41, 22.52, 26.49, 29.58, 31.49, 38.71, 63.84, 70.58, 71.95,
72.86, 74.09, 172.70
MS (ESI): Calcd for C12H25NO6 m/z [M]+ 279.33, found [M+H]+ 280.153, [M+Na]+
302.132
N-Octanol-gluconamide (57)6
0.1223 g (0.69 mmol) of δ-gluconolactone was suspended in 5 ml of distilled MeOH. 0.1 g (0.69
mmol, 1eq.) of 8-amino-1-octanol was added to the solution and refluxed for 1 hr. The desired
compound precipitated upon cooling and evaporation of the solvent. The precipitate was
filtered off, washed with cold MeOH, and then dried under high vacuum to yield 0.1853 g (83%)
of clumpy white powder.
1H NMR (400 MHz, DMSO) _ 7.56 (t, J = 5.61, 5.61 Hz, 1H), 5.30 (d, J = 5.02 Hz, 1H), 4.49 (d, J =
4.75 Hz, 1H), 4.35 (d, J = 7.20 Hz, 1H), 1.42-1.14 (m, 1H), 3.03 (td, J = 21.20, 6.98, 6.98 Hz, 1H),
3.39-3.24 (m, 1H), 4.43 (d, J = 5.00 Hz, 1H), 4.29 (t, J = 4.90, 4.90 Hz, 1H), 3.99-3.78 (m, 1H)
13C NMR (101 MHz, DMSO) _ 172.7, 74.1, 72.9, 72.0, 70.6, 63.8, 61.2, 38.7, 33.0, 29.6, 29.4,
29.3, 26.8, 26.0,
MS (ESI): Calcd for C14H29NO7 m/z [M]+ 323.38, found [M+H]+ 324.186, [M+Na]+ 346.166
5.3 - Chapter 4 Experimental Conditions
5.3.1 – Procedure for Clathrate Inhibition Assay
Samples were prepared as 5 mM stock solutions in distilled water and diluted to the
desired testing concentration. 1 uL of test solution was injected into approximately 1.8 mg of
silica gel isolated in a 1 mm diameter borosilicate capillary tube. 12 capillaries containing
identical samples were then loaded into a DSC cell and pressurized to 100 Barr under pure
methane. This cell was then inserted into the DSC (Setaram Inc, m-DSC VII) and the run was
programed via Setsoft 2000 (Setaram Inc.). From an initial temperature of 20 °C the DSC was
93
cooled to -12 °C at a rate of -0.0085 °C/sec. The cell was then kept at -12 °C for 20 hours before
being heated to 20 °C at a rate of 0.0085 °C/sec. This trial is repeated three times sequentially,
resulting in 36 trials for each test solution. The resultant data is obtained using Setsoft 2000
Collection (Setaram Inc.) and transferred into Microsoft Excel. All three repetitions are
averaged together generating an average curve. The integral of this curve is then taken to
determine the cumulative heat of freezing, with the maximum value of the curve yielding the
maximum heat of freezing. Error bars are generated for maximum heat of freezing by
determining the standard deviation of the maximum heats of freezing of the three individual
runs.
94
References
1. Still, W.C., Kahn, M., Mitra, A., J. Org. Chem., 1978, 43, 2923
2. Kalikanda, J., Li, Z., Carb. Res., 2011, 346, 2380
3. Kajihara, Y., Kodama, H., Endo, T., Hashimoto, H., Carb. Res. 1998, 306, 361
4. Don, H., Zichao, P., Ramtrom, O. J. Org. Chem., 2006, 71, 3603
5. Capicciotti,C.J., Leclère, M., Perras, F.A., Bryce, D.L., Paulin, H., Harden,J., Liu, Y., Ben, R.N., J.
Chem. Sci. 2012, 3, 1408
6. Davis, K.A. Development of novel ice recrystallization inhibitors based on N-alkyl-gluconamide
hydrogels. Honours Thesis, University of Ottawa, Ottawa, ON 2011
7. Overkleeft, H.S., van Wiltenburg, J., Pandit, U.K., Tetrahedron, 1994, 50, 4215
95
Appendix
Selected 1H and 13C NMR Spectra
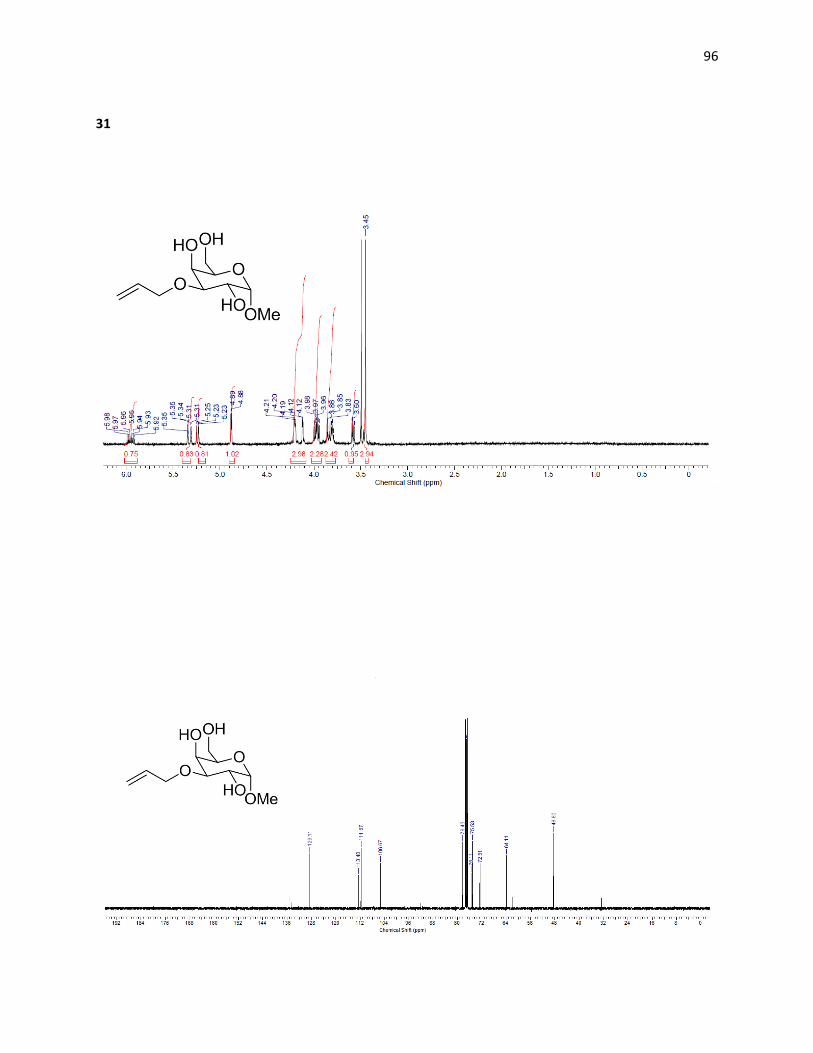
96
31
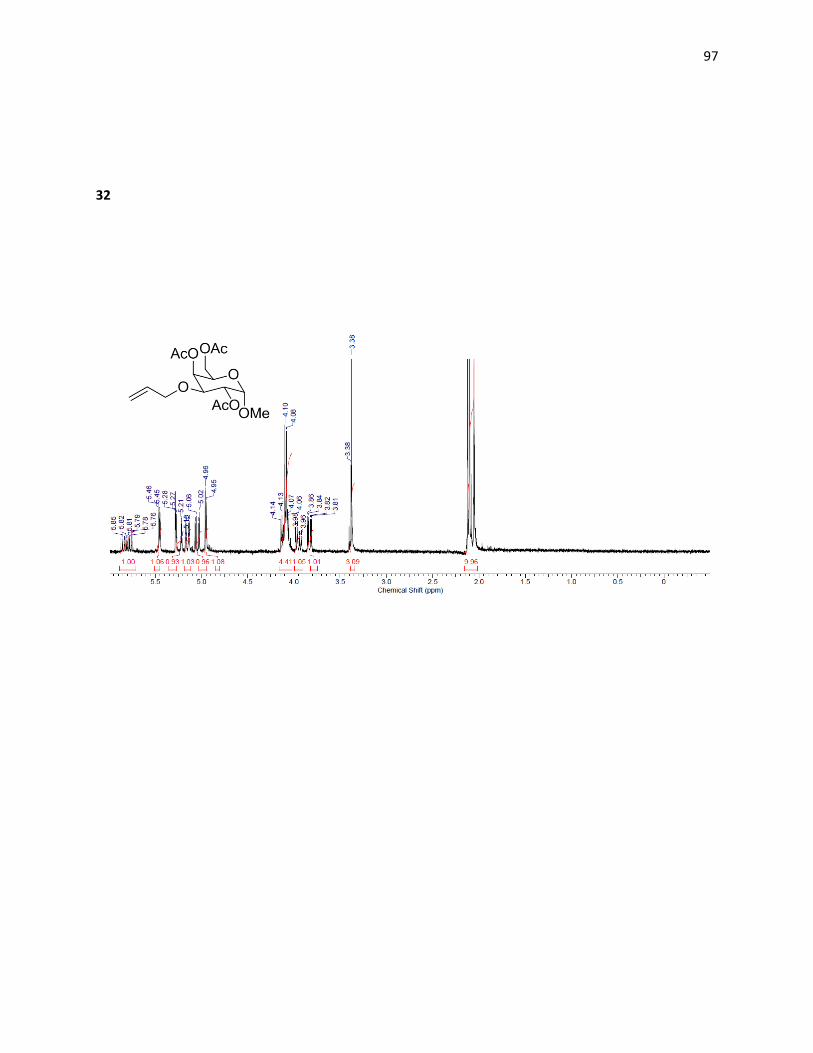
97
32
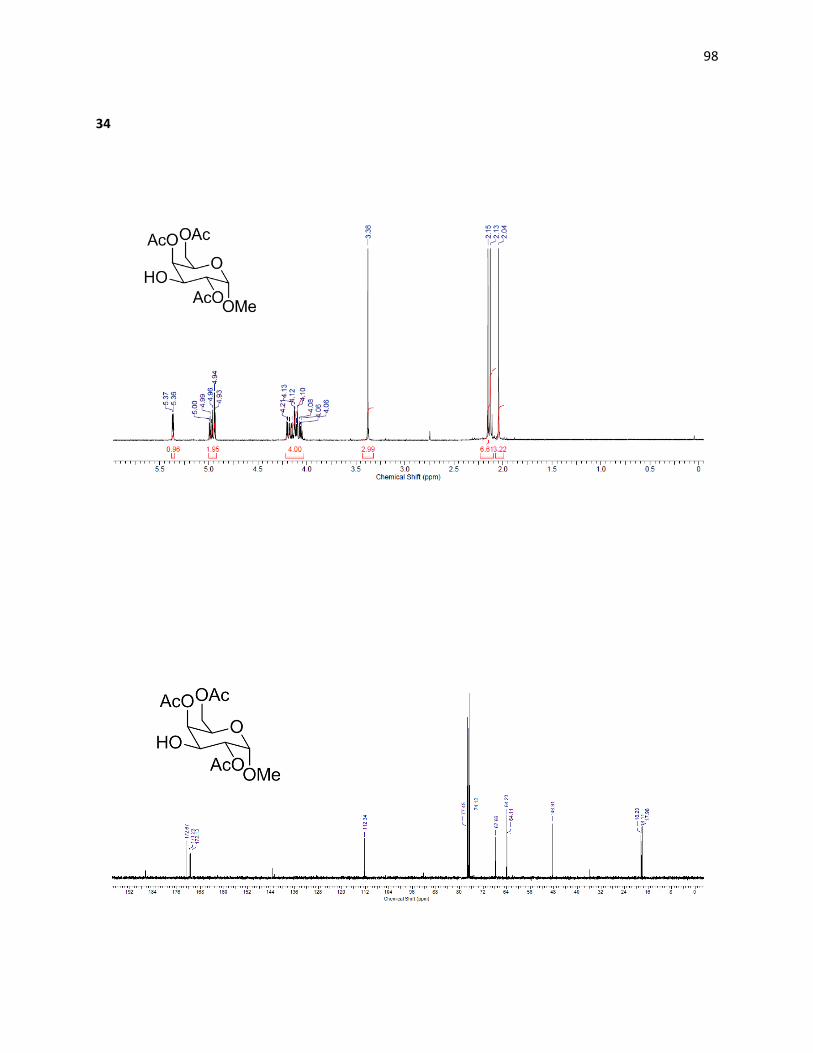
98
34
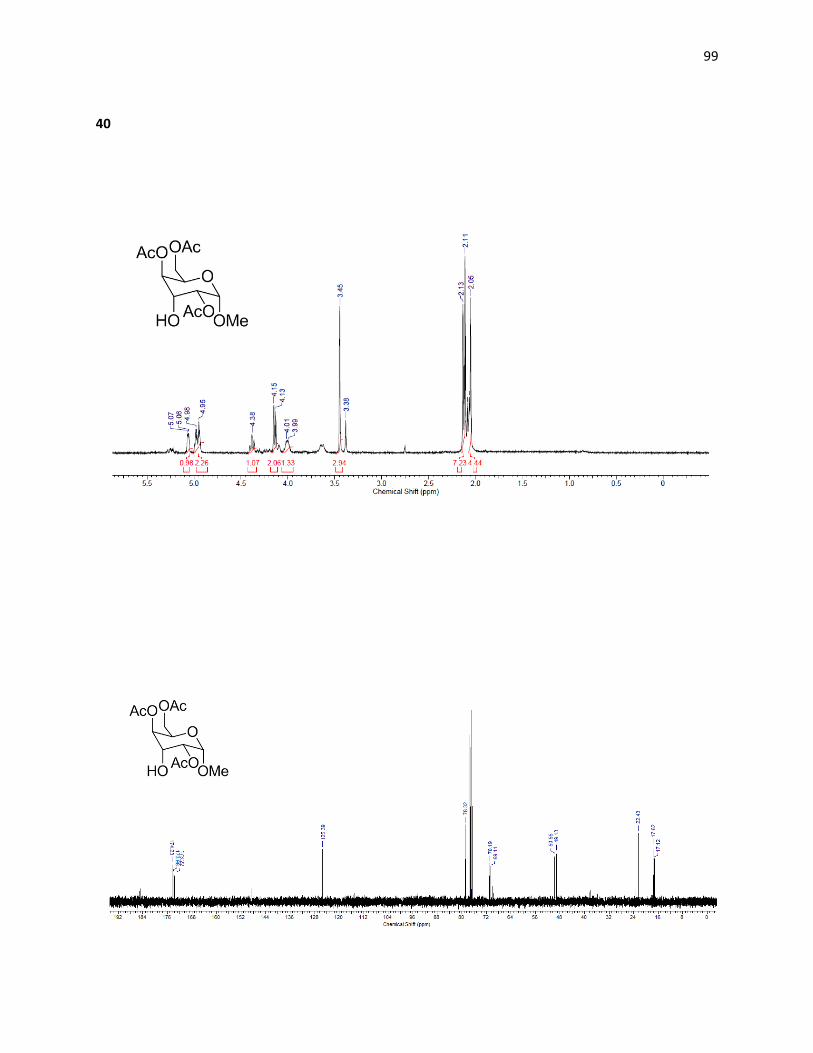
99
40
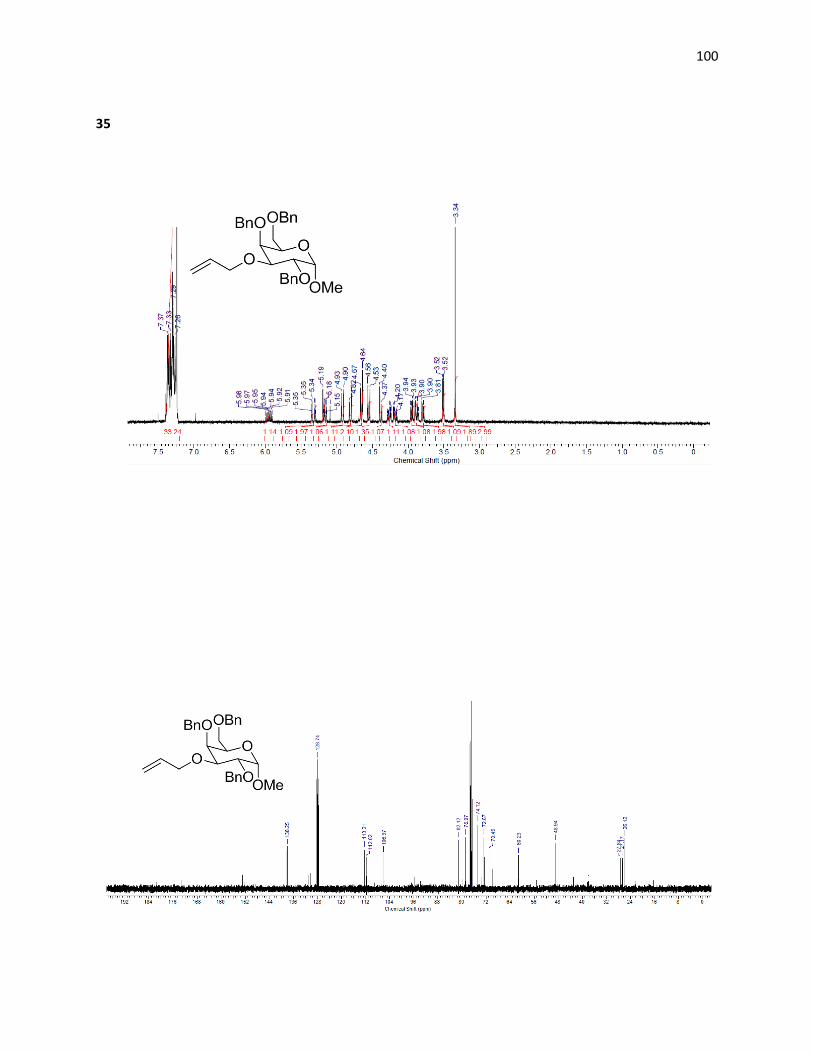
100
35
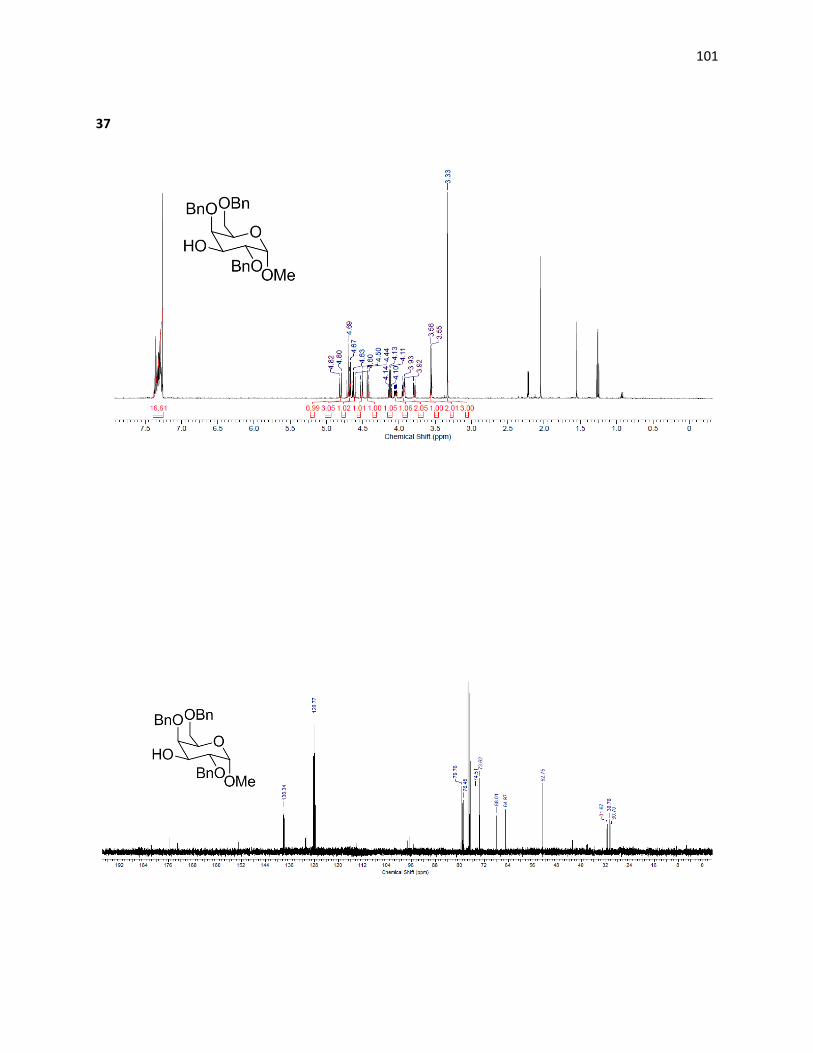
101
37
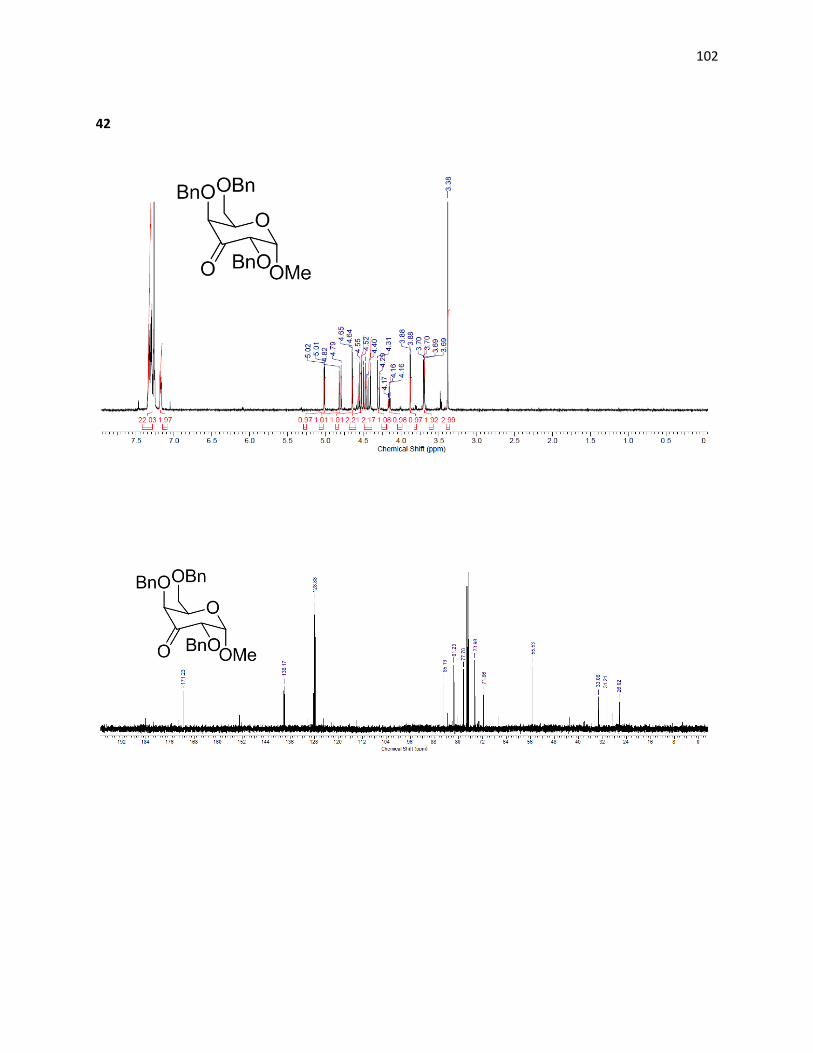
102
42
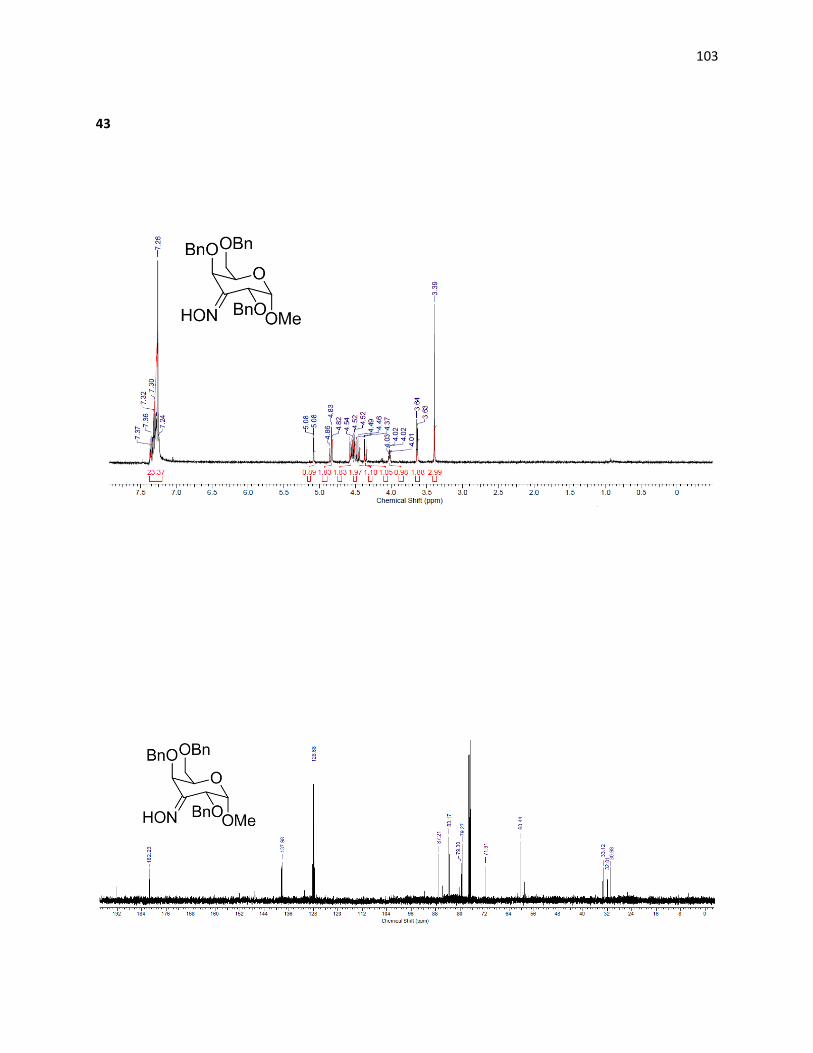
103
43
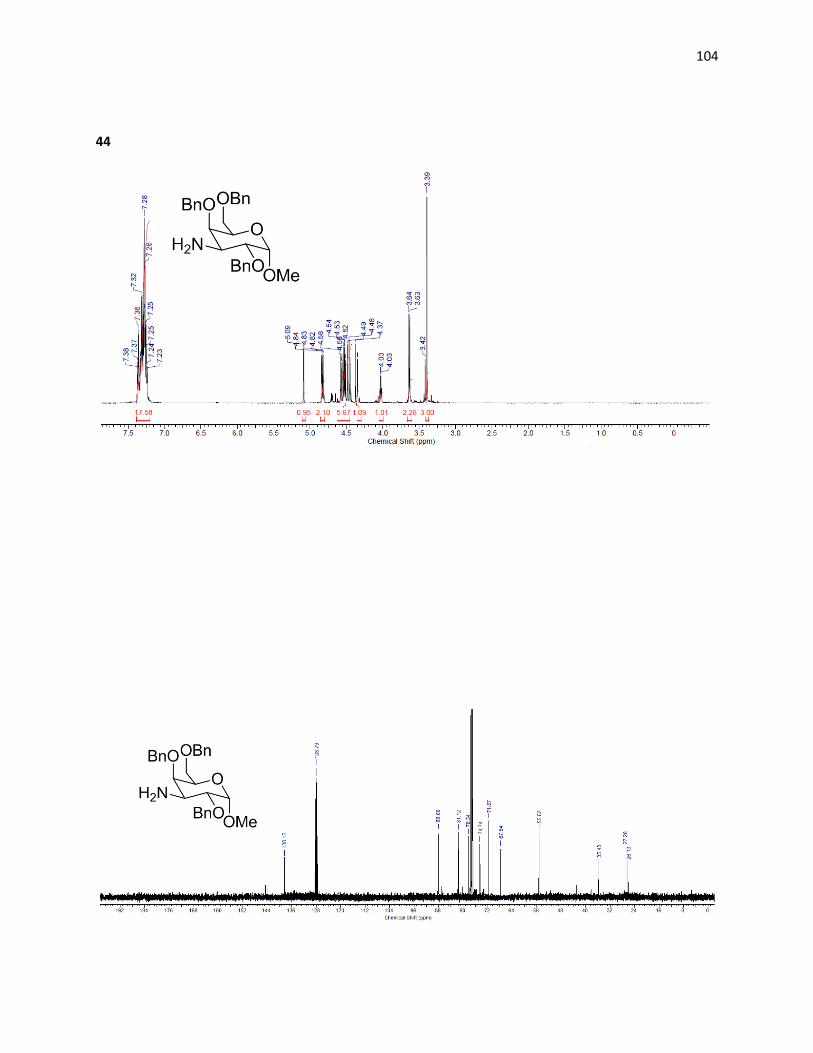
104
44
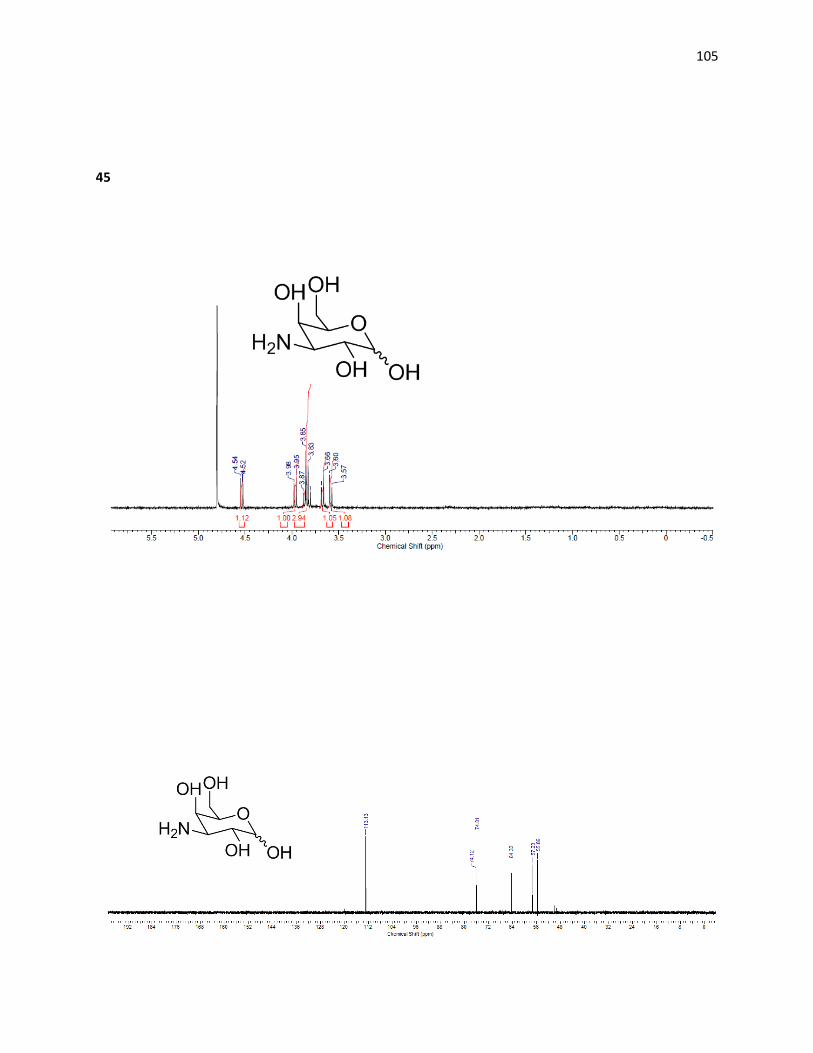
105
45