Embed Size (px)
Citation preview
SMIP12 Seminar Proceedings
97
AMBIENT RESPONSE OF A UNIQUE PERFORMANCE-BASED DESIGN BUILDING WITH DYNAMIC RESPONSE MODIFICATION FEATURES
Mehmet Çelebi1, Moh Huang2, Antony Shakal2, John Hooper3 and Ron Klemencic3 1Earthquake Science Center, USGS, Menlo Park, CA 94025 2California Geological Survey, Sacramento, CA 94814 3Magnusson Klemencic Associates, Seattle, WA 98101
Abstract
A 64-story, performance-based design building with reinforced concrete core shear-walls and unique dynamic response modification features (tuned liquid sloshing dampers and buckling-restrained braces) has been instrumented with a monitoring array of 72 channels of accelerometers. Ambient vibration data recorded are analyzed to identify modes and associated frequencies and damping. The low-amplitude dynamic characteristics are considerably different than those computed from design analyses, but serve as a baseline against which to compare with future strong shaking responses. Such studies help to improve our understanding of the effectiveness of the added features to the building and help improve designs in the future.
Introduction
A new, landmark building decorates the panorama of San Francisco, CA. Completed in 2008, the 64-story tall and slender building with reinforced concrete shear-wall core (hereafter referred to as “the building”) is described as the tallest building in the United States designed using performance-based seismic design (PBSD) procedures (written information by MKA, 2012) and applying unique structural dynamics modification features such as buckling restrained braces (BRBs) and tuned liquid sloshing dampers (TSD). These features qualify the building also as being the tallest performance-based seismic design (PBSD) in the world using BRBs (written information by MKA, 2012).
The purpose of this paper is to introduce an extensive seismic instrumentation project recently completed cooperatively by California Strong Motion Instrumentation Program (CSMIP) of California Geological Survey (CGS) and the National Strong Motion Project (NSMP) under the Advanced National Seismic Systems (ANSS) managed by United States Geological Survey (USGS). This instrumentation project includes a 72-channel seismic monitoring system of this station (Station no. CSMIP 58389; NSMP 1871) that streams real-time acceleration data from multiple floors starting at Level 1 (Basement Parking Level P4) up to Level 64 (roof).
Recognizing that there is no known data from such a unique design, we obtained ambient vibration data on demand from the installed monitoring system to understand the behavior of the

SMIP12 Seminar Proceedings
98
building, with the caveat that behavior during stronger shaking during strong earthquakes or high winds may be different than that from low-amplitude ambient shaking. In particular, the response of the building during strong shaking is expected to be significantly altered by the special structural features described above. Thus, the dynamic characteristics identified from ambient response of the building will be the baseline elastic response. The scope of this paper includes a description of the building, the monitoring system, and a discussion of the building behavior as inferred from the response analyses ambient data. Finite element model analyses are not included, but references are made to those performed by the designers. The structural instrumentation process and more details of the building are provided in a separate paper by Huang and others (2012).
In this paper, we used spectral analyses techniques as described in Bendat and Piersol (1980) and coded in public domain software, Matlab (Mathworks, 2012). We also used system identification techniques to extract mode shapes and associated frequencies and damping.
The Building
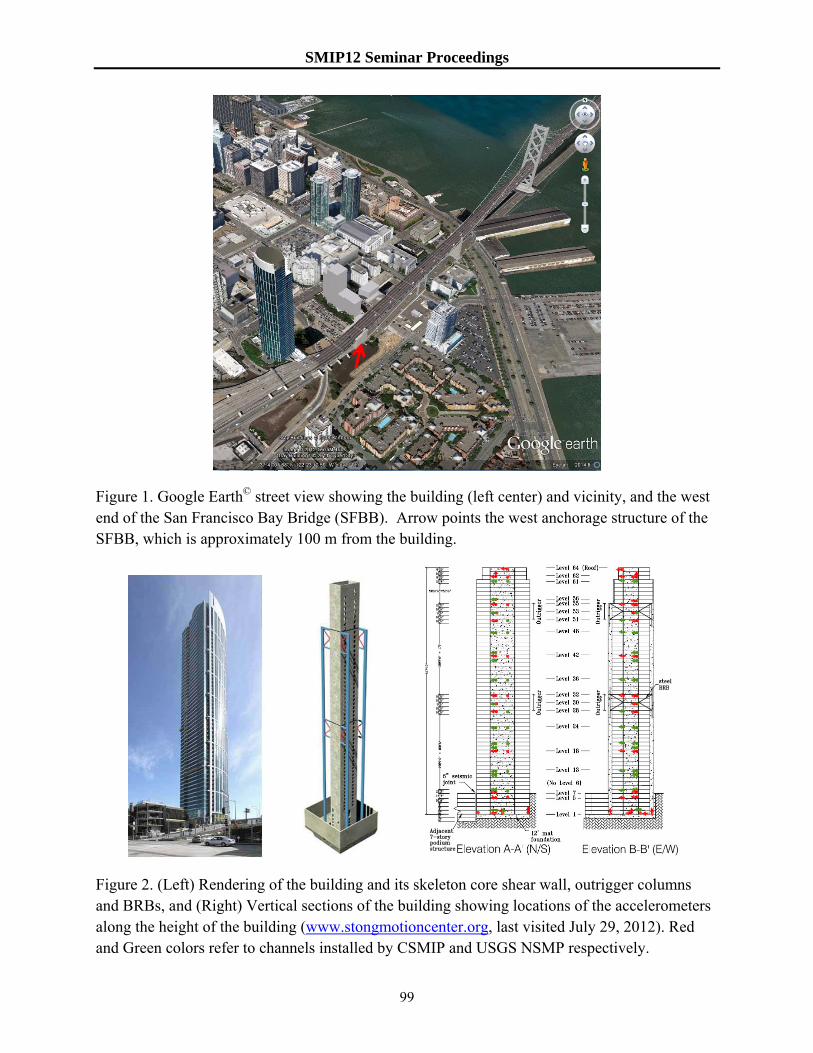
Figure 1 shows a Google Earth© 3-D street view of the building in close proximity to another San Francisco landmark, the San Francisco Bay Bridge (SFBB). The west anchorage structure for suspension cables of the SFBB is approximately 100 m from the building, and thus may be a significant source of vibration for the building.
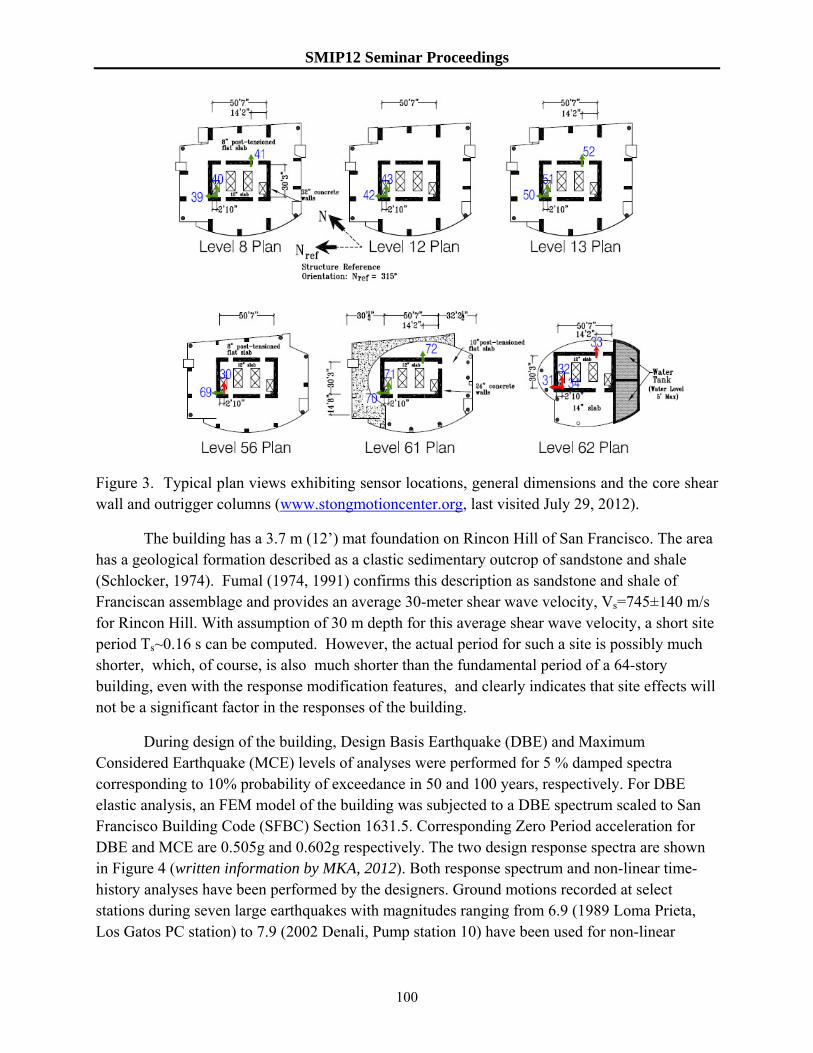
In Figure 2, a rendering of the building and its main skeletal core shear wall and “outrigger” BRB system are shown, as well as two vertical sections showing distribution of the 72-channel accelerometer array. The total height of the building is 188.31 m (617.83 ft).
Figure 3 depicts several typical floor plan views displaying core shear walls, “outrigger” columns, orientations and approximate locations and of installed accelerometers and also the tuned liquid sloshing damper pools at the 62nd level. The plan views also show the true north and reference north (hereinafter referred to as NS). A typical floor area of this condominium building is approximately 880 m2 (9500 ft2). The thickness of the core shear walls from Level 1 (Parking Level 4) to the 32nd Level is 81.3 cm (32”), from 32nd Level to 55th Level is 71.3 cm (28”) and from 55th Level to the top of the building is 61.0 cm (24”). Thus, with these shear-walls, the wall-to-floor area percentages change from ~ 2.4-3.9%, making the building one with considerably higher wall-to-floor percentages and comparable to average percentages of the shear-wall buildings in Chile that performed well during the 1985 Valparaiso (M=7.8) and 2010 Maule (M=8.8) earthquakes. Outrigger concrete column thicknesses generally follow those of the core shear wall and are generally 2.29 m (7.5’) wide. If the outrigger and other columns are considered, the lateral force resisting elements (columns and walls) to the floor area percentages increase by about 35 % providing the building a comparatively large stiffness and strength. In general floor slabs are 30.5 cm (12”) throughout the core but changes to 20.3 cm (8”) outside of the core.
SMIP12 Seminar Proceedings
99
Figure 1. Google Earth© street view showing the building (left center) and vicinity, and the west end of the San Francisco Bay Bridge (SFBB). Arrow points the west anchorage structure of the SFBB, which is approximately 100 m from the building.
Figure 2. (Left) Rendering of the building and its skeleton core shear wall, outrigger columns and BRBs, and (Right) Vertical sections of the building showing locations of the accelerometers along the height of the building (www.stongmotioncenter.org, last visited July 29, 2012). Red and Green colors refer to channels installed by CSMIP and USGS NSMP respectively.
SMIP12 Seminar Proceedings
100
Figure 3. Typical plan views exhibiting sensor locations, general dimensions and the core shear wall and outrigger columns (www.stongmotioncenter.org, last visited July 29, 2012).
The building has a 3.7 m (12’) mat foundation on Rincon Hill of San Francisco. The area has a geological formation described as a clastic sedimentary outcrop of sandstone and shale (Schlocker, 1974). Fumal (1974, 1991) confirms this description as sandstone and shale of Franciscan assemblage and provides an average 30-meter shear wave velocity, Vs=745±140 m/s for Rincon Hill. With assumption of 30 m depth for this average shear wave velocity, a short site period Ts~0.16 s can be computed. However, the actual period for such a site is possibly much shorter, which, of course, is also much shorter than the fundamental period of a 64-story building, even with the response modification features, and clearly indicates that site effects will not be a significant factor in the responses of the building.
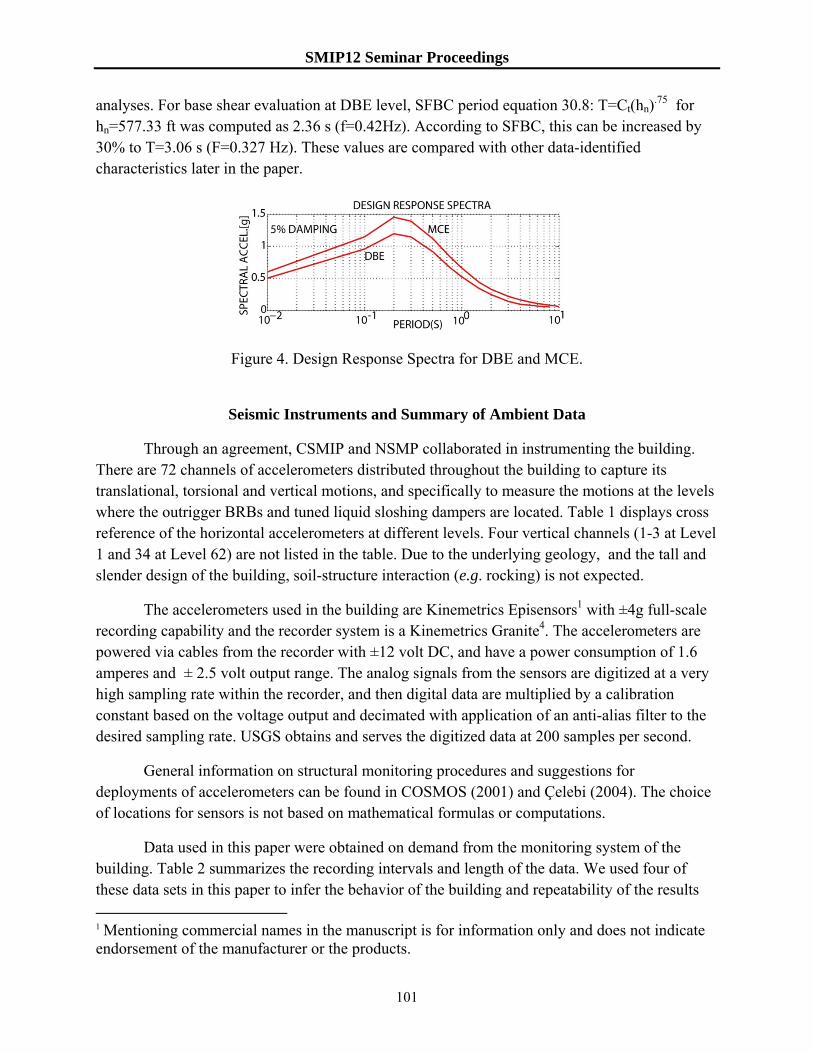
During design of the building, Design Basis Earthquake (DBE) and Maximum Considered Earthquake (MCE) levels of analyses were performed for 5 % damped spectra corresponding to 10% probability of exceedance in 50 and 100 years, respectively. For DBE elastic analysis, an FEM model of the building was subjected to a DBE spectrum scaled to San Francisco Building Code (SFBC) Section 1631.5. Corresponding Zero Period acceleration for DBE and MCE are 0.505g and 0.602g respectively. The two design response spectra are shown in Figure 4 (written information by MKA, 2012). Both response spectrum and non-linear time-history analyses have been performed by the designers. Ground motions recorded at select stations during seven large earthquakes with magnitudes ranging from 6.9 (1989 Loma Prieta, Los Gatos PC station) to 7.9 (2002 Denali, Pump station 10) have been used for non-linear
SMIP12 Seminar Proceedings
101
analyses. For base shear evaluation at DBE level, SFBC period equation 30.8: T=Ct(hn).75 for
hn=577.33 ft was computed as 2.36 s (f=0.42Hz). According to SFBC, this can be increased by 30% to T=3.06 s (F=0.327 Hz). These values are compared with other data-identified characteristics later in the paper.
Figure 4. Design Response Spectra for DBE and MCE.
Seismic Instruments and Summary of Ambient Data
Through an agreement, CSMIP and NSMP collaborated in instrumenting the building. There are 72 channels of accelerometers distributed throughout the building to capture its translational, torsional and vertical motions, and specifically to measure the motions at the levels where the outrigger BRBs and tuned liquid sloshing dampers are located. Table 1 displays cross reference of the horizontal accelerometers at different levels. Four vertical channels (1-3 at Level 1 and 34 at Level 62) are not listed in the table. Due to the underlying geology, and the tall and slender design of the building, soil-structure interaction (e.g. rocking) is not expected.
The accelerometers used in the building are Kinemetrics Episensors1 with ±4g full-scale recording capability and the recorder system is a Kinemetrics Granite4. The accelerometers are powered via cables from the recorder with ±12 volt DC, and have a power consumption of 1.6 amperes and ± 2.5 volt output range. The analog signals from the sensors are digitized at a very high sampling rate within the recorder, and then digital data are multiplied by a calibration constant based on the voltage output and decimated with application of an anti-alias filter to the desired sampling rate. USGS obtains and serves the digitized data at 200 samples per second.
General information on structural monitoring procedures and suggestions for deployments of accelerometers can be found in COSMOS (2001) and Çelebi (2004). The choice of locations for sensors is not based on mathematical formulas or computations.
Data used in this paper were obtained on demand from the monitoring system of the building. Table 2 summarizes the recording intervals and length of the data. We used four of these data sets in this paper to infer the behavior of the building and repeatability of the results 1 Mentioning commercial names in the manuscript is for information only and does not indicate endorsement of the manufacturer or the products.
SMIP12 Seminar Proceedings
102
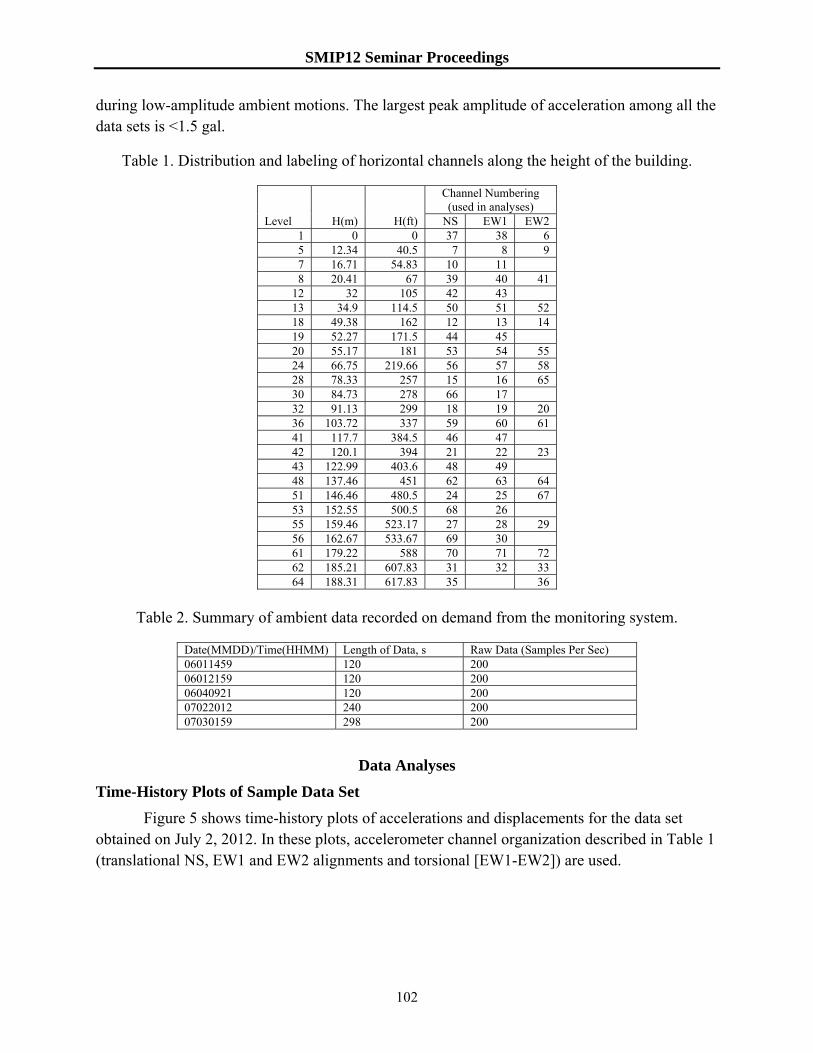
during low-amplitude ambient motions. The largest peak amplitude of acceleration among all the data sets is <1.5 gal.
Table 1. Distribution and labeling of horizontal channels along the height of the building.
Level H(m) H(ft)
Channel Numbering (used in analyses)
NS EW1 EW2 1 0 0 37 38 6 5 12.34 40.5 7 8 9 7 16.71 54.83 10 11 8 20.41 67 39 40 41
12 32 105 42 43 13 34.9 114.5 50 51 52 18 49.38 162 12 13 14 19 52.27 171.5 44 45 20 55.17 181 53 54 55 24 66.75 219.66 56 57 58 28 78.33 257 15 16 65 30 84.73 278 66 17 32 91.13 299 18 19 20 36 103.72 337 59 60 61 41 117.7 384.5 46 47 42 120.1 394 21 22 23 43 122.99 403.6 48 49 48 137.46 451 62 63 64 51 146.46 480.5 24 25 67 53 152.55 500.5 68 26 55 159.46 523.17 27 28 29 56 162.67 533.67 69 30 61 179.22 588 70 71 72 62 185.21 607.83 31 32 33 64 188.31 617.83 35 36
Table 2. Summary of ambient data recorded on demand from the monitoring system.
Date(MMDD)/Time(HHMM) Length of Data, s Raw Data (Samples Per Sec) 06011459 120 200 06012159 120 200 06040921 120 200 07022012 240 200 07030159 298 200
Data Analyses
Time-History Plots of Sample Data Set
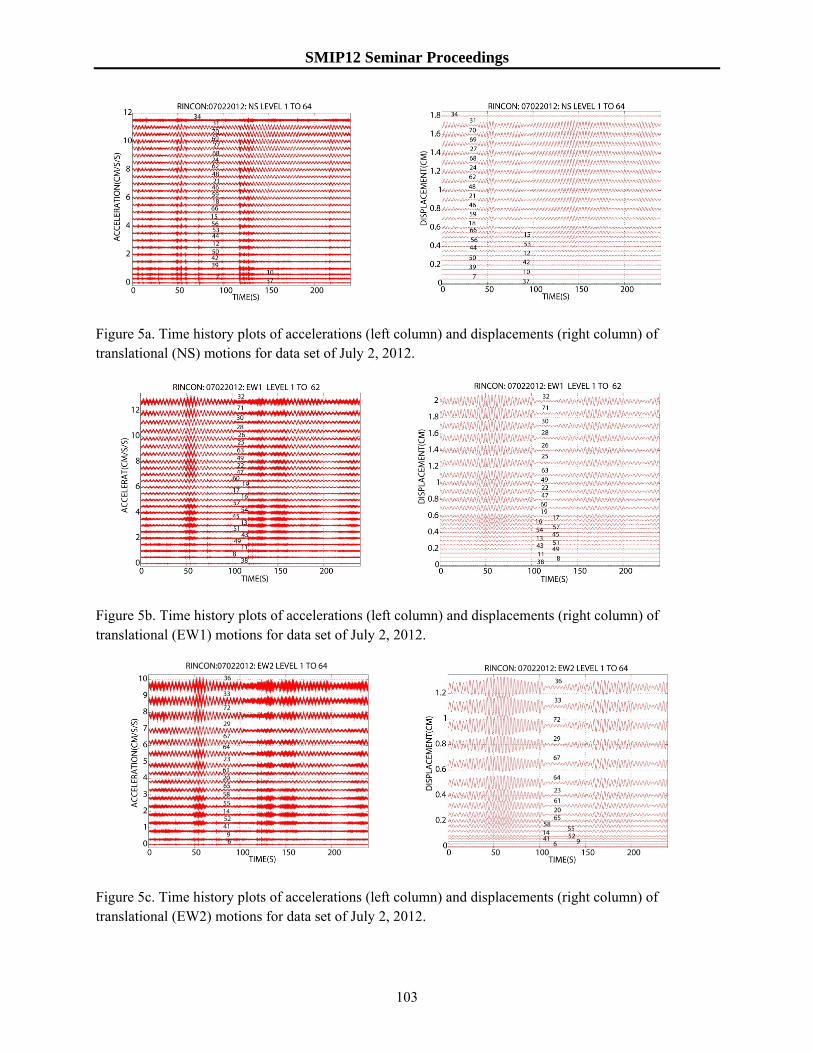
Figure 5 shows time-history plots of accelerations and displacements for the data set obtained on July 2, 2012. In these plots, accelerometer channel organization described in Table 1 (translational NS, EW1 and EW2 alignments and torsional [EW1-EW2]) are used.
SMIP12 Seminar Proceedings
103
Figure 5a. Time history plots of accelerations (left column) and displacements (right column) of translational (NS) motions for data set of July 2, 2012.
Figure 5b. Time history plots of accelerations (left column) and displacements (right column) of translational (EW1) motions for data set of July 2, 2012.
Figure 5c. Time history plots of accelerations (left column) and displacements (right column) of translational (EW2) motions for data set of July 2, 2012.
SMIP12 Seminar Proceedings
104
Figure 5d. Time history plots of relative torsional accelerations (left column) and relative torsional displacements (right column) of motions for data set of July 2, 2012.
Spectral Analyses
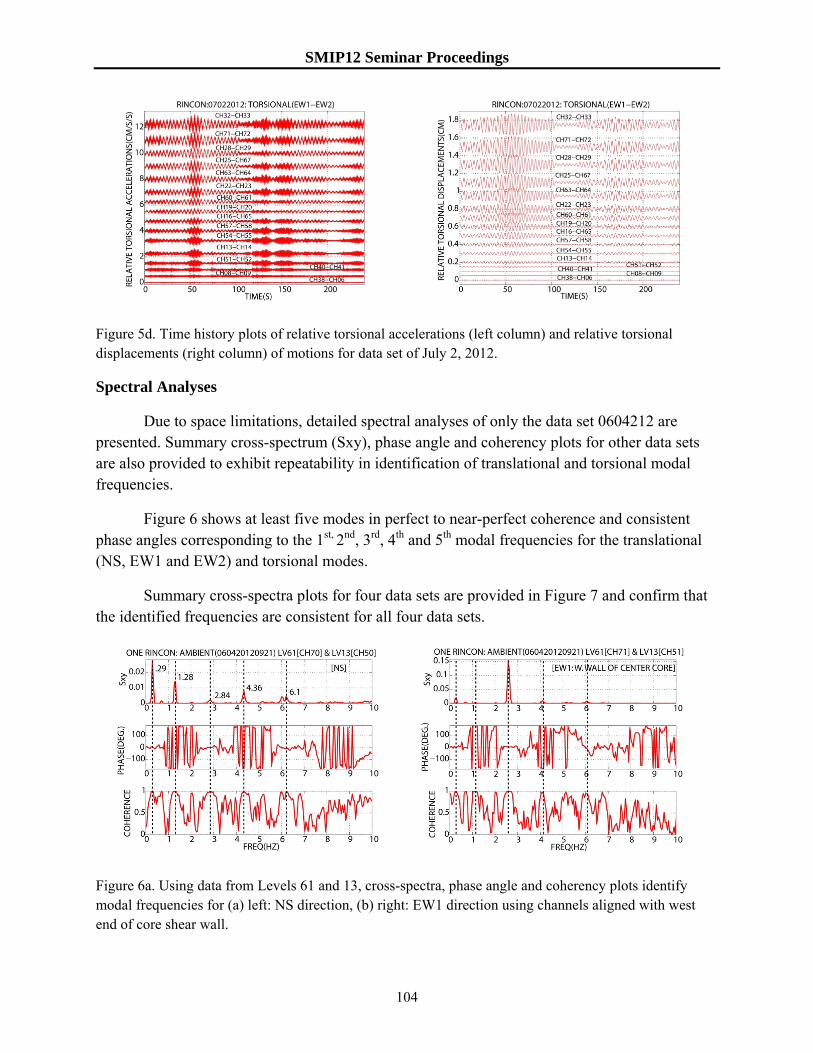
Due to space limitations, detailed spectral analyses of only the data set 0604212 are presented. Summary cross-spectrum (Sxy), phase angle and coherency plots for other data sets are also provided to exhibit repeatability in identification of translational and torsional modal frequencies.
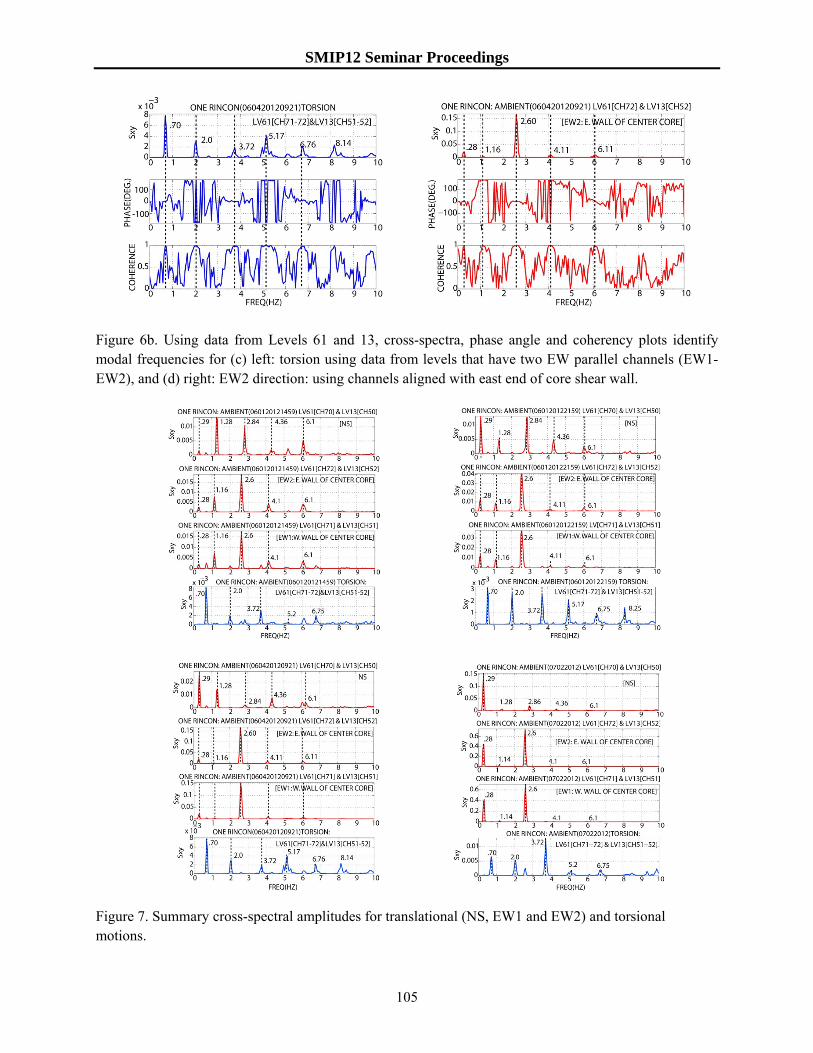
Figure 6 shows at least five modes in perfect to near-perfect coherence and consistent phase angles corresponding to the 1st, 2nd, 3rd, 4th and 5th modal frequencies for the translational (NS, EW1 and EW2) and torsional modes.
Summary cross-spectra plots for four data sets are provided in Figure 7 and confirm that the identified frequencies are consistent for all four data sets.
Figure 6a. Using data from Levels 61 and 13, cross-spectra, phase angle and coherency plots identify modal frequencies for (a) left: NS direction, (b) right: EW1 direction using channels aligned with west end of core shear wall.
SMIP12 Seminar Proceedings
105
Figure 6b. Using data from Levels 61 and 13, cross-spectra, phase angle and coherency plots identify modal frequencies for (c) left: torsion using data from levels that have two EW parallel channels (EW1-EW2), and (d) right: EW2 direction: using channels aligned with east end of core shear wall.
Figure 7. Summary cross-spectral amplitudes for translational (NS, EW1 and EW2) and torsional motions.
SMIP12 Seminar Proceedings
106
System Identification, Extraction of Modal Shapes, Frequencies and Damping
System identification analysis was performed using the ambient data to identify and/or
validate key frequencies and compare them with those determined by spectral analyses. In this
study, we used measured data from the building as output to estimate a predefined number of
order of state-space model using subspace method as coded within Matlab (Mathworks, 2012).
Further details of background of this method are not repeated herein as they are provided in
many publications including Matlab (2012), Ljung (1999), van Overschee and De Moor (1996)
and Juang (1994).
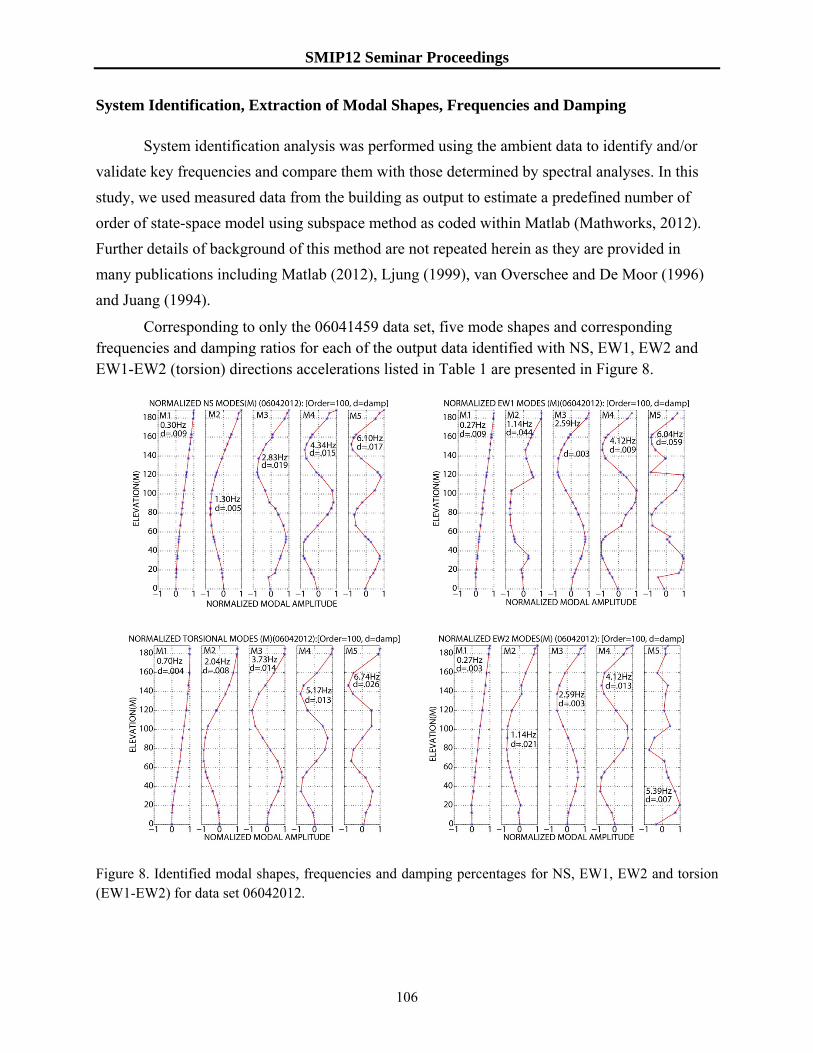
Corresponding to only the 06041459 data set, five mode shapes and corresponding frequencies and damping ratios for each of the output data identified with NS, EW1, EW2 and EW1-EW2 (torsion) directions accelerations listed in Table 1 are presented in Figure 8.
Figure 8. Identified modal shapes, frequencies and damping percentages for NS, EW1, EW2 and torsion (EW1-EW2) for data set 06042012.
SMIP12 Seminar Proceedings
107
As shown in this figure, the mode shapes conform reasonably to expectation with some irregularities at higher modes. The modes shapes do not indicate any alterations due to BRBs or TSDs.
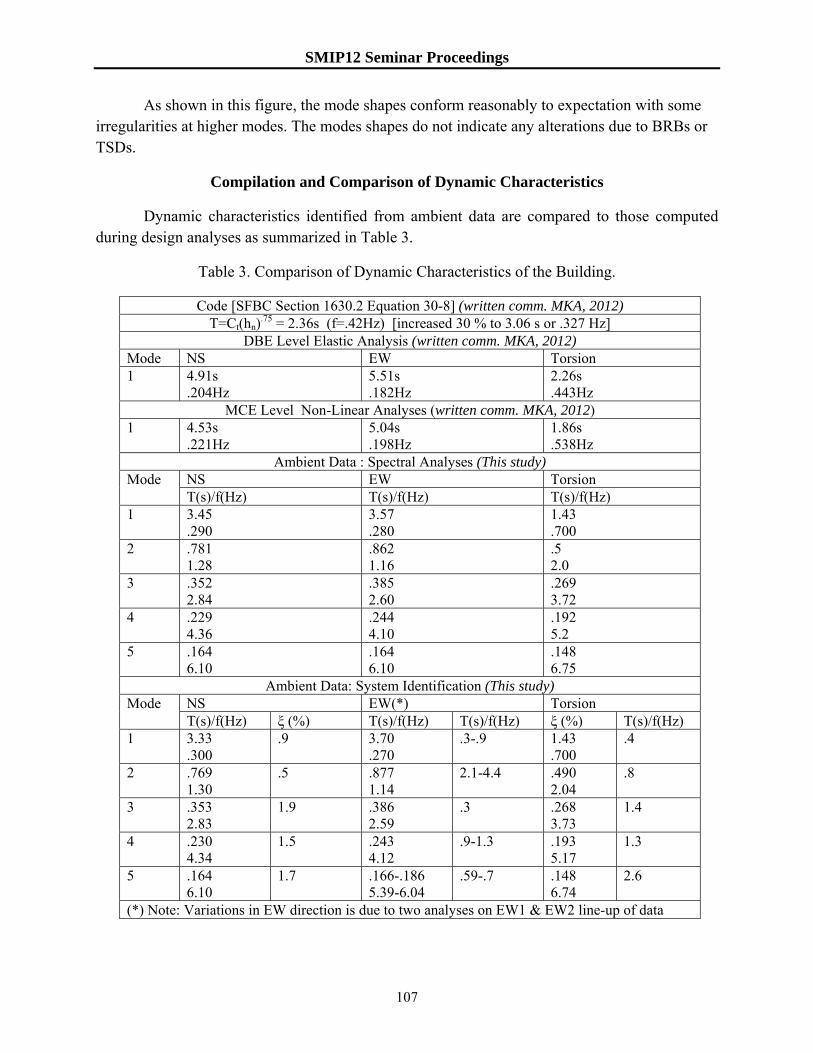
Compilation and Comparison of Dynamic Characteristics
Dynamic characteristics identified from ambient data are compared to those computed during design analyses as summarized in Table 3.
Table 3. Comparison of Dynamic Characteristics of the Building.
Code [SFBC Section 1630.2 Equation 30-8] (written comm. MKA, 2012) T=Ct(hn)
.75 = 2.36s (f=.42Hz) [increased 30 % to 3.06 s or .327 Hz] DBE Level Elastic Analysis (written comm. MKA, 2012)
Mode NS EW Torsion 1 4.91s
.204Hz 5.51s .182Hz
2.26s .443Hz
MCE Level Non-Linear Analyses (written comm. MKA, 2012) 1 4.53s
.221Hz 5.04s .198Hz
1.86s .538Hz
Ambient Data : Spectral Analyses (This study) Mode NS EW Torsion
T(s)/f(Hz) T(s)/f(Hz) T(s)/f(Hz) 1 3.45
.290 3.57 .280
1.43 .700
2 .781 1.28
.862 1.16
.5 2.0
3 .352 2.84
.385 2.60
.269 3.72
4 .229 4.36
.244 4.10
.192 5.2
5 .164 6.10
.164 6.10
.148 6.75
Ambient Data: System Identification (This study) Mode NS EW(*) Torsion
T(s)/f(Hz) ξ (%) T(s)/f(Hz) T(s)/f(Hz) ξ (%) T(s)/f(Hz) 1 3.33
.300 .9 3.70
.270 .3-.9 1.43
.700 .4
2 .769 1.30
.5 .877 1.14
2.1-4.4 .490 2.04
.8
3 .353 2.83
1.9 .386 2.59
.3 .268 3.73
1.4
4 .230 4.34
1.5 .243 4.12
.9-1.3 .193 5.17
1.3
5 .164 6.10
1.7 .166-.186 5.39-6.04
.59-.7 .148 6.74
2.6
(*) Note: Variations in EW direction is due to two analyses on EW1 & EW2 line-up of data
SMIP12 Seminar Proceedings
108
Discussion and Conclusions
To serve as a baseline for future data analyses, be they low-amplitude or strong shaking, ambient data were recorded on demand from this building with unique dynamic characteristics modification features such as BRBs and TSDs. At the recorded level of low-amplitude shaking (maximum accelerations < 1.5 gals), dynamic characteristics (periods, mode shapes and damping percentages) have been identified using well-known spectral analyses and system identification techniques and are summarized in Table 3.
The NS, EW and torsional periods (frequencies) for the first five modes obtained by spectral analyses and system identification techniques as described herein are similar. The first modal damping percentages (<1%) are low, as can be expected from ambient motions and observed in previous studies (Çelebi, 2004, Çelebi and others, 2012). The mode shapes of the building appear to be normal, which suggests that at these low-amplitude levels of shaking, the aforementioned BRB and TSD features contributed very little if any to its behaviour.
However, as might be expected, the ambient fundamental periods (frequencies) are considerably different from those computed by using the code formula and from DBE level elastic and MCE level analyses. This may be explained by the fact that, during the DBE and MCE level analyses, BRB and TSD characteristics were considered. For example, although linear elastic material behaviour have been assumed in the DBE analyses, and nonlinearities by the actions of the dynamic response modification features (tuned liquid sloshing dampers and buckling restrained braces) were included in the MCE analyses that alter the dynamic characteristics discussed, the fact that the results from MCE level analyses do not match with those from ambient data analyses is therefore not surprising.
As discussed earlier in the paper, future strong shaking data to be retrieved from the state-of-the-art seismic monitoring array of this building will be the main test to assess its behavior, performance and effectiveness of the dynamic response modification features integrated into the building. The results from the ambient data presented herein will serve as a baseline for comparison for any other result obtained using data at higher level of shaking.
Acknowledgements
Data used in this study were obtained on demand by CSMIP from the seismic monitoring array of the building. The array was designed by CSMIP and NSMP staff and deployed as a collaborative effort between CSMIP and USGS. Thanks are due to Chris Stephens, Manager of Strong Motion Data Center of NSMP (USGS) for diligently processing some of the data. The home owners association of the building and the design engineering company, MKA provided requisite information to carry out this study. Thanks are due to Roger Borcherdt and Chris Stephens for review of the paper.
SMIP12 Seminar Proceedings
109
References
Bendat J. S. and Piersol, A. G. (1980). Engineering Applications of Correlation and Spectral Analysis. John Wiley and Sons, New York, N.Y. Çelebi, M.(2004). Structural Monitoring Arrays – Past, Present and Future, PROC. NATO SFP Workshop on Future Directions on Strong Motion and Engineering Seismology, Kusadasi, Izmir, Turkey, May 17-21, 2004. in Future Directions in Strong Motion Instrumentation (eds. P. Gulkan and J. Anderson), NATO Science Series: IV. Earth and Environmental Sciences, Kluwer Academic Publishers, v. 58, pp. 157-179. Çelebi, M., Toksöz, N., and Büyüköztürk, O. (2012). Rocking behavior of an instrumented unique building on the MIT campus identified from ambient shaking data, paper submitted to Earthquake Spectra. COSMOS. (2001). Proceedings of Invited Workshop on Strong-Motion Instrumentation of Buildings, CP-2001/04. Fumal, T. (1978). Correlations between seismic wave velocities and physical properties of near-surface geologic materials in the southern San Francisco Bay region, California, USGS Open-File Report 78-1067. Fumal, T. (1991). A Compilation of the Geology and Measured and Estimated Shear-Wave Velocity Profiles at Strong-Motion Stations that Recorded the Loma Prieta, California, Earthquake, USGS Open-File Report 91-311. Huang, M., Shakal, A., Petersen, C., Çelebi, M., Hooper, J., and Klemencic, R. (2012). Strong Motion Instrumentation of a 62-story concrete core residential building in San Francisco, Proc. SMIP12 Seminar on Utilization of Strong-Motion Data, Sacramento CA. Oct. 2, 2012. Juang, J. N. (1994). Applied System Identification, Prentice Hall, Upper Saddle River, NJ. 394 pages. Ljung, L. (1987). System Identification: Theory and User. Prentice hall, Englewood Cliffs, NJ. Mathworks. (1988 and newer versions). Matlab Users Guide. System Identification Toolbox for use with Matlab, The Mathworks Inc., South Natick, MA. Schlocker, J. (1974). Geology of the San Francisco North quadrangle, California: U.S. Geological Survey Professional Paper 782, 109 p.
Van Overschee, P. and De Moor, B. (1996). Subspace identification for linear systems. Kluwer Academic Publishers, Dordrecht, The Netherlands.

SMIP12 Seminar Proceedings
110