Embed Size (px)
Citation preview

IZA DP No. 1959
Social Segregation in Secondary Schools:How Does England Compare with Other Countries?
Stephen P. JenkinsJohn MicklewrightSylke V. Schnepf
DI
SC
US
SI
ON
PA
PE
R S
ER
IE
S
Forschungsinstitutzur Zukunft der ArbeitInstitute for the Studyof Labor
January 2006

Social Segregation in Secondary Schools:
How Does England Compare with Other Countries?
Stephen P. Jenkins ISER, University of Essex, DIW Berlin and IZA Bonn
John Micklewright
S3RI, University of Southampton and IZA Bonn
Sylke V. Schnepf
S3RI, University of Southampton and IZA Bonn
Discussion Paper No. 1959 January 2006
IZA
P.O. Box 7240 53072 Bonn
Germany
Phone: +49-228-3894-0 Fax: +49-228-3894-180
Email: [email protected]
Any opinions expressed here are those of the author(s) and not those of the institute. Research disseminated by IZA may include views on policy, but the institute itself takes no institutional policy positions. The Institute for the Study of Labor (IZA) in Bonn is a local and virtual international research center and a place of communication between science, politics and business. IZA is an independent nonprofit company supported by Deutsche Post World Net. The center is associated with the University of Bonn and offers a stimulating research environment through its research networks, research support, and visitors and doctoral programs. IZA engages in (i) original and internationally competitive research in all fields of labor economics, (ii) development of policy concepts, and (iii) dissemination of research results and concepts to the interested public. IZA Discussion Papers often represent preliminary work and are circulated to encourage discussion. Citation of such a paper should account for its provisional character. A revised version may be available directly from the author.

IZA Discussion Paper No. 1959 January 2006
ABSTRACT
Social Segregation in Secondary Schools: How Does England Compare with Other Countries?*
We provide new evidence about the degree of social segregation in England’s secondary schools, employing a cross-national perspective. Analysis is based on data for 27 rich industrialised countries from the 2000 and 2003 rounds of the Programme of International Student Assessment (PISA), using a number of different measures of social background and of segregation, and allowing for sampling variation in the estimates. England is shown to be a middle-ranking country, as is the USA. High segregation countries include Austria, Belgium, Germany and Hungary. Low segregation countries include the four Nordic countries and Scotland. In explaining England’s position, we argue that its segregation is mostly accounted for by unevenness in social background in the state school sector. Focusing on this sector, we show that cross-country differences in segregation are associated with the prevalence of selective choice of pupils by schools. Low-segregation countries such as those in the Nordic area and Scotland have negligible selection in schools. High segregation countries like Austria, Germany and Hungary have separate school tracks for academic and vocational schooling and, in each case, over half of this is accounted for by unevenness in social background between the different tracks rather than by differences within each track. JEL Classification: D39, I21, I39 Keywords: social segregation, secondary schools, England, cross-national comparison,
PISA Corresponding author: John Micklewright Social Statistics School of Social Sciences University of Southampton Highfield Southampton SO17 1BJ United Kingdom Email: [email protected] * This research was supported by ESRC grant RES-000-22-0995 ‘Social segregation in UK schools: benchmarking with international comparisons’. We thank Lucinda Platt and seminar participants at Southampton, the LSE, and the Institute of Education, for helpful comments. Jenkins thanks DIW Berlin for their hospitality during work on the paper.

1. Introduction Social segregation in schools – the uneven distribution across schools of children
from different socio-economic backgrounds – has been much discussed in England in
recent years. There has been debate about whether the 1988 Education Reform Act
led to greater polarisation in the social composition of schools. Similar concerns have
been expressed about the changes proposed in the 2005 White Paper on education
(DfES 2005), with its emphasis on greater parental choice and greater independence
for schools. Social segregation is of interest for several reasons. If children’s
performance at school depends on their peers, higher levels of social segregation lead
to greater inequality in academic achievement and thence to greater inequality in
later-life outcomes. And excessive segregation may threaten present-day social
cohesion. In some circumstances, greater social segregation may even reduce average
achievement levels.1
The extent of segregation in England’s secondary schools may be assessed in
two ways. Segregation today may be compared with segregation in earlier years (e.g.
Gorard 2000, Noden 2000, Goldstein and Noden 2003, Allen and Vignoles 2006).
Alternatively, it may be compared with levels elsewhere: does England have a little or
a lot of social segregation when compared with other industrialised countries? We
take this second route.
We compare the situation in England with that in 24 OECD countries using
data from the 2000 and 2003 rounds of the Programme of International Student
Assessment (PISA). We also compare England with Scotland and Northern Ireland,
the two other countries in the UK that are natural comparators since (unlike Wales)
they have educational systems that differ from England’s. This analysis points to
some intriguing differences that would have been hidden by analysis at the UK level.
Our research significantly extends the analysis by Gorard and Smith (2004),
based on the 2000 PISA round. We use data from both the 2003 and 2000 rounds, we
consider nearly all OECD countries rather than only the EU-15, and we look at
England, Scotland and Northern Ireland separately rather than taken together as the
UK. Much of their paper was about segregation other than by social background
whereas that aspect is our focus. We also consider other measures of segregation
1 The evidence on peer group effects is reviewed by Vignoles et al. (2000), and other possible impacts of social segregation are described by Allen and Vignoles (2006).
1

itself, and we account for sampling variation by calculating standard errors and
confidence intervals for our estimates of segregation indices. In addition, we use
quantitative decompositions of segregation indices by school type (defined in various
ways) to help explain the cross-national patterns observed. In constructing these
explanations, we draw on PISA data about the prevalence of choice of schools by
parents and of pupils by schools, statistics that are also of interest in their own right.
We show that England is a middle-ranking country, with segregation
substantially higher than in Scotland and the Nordic counties, but with less
segregation (according to most measures) than Germany and other countries with
distinct academic and technical secondary school tracks.
How can one explain the degree of social segregation observed in England,
and its position relative to other countries? How is it that children of different social
backgrounds are distributed unevenly across a nation’s schools? Three factors are
likely to be of particular importance:
o Where parents of different social backgrounds live.
o How parents of different social backgrounds choose schools for their children, and
of what type, e.g. private versus state.
o How schools choose their pupils, given that factors taken into account in
admissions policies, including ‘ability’, are associated with social background.
PISA data do not allow us to examine the first factor: the only useful geography
variable refers to urban versus rural location. But the survey does ask questions that
allow us to construct measures of ‘parental choice’ and ‘school choice’ from the
responses by children and schools.
Our strategy for exploring the drivers of observed social segregation patterns
is a sequential one. First, we consider whether England’s position can be attributed to
the existence of the private school sector. Drawing on decompositions of segregation
indices, we argue that England’s segregation is driven largely by what happens within
the state secondary school sector. The state secondary school sector is therefore the
focus of the rest of the paper.
Comparisons of the segregation in England’s state school sector with
segregation in the state school sector of OECD countries confirm that England is a
middle-ranking country in terms of segregation, although somewhat lower down
compared to its all-schools ranking. And social segregation in England’s state
secondary schools is distinctly higher than in Scotland’s. In the rest of the paper, we
2

explore whether PISA data about the prevalence of parental choice of schools, and the
prevalence of schools’ choice of pupils, help explain England’s position relative to
other countries.
England is found to have the highest level of parental choice among the
OECD countries examined. At the same time, differences in parental choice across
countries are not strongly associated with differences in levels of social segregation.
In contrast, segregation is generally higher in countries with greater levels of school
choice. State secondary school systems that are essentially selective, as in Austria,
Germany and Hungary, contrast markedly with England’s, which is largely
comprehensive. The greater prevalence of school choice provides one explanation for
why social segregation is higher in those countries than in England.
2. Data and Methods
Data
PISA collects information about 15 year old children and their schools using a cross-
nationally harmonized questionnaire for countries belonging to the OECD. We use
data for 27 countries that participated in both the 2000 and 2003 rounds of the PISA
survey. See OECD (2001, 2004) for a description of the survey.
In each PISA round, samples of about 100 to 150 schools that are attended by
15 year olds are drawn in each country with probability proportional to school size,
followed by selection of 35 of the 15 year olds in each school (or all 15 year olds if
fewer than 35 are enrolled) using simple random sampling. Combining data from the
two rounds has a major pay-off: sample sizes increase substantially. In the case of
England, our pooled sample covers 314 schools and 7,886 children. The pooled
samples from the other parts of the UK are smaller: 190 schools and 5,095 children
for Scotland and 233 schools and 5,702 children in Northern Ireland. Wales was
excluded from the analysis because the number of schools per survey round was too
small (fewer than 10). Response rates in England at both school and student level
were below the average for other countries in both 2000 and 2003. We investigated
the likely impact of this on our results, and conclude that the effect is only minor: see
the Appendix.
3

`
Measures of social background
A range of family background information is collected from the 15 year olds. We
focus on parental occupation. Children are asked for the current or last occupation of
each of their parents (or of the adults they spend most time with). From the
information about each parent’s occupation, the PISA organisers derive the two-digit
international index of socio-economic position proposed by Ganzeboom et al. (1992).
The index captures the attributes of occupations that convert parents’ education into
income. Our measure of the child’s social position is the higher of the two index
values if two parents are present, and the index value itself in the single parent case.
(More details are provided in the Appendix, which also describes how we deal with
missing values.) We then transformed each child’s index of social position into a
variable with just two values: high and low. This is because we use conventional
measures of segregation (see below), and these require a binary classification of social
background.
We define high and low social position in each country in terms of the national
distribution of social position index values. High refers to having a value above the
national median; low refers to having a value equal to or below the median. The
percentage of children classified as having a high or low social position is therefore
the same in each country. In order to check the sensitivity of our results to the choice
of cut-off, we also re-estimate our segregation measures using a number of alternative
thresholds of the national distribution: the lower quartile, the upper quartile, and the
top decile.
A social background variable based on the education of the child’s mother was
also used. High values were defined to mean that the mother had completed education
to level 5 or above of UNESCO’s International Standard Classification of Education,
a commonly-used international benchmark, which corresponds to post-secondary
tertiary education. The PISA data show that there is considerable cross-national
variation in the proportion of mothers with high education: less than 20 percent in
some countries, but greater than 40 percent in others. The fractions for England,
Scotland and Northern Ireland are 33 percent, 45 percent and 31 percent respectively.
4

Summary indices of segregation
We use two indices of the unevenness of the distribution of social background across
schools: the dissimilarity index, D (Duncan and Duncan 1955), and the square root
index, H (Hutchens 2001, 2004). The two indices are defined as follows. Let the
number of children in school i = 1, …, S, with a low social position be denoted by pi
and the number of children in school i with a high social position be denoted by ri. P
and R denote the number of children in the country as a whole with a low and high
social position, respectively. Then, the index formulae are:
D = ½∑=
−S
i
ii
Rr
Pp
1, and (1)
H = ∑= ⎥
⎥⎦
⎤
⎢⎢⎣
⎡⋅−⎟
⎠⎞
⎜⎝⎛S
i
iii
Rr
Pp
Pp
1
. (2)
D and H each range between a minimum of 0 (the complete absence of segregation, in
which case every school’s proportions of children from different social backgrounds
is exactly the same as the national proportions) and a maximum of 1 (when all pupils
in each school have the same background). Higher values indicate greater segregation.
D may be interpreted as the fraction of students with low social position that would
need to be moved to different schools, without replacing them by other children, in
order that every school had the same shares of children with low and high social
background in the country as a whole.2 H is the sum, over all schools, of each
school’s shortfall from distributional evenness. For each school, this shortfall is the
difference between the geometric mean of the shares of children from different
backgrounds were there to be no segregation (pi/P), and the geometric mean of the
actual shares.3
2 Since we calculate D at the level of the country, and not the individual city or Local Education Authority, no link can be made between our estimates and evaluation of proposals such as, for example, that in the 2005 White Paper to extend the provision of free school transport for low-income children (see DfES 2005, chapter 3). 3 If there is no segregation, then pi/P = ri/R in every school, and the geometric mean of the shares in school i in this case is simply pi/P or, equivalently, ri/R.
5

D and H measure unevenness in shares at the school level in different ways.
(D uses absolute differences, whereas in effect H uses proportionate differences.)
Because of this, the two indices may lead to different orderings of countries in terms
of their segregation; using both D and H enables us to check the robustness of our
conclusions to the choice of index.
Although D is commonly reported, it does not always satisfy a property that is
widely agreed to be important for segregation indices, i.e. the ‘transfers principle’.
This states that if a student with a low social position moves from a school with a
higher share of low-social-position children to a school with a lower share, then
overall segregation must fall. See e.g. James and Taeuber (1985). By contrast, H does
satisfy this property (Hutchens 2001, 2004).
More generally, H is ‘segregation curve consistent’. If the segregation curve
for country A lies entirely above the segregation curve for country B, then we can say
that segregation is lower in the first country according to all segregation indices that,
like H, satisfy the transfers principle and three other desirable properties
(organizational invariance, size invariance, and compositional invariance): see James
and Taeuber (1985) and Hutchens (1991). To check the robustness of our conclusions,
we supplement our calculations of D and H with comparisons of segregation curves
for England, Scotland and Northern Ireland.
H has the further attraction of being ‘additively decomposable’ by subgroups
of schools. (D is not.) Suppose, for example, that every school can be classified as
either a private school or a state school. For each country, H can be decomposed into
two parts, segregation within state and private schools, and segregation between the
state and private school sectors, as follows:
H = Hwithin + Hbetween, where Hwithin = ∑ w=
G
g 1gHg (3)
The first component of (3), Hwithin, is a weighted sum of the segregation within each
sector (G = 2 in the example of private and state schools). Hg is the value of H
calculated using data for all schools in sector g, which is aggregated using weights
(wg) reflecting the ‘importance’ of each sector (the formula for the weights is given by
Hutchens 2004). The between-group term, Hbetween, shows the amount of segregation
that would remain if there were no segregation within each school type. In this case,
6
the proportions of children with low and high social position within every private
school are the same, and the proportions of low and high social position children
within every state school are the same, though the proportions may differ between
schools of different types. Hbetween expressed as a fraction of H, may be interpreted as
the share of total segregation that is attributable (in an accounting sense) to the
unevenness associated with differences in social background across school types.4
Sampling variation and related issues
Since PISA is a sample survey, any measure of segregation estimated with the data is
subject to sampling variation. We estimate standard errors and confidence intervals
for D and H by applying the bootstrap method with 400 bootstrap replicate samples of
schools. In addition, there is an issue that estimates of segregation indices based on
sample surveys may be upwardly biased (Ransom 2000). We have investigated this
issue, and our results (not reported here) suggest that the number of schools is
sufficient to reduce bias to negligible levels, although some upward bias due to the
size of the pupil samples may remain.
Our estimates of D and H are calculated using the final student weights
supplied with the PISA data in order to derive the appropriate estimates of the
population values. The weights take into account both the sampling of schools with
probability proportional to size and the simple random sampling of students. They
also take into account levels of response by both schools and pupils within schools.
The same weights are used to derive all descriptive statistics.
3. Differences in social segregation across OECD countries
Estimates of D and H for 27 countries, including England, Scotland and Northern
Ireland, are shown in Figures 1 and 2. Each country’s estimate is represented by a
point, and the lines extending either side of each point show the 95 percent confidence
interval for the estimate. High social background is defined by whether the parental 4 This is not to say that total segregation would fall to Hwithin were private schooling to be abolished. If this were to happen, some unevenness in social background would probably be introduced into the state sector as parents of ex-private-school pupils choose schools for their children, for example by moving into catchment areas of schools perceived to be of better quality.
7

occupation index is above the national median value; low social background is
defined by a below-median value.
<Figure 1 near here>
According to the estimates of D, social segregation is highest for countries
such as Austria, Germany and Hungary, each of which has secondary school systems
with separate academic and technical school tracks. Among the seven countries with
the lowest social segregation are the four Nordic countries: Norway, Sweden,
Denmark and Finland. England is in the top half of the distribution, just ahead of
Northern Ireland. Scotland is a low segregation country, right at the bottom of the
figure. Although the USA is often viewed as a high inequality country – see e.g.
Atkinson et al. (1995) on income inequality – it does not stand out as a high
segregation country. The US estimate of D is below the median, at around the same
level as Canada’s.
When we switch to H as the segregation index, the picture changes little: the
patterns in Figure 2 are similar to those in Figure 1. The Pearson correlation
coefficient between the estimates of D and H is 0.97, and the Spearman rank
correlation is 0.96. One notable difference is that, according to H, segregation in
England is slightly larger than in Austria, whereas it is lower according to D.
<Figure 2 near here>
As a further check on the robustness of results, we compared the segregation
curves for England, Scotland and Northern Ireland (see the Appendix for the graphs).
We find that the curve for England lies everywhere outside that for Scotland,
indicating that England is the more segregated country according to all segregation
curve consistent indices of segregation, and not only H.
The confidence intervals around the estimates of the indices are quite wide in
many cases (they are smallest for countries with larger than usual sample sizes, e.g.
Canada). Reflecting this, the estimate of D for England is not significantly different
from that for Northern Ireland or that for the country with the median value, Portugal.
Nevertheless, we can reject the hypothesis at the five percent level that the estimate of
D for England is the same as those for Germany or the USA and – at much more
demanding levels of significance – Scotland. England’s estimate of H is significantly
greater than the estimate for Northern Ireland (the median country), as well as for the
USA and Scotland.
8

We also examined the robustness of results to the definition of low and high
social background. England’s level of segregation relative to levels elsewhere could
depend on the cut-off in each country’s national distribution of parental occupation
scores that is used to define high and low social positions. For example, it might be
the children from the very top social backgrounds that are particularly segregated in
England, whether in private schools or in state schools with very affluent catchment
areas. Or, instead, it may be that the very poorest children are highly concentrated in
part of the state sector. These aspects would be hidden by using the median value of
the index as the cut-off defining high and low social backgrounds, as we did in
Figures 1 and 2.
The Appendix gives tables of estimates, for all our counties, of D and H with
four different thresholds of the parental occupational index, the lower quartile, the
median, the upper quartile and the 90th percentile. Also reported there are estimates
based on whether the mother had a tertiary education or not. For brevity, we report
only a summary of these results and for a selection of countries including England.
For selected countries, Table 1 shows the average country rank according to D and to
H, with the average taken across the ranks in the five sets of estimates corresponding
to the different social background measures.5
<Table 1 near here>
For both D and H, England has an average rank that is in the middle of the
distribution of estimates for the 27 countries. A switch to the 90th percentile does not
reveal England as a highly segregated country (England ranks 18th on this measure for
D and 17`th for H). In fact, the values of both D and H are at their highest for England
(in rank terms) when we use the median threshold to define high and low social
background. Application of the other thresholds leads to England having lower
segregation in relative terms. England’s average rank is similar to that of the USA (a
country which never appears in the top half of the rankings when using D), and it is
only when the median is the high/low cut-off that any difference between the two
countries is statistically significant.
Northern Ireland appears slightly less segregated than England when we use
the bottom quartile or the median to define the high/low cut-off and slightly more
5 We also summarized the Appendix tables by calculating the average index value for each country across the five estimates, and then ranking the countries according to the averaged index. The ranking produced is very similar to the one currently reported.
9

segregated when we use the upper quartile or the 90th percentile. However, most of
the differences are statistically insignificant. By contrast, Scotland clearly has much
lower segregation than England. In only one case – estimates of D with the top
quartile threshold – is there no statistically significant difference between the
estimates for the two countries.
More generally, the classification into high-segregation and low-segregation
countries remains robust. Hungary is the most segregated country according to D and
H and for all high/low thresholds – a very clear cut result. (The other two Central
European countries in the survey, Poland and the Czech Republic, are usually in the
top third of index values.) Germany also has relatively high segregation, regardless of
index and threshold used. The Nordic countries continue to be among the countries
with the lowest social segregation.
4. The role of private schooling
The expansion of choice of school that is made available to parents by a well-
developed private sector is clearly one possible driver for England’s social
segregation in schools. To send children to private schools, parents need to be able to
afford the fees and, also, many private schools have admission criteria based on
academic ability (and academic ability is related to social background).
The first issue to resolve is the size of the private sector in England’s
secondary school system, and how the size compares with that for other countries.
PISA estimates are given in Table 2. (For brevity, statistics are shown for only a
selection of countries and for the OECD average.) Two definitions of a ‘private’
school are used. The first relates to the nature of the school’s management, in which
case private schools are those where the principal indicated that the school was
managed directly or indirectly by a non-government organisation (rather than a public
education authority, government agency or a governing body appointed by
government or elected by public franchise). The second definition relates to funding.
We define a school as private on this basis if the principal reported that more than 20
percent of total funding for the school in a typical year comes from ‘student fees or
school charges paid by parents’.
<Table 2 near here>
10
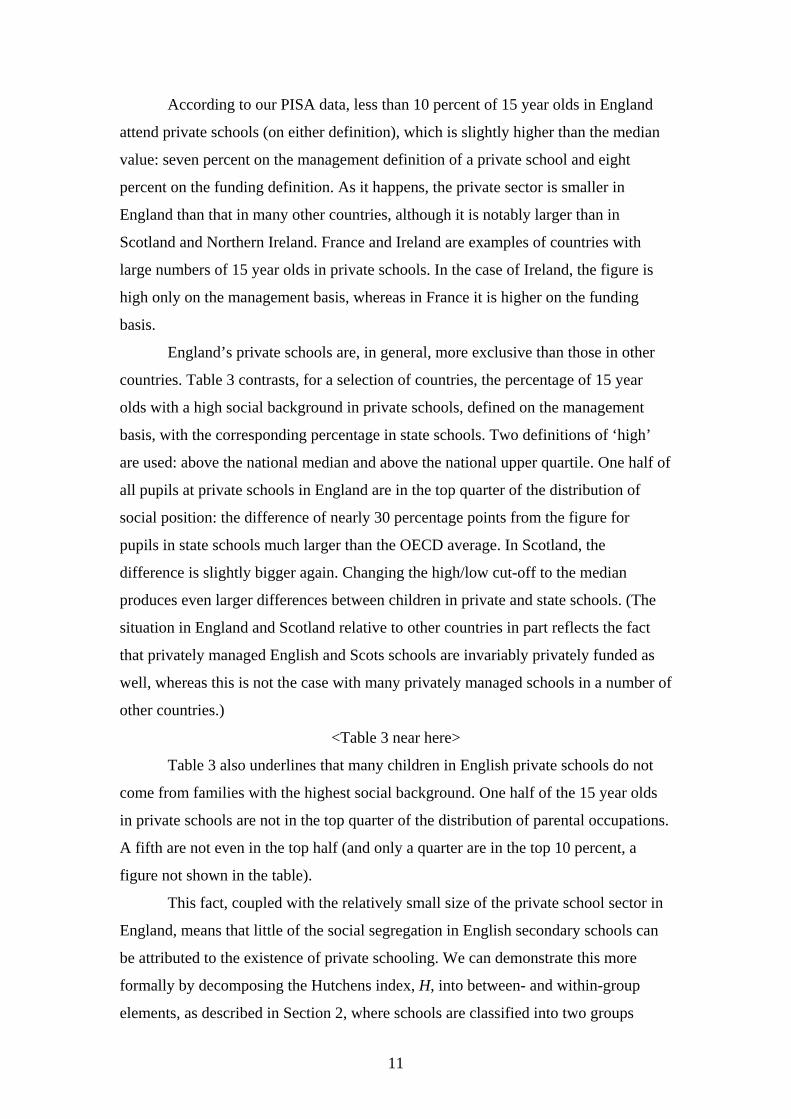
According to our PISA data, less than 10 percent of 15 year olds in England
attend private schools (on either definition), which is slightly higher than the median
value: seven percent on the management definition of a private school and eight
percent on the funding definition. As it happens, the private sector is smaller in
England than that in many other countries, although it is notably larger than in
Scotland and Northern Ireland. France and Ireland are examples of countries with
large numbers of 15 year olds in private schools. In the case of Ireland, the figure is
high only on the management basis, whereas in France it is higher on the funding
basis.
England’s private schools are, in general, more exclusive than those in other
countries. Table 3 contrasts, for a selection of countries, the percentage of 15 year
olds with a high social background in private schools, defined on the management
basis, with the corresponding percentage in state schools. Two definitions of ‘high’
are used: above the national median and above the national upper quartile. One half of
all pupils at private schools in England are in the top quarter of the distribution of
social position: the difference of nearly 30 percentage points from the figure for
pupils in state schools much larger than the OECD average. In Scotland, the
difference is slightly bigger again. Changing the high/low cut-off to the median
produces even larger differences between children in private and state schools. (The
situation in England and Scotland relative to other countries in part reflects the fact
that privately managed English and Scots schools are invariably privately funded as
well, whereas this is not the case with many privately managed schools in a number of
other countries.)
<Table 3 near here>
Table 3 also underlines that many children in English private schools do not
come from families with the highest social background. One half of the 15 year olds
in private schools are not in the top quarter of the distribution of parental occupations.
A fifth are not even in the top half (and only a quarter are in the top 10 percent, a
figure not shown in the table).
This fact, coupled with the relatively small size of the private school sector in
England, means that little of the social segregation in English secondary schools can
be attributed to the existence of private schooling. We can demonstrate this more
formally by decomposing the Hutchens index, H, into between- and within-group
elements, as described in Section 2, where schools are classified into two groups
11

according to whether they are privately-managed schools or state schools.6 The
estimates are derived for the countries used in Tables 2 and 3, with the exception of
Northern Ireland, where virtually no 15 year olds are in private schools, and Sweden.
High and low social position are defined using the national median cut-off (as in
Figures 1 and 2).
The estimate of H for each country as a whole is shown in the first column of
Table 4. The next two columns give the estimates for the private and state school
sectors (the Hg in equation 3). The weighted sum of the segregation in each sector, in
the fourth column, is Hwithin. The final two columns show within- and between-group
segregation as percentages of total segregation.
<Table 4 near here>
The spread of children from different backgrounds who do go to private
schools is far from even: there is significant segregation within the private sector. The
value of Hprivate for England is the highest in the table, but the cross-national
differences should be treated with caution. The number of private schools in the
samples for most countries, including England, is low and hence the estimates of
Hprivate are subject to large sampling variation. (This is much less true of the figures
for the private sector in Table 3, where it is the much larger sample sizes of pupils that
is relevant.) The value of H for the state sector in England is not much smaller than
for the country as a whole (the two estimates are even closer in other countries). This
is because Hstate drives the total within group value given in the next column (the
weight for the state sector, not shown, is over 0.9), and because the within-group
share is much more important than the between-group share, as shown by the last two
columns.
The share of total segregation that is accounted for by school type is shown in
the final column of Table 4. The value for England and Scotland, nearly 20 percent, is
high by comparison with other countries, including those not shown in the table. For
example, it is equalled, or exceeded, only in Spain (23 percent), and in Greece (19
percent). Ireland and Switzerland are the only other countries with a between group
share of 10 percent or more. The USA is one of 11 countries with a figure of two
percent or less. In this sense, the existence of the private sector contributes to social 6 In fact, the within-group value is a weighted sum of the values for three groups of schools rather than two: private schools, state schools, and a small group of schools for which information on private-state status is missing. Excluding the schools with missing data on status from the calculations, and using just two groups, made a negligible difference to the results.
12

segregation in England and Scotland much more than in most other countries.
Nonetheless, and as in other countries, the overall level of segregation is accounted
for much more by an uneven spread of social backgrounds across schools within the
state sector.
5. Segregation within the state sector
How does England look, from a cross-national perspective, when we concentrate on
segregation in the state sector only, excluding private schools? (‘Private’ is defined on
a management basis.) Estimates of D and H for state schools are shown in Figures 3
and 4, with the high/low social position cut-off again being the national median
(among all children and not just those in state schools). The values of H reported for
England and the other countries concerned are the same as the Hstate values in Table 4.
There are wide confidence intervals for some countries, e.g. Belgium and Ireland and,
especially, the Netherlands. This reflects the fact that there is a relatively large private
sector in these countries, so that the sample size of state sector schools is
correspondingly smaller.
England’s place in the rankings in these graphs is lower than when all schools
were considered (Figures 1 and 2). (The move down the ranking is to be expected
given the differences in Hbetween shown earlier.) According to D, England is just below
the median country, Switzerland, and according to H, not far above the median
country, Northern Ireland (with a value that is insignificantly different). And,
according to estimates based on the five different thresholds (as in Table 1),
England’s average rank falls to 16.6 on D and 16.8 on H (from 14.0 and 13.8
respectively).
Despite these changes, it remains the case that England’s segregation is
bounded above by the values for high-segregation countries such as Hungary and
Germany, and bounded below by the values for the low-segregation countries such as
the Nordic countries and Scotland.
13
Choice of schools by parents, and choice of pupils by schools
The current debate on social segregation in England’s state secondary schools
revolves around the issue of choice, both of schools by parents and of pupils by
schools. The subtitle of the 2005 White Paper (DfES 2005), ‘More choice for parents
and pupils’, emphasises the former. But much of the concern expressed about the
possible impact of the proposed changes on segregation relates to the latter – that by
gaining more control over their admissions, schools will be able to become more
selective, a concern that the government states is unfounded.7 The question arises as
to the extent of choice currently exercised by parents and schools in England, how
this compares with that in other countries, and whether the differences help explain
the cross-national pattern of social segregation.
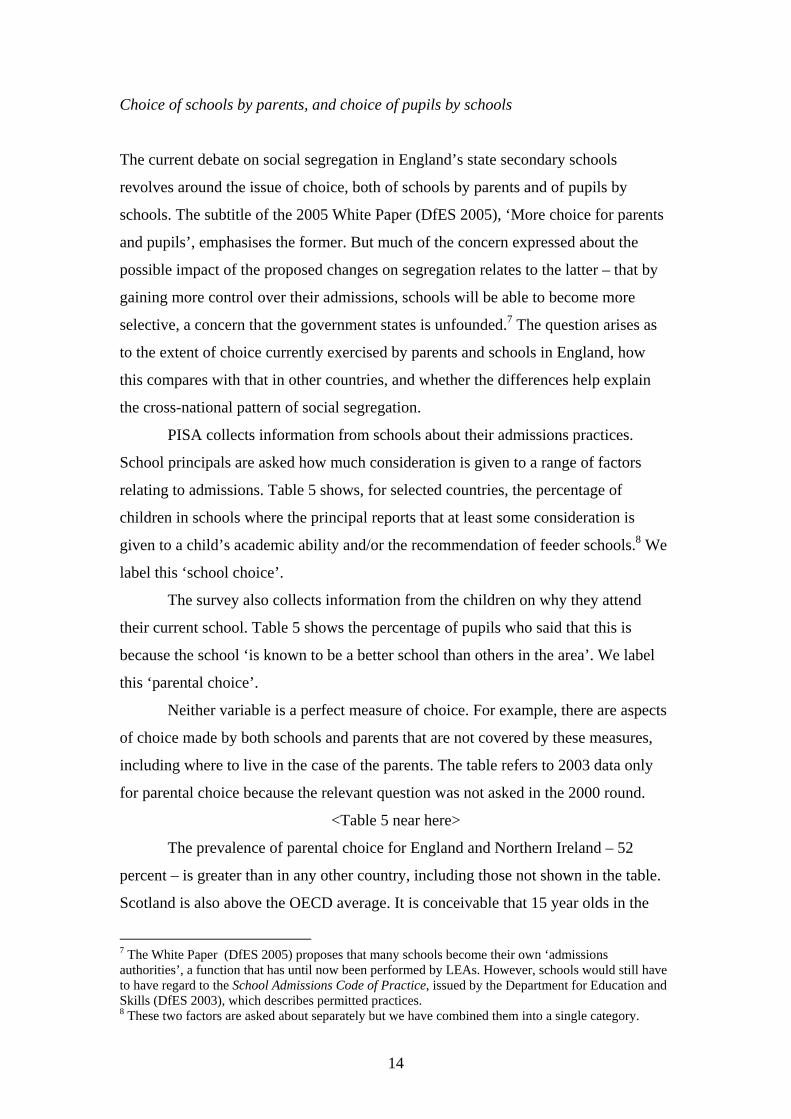
PISA collects information from schools about their admissions practices.
School principals are asked how much consideration is given to a range of factors
relating to admissions. Table 5 shows, for selected countries, the percentage of
children in schools where the principal reports that at least some consideration is
given to a child’s academic ability and/or the recommendation of feeder schools.8 We
label this ‘school choice’.
The survey also collects information from the children on why they attend
their current school. Table 5 shows the percentage of pupils who said that this is
because the school ‘is known to be a better school than others in the area’. We label
this ‘parental choice’.
Neither variable is a perfect measure of choice. For example, there are aspects
of choice made by both schools and parents that are not covered by these measures,
including where to live in the case of the parents. The table refers to 2003 data only
for parental choice because the relevant question was not asked in the 2000 round.
<Table 5 near here>
The prevalence of parental choice for England and Northern Ireland – 52
percent – is greater than in any other country, including those not shown in the table.
Scotland is also above the OECD average. It is conceivable that 15 year olds in the
7 The White Paper (DfES 2005) proposes that many schools become their own ‘admissions authorities’, a function that has until now been performed by LEAs. However, schools would still have to have regard to the School Admissions Code of Practice, issued by the Department for Education and Skills (DfES 2003), which describes permitted practices. 8 These two factors are asked about separately but we have combined them into a single category.
14

UK are more attuned to the debate on choice of schools and therefore are more aware
of their parents’ decisions than 15 year olds in other countries. But there is no reason
to believe that this is the most important explanation for the striking cross-national
differences. The relatively high prevalence of parental choice in England corresponds
with figures for a different measure found in different data. According to the Pupil
Level Annual School Census, the percentage of children in all English secondary
schools who do not attend their nearest school is 55 percent (Burgess et al. 2004).
Not surprisingly, parental choice is more prevalent in large urban areas where
there are more schools within easy travelling distance. In England, 60 percent of 15
year olds in cities (population 100,000+) say that they attend a school that is known to
be better than others in the area, compared to 50 percent of children in large towns
(population 15,000 to 100,000) and 45 percent in rural areas (population of town or
village less than 15,000). And, in rural areas, more children report attending their
school because it is ‘the local school for students who live in this area’: 74 percent,
compared to 62 percent in large towns and 52 percent in the cities.9 This pattern is
consistent with the somewhat lower levels of segregation in schools in rural areas that
we find when we decompose H by urban versus rural location. Parental choice is also
somewhat more common in England for children with more educated mothers: its
prevalence is 59 percent among children with mothers with tertiary education and 50
percent for other children.
By contrast with parental choice, the prevalence of school choice is low in
England by OECD standards. Just over a quarter of 15 year olds in England are in
schools where the principal reports any selection as defined above compared to more
than one half in the OECD on average. The prevalence of school choice is also low in
Scotland.
The prevalence of school choice in state schools in England may seem
surprisingly high for a country with a state school system that is primarily
comprehensive, with small residual amounts of selective grammar schooling.
However, even comprehensive schools have some discretion to select on ability under
the School Admissions Code that governs admissions policies in the state sector
(DfES 2003). Schools that specialise in particular subject areas (including languages,
arts, sport, and design and technology) are permitted to select up to 10 percent of their 9 As these figures imply, some children report attending their school both because it is the local school for the area and because it is known to be better than other schools in the area.
15

pupils on aptitude for the subject concerned. And some schools operate an admissions
policy involving ‘fair banding’ by ability: selection of applicants in strict proportion
to their numbers in each of a number of bands across the ability range. The principals
of these schools would presumably report to PISA that they use ability as an
admissions criterion, but this form of selection should not lead to an increase in social
segregation. Put another way, the measure of school choice may not capture well the
diversity of dimensions of school choice that now exist in England.
Segregation, parental choice, and school choice
Does cross-national variation in school choice and in parental choice help explain
differences in segregation and hence England’s place in the rankings? (Clearly it
cannot explain all of the differences as segregation in England and Northern Ireland
are at about same level, but school choice is distinctly more prevalent in the latter.)
We investigate this first by plotting the values of H for the state sector in each country
against the prevalence of school and parental choice in state schools: see Figures 5
and 6. The scatterplots suggest that school choice is an important factor: higher levels
of segregation in state secondary schools are associated with higher prevalences of
school choice. The correlation between the two is 0.58. (This rises to 0.72 if the
outlier with a very high school choice prevalence and low segregation, Japan, is
excluded.) A greater prevalence of parental choice may also be related to higher
segregation, but this is not apparent from Figure 6. This shows no association, and the
correlation is only 0.12. (The association is no stronger if we control for the level of
school choice in each country.) We focus on aspects of school choice from now on.
The next step in the analysis was to decompose H by school types
distinguishing between schools according to whether they choose pupils or not
(according to our definition). It turns out that virtually all of the state sector
segregation in England is within the two groups of school, those that choose and those
that do not, and that the level of segregation in each sector is similar.10 That is,
Hbetween is only a small fraction of total H. (This was true for some other countries as
well.) Indeed the social position of 15 year olds in state secondary schools in England
that do choose pupils according to our definition differs very little on average from 10 This does not mean that social segregation at the level of the LEA is no higher in those LEAs that still operate a grammar school system. On this subject, see Burgess et al. (2004).
16

that of children in other state schools. (High social position is taken here as being
above the national median.)
Our resolution of the apparent contradiction between the scatterplot in Figure
6 and the decomposition analysis concerns the suitability of the PISA-based definition
of school choice. Although the school choice variable is harmonized on a cross-
national basis (by construction), this aspect is also its Achilles heel: the variable may
not distinguish important country-specific aspects of school choice and the school
system itself.11 We elaborate this argument by first contrasting England and Northern
Ireland (both middle-ranking countries in terms of social segregation, broadly
speaking), and then contrast the high- and low-segregation countries.
The secondary school systems in England and Northern Ireland differ. In the
latter case, there are a substantial number of state grammar schools that select
explicitly on academic ability. School choice according to our definition is common
in Northern Ireland and above the OECD average, and there are large differences in
social position between children in schools exercising choice and those that do not.
Where there is no school choice, 38 percent of pupils have a social position above the
national median cut-off compared with 56 percent of pupils in schools that do choose,
and 64 percent if the definition of school choice is restricted to selecting on academic
ability alone, excluding feeder school recommendation. Decomposition of H for
Northern Ireland yields a between-group share of 16 percent if school choice is
defined as including feeder school recommendations, and 37 percent if those
recommendations are excluded from the definition.
Hence the existence of school choice does seem to explain a significant part of
the social segregation in Northern Ireland’s state secondary schools. The PISA
variable does encapsulate the key dimensions of school choice that characterize the
Northern Irish system. But the same measure does not encapsulate the various
dimensions of school choice in England that were described earlier and,
correspondingly, the measure’s power to account for the level of social segregation is
weaker.
Now consider the high-segregation countries. For several of these, PISA
provides another measure of how pupils are placed in secondary schools, one that is
intimately related to the nature of the national school system. In particular, Austria, 11 It is possible that the PISA-based measure of parental choice is subject to similar limitations. For example, we have not been able to consider the impact of the decision on where to live.
17

Germany and Hungary have distinct academic and vocational secondary school tracks
that are intended to cater for children with different types and levels of ‘ability’. The
average social position of children differs markedly between the various types of
schools. Decomposition of H by school track leads to between-group shares of total
segregation of between 55 and 60 percent in all three countries (high social position is
defined as above the national median of the parental occupation index). Most
segregation would remain even if children of different social positions were evenly
distributed within each school track. The bulk of segregation in these countries stems
from the existence of the different school types with their different admissions
policies.12 By contrast, low-segregation countries such as the Nordic ones and
Scotland may be characterized as having secondary school systems without selection
related to academic ability.
6. Summary and conclusions
Our comparisons of social segregation in England’s secondary schools with that in
other industrialised countries may be summarised as follows:
o England is a middle-ranking country in OECD terms. Making allowance for
sampling variation, and for the fact that England’s position varies somewhat with
choice of segregation index and with the measure of social position, the safest
conclusion is that it comes near the middle of the distribution of social segregation
found in OECD countries.
o High-segregation countries include Austria, Belgium, Germany, and Hungary.
Hungary stands out as having the highest level of segregation, whatever our
choice of index or social position.
o Low-segregation countries include the Nordic countries of Denmark, Finland,
Norway and Sweden. They also include Scotland. We are able to reject almost
always the hypothesis that social segregation is the same in Scotland and England.
12 We define school type in these decompositions to have seven categories in Germany, seven in Austria and four in Hungary. The three most important school tracks (in terms of numbers of 15 year olds in the PISA samples) are Gymnasium, Realschule and Hauptschule in Germany, Gymnasium, vocational and high vocational in Austria, and grammar, vocational secondary and vocational in Hungary.
18

o The USA occupies a position in the country rankings that is similar to that of
England – towards the middle of the distribution.
o England’s segregation is not largely driven by the existence of private schools.
Most segregation is England is accounted for by the uneven spread of children
from different social backgrounds within the state sector.
o The prevalence of parental choice of school is high in the state sector in England
from a cross-national perspective, and the prevalence of school choice is low,
according to PISA-based measures of choice. Higher levels of segregation are
found in countries with a higher prevalence of school choice. The same is not true
for parental choice.
o Several countries with separate school tracks for academic and vocational
schooling – Austria, Germany and Hungary – have relatively high social
segregation, and over half of this is accounted for by unevenness in social
background between the separate school tracks.
When interpreting these findings, it should be remembered that we calculate levels
of segregation for whole countries, not for specific districts or cities within each
country. Hence, for example the finding that social segregation in England is similar
to that the USA means that, taking each country as a whole, the distribution of
children from different social backgrounds across secondary schools is similar in the
two countries. We were unable to investigate whether individual cities in the USA
have lower or higher levels of segregation than individual English cities, because the
numbers of schools and pupils are too small in the PISA surveys at this level of
analysis.
Whether a country-level or city-level analysis is undertaken is also likely to affect
the conclusions drawn about the underlying drivers of segregation. For example, we
noted in the Introduction that social segregation in a country may reflect three factors:
where families with different socio-economic characteristics live, parents’ choice of
schools given where they live, and schools’ choice of pupils, i.e. their admissions
policies. The first of these factors is likely to play a smaller role in studies of
segregation in specific districts or cities because, in that case, segregation is measured
conditional on the district or city in which parents live.
Our analysis provides international perspectives that help benchmark for
levels of social segregation in contemporary England. The research suggests that
19

greater selectivity in admissions by schools – which the current UK government
promises will not happen – would be likely to increase social segregation, especially
if this were coupled with any move towards separate academic and vocational school
tracks.
Our research also provides benchmarks for the levels of parental and school
choice in England, and these can be monitored using data from future rounds of the
PISA survey. At the same time, the investigation of the underlying causes of cross-
national differences in social segregation in schools has underlined the importance of
having measures of school and parental choice that appropriately summarize
particular country-specific features of a national education system.
References
Allen, R. & Vignoles, A. (2006 forthcoming) A critique of research on measuring
social segregation in schools 1989 to 2004, Working paper, February 2006
(London, Institute of Education).
Atkinson, A.B., Rainwater, L., & Smeeding, T.M. (1995) Income distribution in
OECD countries: evidence from the Luxembourg Income Study (Paris,
OECD).
Burgess, S., McConnell, B., Propper, C., & Wilson, D. (2004) Sorting and choice in
English secondary schools, CMPO Working Paper 04/111, October 2004
(University of Bristol, Centre for Market and Public Organisation).
Department for Education and Skills (DfES) (2003) School admissions code of
practice, DfES/0031/2003, February 2003 (London, DfES). Available at
http://www.dfes.gov.uk/sacode
Department for Education and Skills (DfES) (2005) Higher standards, better schools
for all. More choice for parents and pupils, Cm 6677, October 2005 (Norwich,
HMSO). Available at http://www.dfes.gov.uk/publications/schoolswhitepaper.
Duncan, O. & Duncan, B. (1955) A methodological analysis of segregation indexes,
American Sociological Review, 20, 210–217.
Ganzeboom, H., De Graaf, P. & Treiman, D.J., with De Leeuw, J. (1992) A standard
international socio-economic index of occupational status, Social Science
Research, 21, 1–56.
20

Goldstein, H. & Noden, P. (2003) Modelling social segregation, Oxford Review of
Education, 29, 225–237.
Gorard, S. (2000) Education and social justice (Cardiff, University of Wales Press).
Gorard, S. & Smith, E. (2004) An international comparison of equity in education
systems, Comparative Education, 40, 15–28.
Hutchens, R.M. (1991) Segregation curves, Lorenz curves, and inequality in the
distribution of people across occupations, Mathematical Social Sciences, 21,
31–51.
Hutchens, R.M. (2001) Numerical measures of segregation: desirable properties and
their implications, Mathematical Social Sciences, 42, 13–29.
Hutchens, R. (2004) One measure of segregation, International Economic Review, 45,
555–578.
James D.R. & Taeuber K.E. (1985) Measures of segregation, Sociological
Methodology, 15, 1–32.
Noden, P. (2000) Rediscovering the impact of marketisation: dimensions of social
segregation in England’s secondary schools, British Journal of Sociology of
Education, 21, 371–390.
OECD (2001) Knowledge and skills for life – first results from PISA 2000 (Paris,
OECD).
OECD (2004) Learning for tomorrow’s world – first results from PISA 2003 (Paris,
OECD).
Ransom, M. (2000) Sampling distributions of segregation indexes, Sociological
Methods and Research, 28, 454–475.
Vignoles, A., Levacic, R., Walker J., Machin, S. & Reynolds, D. (2000) The
relationship between resource allocation and pupil attainment: a review,
Discussion Paper 2, November 2000 (London School of Economics Centre for
the Economics of Education).
21

Table 1 Average country rank on D and H for five measures of social background,
selected OECD countries
Dissimilarity (D)
Hutchens (H)
England 14.0 13.8 Scotland 24.6 24.8 Northern Ireland 12.4 15.6 USA 16.6 13.6 Norway 25.8 23.8 Finland 21.4 22.8 Germany 5.0 4.6 Hungary 1.0 1.0
Note: four of the social background measures are based on the parental Ganzeboom occupational index, but use different cut-offs to define high and low social position: the lower quartile, median, upper quartile, and top decile of the national distribution. The fifth measure defines high social background to be if the child’s mother had tertiary education.
Table 2 Percentage of all 15 year old pupils attending private schools,
selected OECD countries
Definition of ‘private’ school Management Funding (%) (%) England 8 9 Scotland 4 4 Northern Ireland 1 2 Ireland 61 8 France 22 36 Germany 6 2 Sweden 4 0 USA 6 9 OECD median 7 8
Note. Schools are defined as private on the funding criterion if more than 20 percent of their income comes from fees. The OECD median is calculated by counting England, Scotland and Northern Ireland as separate countries. Data for France refer to 2000 only. The percentages in each column are calculated after excluding pupils in schools for which information is missing on the variable concerned.
22

Table 3
Percentage of pupils with high social background in selected OECD countries: state schools versus privately managed schools
High/low cut-off = median High/low cut-off = upper quartile Private State Difference Private State Difference (%) (%) (%) (%) (%) (% points)England 79 40 39 51 22 29Scotland 81 42 39 57 21 36Northern Ireland 57 50 7 25 24 1France 47 48 -1 25 24 1Germany 74 48 26 46 24 22Ireland 54 38 16 30 18 12Sweden 58 44 14 29 20 9USA 59 48 11 33 21 12 OECD average 61 44 17 35 22 12 Note: the lumpy nature of the national distributions of the parental occupation index means that in some cases a country has 50 percent or more of both private and state sector pupils above the median (e.g. Northern Ireland). See the Appendix. The OECD average is calculated by counting England, Scotland and Northern Ireland as separate countries. Data for France refer to 2000 only.
Table 4 Segregation within and between the private and state school sectors,
selected OECD countries All
schools Private schools
State schools
Within groups
Within groups
Between groups
H Hprivate Hstate Hwithin Hwithin Hbetween (as % of H) (as % of H) England 0.126 0.194 0.098 0.100 80.5 19.5 Scotland 0.068 0.035 0.057 0.055 81.0 19.0 Ireland 0.078 0.062 0.072 0.065 83.9 16.1 France 0.105 0.120 0.100 0.105 99.5 0.5 Germany 0.129 0.046 0.128 0.120 93.2 6.8 USA 0.095 0.084 0.087 0.094 98.7 1.3 Note: decomposition of H based on eqn. (3). High (low) family background is defined by whether the parental occupation index value is above (below) the national median. Data for France refer to 2000 only. The private school samples for Northern Ireland and Sweden are too small to undertake decomposition analyses. Schools for which information is missing on school management are included as a third group but the value of H is not reported for them.
23

Table 5 Parental choice and school choice in state schools,
selected OECD countries
Parental choice School choice (% of children in a school
‘known to be a better school than others in the area’)
(% of children in schools with selection on ability or feeder
school recommendation) England 52 28 Northern Ireland 52 63 Ireland 40 41 Scotland 36 22 Germany 24 75 Sweden 11 24 USA – 47 OECD average. 25 56
Note: Information on parental choice refers to 2003 only and is missing for the USA is missing altogether. The percentages in each column are calculated after excluding children for whom information is missing on the variable concerned.
24

Figure 1 Social segregation in schools, 27 countries, Dissimilarity index (D)
NorwayScotlandSweden
JapanDenmark
New ZealandFinlandIreland
CanadaUSA
AustraliaKorea
NetherlandsPortugal
ItalyGreece
N. IrelandSwitzerlandCzech Rep.
PolandEngland
FranceSpain
AustriaGermanyBelgiumHungary
Cou
ntry
.25 .3 .35 .4 .45 .5Dissimilarity Index (D), with 95% CI
Note: high (low) family background defined by whether the parental occupation index value is above (below) the national median. The horizontal lines show 95 percent confidence intervals. Data for Japan refer to 2003 only.
25

Figure 2 Social segregation in schools, 27 countries, Hutchens index (H)
JapanSwedenScotland
New ZealandFinlandNorwayIreland
DenmarkCanada
AustraliaKorea
USANetherlands
N. IrelandItaly
SwitzerlandPortugal
FrancePolandGreece
Czech Rep.Spain
AustriaEngland
GermanyBelgiumHungary
Cou
ntry
.05 .1 .15 .2Square Root Index (H), with 95% CI
Note: high (low) family background defined by whether the parental occupation index value is above (below) the national median. The horizontal lines show 95 percent confidence intervals. Data for Japan refer to 2003 only.
26

Figure 3
Social segregation in state schools, 27 countries, Dissimilarity Index (D)
ScotlandDenmark
NorwayJapan
SwedenNew Zealand
IrelandFinland
SpainUSA
CanadaGreece
EnglandSwitzerland
KoreaItaly
N. IrelandPortugal
PolandNetherlandsCzech Rep.
FranceAustria
GermanyBelgiumHungary
Cou
ntry
.2 .3 .4 .5Dissimilarity Index (D), with 95% CI
Note: high (low) family background defined by whether the parental occupation index value is above (below) the national median. The horizontal lines show 95 percent confidence intervals. For Canada, information about state/private status is only available for 2003, for France only for 2000, and no information is available for Australia.
27

Figure 4 Social segregation in state schools, 27 countries, Hutchens index (H)
ScotlandJapan
New ZealandSwedenNorway
SpainDenmark
FinlandIreland
USACanada
KoreaSwitzerland
N. IrelandGreece
ItalyEngland
FrancePortugal
PolandCzech Rep.
AustriaGermany
NetherlandsBelgiumHungary
Cou
ntry
.05 .1 .15 .2Square root Index (H), with 95% CI
Note: high (low) family background defined by whether the parental occupation index value is above (below) the national median. The horizontal lines show 95 percent confidence intervals. For Canada, information about state/private status is only available for 2003, for France only for 2000, and no information is available for Australia.
28

Figure 5 Hutchens index (H) in state schools and prevalence of parental choice (%),
24 countries
0
.05
.10
.15
.20H
utch
ens
squa
re ro
ot in
dex,
H
0 20 40 60 80 100Prevalence of parent choice, %
Note: high (low) family background defined by whether the parental occupation index value is above (below) the national median. Parental choice is defined as in Table 5.
29

Figure 6
Hutchens index (H) in state schools and prevalence of school choice (%), 26 countries
0
.05
.10
.15
.20
Hut
chen
s sq
uare
root
inde
x, H
0 20 40 60 80 100Prevalence of school choice, %
Note: high (low) family background defined by whether the parental occupation index value is above (below) the national median. School choice is defined as in Table 5.
30

Appendix to ‘Social segregation in secondary schools:
How does England compare with other countries?’ By Stephen P. Jenkins, John Micklewright and Sylke V. Schnepf
Response to PISA in England
Response to PISA in England fell short of the OECD average in both the 2000 and
2003 rounds. Response rates in England were 82 percent for schools and 81 percent
for pupils in 2000 and 78 percent and 77 percent respectively in 2003. This compares
with OECD averages of 92 percent for schools and 90 percent for pupils in 2000 and
95 percent and 90 percent in 2003. The first OECD report on PISA 2003 (OECD,
2004, Learning for tomorrow’s world – first results from PISA 2003, Paris, OECD)
did not include results for the UK because of the extent of non-response in England
and concern over possible biases that could result from this.
The weights provided in the database for England take account of differences
in school response by average level of academic achievement in the school as
measured by GCSE results. The weights also take account of the level of response
among pupils in each school. We apply these weights in our analysis. We have also
investigated the sensitivity of our results to use of weights that in addition allow for
differences in pupil response by GCSE score and other individual characteristics. This
draws on logistic regression analyses of the probability of pupil response in 2000 and
2003 that exploits information about PISA respondents and non-respondents that is
held in the Department for Education and Skills’ National Pupil Database
(Micklewright, J. & Schnepf, S.V., 2006, Response Bias in England in PISA 2000 and
2003, Report prepared for the Department for Education and Skills, forthcoming). Use
of these weights slightly increases our estimates of social segregation in England,
typically moving England up by one place in the rankings of the 27 countries (i.e.
towards the higher segregation countries).
Index of Socio-Economic Status
There are missing values of our index for the child’s social position (i.e no value
coded for either parent) in every country. Over 60 percent of values are missing in
Japan in 2000 and for this reason we use data for 2003 only (when 11 percent of
31

values are missing) for all calculations of social segregation in this country. In the
combined dataset for the 2000 and 2003 PISA rounds, the percentage missing in the
other OECD countries ranges from 1.6 percent in Finland to 10.5 percent in New
Zealand, with an average for all countries of 4.6 percent. Taking England, Scotland
and Northern Ireland together, 5.7 percent of values are missing. We impute values
where they are missing using the results of OLS regression models of highest parental
value of the socio-economic index estimated separately for each country (but
combining the UK countries for this purpose) on the pooled 2000 and 2003 data. The
explanatory variables measure mother’s and father’s education, number of books in
the household, migrant status, language spoken in the household, indices of cultural
possessions and home educational resources in the household, maths test score
(2000), reading test score (2003) and year of interview. R-squared is 0.29 for the UK
(the average value for all countries is 0.34). (Details of the regressions are available
on request.) The thresholds of the national distributions that we use to define high and
low social position are based on the distributions of index values that include the
imputed values. In the case of England, Scotland and Northern Ireland, we impute
using the pooled UK regression but the thresholds are defined separately for each of
the three countries’ distributions of values.
The national distributions of social position values are lumpy. In most
countries five values account for at least a third of all coded values and ten values
account for over a half. The lumpiness in the data means that the median cut-off that
we use in most of our analysis does not separate exactly the distribution into two
halves since the median value is often for an occupation in which there are a
significant number of observations. The same applies to other cut-offs i.e. lower
quartile, upper quartile, 90th percentile. In each case we define high social position as
being above the theshold value and low position as being equal to or below that value.
Segregation curves for England, Scotland and Northern Ireland
Appendix Figure 1 shows segregation curves for England, Scotland and Northern
Ireland. Schools are ranked in each country by their shares of all children of low
social position (pi/P in equations (1) and (2)) and these values are shown on the
horizontal axis. The vertical axis show the shares of each school of all children of
high social position (ri/R). Since the curve for England lies everywhere outside the
32

curve for Scotland, one can conclude that segregation is higher in England than in
Scotland for all indices that are ‘segregation curve consistent’, i.e that satisfy the
axioms listed in Section 2.
Appendix Figure 1 Segregation curves for England, Scotland and Northern Ireland
0.2
.4.6
.81
Cum
ulat
ive
shar
e of
pup
ils in
sch
ools
with
hig
h so
cial
pos
ition
0 .2 .4 .6 .8 1Cumulative share of pupils in schools
with low social position
England ScotlandNorthern Ireland No segregation
Note: high social position is defined as being above the national median of the distribution of social position index values.
Estimates of segregation with different definitions of high and low social position
Appendix Tables 1 and 2 give estimates of D and H with four different thresholds of
the national distributions of the parental occupational index, the lower quartile, the
median, the upper quartile and the 90th percentile. It also gives estimates with social
position measured by whether the mother had completed tertiary education or not.
(Children with missing information on mother’s education are excluded from the
calculations in the final column.) The countries are sorted by the values in the first
column where the median value of parental occupation is used as the threshold. Table
33
1 in Section 3 shows the average of the rankings in each column that is occupied by
England and selected other countries.
The shadings in the tables allow the rankings in each column to be compared
in a simple way. In each column, cells with values in the top third of the distribution
are shaded dark grey, cells with values in the middle third are shaded light grey and
cells with values in the bottom third are unshaded. A country for which the cells have
the same shading in each column is in the same third of the distribution in each case.
For example, the dark grey shading in all five columns for Hungary and Poland for D
shows that these two countries are always in third of the distribution with the highest
values of social segregation. By contrast, the shadings show England to be in the top
third for one measure, the middle third for three measures and the bottom third for one
measure, something true for both D and H. It should be noted that the ‘traffic lights’
summary given by these shadings, which split the distributions into thirds, is a
relatively crude one. In terms of the underlying index values, England is not far from
the middle group in both cases where the relevant cells are dark grey or unshaded. For
example, in the case of the unshaded cell, the index value for England is the highest in
the bottom third.
34

Appendix Table 1 Dissimilarity Index (D) with different family background measures
Median Lower quartile
Upper quartile
90th percentile
Mother’s education
Hungary 0.449 0.418 0.460 0.565 0.471 Belgium 0.403 0.403 0.399 0.447 0.343 Germany 0.400 0.388 0.429 0.470 0.374 Austria 0.389 0.383 0.413 0.497 0.348 Spain 0.378 0.345 0.402 0.491 0.406 England 0.362 0.352 0.359 0.416 0.291 France 0.362 0.381 0.397 0.463 0.304 Poland 0.358 0.380 0.395 0.516 0.423 Czech Republic 0.357 0.374 0.380 0.509 0.427 Switzerland 0.349 0.339 0.385 0.503 0.36 Northern Ireland 0.346 0.339 0.388 0.459 0.318 Greece 0.345 0.367 0.363 0.497 0.308 Italy 0.344 0.360 0.408 0.555 0.381 Portugal 0.344 0.345 0.382 0.522 0.355 Korea 0.333 0.359 0.326 0.401 0.392 Netherlands 0.333 0.338 0.315 0.425 0.310 Australia 0.328 0.352 0.376 0.415 0.313 USA 0.322 0.345 0.363 0.417 0.289 Canada 0.320 0.311 0.335 0.384 0.257 Ireland 0.299 0.307 0.307 0.420 0.260 Finland 0.288 0.279 0.303 0.378 0.351 New Zealand 0.288 0.332 0.315 0.406 0.257 Denmark 0.286 0.313 0.330 0.437 0.272 Japan 0.281 0.349 0.337 0.332 0.298 Sweden 0.277 0.274 0.313 0.390 0.230 Scotland 0.275 0.300 0.323 0.345 0.245 Norway 0.273 0.301 0.300 0.376 0.230
Note: data for Japan refer to 2003 only.
35

Appendix Table 1 Hutchens Index (H) with different family background measures
Median Lower quartile
Upper quartile
90th percentile
Mother’s education
Hungary 0.183 0.168 0.208 0.352 0.197 Belgium 0.142 0.144 0.147 0.221 0.097 Germany 0.129 0.134 0.164 0.254 0.146 England 0.126 0.122 0.116 0.204 0.071 Austria 0.124 0.134 0.163 0.269 0.122 Spain 0.123 0.115 0.140 0.254 0.152 Czech Republic 0.119 0.158 0.146 0.295 0.182 Greece 0.116 0.124 0.140 0.280 0.091 Poland 0.112 0.129 0.132 0.265 0.176 France 0.109 0.123 0.140 0.238 0.082 Portugal 0.106 0.115 0.139 0.311 0.125 Switzerland 0.105 0.106 0.131 0.282 0.129 Italy 0.102 0.124 0.142 0.332 0.141 Northern Ireland 0.097 0.099 0.123 0.225 0.089 Netherlands 0.095 0.100 0.099 0.233 0.087 USA 0.095 0.128 0.137 0.203 0.082 Korea 0.090 0.109 0.090 0.179 0.130 Australia 0.088 0.113 0.131 0.188 0.085 Canada 0.088 0.094 0.105 0.168 0.058 Denmark 0.081 0.104 0.110 0.232 0.072 Ireland 0.078 0.097 0.082 0.221 0.062 Norway 0.072 0.090 0.086 0.168 0.053 Finland 0.070 0.071 0.078 0.151 0.093 New Zealand 0.068 0.101 0.087 0.191 0.054 Scotland 0.068 0.078 0.087 0.142 0.049 Sweden 0.065 0.072 0.091 0.173 0.046 Japan 0.064 0.101 0.095 0.133 0.079
Note: data for Japan refer to 2003 only.
36