Embed Size (px)
Citation preview

1
ENERGY OFFICE
19th Floor, 75 Dr Langalibalele Dube Street, Durban, 4001 P O Box 1014, Durban 4000
Tel: +27 31 311 1139, Fax; +27 31 311 1089 Email: [email protected]
www.durban.gov.za
Socio-Economic Prefeasibility Assessment for the Introduction of Daylight Saving Time by the eThekwini Municipality: Synthesis report
23 June 2014
Final Report

2
Report Prepared by:
Authors:
Myles Mander, James Blignaut, Margaret McKenzie, Michael Van Niekerk and Nicci Diederichs
KWAZULU-NATAL: Fairway Green, 3 Abrey Road, Kloof, DURBAN | PO Box 2221, Everton 3625
Tel: +27 31 764 6449 | Fax: +27 31 764 4907
65/67 Davenport Centre, 89 Helen Joseph Rd, Glenwood, DURBAN
Tel: +27 31 827 6426
WESTERN CAPE : The Southern Right, Streenbras Street, Brenton on Sea, KNYSNA | PO Box 2984, Knysna 6570
Tel: +27 44 381 0712 | Fax: +27 86 569 5554
SOUTH AFRICA
[email protected] | www.futureworks.co.za
3
Table of Contents
Executive Summary ................................................................................................................................. 6
1 Introduction .................................................................................................................................... 8
2 Background ..................................................................................................................................... 8
3 The Review of International Experiences ....................................................................................... 8
Summary of review findings ................................................................................................... 9 3.1
What is Daylight Saving Time? ........................................................................................ 9 3.1.1
What is DST not? ............................................................................................................. 9 3.1.2
Where is DST implemented?......................................................................................... 10 3.1.3
How was DST implemented? ........................................................................................ 11 3.1.4
When is DST implemented? .......................................................................................... 12 3.1.5
Cities versus countries implementing DST ............................................................................ 13 3.2
Why is DST implemented? .................................................................................................... 14 3.3
Energy savings ............................................................................................................... 14 3.3.1
Social benefits ............................................................................................................... 15 3.3.2
What are the potential impacts on electricity consumption? .............................................. 15 3.4
What are the potential economic costs/benefits? ............................................................... 17 3.5
Benefits ......................................................................................................................... 17 3.5.1
Costs .............................................................................................................................. 18 3.5.2
What are the potential social costs/benefits? ...................................................................... 18 3.6
Benefits ......................................................................................................................... 18 3.6.1
Costs .............................................................................................................................. 19 3.6.2
Formalised versus ad-hoc implementation?......................................................................... 20 3.7
What is the legal framework governing DST in South Africa and the eThekwini 3.8
Municipality?..................................................................................................................................... 21
Literature review summary ................................................................................................... 21 3.9
4 What is the Electricity Use Profile for the eThekwini Municipality? ............................................ 22
Electricity Consumption ........................................................................................................ 22 4.1
Electricity Demand ................................................................................................................ 24 4.2
5 What is the Potential to Reduce Electricity Consumption and Demand through implementing
DST in eThekwini? ................................................................................................................................. 24
6 What are the Potential Economic and Social Implications of implementing DST in eThekwini? . 26
7 What are the Public and Private Sector Perceptions regarding the Economic and Social
Implications of implementing DST in the eThekwini Municipality? ..................................................... 30

4
What are the economic implications of implementing DST in the eThekwini Municipality?7.1
31
What are the social implications of implementing DST in the eThekwini Municipality? ..... 33 7.2
What are the ‘other’ implications of implementing DST in the eThekwini Municipality? ... 35 7.3
8 Conclusions ................................................................................................................................... 39
The literature survey results ................................................................................................. 39 8.1
Results of an analysis of the Durban electricity use and daylight context ........................... 40 8.2
Results of an assessment of public and private sector perspectives .................................... 41 8.3
Recommendations ................................................................................................................ 42 8.4
9 Acknowledgements ....................................................................................................................... 42
10 References ................................................................................................................................ 43
Appendix 1: Legislative Framework ...................................................................................................... 46
Appendix 2 – Detailed notes of review ................................................................................................. 47
Appendix 3 – Other Options ................................................................................................................. 57
Table of Figures
Figure 1: Breakdown of total electricity consumption in 2012-2013 ................................................... 23
Figure 2: Comparison of residential electricity consumption in summer and winter (2012-2013) ..... 23
Figure 3: Electricity demand on weekdays and weekends in summer ................................................. 24
Figure 4: Potential shift in electricity demand on weekdays with DST ................................................. 26
Figure 5: Typical weekday for a typical eThekwini resident between October and March ................. 27
Figure 6: Typical weekday for a typical eThekwini resident between October and March with DST .. 28
Figure 7: Typical weekday for a London resident between April and September (note the gap
between commute times and darkness which is not the case for eThekwini). ................................... 29
Figure 8: Economic implications of implementation of the no DST, mandatory DST, and voluntary DST
scenarios (note the blue line lies under the red line for several criteria at the bottom of the graph) 32
Figure 9: Social implications of implementation of the no DST, mandatory DST, and voluntary DST
scenarios ............................................................................................................................................... 34
Figure 10: Other implications of implementation of no DST, mandatory DST, and voluntary DST ...... 36
Figure 11: A comparison of DST scenario scores between the public and private sector workshop
participants ........................................................................................................................................... 37
Figure 12: Impacts on economic criteria .............................................................................................. 57
Figure 13: Impacts on social criteria ..................................................................................................... 58
Figure 14: Impacts on institutional criteria ........................................................................................... 58

5
Figure 15: Comparison of impacts on all criteria .................................................................................. 59
List of Tables
Table 1: List of countries / regions observing DST in 2014 ................................................................... 10
Table 2: DST start and end dates of most countries observing DST in 2014 ........................................ 12
Table 3: Summary of potential energy savings from implementation of DST, DDST or YRDST in
selected countries ................................................................................................................................. 22
Table 4: Case study to illustrate potential reduction in electricity consumption with DST ................. 25
Table 5: Breakdown of a typical workday for an eThekwini resident during summer ......................... 29
Table 6: Breakdown of a typical workday for a London resident during summer ............................... 30
Table 7: Criteria used to evaluate the impact of DST ........................................................................... 30
Table 8: Summary of potential electricity savings from implementation of DST, DDST or YRDST in
selected countries ................................................................................................................................. 39
Glossary
BST British Summer Time CEC California Energy Commission CO2 Carbon Dioxide DDST Double daylight saving time (2 hour shift) DTI Department of Trade and Industry DST Daylight saving time (1 hour shift) EMA eThekwini Municipal Area EO eThekwini Energy Office GMT Greenwich Meridian Time GWh Gigawatt hour MW Megawatt OCGT Open Cycle Gas Turbine SAST South African Standard Time ST Standard time YRDST Year round daylight saving time UK United Kingdom USA United States of America WW1 World War 1 WW2 World War 2

6
Executive Summary
Motivation Daylight Saving Time is frequently raised as means to promote energy savings, and to enhance
lifestyle benefits for Durban residents and tourism. The purpose of this analysis is to test the
feasibility of this idea by determining the magnitude of potential benefits and whether the costs of
implementation would justify these benefits. From an energy perspective – the possible benefits of
Daylight Saving Time (DST) which need to be better understood are (i) net energy demand reduction
and (ii) peak load shifting.
The prefeasibility study included three primary activity areas; (i) an international review of Daylight
Saving Time Experiences, (ii) an analysis of the Durban Context for Implementation of Daylight
Saving Time, and (iii) a targeted consultation process.
The literature survey results
Historically, adoption of DST is generally in response to a crisis, such as WW1, WW2 and the 1970s
energy crisis. The primary motivation for implementation of DST during these periods is generally
energy saving. The literature surveyed indicates that DST usually results in a marginal annual
reduction in electricity consumption of between 0% to 0.8%. The reductions are in many cases so
marginal and the methods of calculation so varied, that one cannot draw clear conclusions from the
available evidence, often generating considerable controversy and opposition. However, the
implications for energy demand at peak periods appear to be more positive, with a more consistent
indication of significant reductions in peak demand of between 0.75% to 4.7%. The published
research has found that electricity savings are dependent on local conditions and existing patterns of
electricity use. The studies also found that savings were generally from the residential sector, with
limited or no savings from the agricultural, commercial or industrial sectors. In addition to electricity
savings, the literature survey indicates that there are other economic and social benefits associated
with the implementation of DST, including increased revenue in the retail, outdoor sport and
tourism. However, there are also a number of economic and social costs associated with the
implementation of DST, such as reduced worker productivity and increased administration costs.
Results of an analysis of the Durban electricity use and daylight context
The potential of DST to reduce electricity consumption is based primarily on savings in residential
lighting use. An analysis of the eThekwini electricity use patterns shows that the implementation of
DST can potentially reduce eThekwini’s total annual electricity consumption by between 0.2% and
0.5%. An analysis of the suitability of DST implementation in eThekwini from a daylight availability
perspective shows that DST can be implemented more effectively in countries or regions in higher or
lower latitudes than eThekwini which have longer daylight hours. In eThekwini there are on average
13 hours 18 minutes of daylight in the summer months. In order to free up an hour more daylight in
the afternoons with the implementation of DST, a portion of the morning activities, namely
commuting to work, will need to start before sunrise as there is not enough daylight to
accommodate the shift. In comparison, in London there are on average 14 hours 45 minutes of
daylight in the summer months with more leeway for shifting daily activities earlier to free up more
time in the afternoons for leisure and / or family time. There is much controversy regarding the net
gains or losses associated with DST implementation in Europe and North America, despite there

7
being several additional daylight hours to be harnessed. In eThekwini however, with little
unharnessed daylight time to be exploited, the net benefits are likely to be more marginal, and the
controversy more acute. It could be argued that DST already exists in eThekwini with many blue
collar workers leaving for work very early in the morning due to lengthy commutes, and with many
white collar workers also leaving early to avoid traffic congestion. While DST may increase health
and family time, there is likely to be an increased cost for businesses operations with longer
operating hours and decreased commuter safety as commuters travel in the dark. Note that an
efficient public transportation system could also deliver similar benefits by reducing commuting
time, costs and emissions.
Results of an assessment of public and private sector perspectives
The perceptions of public and private sector stakeholders were assessed using a multi-criteria
decision support tool. Two DST scenarios were tested, namely voluntary DST (where households
and businesses participate voluntarily) and mandatory DST (where all eThekwini residents are
compelled to participate). Firstly, both the public and private sector agree that a mandatory DST will
generate a net negative impact on social wellbeing and the economy and therefore should not be
pursued further. This prefeasibility study indicates that mandatory DST is not desirable or feasible
from a stakeholder perspective. In terms of voluntary DST, there are mixed signals. The private
sector perceives that this option is already in operation, and that there are few additional gains to be
made by promoting its further implementation. This implies that a voluntary DST should then at
least be maintained as it is acknowledged to be delivering benefits. The public sector on the other
hand suggests that voluntary DST should be encouraged, as they see the potential for more gains to
be made in terms of efficient use of public infrastructure, peak load shifting in energy use, and
possibly electricity savings. This implies that it may be beneficial to promote on-going voluntary DST
to make more effective use of municipal infrastructure. However, the qualification here is that
widespread adoption of DST could take eThekwini into a scenario similar to the mandatory DST
scenario, in which the perceived economic (i.e. public service infrastructure use efficiency) benefits
would be significantly diluted. The prefeasibility study shows that voluntary DST is feasible and
certainly desirable for municipal staff and a significant portion of the private sector, but would be
problematic if widely adopted.
Recommendations
EThekwini Municipality should pursue the promotion of voluntary DST amongst businesses for
whom this makes sense and can be done without creating additional costs or affecting the
competitiveness of these businesses. This is likely to include the public service sector and finance
and business services sector. The retail and manufacturing sectors are more likely to be exposed to
increased costs and business competitiveness costs as a result of adopting DST. A number of
incentive development options could be explored further by the municipality and private sector
partners. Apart from incentives, it would also be important to develop an advocacy programme that
would educate residents on the benefits of voluntary DST.

8
1 Introduction
FutureWorks was appointed on 17 February 2014 by the eThekwini Energy Office (EO) to undertake
a socio-economic pre-feasibility assessment for the implementation of Daylight Saving Time (DST) in
the eThekwini Municipal Area (EMA).
2 Background
The eThekwini Energy Office has indicated that Daylight Saving Time has been raised in a number of
contexts with regards to the potential benefits it may offer for energy savings, lifestyle benefits for
Durban residents and tourism. The purpose of the study is to test this idea to determine whether it
would deliver the potential benefits and whether the costs of implementation would justify these
benefits. From an energy perspective – the possible benefits of Daylight Saving Time which need to
be better understood are net energy demand reduction and peak load shifting.
The project included four primary activity areas:
1. Daylight Saving Time Review of International Experiences
2. Durban Context for Implementation of Daylight Saving Time
3. Targeted Consultation Process
4. Socio-Economic Prefeasibility Assessment Report
3 The Review of International Experiences
The literature review aimed to develop an understanding of the history and context of Daylight
Saving Time internationally. This phase of work, which was undertaken at desktop level using
documented reports, articles and journal papers on the subject, was used to create a common
understanding amongst the project team, client team and selected private sector stakeholders of
Daylight Saving Time, its risks, costs and benefits. It was also used to set the contextual basis for
further exploring the potential for implementation of Daylight Saving Time in Durban.
This review was structured around the following questions:
a) What is Daylight Saving Time (DST)?
b) What is DST not?
c) Where is DST implemented?
d) Why is DST implemented?
e) How was DST implemented?
f) What are the potential impacts on electricity consumption?
g) What are the potential economic costs/benefits of DST?
h) What are the potential social costs/benefits of DST?
In addition to the above, the eThekwini Energy Office also indicated that the review work needed to
identify and assess examples of where cities (rather than countries) have adopted Daylight Saving
Time – as this is the context in which the eThekwini Municipality would consider pursuing its
implementation. Further to this, the review also needed to explore the context for the
implementation of both formalised (defined in relation to Time Zones) and ad-hoc (informal /

9
voluntary operational interventions that shift working hours) daylight saving in a developing city like
Durban.
The documented benefits, impacts and costs of Daylight Saving Time as experienced in other
locations around the world are presented in this section.
Summary of review findings 3.1
What is Daylight Saving Time? 3.1.1
Daylight Saving Time (DST) is typically the practice of moving clocks forward one hour in spring or
the lighter months in order to save an extra hour of daylight at the end of the working day and to
shift clocks back to Standard Time (ST) during the autumn or the darker months1. The aim of DST is
to shift our daily patterns so as to make better use of the available daylight2.
There are typically two additional variations of standard DST. The first is Double Daylight Saving Time
(DDST) where clocks are adjusted by two hours instead of the usual one hour with regular DST3. The
second is Year Round Daylight Saving Time (YRDST), where DST is observed all year round i.e. clocks
are not set back in the winter or the darker months.
It is worth noting that there is a slight difference between Daylight Saving Time and Daylight Savings
Time. The term Daylight Saving Time is technically more correct as it refers to the saving or
optimising of daylight. This is the term more commonly used in the literature and by the European
Union. The term Daylight Savings Time is technically incorrect as daylight cannot be put into savings.
This is the term which is more commonly used in popular media and countries, such as Australia,
Canada, and the United States of America (USA).
In some countries, such as the United Kingdom (UK) and Germany, DST is referred to as ‘summer
time’, and standard time if referred to as ‘winter time’. For example, when DST is being observed in
the UK, the period is referred to as British Summer Time (BST). Similarly, when the UK is observing
standard time, or time without DST, the period is referred to as ‘winter time’.
What is DST not? 3.1.2
In some cases, Daylight Saving Time (DST) is incorrectly used instead of Time Zones and vice versa.
DST and Time Zones are similar in that they both refer to a geographical area where everybody
observes the same time4. However, the two differ is that DST is generally an offset or a change of
the standard time within a particular time zone. For example, South Africa is located within the GMT
+ 2 time zone, which means that standard time is two hours ahead of Greenwich Meridian Time
(GMT). If Durban were to observe DST, one hour would be added to standard time, resulting in
1 Time and Date (2014b) 2 Aries and Newsham (2008) 3 California Energy Commission (2007b) 4 Time and Date (2013b)
In summary, Daylight Saving Time (DST) refers to practice of moving the clock forward by one
hour, typically in spring, and back by one hour, typically in autumn, so that people will have an
additional hour of daylight at the end of the normal working day.

10
Durban effectively being 3 hours ahead of GMT. Thus, while the local time may change due to the
implementation of DST, the time zone remains the same.
Where is DST implemented? 3.1.3
In general, most countries that observe Daylight Saving Time (DST) are located in the mid-latitudes.
This is because it is less practical to implement DST in the extreme northern and southern regions as
sunrise and sunset times are already out of sync with standardised working hours5. For example,
during the summer months, the extra hour of daylight at the end of the working day will add little
value as the sun already goes down very late in the evening. Similarly, in the winter months, the
extra hour of daylight may be inconsequential as the sun may already be down when people finish
work. DST is also of little use at or near the equator as there is very little variation in the length
daylight throughout the year.
Table 1 below lists all the countries that will be observing DST in 2014. It is important to note that
some countries do not observe DST year after year.
Table 1: List of countries / regions observing DST in 2014
Region Country
Europe European Union Rest of Europe (excl. Iceland) Greenland North America Canada USA (excl. Hawaii and Arizona) Central America Bahamas Bermuda Cuba Haiti Mexico (excl. Sonora) St-Pierre and Miquelon Turks and Caicos South America Brazil (excl. northern states) Chile Falkland Islands Paraguay Uruguay Africa Morocco Namibia Australasia Australia (excl. western and northern territories) New Zealand Chatham Island Fiji Samoa Asia Iran Israel Jordan
5 Time and Date (2013a)
In summary, DST is typically a change to the standard time observed within a particular time
zone.

11
Region Country
Lebanon Syria
It is worth noting that South Africa has previously observed DST between 1942 and 1944. South
Africa, like many other countries, implemented DST during World War 2 in order to reduce energy
use, particularly coal.
How was DST implemented? 3.1.4
In 2014, there are approximately 79 countries observing DST. However, very little information is
available on how DST was first implemented in these countries. The only countries where there is
some information readily available on how DST was first implemented is the UK and USA. The
following section therefore provides a brief history of the implementation of DST around the world,
but focuses specifically on the UK and USA.
Germany, Austria and Hungary were the first countries to implement DST at 23h00 on 30 April 1916.
This was primarily to conserve fuel, particularly coal, during World War 1 (WW1)6.
The United Kingdom (UK) was the first country to attempt to implement DST in 1908 with the
introduction of the Daylight Saving Bill. This Bill was based on a proposal by William Willett, a builder
and outdoor enthusiast, to advance clocks forward by one hour in the summer months. This Bill was
however not passed into law, and neither were the Bills which followed up until 1916. While Willett
had several powerful supporters, including Winston Churchill, the Bill was opposed by the Prime
Minister, agricultural organisations and theatre owners. DST was only successfully implemented in
the UK in 1916 following the adoption of DST by Germany and its allies during WW1. In contrast to
many other countries, the UK did not repeal DST following WW1. During the decades which
followed, many adjustments were however made to the transition dates. One such change was in
1968, when the UK piloted the implementation of year round DST for a period of three years. Clocks
were put forward one hour on 1 March 1968 and turned back in October 19717. Year round DST was
however discontinued as the net benefits were not considered adequate.
The United States of America (USA) also attempted unsuccessfully to introduce a DST Bill in 1909.
While the Bill was strongly supported by the retailing and manufacturing sector, it was opposed by
the railroads. DST was only implemented in 1918 when the USA entered WW1. Following the war,
DST was repealed in 1919 due to strong pressure from the agricultural sector. The repeal was
unsuccessfully vetoed by the then President, Woodrow Wilson, on two separate occasions. Despite
the USA repealing DST, a number of cities, such as New York, continued to implement DST locally.
However, this ad-hoc arrangement negatively affected the transportation industry. As a result, the
6 Time and Date (2014c) 7 Aries Newsham (2008)
In summary, most countries in North America and Europe observe DST. In South America, there
are a number of countries that observe DST, but these are generally countries located further
away from the equator. Australasia, New Zealand, parts of Australia and a number of island
states observe DST. In Africa and Asia, very few countries observe DST.

12
Uniform Time Act was introduced in 1966 in order to standardise time zones and DST start and end
dates within the USA8. This was the first non-war time DST legislation to be introduced in the USA.
The Act also required all states to observe DST unless they applied for exemption. Today, only Hawaii
and Arizona do not observe DST. In 1973, the USA introduced the Emergency Daylight Saving Time
Energy Conservation Act of 1973 to implement year round DST for a period of 2 years in response to
the 1970s energy crisis. Following that, the Energy Policy Act of 2005 was introduced to extend DST
by six weeks.
In the rest of North America and Europe, DST was also initially implemented in WW1. However, after
the war, most countries repealed DST. There were some exceptions, such as Canada, France and
Ireland, which continued to implement DST during the following decades. It was only in the 1970s
that there was once again widespread adoption of DST in response to the 1970s energy crisis.
There are a number of countries that have in more recent times piloted the implementation of DST.
One such country is Mexico, which implemented DST in 1996 for a one year trial period. This trial
was supported by two theoretical studies which looked at the potential energy savings resulting
from implementation of DST9.
Cuba first adopted DST in 1939 but abolished it after WW210. It was then reinstated in 1963 and has
been implemented every year since, although the start and end dates have varied.
When is DST implemented? 3.1.5
In the northern hemisphere, DST is generally starts between March and April and ends between
September and November11. In contrast, DST in the southern hemisphere starts between September
and November, and ends between March and April – see Table 2.
Table 2: DST start and end dates of most countries observing DST in 2014
Region Country DST Start Date DST End Date
Europe European Union Sunday, 30 March Sunday, 26 October Rest of Europe (excl.
Iceland)
Greenland (most locations)
Saturday, 29 March Saturday, 25 October
North America Canada Sunday, 9 March Sunday, 2 November USA (excl. Hawaii and
parts of Arizona) Sunday, 9 March Sunday, 2 November
8 Kotchen and Grant (2008) 9 Economic Commission for Latin America and the Caribbean (2009) 10 Economic Commission for Latin America and the Caribbean (2009) 11 Time and Date (2014d)
In summary, DST was generally implemented by most countries in response to a crisis, namely
WW1, WW2 and the 1970s energy crisis. DST is generally enacted through the introduction of
DST legislation. Following the crises, DST was often repealed due to strong opposition from a
number of sectors, particularly agriculture, transport, and night-time entertainment businesses.
In more recent times, there have been a number of countries that have piloted the introduction
of DST for short periods of time.

13
Central America Bahamas Sunday, 9 March Sunday, 2 November Bermuda Sunday, 9 March Sunday, 2 November St-Pierre and Miquelon Sunday, 9 March Sunday, 2 November Turks and Caicos Sunday, 9 March Sunday, 2 November Mexico (most locations) Sunday, 6 April Sunday, 26 October Cuba Sunday, 9 March Sunday, 2 November Haiti Sunday, 9 March Sunday, 2 November South America Brazil (most locations) Sunday, 19 October Sunday, 16 February Chile (most locations) Sunday, 7 September Sunday, 27 April Falkland Islands All year Paraguay Sunday, 5 October Sunday, 23 March Uruguay Sunday, 5 October Sunday, 9 March Africa Morocco Sunday, 30 March Sunday, 26 October Namibia Sunday, 7 September Sunday, 6 April Australasia Australia (most
locations) Sunday, 5 October Sunday, 6 April
New Zealand Sunday, 28 September Sunday, 6 April Chatham Island Fiji Sunday, 26 October Sunday, 19 January Samoa Sunday, 28 September Sunday, 6 April Asia Iran Saturday, 22 March Monday, 22 September Israel Friday, 28 March Friday, 26 September Jordan Friday, 28 March Friday, 31 October Lebanon Sunday, 30 March Sunday, 26 October Syria Friday, 28 March Friday, 31 October
In general, countries start DST between midnight and 04:00 am, with the majority of countries
starting at 02h00. Greenland is generally an exception in that it starts DST at 22h00.
In Namibia, clocks are set back by one hour at 02h00 on Sunday 6 April, and set forward again by
one hour at 02h00 on the Sunday 7 September. Morocco is similar in that clocks are set forward by
one hour at 02h00 on the Sunday 30 March and set back one hour at 03h00 on Sunday 29 June.
Cities versus countries implementing DST 3.2
In general, DST is implemented at the national level. There are however a number of exceptions,
such as Brazil, USA and Australia, where individual states or territories implement DST at the local
level.
With the exception of Hawaii and Arizona, the rest of the states within the USA observe DST. In
1966, the Uniform Time Act was introduced due to strong pressure from the transportation sector to
standardise DST start and end dates12. It is worth noting that in 1919 when the USA repealed DST a
number of cities such as New York continued to observe DST at the local level for various reasons.
For example, New York continued to observe DST as it provided a one hour trading advantage with
London, Chicago and Cleveland.
12 Kotchen and Grant (2008)
In summary, most countries start and end DST on a Sunday. In parts of Asia, some countries start
and end DST on a Friday. The time that DST starts and ends generally varies between midnight
and 04h00, with most countries starting DST at 02h00 and ending at 03h00.

14
Only states in the south, south-east and centre of Brazil observe DST13. The northern states generally
do not observe DST at they are located at or near the equator where there is very little change in the
length of daylight throughout the year. In 2008, a DST schedule was introduced to standardise the
start and end dates of all states observing DST.
In Australia, only territories in the south and south-east observe DST. This includes Australian Capital
Territory, New South Wales, Victoria, Tasmania, South Australia and Lord Howe Island14. With the
exception of Lord Howe Island, which only moves clocks forward by half an hour and Macquarie
Island, which observes year round DST, the start and end dates for territories observing DST is the
same. It is worth noting that there is an ongoing debate in Queensland of whether or not to
implement DST15. While the proposal is strongly supported by the urban centres, namely Brisbane
and the Gold Coast, implementation of DST is strongly opposed by the rural areas, in particular in the
agricultural sector. While there have been a number of referendums and bills to introduce DST in
Queensland in recent years, these have been unsuccessful thus far.
Why is DST implemented? 3.3
Energy savings 3.3.1
In most cases, DST was initially implemented to save energy16. The basic assumption is that people
returning from work will delay the switching on of lights in their home by one hour because of the
additional hour of daylight, resulting in energy savings from reduced lighting use17.
These savings, however small they may be, can be important for countries or territories where
energy supply is under strain18. Thus, any reduction in energy consumption reduces shortfalls in
generation capacity.
Similarly, these savings can result in a reduction in the peak demand, which can also be important
for countries such as South Africa and the UK that use fossil-fuel intensive technologies, for example
Open-Cycle Gas Turbines (OCGT), to manage peak periods. Thus, reducing energy consumption and
peak demand reduces the extent to which standby generation capacity is required to manage peak
periods. For example, in Guatemala DST was introduced in 2006, primarily to manage peak demand
in the system and to reduce the cost of producing power using standby power plants19. Furthermore,
13 AngloInfo (2014) 14 Time and Date (2014b) 15 Worthington A.C. (2005) 16 Kotchen and Grant (2008); Mowani et al. (2009) 17 Aries and Newsham (2008) 18 Hill et al. (2010) 19 Economic Commission for Latin America and the Caribbean (2009)
In summary, most countries observe DST at the national level. The USA, Brazil and Australia are
generally the exception in that individual states or territories can choose whether or not to
implement DST. However, all the states or territories within each country are required by
national legislation to start and end DST on the same days in order to minimise the confusion,
particularly for the transportation sector. There was no evidence found of cities implementing
DST independently.

15
reducing the use of fossil-fuel intensive technologies, such as OCGT, can potentially reduce CO2
emissions associated with energy production.
The implementation of DST can also be a pro-poor initiative. For example, in the UK one of the
motivations for extending DST to Year Round Daylight Saving Time (YRDST) was to reduce fuel
poverty. In this case, households that spend more than 10% of their total income on energy are
considered to be fuel impoverished. Thus, the percentage of household income spent on energy can
potentially be reduced through reduction in energy consumption.
See Section 3.7 for more information on impacts of DST on electricity consumption.
Social benefits 3.3.2
In addition to the above energy savings, there are a number of economic and social motivations for
the implementation of DST20. These include the following:
Proponents of DST argue that people simply appreciate the extra hour of daylight after a typical
9 to 5 working day;
Potential increases in the revenue of outdoor sports and tourism businesses as people have
more time available for outdoor activities;
Potential reduction in depression and suicide rates, as spending time outdoors is known to
improve well-being and reduce depression;
Increased sun exposure with people spending more time outdoors can increase Vitamin D
synthesis; and
Reduction in pedestrian and motor vehicle fatalities.
See Sections 3.8 and 3.9 for more information on the economic costs and benefits of DST and social
costs and benefits of DST respectively.
What are the potential impacts on electricity consumption? 3.4
Despite electricity savings being the main motivation for implementation of DST, current research on
the potential impacts on electricity consumption is limited and contradictory. Several studies have
shown that while there are electricity savings resulting from the implementation of DST, these
savings are in most cases not substantial. Some studies have shown that energy consumption may
even increase with implementation of DST. The studies most commonly referred to in the literature
are presented below. Note however, that the majority of these studies come out of developed
countries, particularly the UK and USA. There are limited if any studies coming out of developing
countries, particularly in Africa.
One of the first studies which attempted to measure the potential impacts of DST on electricity
consumption was undertaken in the UK in 197021. This study measured changes in energy
consumption with the implementation of Year Round DST. It was found that while DST reduced
evening consumption by 3%, morning consumption increased by 2.5%, resulting in a net 0.5% energy
saving.
20 Aries and Newsham (2008) 21 Her Majesty’s Stationery Office (1970)

16
A similar study was undertaken in the USA in 1974 using electricity usage data collected between
1963 and 1972. The study found that implementation of Year Round DST would result in an overall
0.6% reduction in electricity use. The study also found that peak loads also decreased by 0.75% (in
winter months), with the daily winter peak shifting from early in the evening to later in the evening
or to the morning22.
In Berlin, a comparison of electricity use between 1979 (without DST) and 1980 (with DST) was
undertaken. The study found that while electricity use for lighting in residential buildings decreased
by 3.9%, energy use for heating increased by 1.2%, resulting in a net electricity usage decrease of
1.8%23.
In support of piloting the implementation of DST in Mexico, the electricity use in 12 cities, 560
residential homes, 28 commercial buildings and 14 industrial plants was monitored24. The electricity
usage in 1995 (without DST) was then compared to electricity use in 1996 (with DST). The study
found that overall energy use decreased by 0.83%, and that annual maximum demand also
decreased by 2.6%. The study noted that savings were exclusively from residential homes and that
no changes in use were detected in commercial and industrial uses. In another study, it was
estimated that the implementation of DST in Mexico would result in 1,100 GWh of electricity savings
and an 850 MW reduction in demand25.
In Brazil, it is estimated that the implementation of DST in the south, southeast and central states
decreases electricity demand by 2,700 MW or 4.6% during peak hours26.
In Guatemala, a study on the load curve and consumption curve of the national distribution system
between May and September revealed that DST helped to bring down peak demand by on average
41 MW. This resulted in an energy saving of 28.8 GWh during this period. It was also found that
while peak demand started an hour later, it still subsided at the usual time. The savings were largely
as a result of not having to draw on additional power plants to meet peak demand.
There are, however, also a number of studies which showed that implementation of DST resulted in
an increase in electricity consumption.
Rock (1997) developed a simulation model to estimate the energy use of a typical single-family
house in 224 locations in the USA. The study found that with DST, electricity consumption would
increase by 0.24% and gas consumption by 0.05%.
A study undertaken of residential households in Indiana using billing data for a period of 3 years
found that DST increased overall electricity consumption by an average of 1%27. This is due to
decreased demand for lighting but increased demand for heating or cooling. The study estimated
that the increased electricity use costs Indiana households $9 million per annum.
22 Ebersole et al. (1974) 23 Bouillon (1983) 24 Ramos et al. (1998) 25 Economic Commission for Latin America and the Caribbean (2009) 26 Flueckiger L. (2014) 27 Kotchen and Grant (2008)

17
The California Energy Commission (CEC) used a regression model to look at the effect of DST on
overall electricity consumption in California28. The study found that there was no change in total
electricity consumption and summer peak demand with DST. However, peak demand was found to
decrease by 5% in the cooler months. The CEC also used the model to look at the effect of extending
DST by 3 weeks29. The study found that the extension of DST had little or no effect on energy
consumption (0.2% decrease). The findings of the study were that DST did not result in energy
savings as people used less light and heat in evenings, but that these savings may have been offset
by increased electricity use in morning. The study also noted that DST had no effect on the energy
consumption of the agricultural sector or most industrial processes.
In Australia, a study was undertaken to compare electricity consumption in South Australia, which
maintained standard time, and Victoria, which implemented DST two months early30. The study
found that DST reduced evening demand, but that these reductions were cancelled out by an
increase in morning demand.
What are the potential economic costs/benefits? 3.5
There are a number of potential economic costs and benefits resulting from the implementation of
DST. These are detailed below:
Benefits 3.5.1
One of the economic benefits resulting from the implementation of DST is increased revenue in the
retail sector as people have more time after a normal work day to go shopping. Similarly, outdoor
sports and tourism businesses also benefit as people have more time for outdoor activities. For
example, the Hokkaido Chamber of Commerce estimated that the implementation of DST would
generate an extra 100 billion yen through increased spending, particularly in the retail, outdoor
28 California Energy Commission (2007b) 29 California Energy Commission (2007a) 30 Kellogg and Wolff (2007)
In summary, there are a limited number of studies looking at the potential impacts of DST on
electricity consumption. Many of the studies that have been undertaken are contradictory and
now outdated. This is an important consideration given that human behaviour and electricity
usage patterns change over time. The majority of studies found that DST resulted in electricity
consumption reductions, but that these reductions were not significant. Several of these studies
also found that DST resulted in a reduction or shift in peak demand, particularly in the case of
Brazil. There were also a few studies that found that DST may result in an increase in electricity
consumption. These studies noted that while DST reduced electricity consumption in the
evening, these savings were offset by increased consumption in the mornings. Thus, the extent
to which DST reduces electricity consumption is dependent on local conditions (e.g. extremely
cold mornings or hot afternoons) and how people change their patterns of electricity use.
Several of the studies also noted that electricity consumption reduction were exclusively from
the residential sector, with little or no reduction in the agricultural, commercial and industrial
sectors.

18
sports and tourism sectors31. Similarly, it is estimated that an extra hour of daylight in Northern
Ireland could increase tourism revenue by as much as £6.34 million a year32.
A survey of businesses in Queensland found that DST was generally supported due to expectations
of increased sales and profits33. The study also found that businesses, particularly those based in
Brisbane and the Gold Coast, supported DST as it would allow them to align their working hours with
trading partners in neighbouring Victoria, which may result in a reduction in their administration and
paperwork costs.
Costs 3.5.2
While DST may benefit outdoor sports and tourism businesses, night-time entertainment businesses,
such as prime-time broadcasting and theatres, may be negatively affected as people would have less
time in the evenings for these activities. The agricultural sector is often strongly opposed to DST for
various reasons. For example, grain farmers prefer to harvest later in the day when the grain has
been sun dried. The implementation of DST may mean that the grain is harvested when it is still
damp. However, in some countries resistance from the agricultural sector has diminished over time
as farmers have adjusted their practices to work with rather than against DST. The transportation
sector is also generally opposed to DST as it may increase administration costs, e.g. from changing
schedules, and cause confusion for passengers.
Furthermore, there is an economic cost associated with turning back clocks, e.g. computer
applications, resetting equipment etc. DST, particularly around the transition, is also known to result
in the disruption of meetings, travel arrangements, broadcasts, billing systems and record
management.
What are the potential social costs/benefits? 3.6
There are a number of potential social costs and benefits resulting from the implementation of DST.
These are detailed below.
Benefits 3.6.1
Proponents of DST argue that people simply appreciate the extra hour of daylight after a typical 9 to
5 working day. It is also thought that DST reduces depression and suicide rates, as spending time
outdoors is known to improve well-being and reduce depression. Furthermore, the increased sun
exposure increases Vitamin D synthesis in skin which is important for health.
31 The Japan Times (2004) 32 Time and Date (2014b) 33 Worthington (2005)
In summary, DST is often supported within urban areas and by professionals, retailers, outdoor
sports enthusiasts and tourism businesses. DST is often opposed within rural areas and by
farmers, transportation companies and night-time entertainment businesses. There are
economic benefits associated with the implementation of DST, but these need to weighed-up
against the costs, particularly around the transition into and out of DST.

19
A study undertaken in Sweden found that there was a decrease in the number of recorded heart
attacks in the two days following the autumn transition when clocks are turned back by one hour34.
There are also a number of studies that have shown that DST can result in a reduction in traffic
fatalities. For example, a study in the USA found that there was a reduction in pedestrian fatalities
by 171 per annum (13% of total pedestrian fatalities)35. This was largely because there was greater
pedestrian activity in the evening compared to the morning, and as a result the extra hour of
daylight improved the safety of a greater number of pedestrians. The study also found that there
was a reduction in motor vehicle occupant fatalities by 195 per annum (3% of total motor vehicle
fatalities). In a similar study in the USA it was found that DST may result in an increase in morning
crashes, but that the reduction in evening crashes is more significant as there are typically more cars
on the road in the evening36. The study also found that if Year Round DST had been retained
between 1987 and 1991 there may have been 901 fewer crashes (727 involving pedestrians and 174
involving vehicles).
Costs 3.6.2
Opponents of DST argue that DST can disrupt sleep patterns, resulting in reduced worker
productivity. Recent studies in the USA have shown that during the first week following the
transition, the effects on daytime function can be quite significant37. The study noted that prior
habitual sleep duration is important and that short sleepers tend to be more affected by DST
transitions.
A study in the USA found that DST resulted in an increase in evening traffic due to increased leisure
travelling38. As a result, fuel consumption increased (estimated 22,000 tons oil in 1989). The study
also found that DST increases the amount of Volatile Organic Compounds (0.45%), NOx (0.29%), and
photochemical pollutants (6.7%) in the air due to increased fuel consumption and the time of day in
which these are released.
A study undertaken in Sweden found that there was an increase in the recorded number of heart
attacks in the three days following the spring transition when clocks are turned forward by one
hour39. The study noted that people that were already vulnerable were more likely to be negatively
affected by the spring transition. A similar study found that suicide rates also increased during this
period.
In Guatemala, DST was suspended because commuters living outside the city already had to wake up
very early to avoid traffic and there were fears that DST would make this situation worse40. Similarly,
attempts to reinstate DST in 2009 failed as there were concerns over the safety of commuters as the
majority of crimes take place early in the morning.
34 Taylor and Hammer (2008) 35 Coate D. and Markowitz S. (2004) 36 Ferguson et al. (1995) 37 Harrison (2013) 38 Hecq et al. (1993) 39 Taylor and Hammer (2008) 40 Economic Commission for Latin America and the Caribbean (2009)

20
Furthermore, DST is thought to affect the timing of medical devices embedded within patients, to
increase the risk of skin cancer due to the increased exposure to sunlight and to confuse travellers
with the changing of transport schedules.
Formalised versus ad-hoc implementation? 3.7
In general, most countries and states have formerly implemented DST through legislation. There are
very few examples of ad-hoc implementation of DST. Queensland in Australia and Hokkaido in Japan
are two examples of where DST has been voluntarily implemented.
In south-east Queensland, Australia, there was strong support for the adoption of DST to align
business working hours with neighbouring Victoria, which observes DST (80% of businesses surveyed
supported DST)41. However, central and northern Queensland opposed DST. After a number of
unsuccessful referendums and attempts to introduce DST legislation, the Gold Coast City Council and
Gold Coast City Combined Chamber of Commerce suggested that businesses in south-east
Queensland voluntarily change the starting time of their working day from 9am to 8am. In support of
the initiative, the City Council introduced flexi-time for its staff. However, in order to implement the
change, certain changes to regulations had to be made, e.g. liquor licences to allow businesses to
operate earlier. While some businesses are implementing the voluntary DST or flexi-time, the
benefits have not been fully realised as not all the businesses in Brisbane and Gold Coast participate
in the initiative.
In 2003, the Hokkaido Chamber of Commerce introduced a voluntary daylight saving experiment in
Hokkaido, Japan42. In the first year, 220 companies and 6,000 workers participated in the
experiment. The number of participants has however continued to grow each year. The benefits
included a boost to the local economy and tourism, decline in traffic accidents and crime, as well as
increase in outdoor leisure and entertainment. The disadvantages included some employees having
to work longer hours (as not all companies and employees observed the experiment), time gaps
between Hokkaido and the rest of Japan, communication issues and perceived health problems. It
was also noted that the real benefits would only be realised if all businesses participated in the
experiment.
41 Gold Coast Business News (2007) 42 The Japan Times (2004)
In summary, the implementation of DST may result in a decrease depression and suicide rates, as
well as traffic fatalities. However, DST may also result in a disruption of sleep patterns and
worker productivity and an increase the number of heart attacks. In general, people are more
negatively affected by DST around the spring transition, particularly those that are predisposed
to these conditions. DST can also negatively affect commuters, particularly those that have to
travel great distances to their place of work or people that have to travel through unsafe areas.

21
What is the legal framework governing DST in South Africa and the 3.8
eThekwini Municipality?
From a review of the available literature and informal discussions with the Department of Trade and
Industry, Eskom and City of Cape Town, there does not appear to be an existing legal framework for
implementation of Daylight Saving Time (DST) in South Africa and the eThekwini Municipality.
At the national level, South Africa observes South African Standard Time (SAST), which is legislated in
terms of the Measurement Units and Measurement Standards Act (18 of 2006). This Act is governed
by the National Department of Trade and Industry (DTI). If South Africa were to implement DST, it is
highly likely that this would need to be through legislation as this is how DST has been implemented
in most other countries, such as the United Kingdom (UK). It is also highly likely that implementation
of DST would fall within the mandate of the DTI.
Similarly, there does not appear to be any existing legislation governing the implementation of DST
at the local level. Local Municipalities are however empowered in terms of the Constitution (Act 108
of 1996), the Municipal Systems Act (Act 32 of 2000), and Municipal Structures Act (Act 117 of 2008),
to govern their own affairs – see Appendix 1.
Literature review summary 3.9
Widespread adoption of DST is generally in response to a crisis, such as WW1, WW2 and the 1970s
energy crisis. The primary motivation for implementation of DST during these periods was energy
saving.
The existing literature indicates that DST generally results in a marginal annual reduction in
electricity consumption and a slightly greater reduction in peak demand. The extent of the reported
reductions in consumption vary considerably – see Table 3. The reductions are in many cases so
marginal and the methods of calculation so varied that one cannot draw clear conclusions from the
available evidence. However, the implications for energy demand at peak periods appear to be
more positive, with a more consistent indication of significant reductions in peak demand.
In summary, ad-hoc or voluntary DST is an option for a city where DST cannot be formally
implemented due to lack of support at the regional or national level. Successful implementation
is however dependent on the uptake within the city or region, and the impact on trade relations
with areas not observing DST.
In summary, there is not a legal framework in place for implementing DST in the eThekwini
Municipality. However, the Municipal Systems Act empowers municipalities to develop by-laws
to govern their own affairs, and implementing DST could be perceived as a necessary local
government action.

22
Table 3: Summary of potential energy savings from implementation of DST, DDST or YRDST in selected countries
Country / Region
DST, DDST or YRDST
Reduction in energy
consumption
Reduction in Energy Demand
Time period of impact
Brazil DST 4.6% (2,700MW) During peak periods in summer months.
California DST 0% On an annual basis. 5% During cooler months DDST 0.2% During summer months. YRDST 0.5% 3% During winter months. Guatemala DST 28.8 GWh 41MW During months observing DST. Mexico DST 0.83% 2.6% On an annual basis. 1,100 GWh 850MW On an annual basis. UK YRDST 0.5% On an annual basis. 0.32% On an annual basis. 4% During winter months. USA DST 0.5% On an annual basis. YRDST 0.6% On an annual basis. 0.75% During winter months.
In addition to energy savings, there are other economic and social benefits associated with the
implementation of DST. This includes increased revenue in the retail and outdoor sport and tourism
sectors and a reduction in depression, suicides rates and traffic fatalities.
However, there are also a number of economic and social costs associated with the implementation
of DST. These include the disruption of sleep patterns, reduced worker productivity, increase in
heart attacks and increased administration costs e.g. changing transport schedules. Most of these
costs are associated with the transition, when clocks are set forward or backward by one hour. Many
of the studies noted that DST typically had a greater effect on people that were already susceptible
to these effects or costs.
Despite the ongoing debate around the costs and benefits of DST, a limited number of studies have
been undertaken, particularly on how DST affects energy use. In most cases, these studies are
outdated as patterns of energy use are likely to have changed. The existing studies have found that
in general DST can result in energy savings, but this is dependent on local conditions and existing
patterns of energy use. The studies also found that savings were generally in the residential sector,
with limited or no savings in the agricultural, commercial or industrial sectors. Detailed studies are
therefore required at the local level to determine the extent to which DST could result in energy
savings, and whether or not the potential benefits outweigh the costs.
4 What is the Electricity Use Profile for the eThekwini Municipality?
Electricity Consumption 4.1
This section presents the electricity use profile for the eThekwini Municipality based on the
electricity consumption data collected by the eThekwini Energy Office (EO) between July 2012 and
June 2013. Note that for contextual purposes, this data was compared to electricity consumption
data collected for the 2011-2012 and 2010-2011 financial years, and found to be very similar.
23
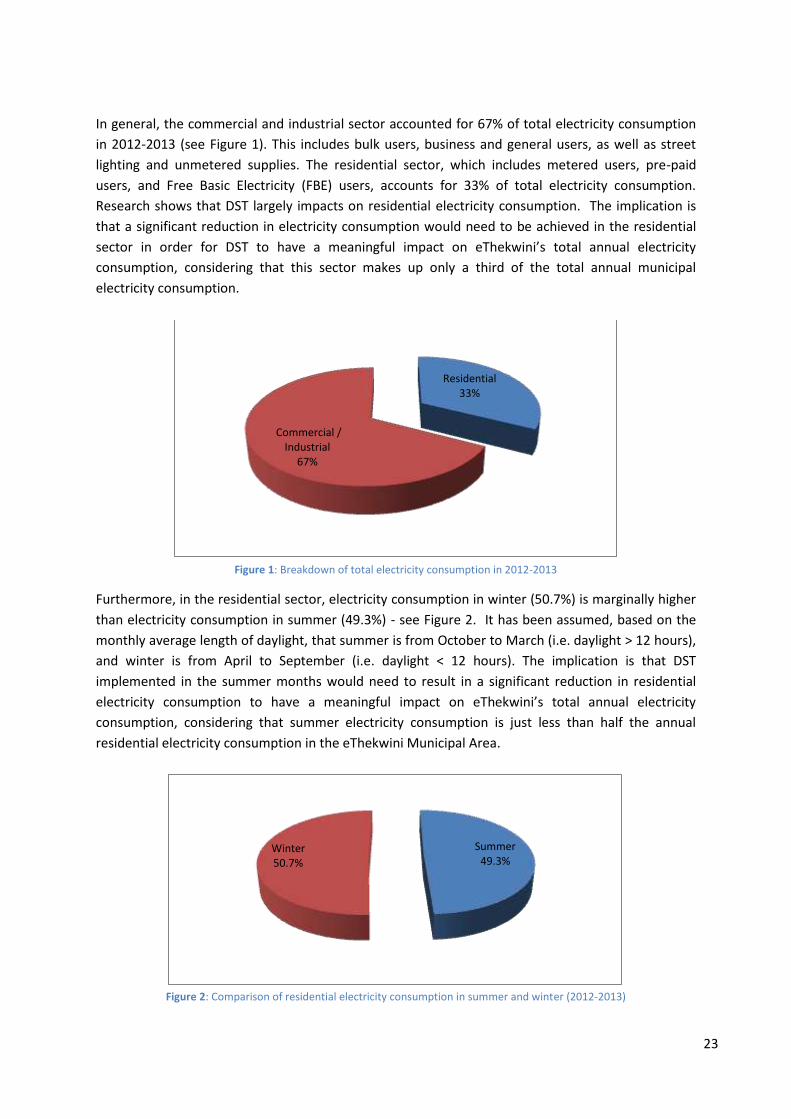
In general, the commercial and industrial sector accounted for 67% of total electricity consumption
in 2012-2013 (see Figure 1). This includes bulk users, business and general users, as well as street
lighting and unmetered supplies. The residential sector, which includes metered users, pre-paid
users, and Free Basic Electricity (FBE) users, accounts for 33% of total electricity consumption.
Research shows that DST largely impacts on residential electricity consumption. The implication is
that a significant reduction in electricity consumption would need to be achieved in the residential
sector in order for DST to have a meaningful impact on eThekwini’s total annual electricity
consumption, considering that this sector makes up only a third of the total annual municipal
electricity consumption.
Figure 1: Breakdown of total electricity consumption in 2012-2013
Furthermore, in the residential sector, electricity consumption in winter (50.7%) is marginally higher
than electricity consumption in summer (49.3%) - see Figure 2. It has been assumed, based on the
monthly average length of daylight, that summer is from October to March (i.e. daylight > 12 hours),
and winter is from April to September (i.e. daylight < 12 hours). The implication is that DST
implemented in the summer months would need to result in a significant reduction in residential
electricity consumption to have a meaningful impact on eThekwini’s total annual electricity
consumption, considering that summer electricity consumption is just less than half the annual
residential electricity consumption in the eThekwini Municipal Area.
Figure 2: Comparison of residential electricity consumption in summer and winter (2012-2013)
Residential 33%
Commercial / Industrial
67%
Summer 49.3%
Winter 50.7%

24
Electricity Demand 4.2
The following section presents the average electricity demand in the eThekwini Municipal Area on a
weekday and weekend during summer. As shown in Figure 3 below, electricity demand is generally
greater on weekdays than on weekends. Note that on weekdays, the morning peak generally starts
at 04h00, whereas on weekends the morning peak generally starts at 06h30. Also, note that while
demand remains relatively constant on weekdays between 09h30 and 19h30 there is a significant
decrease in demand on weekends at around 16h00. The evening peak demand on weekends is also
significantly lower than on weekdays (approximately 13% lower). If the assumption is that electricity
demand is lower on weekends than on weekdays as eThekwini residents are spending more time
outdoors and engaged in sporting / leisure activities, then DST can potentially result in a reduction in
electricity demand if people behaved more like they do on weekends (i.e. spending time outdoors)
during the week.
Figure 3: Electricity demand on weekdays and weekends in summer
Note that the electricity demand of the residential sector cannot be separated from the electricity
demand of the commercial / industrial sector due to the way in which the data is collected and the
interconnectedness of the network.
5 What is the Potential to Reduce Electricity Consumption and
Demand through implementing DST in eThekwini?
To illustrate the extent to which the implementation of DST could potentially reduce electricity
consumption, a case study was developed using a very simple methodology developed by Aries and
Newsham (2008). This methodology is based on the premise that the potential of DST to reduce
electricity consumption is based primarily on savings in residential lighting use. The assumption is
that people will delay switching on electric lighting in their home by one hour if they have one hour
more of daylight in the afternoon or early evening. Assuming that the time between when people
800
900
1000
1100
1200
1300
1400
1500
1600
MW
h
Time
Summer (Weekday) Summer (Weekend)
Night time Night time Day time

25
finish work and go to bed does not change, the period of time that lights are on will therefore be one
hour less with DST. Thus, the reduction in electricity consumption with the implementation of DST is
the result of each household reducing their lighting use by one hour a day during the summer
months.
If we apply this same methodology to eThekwini, the implementation of DST can potentially reduce
eThekwini’s total annual electricity consumption by between 0.2% and 0.5%. As shown in Table 4,
the total electricity consumption of the residential sector between October and March (summer
months) is 1,726,542,414 kWh (16.1% of eThekwini’s total annual electricity consumption). Of that,
between 103,593,745 kWh (low estimate) and 293,515,610 kWh (high estimate) can be attributed to
lighting use. If we assume that on average lights are used for 5 hours and 45 minutes each day
during the summer months, a one hour reduction in lighting use will result in electricity savings of
between 18,016,303 kWh (low estimate) and 51,046,193 kWh (high estimate) or between 0.2% and
0.5% of eThekwini’s total annual electricity consumption. These estimates are similar to other
countries’ experiences. Note that Sean Worthmann of the KZN Energy Forum indicates that current
evidence suggests the lower estimate to be more realistic.
Note, however, that this example does not consider the effect that DST will have on electricity
consumption in the mornings with residents waking up earlier than before (e.g. increased lighting
and potentially heating) and in the afternoons with residents getting home earlier than before (e.g.
increased cooling).
Table 4: Case study to illustrate potential reduction in electricity consumption with DST
Description Value
% of eThekwini’s total annual
electricity consumption
Total electricity consumption of residential sector during summer months (Oct – Mar)
1 726 562 414 kWh 16.1%
% of above total electricity consumption used for lighting (low estimate 6%)
103 593 745 kWh 1.0%
% of above total electricity consumption used for lighting (high estimate 17%)
293 515 610 kWh 2.7%
Average dark hours in summer months (i.e. from 18:29 to 05:19) 10:45 h
Average dark hours when little or no lights are being used (i.e. from 23:00 to 04:00)
05:00 h
Average dark hours when lights are being used (i.e. from 04:00 to sunrise at 05:19 and sunset at 18:29 to 23:00)
05:45 h
Potential electricity savings from 1 hour less lighting use (low estimate 6%)
18 016 303 kWh 0.2%
Potential electricity savings from 1 hour less lighting use (high estimate 17%)
51 046 193 kWh 0.5%
Figure 4 shows the potential shift in electricity demand on weekdays from October to March (i.e.
during summer) that may result from the implementation of DST. Note that with DST, the morning
peak will start earlier (at 03h00 instead of 04h00) and peak at 08h00 instead of 09h00. Between
09h00 and 18h00, there is very little difference in demand with and without DST. With DST the
evening peak demand begins to drop off at 18h00 instead of at 19h00 without DST.

26
Figure 4: Potential shift in electricity demand on weekdays with DST
This could potentially benefit Eskom as the morning peak period has been extended by an additional
hour, helping to free up some additional capacity in the mornings between 04h00 and 08h00.
Similarly, the evening peak period dropping off an hour earlier would also free up some additional
capacity in the evenings from 18h00 onwards. Given that the eThekwini Municipality purchases
more than 5% of the electricity that Eskom produces43, these shifts could be important from a
national energy security perspective.
6 What are the Potential Economic and Social Implications of
implementing DST in eThekwini?
To better illustrate the potential social implications of DST in eThekwini, Figure 5 was developed to
represent a typical weekday for an average eThekwini resident between October and March (i.e.
summer). It should be noted that there is a marked difference in commuting times between white
and blue collar workers. Blue collar workers generally have long daily commuting times given the
large distances between their residential areas and work places, and the need for multiple transport
modes (walking and vehicles or trains). White collar workers generally have shorter commutes with
independent transport and one mode of transport utilised.
Many eThekwini residents wake up at around 04h00 as there is a marked increase in electricity
demand at this time (see Figure 4). Based on Metro Train and Durban Transport bus timetables, and
Community Residential Unit (hostel) electricity use trends, it is assumed that large numbers of
people start their commute to work at around 05h3044. Importantly, as sunrise is on average at
43 eThekwini Electricity (2012) 44 There is a marked increase in the number of trains and busses between 04h30 and 06h30, indicating that this is the time that most eThekwini residents start their commute to work.
800
900
1000
1100
1200
1300
1400
1500
1600
MW
h
Time
Without DST With DST
Night time Night time Day time

27
05:19 in summer45, most people will commute in daylight, reducing their risk of traffic accidents and
crime.
Again, based on public transport timetables it is assumed that most people finish work at 16h30 and
start their commute back home. As sunset is on average at 18h29 in summer, most people will travel
home while it is still light, thereby reducing their risk of traffic accidents and crime.
Figure 5: Typical weekday for a typical eThekwini resident between October and March
Figure 6 presents the changes that the implementation of DST will have on the daily schedule of a
typical blue collar worker. With DST, blue collar workers will generally wake at 03h00 instead of
04h00 and then begin to commute to work at 04h30 instead of 05h30. Importantly, as it is still dark
at this time, commuters are at greater risk of being involved in traffic accidents and / or a victim of
crime.
Assuming most blue collar workers finish work at 16h00 and take two hours to commute home,
there will be a daylight saving of half an hour which can potentially be used for leisure activities
family time.
45 Time and Date (2014e)
00
:00
01
:00
02
:00
03
:00
04
:00
05
:00
06
:00
07
:00
08
:00
09
:00
10
:00
11
:00
12
:00
13
:00
14
:00
15
:00
16
:00
17
:00
18
:00
19
:00
20
:00
21
:00
22
:00
23
:00
Night time Night time
Commute to work
Typical work day
Commute home
Sunrise 05:19 Sunset 18:29
Average length of daylight 13 hr 18 m

28
Figure 6: Typical weekday for a typical eThekwini resident between October and March with DST
The question is then why do most ‘Western’ countries still observe DST when the social costs are
relatively high and the benefits relatively limited? The main reason that implementation of DST is
more conducive in countries with high latitudes, is that they have longer summer daylight hours. As
shown in Figure 7, sunrise in London in summer is on average at 04h4546 which is much earlier than
sunrise in eThekwini (05h19) in summer. As a result, most London residents commute to work when
it is light even with DST. London residents therefore do not experience the same levels of risk of
traffic accidents and crime as eThekwini residents, as they generally do not commute in the dark.
Similarly, sunset in London in summer is on average at 19h27 which is much later than sunset in
eThekwini (18h29) in summer. As a result, most London residents benefit from greater daylight
saving (1 hour) than a typical eThekwini resident may (half an hour).
46 Time and Date (2014b)
00
:00
01
:00
02
:00
03
:00
04
:00
05
:00
06
:00
07
:00
08
:00
09
:00
10
:00
11
:00
12
:00
13
:00
14
:00
15
:00
16
:00
17
:00
18
:00
19
:00
20
:00
21
:00
22
:00
23
:00
Night time Night time Commute to work Typical work day Commute from work
Sunrise 05:19 Sunset 18:29
Daylight saving
+/- 0.5 hr
Period in which
residents now
commute in the dark

29
Figure 7: Typical weekday for a London resident between April and September (note the gap between commute times
and darkness which is not the case for eThekwini).
DST can therefore be implemented more effectively in countries or regions with longer daylight
hours. For example, in eThekwini there are on average 13 hours 18 minutes of daylight in the
summer months – see Table 5. If we subtract from that four hours for commuting to and from work,
and nine hours for a typical working day (i.e. total 13 hours), there is approximately 18 minutes of
daylight which can be used for sporting / leisure activities and / or family time. In order to free up an
hour more daylight in the afternoons with the implementation of DST, a portion of the morning
activities, namely commuting to work, would need to start before sunrise as there is not enough
daylight to accommodate the shift.
Table 5: Breakdown of a typical workday for an eThekwini resident during summer
Daylight hours (13 hours 18 minutes)
Commuting (4 hours) Work (9 hours)
Free
tim
e
(18
min
)
In comparison, in London there are on average 14 hours 45 minutes of daylight in the summer
months – see Table 6. If we subtract from that four hours for commuting to and from work and nine
hours for a typical working day (i.e. total 13 hours), there is approximately 1 hour 45 minutes of
daylight which can be used for sporting / leisure activities and / or family time. Thus, there is more
leeway in London than in eThekwini for shifting daily activities earlier to free up more time in the
afternoons for sporting / leisure activities and / or family time.
00
:00
01
:00
02
:00
03
:00
04
:00
05
:00
06
:00
07
:00
08
:00
09
:00
10
:00
11
:00
12
:00
13
:00
14
:00
15
:00
16
:00
17
:00
18
:00
19
:00
20
:00
21
:00
22
:00
23
:00
Night time Night time Commute to work
Typical work day Commute home
Daylight saving
+/- 1hr
Sunrise 04:45 Sunset 19:27
Average length of daylight 14 hr 42 m

30
Table 6: Breakdown of a typical workday for a London resident during summer
Daylight hours (14 hours 45 minutes)
Commuting (4 hours) Work (9 hours) Free time
(1 hour 45 min)
7 What are the Public and Private Sector Perceptions regarding the
Economic and Social Implications of implementing DST in the
eThekwini Municipality?
In order to systematically analyse the perceived economic and social implications, as well as any
‘other’ implications of implementing DST in eThekwini, a set of criteria (see Table 7) was developed
by the project team.
Table 7: Criteria used to evaluate the impact of DST
This set of criteria was used in two workshops and in an interview to assess the potential economic,
social, and ‘other’ benefits and costs of implementing DST. One workshop was held with municipal
staff and one with the Durban Chamber of Commerce and Industry economic affairs group. An
additional interview was held with the vice-chair of the KwaZulu-Natal Sustainable Energy Forum.
Each of the criteria was scored by the workshop participants using a score that ranged from:
-2 (high negative impact),
1 (low negative impact),
0 (neutral impact),
+1 (low positive impact),
+3 (high positive impact)
As part of the analysis, the following three scenarios were developed and scored using the above
criteria:
1. No DST – DST is not implemented and the current situation persists.
Economic criteria
Employment impact
Growth of eThekwini's
Formal Economy
Contribute to greening of eThekwini's
Economy
Attractive destination
for professionals
/ business people to live
Potential to attract private
investment
Potential to attract public
investment
Business connectivity
Impact on informal
trade
Social Criteria
Commuter safety Traffic congestion/ change in travel time
Health / Change in quality of life
Social / user acceptability
Family time
Other Criteria
Historic track record - past DST success
Regulatory barriers
Implementing capacity (by local government)
Maturity of the concept in SA
Climate change adaptation
Cost to businesses to implement
Impact on SA peak load
Acceptance by SA
Support municipal service delivery

31
2. Mandatory DST –DST is legislated as a by-law by the eThekwini Municipality and all households
and companies / industries within the eThekwini Municipal Area are required to observe DST.
3. Voluntary DST – Companies / industries within the eThekwini Municipal Area voluntarily observe
DST.
Prior to the scoring process, a presentation was provided outlining the results of the literature
review, the eThekwini electricity consumption and local sunlight/sunset and commuting patterns –
as discussed in detail in the previous sections. This was done so as to inform the scoring process by
participants.
In the Durban Chamber of Commerce workshop, a fourth scenario was discussed. The workshop
proposed the changing of KZN province to a new Time Zone – GMT plus 3 hours. This was suggested
as an alternative to eThekwini embarking on DST alone and out of step with its immediate
neighbours. While this alternative was discussed, the results were not included in this report as the
scenario was not about daylight saving but rather a time zone change. As the other workshop and
interview did not engage with this scenario, the scoring of this additional scenario therefore could
not be amalgamated with the other results. The outcomes of the time zone change discussion are
contained in Appendix 3.
What are the economic implications of implementing DST in the 7.1
eThekwini Municipality?
Figure 8 presents a summary of the perceptions of the workshop participants regarding the possible
economic implications that may result from the implementation of the three DST scenarios.
As can be expected, there are little or no economic implications associated with the ‘no DST’
scenario.
The public sector perceptions:
In terms of the mandatory DST scenario, the public sector perceived that there was likely to be no
positive impact on employment, the growth of eThekwini’s formal economy or business
connectivity. However, it may support the growth of eThekwini’s green economy, eThekwini’s
attractiveness as a destination for professionals / business people to live due to more leisure time,
and it may also potentially attract both public and private investment. The impact on the informal
economy as a result of mandatory DST is not known. The public sector perceived the economic
implications of implementing voluntary DST could potentially have a moderate positive impact on
employment, economic growth and could potentially support logistics businesses, whilst other
criteria still rated poorly.
The private sector perceptions:
In the mandatory DST scenario, the private sector perceived fewer benefits than the public sector,
except for agreeing on the greater attractiveness of the city as a destination for professionals to live,
and a modest increase in opportunities for the green economy. Importantly, the private sector saw
no potential for DST to contribute to more investment. The private sector believed that voluntary

32
DST was already being implemented by companies in Durban who wished to do so, and
consequently there are limited additional gains to be made.
Figure 8: Economic implications of implementation of the no DST, mandatory DST, and voluntary DST scenarios (note the
blue line lies under the red line for several criteria at the bottom of the graph)
-3
-2
-1
0
1
2
3Employment impact
Growth of Durban's FormalEconomy
Contribute to greening ofDurban's Economy
Attractive destination forprofessionals / business people
to live
Potential to attract privateinvestment
Potential to attract publicinvestment
Business connectivity
Impact on informal trade
Public sector
No DST DST summer -eThekwini-wide DST summer - voluntary
-3-2-10123
Employment impact
Growth of Durban's FormalEconomy
Contribute to greening ofDurban's Economy
Attractive destination forprofessionals / business people
to live
Potential to attract privateinvestment
Potential to attract publicinvestment
Business connectivity
Impact on informal trade
Private sector
No DST DST summer -eThekwini-wide DST summer - voluntary
33
What are the social implications of implementing DST in the 7.2
eThekwini Municipality?
Figure 9 presents a summary of the perceptions of the workshop participants regarding the possible
social implications that may result from the implementation of the three DST scenarios.
With the exception of spending more time on the road commuting to and from work, there are little
or no social implications associated with the ‘no DST’ scenario.
The public sector perspective:
The implementation of mandatory DST was perceived to have a significant negative impact on
commuter safety as more people are likely to be travelling to work in the dark. Mandatory DST is
unlikely to improve traffic congestion, as the peak periods will simply shift by one hour and will not
be spread over a longer period of time. The public sector felt that society is also likely to be strongly
averse to mandatory DST. The social benefits of mandatory DST include major improvements in the
health of residents, and / or quality of life and family time, as residents would have more time in the
early evenings for leisure activities and spending time with their families.
Voluntary DST is likely to have little or no impact on commuter safety. Voluntary DST may result in a
moderate improvement in the health of residents, and / or quality of life and family time, as only
employees of companies observing DST would benefit from having more time in the early evenings
for leisure activities and spending time with their families. Voluntary DST may also result in a major
improvement in traffic congestion / travel time as the traffic peak would be spread over a longer
period of time. Furthermore, there is also proven societal support for voluntary DST.
The private sector perspective:
The private sector perceived that there could be a moderate improvement in family time, health and
traffic congestion with both mandatory and voluntary DST. However, they perceived that both
options would be socially unacceptable. They felt the key gains to be had would be from a reduction
in traffic congestion. Again, the private sector’s scores for voluntary DST tended to be low as this
scenario was believed to already be in place and therefore no significant additional gains or
improvements were likely.

34
Figure 9: Social implications of implementation of the no DST, mandatory DST, and voluntary DST scenarios
-3.0
-2.0
-1.0
0.0
1.0
2.0
3.0Commuter safety
Traffic congestion/ change intravel time
Health / Change in quality of lifeSocial / user acceptability
Family time
Public sector
No DST DST summer -eThekwini-wide DST summer - voluntary
-3
-2
-1
0
1
2
3Commuter safety
Traffic congestion/ change intravel time
Health / Change in quality of lifeSocial / user acceptability
Family time
Private sector
No DST DST summer -eThekwini-wide DST summer - voluntary

35
What are the ‘other’ implications of implementing DST in the 7.3
eThekwini Municipality?
Figure 10 presents a summary of the perceptions of the workshop participants regarding the
possible ‘other’ implications that may result from the implementation of the three DST scenarios.
As can be expected, there are little or no ‘other’ implications associated with the implementation of
the ‘no DST’ scenario.
The public sector perceptions:
With the implementation of mandatory DST, the public sector felt that there is no past record for
implementation at the local level, there are likely to be significant regulatory barriers, and local
government support and capacity for implementation will need to be developed. The impact of
mandatory DST on climate change adaptation initiatives and municipal service delivery is not known.
While mandatory DST will be costly for businesses to implement and strongly opposed by society in
general, it may result in a moderate reduction of South Africa’s electricity peak demand.
With voluntary DST, there is a historic track record of moderately successful implementation, there
are limited or no regulatory barriers, local government is able to implement it, and implementation
capacity exists. Voluntary DST may provide moderate support to climate change adaptation
initiatives, business opportunities and municipal services delivery. While the impact of voluntary DST
on South African peak electricity demand is not known, society is likely to strongly support the
initiative because of the potential social gains.
The private sector perceptions:
As with the public sector, the private sector felt that mandatory DST would benefit the reduction in
national peak electricity loads and would promote climate change adaptation. But for the rest of
the criteria, mandatory DST would generate costs to society and business. In terms of voluntary DST,
the private sector felt that it would have little impact on society, again reflecting that the private
sector felt that all the gains from a voluntary DST had already been secured.

36
Figure 10: Other implications of implementation of no DST, mandatory DST, and voluntary DST
-3.0
-2.0
-1.0
0.0
1.0
2.0
3.0
Historic track record - past DSTsuccess
Regulatory barriers
Implementing capacity (by localgovt)
Maturity of the concept in SA
Climate change adaptationCost to businesses to implement
Impact on SA peak load
Acceptance by SA
Support municipal servicedelivery
Public sector
No DST DST summer -eThekwini-wide DST summer - voluntary
-3
-2
-1
0
1
2
3
Historic track record - past DSTsuccess
Regulatory barriers
Implementing capacity (by localgovt)
Maturity of the concept in SA
Climate change adaptationCost to businesses to implement
Impact on SA peak load
Acceptance by SA
Support municipal service delivery
Private sector
No DST DST summer -eThekwini-wide DST summer - voluntary

37
In summary, Figure 11 shows a comparison between the perceptions of the public and private sector
workshop participants. In terms of economic criteria, both sectors agreed that mandatory DST
would have an overall negative impact. They differed with respect to their perceptions of the
voluntary DST economic impacts, with the public sector feeling that the impacts would be positive,
while the private sector suggested that the promotion of voluntary DST could mean that if most
businesses adopted it, the negative economic impacts would be similar to the implementation of
mandatory DST.
Figure 11: A comparison of DST scenario scores between the public and private sector workshop participants
-18%
11%
-2% -3%
29%
53%
25%
35%
-30%
-20%
-10%
0%
10%
20%
30%
40%
50%
60%
Economic Social Other Net
Voluntary DST
Private sector - voluntary Public sector - voluntary
-15%
0%
-29%
-14%
-1%
7%
-25%
-6%
-35%
-30%
-25%
-20%
-15%
-10%
-5%
0%
5%
10%
Economic Social Other Net
Ethekwini wide or mandatory DST
Private sector - eThekwini-wide
Public sector -eThekwini-wide

38
Looking at the social criteria, both groups agreed that the overall impact would be significantly
positive for voluntary DST, and only marginally positive for mandatory DST.
In the third set of criteria (other) - largely institutional issues, the private sector was negative about
both voluntary and mandatory DST scenarios. The public sector felt that the impacts of DST under
the voluntary scenario would be positive, but would be negative under the mandatory scenario.
Considering the overall scoring of the two DST scenarios, the net impacts of the implementation of
DST under a mandatory scenario were perceived to be negative by both groups, whilst for the
voluntary DST scenario the public sector perceived the net impacts to be positive, and private sector
perceived the net impacts to be negative.
The conclusions of the perceptions analysis are:
The net negative perceptions of both the public and private groups in regards to mandatory DST
suggest that this option should not be pursued further by the eThekwini Municipality.
In terms of voluntary DST, there are mixed signals:
o The private sector perceives that this option is already being applied by businesses that
are able to do so and consequently there are few additional gains to be generated by
pursing or promoting it further. This could be interpreted to suggest that a voluntary
DST system should then at least be maintained, as it is acknowledged to be delivering
certain benefits. However, the large scale promotion and adoption of voluntary DST is
suggested by the private sector to lead to the same kinds of negative economic and
other impacts that would be experienced if mandatory DST was implemented.
o The public sector feedback on the other hand suggests that voluntary DST should be
encouraged, as this sector sees the potential for additional gains.
This perception is likely to be influenced by the fact that the public sector is facing
significant challenges in meeting service delivery demand, so consequently making more
effective use of existing infrastructure by spreading demand for services over longer
periods of the day could improve service levels to users without additional capital costs
to the municipality. This implies that it may be beneficial to promote voluntary DST to
make more effective use of municipal infrastructure. However – the caution here is that
if the majority of businesses were to adopt voluntary DST, then this would take
eThekwini into a situation similar to that of the mandatory DST scenario, and the
positive influence on infrastructure use efficiencies would be diluted.
The above suggests that the public sector has incentives to promote voluntary DST (but only up
to a point), while the private sector sees limited benefit in promoting the further adoption of
voluntary DST at this point in time – although it appears that this group are not opposed to
voluntary DST and recognise the benefits of its implementation at its current scale.

39
Also important to note is the fact that stakeholder perceptions of the positive and negative
impacts of voluntary DST may also change over time. For example, on-going increases in traffic
congestion at peak times are likely to raise costs for business, which would generate greater
incentives in the future for businesses to engage in voluntary DST. The difference in
perspectives between the private and public sector may therefore be short term and may
converge as traffic congestion escalates in the medium term.
8 Conclusions
The literature survey results 8.1
Historically, adoption of DST is generally in response to a crisis, such as WW1, WW2 and the 1970s
energy crisis. The primary motivation for implementation of DST during these periods is generally
energy saving. The literature indicates that DST usually results in a marginal annual reduction in
electricity consumption and a slightly greater reduction in peak demand. The extent of the
reductions in consumption varies considerably within countries and between countries (seeTable 1).
The reductions are in many cases so marginal and the methods of calculation so varied, that one
cannot draw clear conclusions from the available evidence. However, the implications for energy
demand at peak periods appear to be more positive, with a more consistent indication of significant
reductions in peak demand. Table 8: Summary of potential electricity savings from implementation of DST, DDST or YRDST in selected countries
Country / Region DST, DDST or
YRDST
Reduction in
energy
consumption
Reduction in
energy Demand Time period of impact
Brazil DST 4.6% (2,700MW) During peak periods in summer
months.
California DST 0% On an annual basis.
5% During cooler months
DDST 0.2% During summer months.
YRDST 0.5% 3% During winter months.
Guatemala DST 28.8 GWh 41MW During months observing DST.
Mexico DST 0.83% 2.6% On an annual basis.
1,100 GWh 850MW On an annual basis.
UK YRDST 0.5% On an annual basis.
0.32% On an annual basis.
4% During winter months.
USA DST 0.5% On an annual basis.
YRDST 0.6% On an annual basis.
0.75% During winter months.
40
Despite the on-going debate around the costs and benefits of DST, a limited number of studies have
been undertaken on how DST affects electricity use. In most cases, these studies are outdated as
patterns of electricity use are likely to have changed since the studies were conducted. These studies
have found that in general DST can result in electricity savings, but this is dependent on local
conditions and existing patterns of electricity use. The studies also found that savings were generally
from the residential sector, with limited or no savings from the agricultural, commercial or industrial
sectors.
In addition to electricity savings, the literature survey indicates that there are other economic and
social benefits associated with the implementation of DST. These include increased revenue in the
retail and outdoor sport and tourism sectors. However, there are also a number of economic and
social costs associated with the implementation of DST. These include the disruption of sleep
patterns, reduced worker productivity and increased administration costs e.g. changing transport
schedules. Most of these costs are associated with the transition, when clocks are set forward or
backward by one hour.
Results of an analysis of the Durban electricity use and daylight 8.2
context
The potential of DST to reduce electricity consumption is based primarily on savings in residential
lighting use. The assumption is that with one more hour of daylight in the evening, the residents of
eThekwini will delay switching on electric lighting in their home by one hour. Assuming the bed time
of residents does not change, the time that lights are on will therefore be one hour less with DST.
An analysis of the eThekwini electricity use patterns shows that the implementation of DST can
potentially reduce eThekwini’s total annual electricity consumption by between 0.2% and 0.5%, with
an industry analyst suggesting the lower estimate is the most realistic. These estimates are similar
to other countries’ experiences.
An analysis of the suitability of DST implementation in eThekwini from a daylight availability
perspective shows that DST can be implemented more effectively in countries or regions in higher or
lower latitudes than eThekwini that have longer daylight hours. For example, in eThekwini there are
on average 13 hours 18 minutes of daylight in the summer months. If we subtract from that four
hours for commuting to and from work, and nine hours for a typical working day (i.e. total 13 hours),
there are approximately 18 minutes of daylight which can be used for sporting / leisure activities and
/ or family time. In order to free up an hour more daylight in the afternoons with the
implementation of DST, a portion of the morning activities, namely commuting to work, will need to
start before sunrise as there is not enough daylight to accommodate the shift. In comparison, in
London there are on average 14 hours 45 minutes of daylight in the summer months, with
approximately 1 hour 45 minutes of daylight which can be used for sporting / leisure activities and /
or family time. Thus, there is more leeway in London than in eThekwini for shifting daily activities
earlier to free up more time in the afternoons for sporting / leisure activities and / or family time.
There is much controversy regarding the net gains or losses associated with DST implementation in
Europe and North America, despite there being several additional daylight hours to be harnessed.
In eThekwini however, with little unharnessed daylight time to be exploited, the net benefits are
likely to be more marginal, and the controversy more acute.

41
It could be argued that DST already exists in eThekwini with many blue collar workers already leaving
for work very early in the morning due to lengthy commutes, and with many white collar workers
also leaving early to avoid traffic congestion. While DST may increase health and family time, there
is likely to be an increased cost for businesses operations and decreased commuter safety as
commuters travel in the dark. DST in eThekwini will generate a significant trade-off between more
family and health benefits, and the costs to business and commuter safety. It is worth noting that an
efficient public transportation system could also deliver similar benefits by reducing commuting
time, costs and emissions.
Results of an assessment of public and private sector perspectives 8.3
The perceptions of the public and private sector stakeholders were assessed using a multi-criteria
decision tool. Two DST scenarios were tested, namely voluntary DST (where households and
businesses participate voluntarily) and mandatory DST (where all eThekwini businesses are
compelled to participate). Workshops were held with stakeholders to score a set of criteria relating
to the two scenarios. This analysis showed that there were both significant similarities and
differences between the two groups’ perceptions of DST.
Firstly, both groups agree that a mandatory DST will generate a net negative impact on social
wellbeing and the economy and therefore should not be pursued further. The prefeasibility study
indicates that mandatory DST is not desirable or feasible from a stakeholder perspective.
In terms of voluntary DST, there are mixed signals. The private sector perceives that this option is
already in operation, and that there are few additional gains to be made by promoting its further
implementation. This implies that a voluntary DST should then at least be maintained as it is
acknowledged to be delivering benefits. However, should voluntary DST grow too big in application,
a situation will arise that will be similar in practice to the mandatory DST scenario, in which business
could experience elevated operating costs with a longer business day and various other factors
(including eThekwini’s business hours being out of sync with the rest of the country).
The public sector on the other hand is suggesting that voluntary DST should be encouraged, as they
see the potential for more gains to be made in terms of efficient use of public infrastructure, peak
load shifting in energy use, and possibly electricity savings. This implies that it may be beneficial to
promote on-going voluntary DST to make more effective use of municipal infrastructure. However,
the qualification here is that widespread adoption of DST could take eThekwini into a scenario
similar to the mandatory DST scenario, in which the perceived economic (i.e. public service
infrastructure use efficiency) benefits would be significantly diluted.
The above suggests that the public sector has incentives to maintain and promote voluntary DST,
while the private sector has little incentive to pursue further voluntary DST. In the medium to long
term, increasing traffic congestion is likely to elevate costs to business and therefore increase the
incentive to adopt voluntary DST.
The prefeasibility study shows that voluntary DST is feasible and certainly desirable for municipal
staff and a significant portion of the private sector.

42
Recommendations 8.4
EThekwini Municipality should pursue the promotion of voluntary DST amongst businesses for
whom this makes sense and can be done without creating additional costs or affecting the
competitiveness of these businesses. This is likely to include the public service sector and finance
and business services sector. The retail and manufacturing sectors are more likely to be exposed to
increased costs and business competitiveness costs as a result of adopting DST.
Furthermore, it would appear to be advantageous to the municipality to increase the numbers of
residents who participate in DST. This would require developing incentives to increase the benefits
or reduce the costs of participating residents to the point where the net impact is positive. A
number of incentive development options could be explored further by the municipality and private
sector partners. Apart from incentives, it would also be important to develop an advocacy
programme that would educate residents on the benefits of voluntary DST. It may also be useful to
identify any perverse incentives in place that may hinder voluntary DST. As the current magnitude
of participation in voluntary DST is unknown, the next phases of work should develop incrementally
to gauge adoption and respond appropriately.
9 Acknowledgements
Mr Derek Morgan and Mr Magash Naidoo from the eThekwini Municipality Energy Office are
thanked for their support in providing electricity data to the team for the analysis and for organising
the municipal workshop. The municipal team is acknowledged for their efforts in the multi-criteria
decision making process.
Mr Andrew Layman of the Durban Chamber of Commerce and Industry is thanked for organising the
private sector workshop. The Economic Affairs group of the Durban Chamber of Commerce and
Industry is acknowledged for its efforts in the multi-criteria decision making process.
Mr Sean Worthmann, deputy chair for the KZN Energy Forum is thanked for his contribution to the
multi-criteria decision making process.

43
10 References
AngloInfo (2014), Daylight saving time (DST), available from
http://saopaulo.angloinfo.com/information/moving/country-file/daylight-saving-time/, accessed on
06 March 2014.
Aries M.B.C and Newsham G.R. (2008), Effect of daylight saving time on lighting energy use: A
literature review, Energy Policy, 36, pgs. 1858-1866
Bouillon H. (1983), Mikro- und Makroanalyse der Auswirkungen der Sommerzeit auf den Energie-
Leistungsbedarf in den verschiedenen Energieverbrauchssektoren der Bundesrepublik Deutschland,
IFR Schriftenreihe 13. Dissertation, Technical University, Mu nchen (in German).
California Energy Commission (2007a), Effects of daylight saving time on California energy use, Staff
Report, available from, http://www.energy.ca.gov/reports/2001-05-23_400-01-013.PDF, accessed
on 05 March 2014.
California Energy Commission (2007b), The effect of early daylight saving time on California
Electricity consumption: A statistical analysis, Staff Report, available from
www.energy.ca.gov/2007publications/CEC-200-2007-004/CEC-200-2007-004.PDF, accessed on 05
March 2014.
Coate D. and Markowitz S. (2004), the effects of daylight and daylight saving time on US pedestrian
fatalities and motor vehicle occupant fatalities, Accident analysis and prevention, 36, pgs. 351-357
Ebersole, N., Rubin, D., Hannan,W., Darling, E., Frenkel, L., Prerau, D., and Schaeffer, K. (1974). The
Year-Round Daylight Saving Time Study, vol. I. Interim Report on the Operation and Effects of Year-
Round Daylight Saving Time. US Department of Transportation, Cambridge, USA.
Economic Commission for Latin America and the Caribbean (2009), Energy Efficiency in Latin America
and the Caribbean, Project Document, available from
http://www.eclac.cl/publicaciones/xml/2/39412/lcw280i.pdf, accessed on 05 March 2014.
Ethekwini Electricity (2012), Annual Report 2012/2013, available for download from
http://www.durban.gov.za/City_Services/electricity/About%20Us/Documents/2012_2013.pdf,
accessed on 24 April 2014.
Ferguson S.A., Preusser D.F., Lund A.K., Zador P.L. and Ulmer R.G. (1995), Daylight Saving Time and
Motor Vehicle Crashes: The Reduction in Pedestrian and Vehicle Occupant Fatalities, American
Journal of Public Health, 85(1), pgs. 92-95
Flueckiger L. (2014), Brazil daylight savings on Sunday, The Rio Times, available from
http://riotimesonline.com/brazil-news/rio-travel/brazil-daylight-saving-on-sunday/, accessed on 05
March 2014.
Gold Coast Business News (2007), Daylight saving solution on the cards, available from
http://www.goldcoastbusinessnews.com.au/process/myviews/gcbn_article.html?articleId=750,
accessed on 06 March 2014.

44
Hamermesh D.S., Myers C.K., and Pocock M.L. (2006), Time zones as cues for coordination: Latitude,
longitude and letterman, Working paper 12350, National Bureau of Economic Research, available
from http://www.nber.org/papers/w12350, accessed on 07 March 2014.
Harrison Y. (2013), The impact of daylight saving time on sleep and related behaviours, Sleep
Medicine Reviews, 17, pgs. 285-292
Hecq W., Borisov Y., and Totte M. (1993), Daylight saving time effect on fuel consumption and
atmospheric pollution, The Science of the Total Environment, 133, pgs. 249-274
Her Majesty’s Stationery Office (HMSO) (1970), Review of British Standard Time, Command paper
Cmnd 4512, London.
Hill S.I., Desobry F., Garnsey E.W., and Chong Y.F. (2010), The impact on energy consumption of
daylight saving on clock changes, Energy Policy, 38, pgs. 4955-4965.
Kellogg R. and Wolff H. (2007), Does extending daylight saving time save energy? Evidence from an
Australian experiment, Working Paper 163, Centre for the Study of Energy Markets, available from
http://escholarship.org/uc/item/3d8252zp, accessed on 05 March 2014.
Kotchen M.J. and Grant L.E. (2008), Does daylight saving time save energy? Evidence from a natural
experiment in Indiana, Working paper 14429, National Bureau of Economic Research, available from,
http://www.nber.org/papers/w14429, accessed on 06 March 2014.
Mowani A.M., Yatim B., and Ali M.A.M. (2009), The impact of the daylight saving time on electricity
consumption – A case study from Jordan, Energy Policy, 37, pgs. 2042-2051.
Ramos, G.N., Covarrubias, R.R., Sada, J.G., Buitron, H.S., Vargas, E.N., and Rodriguez, R.C. (1998),
Energy saving due to the implementation of the daylight saving time in Mexico in 1996, In:
Proceedings of the International Conference on Large High Voltage Electric Systems, CIGRE’98, Paris,
France, vol. 13, 6pp.
Republic of South Africa (2013), Measurement Units and Measurement Standards Act (18/2006):
National Measurement Standards, Government Gazette 36486, Regulation 386, published on 31
May 2013, Pretoria
Republic of South Africa (2008), Local Government: Municipal Structures Act, No. 117 of 2008,
Pretoria.
Republic of South Africa (2001), Local Government: Municipal Systems Act, No. 32 of 2000, Pretoria.
Republic of South Africa (1996), The Constitution of the Republic of South Africa, No. 108 of 1996,
Pretoria.
Rock, B.A. (1997). Impact of daylight saving time on residential energy use and cost, Energy and
Buildings, 25, pgs. 63–68.
Taylor B.S. and Hammer S.M. (2008), Shifts to and from daylight saving time and incidence of
Myocardial Infarction, The New England Journal of Medicine, 359(18), pgs. 1196-1198.

45
Time and Date (2014a), What is a Time Zone?, available from www.timeanddate.com/time/dst/,
accessed on 05 March 2014.
Time and Date (2014b), Daylight saving time – DST, available from
www.timeanddate.com/time/time-zones.html, accessed on 05 March 2014.
Time and Date (2014c), The history of daylight saving time, available from
www.timeanddate.com/time/dst/history.html, accessed on 05 March 2014.
Time and Date (2014d), Daylight saving time around the world 2014, available from
http://www.timeanddate.com/time/dst/2014.html, accessed on 05 March 2014.
Time and Date (2014e), Sunrise and sunset in Durban, available from
http://www.timeanddate.com/worldclock/astronomy.html?n=1487, accessed on 24 April 2014.
Time and Date (2014f), Sunrise and sunset in London, available from
http://www.timeanddate.com/worldclock/astronomy.html?n=136, accessed on 24 April 2014.
The Japan Times (2004), Hokkaido firms try daylight-saving, available from
http://www.japantimes.co.jp/news/2004/08/19/national/hokkaido-firms-try-daylight-
saving/#.UxhQTvmSxik, accessed on 06 March 2014.
Yacker H.G. (1998), Daylight saving time, Congressional research, available from
www.webexhibits.org/daylightsaving/congressionalResearchService.html, accessed on 05 March
2014.
Wikipedia (2014), Daylight saving time, available from
http://en.wikipedia.org/wiki/Daylight_saving_time, accessed on 04 March 2014.
Worthington A.C. (2005), Business expectations and preferences regarding the introduction of
daylight saving in Queensland, Economic Analysis and Policy, 34(1), pgs. 1-18.

46
Appendix 1: Legislative Framework
LEGISLATION RELEVANT SECTION
DESCRIPTION NOTES
Constitution (108 of 1996)
151(3) municipality has the right to govern, on its own initiative, the local government affairs of its community, subject to national and provincial legislation, as provided for in the Constitution.
151(4) The national or a provincial government may not compromise or impede a municipality’s ability or right to exercise its powers or perform its functions.
152 The objects of local government are…. (c) to promote social and economic development; (d) to promote a safe and healthy environment…
156(2) A municipality may make and administer by-laws for the effective administration of the matters which it has the right to administer.
As long as it does not conflict with national or provincial legislation
156(5) A municipality has the right to exercise any power concerning a matter reasonably necessary for, or incidental to, the effective performance of its functions.
Municipal Systems Act (32 of 2000)
Chapter 2 A municipality is an organ of state within the local sphere of government exercising legislative and executive authority within an area determined in terms of the 25 Local Government: Municipal Demarcation Act, 1998
Chapter 3 8(1)
A municipality has all the functions and powers conferred by or assigned to it in terms of the Constitution, and must exercise them subject to Chapter 5 of the Municipal Structures Act
Chapter 3 8(2)
A municipality has the right to do anything reasonably necessary for, or incidental to, the elective performance of its functions and the exercise of its powers
Possibly implement through By-laws
Municipal Structures Act (117 of 2008)
83(1) A municipality has the functions and powers assigned to it in terms of sections 156 and 229 of the Constitution
Measurement Units and Measurement Standards Act (18 of 2006) GN R368 (2013)
3(a) South African Standard Time (SAST) is defined as Coordinated Universal Time plus two (2) hours (or UTC + 02:00)
Mandate of Department Trade & Industry Administered by National Metrology Institute of South Africa (NMISA)

47
Appendix 2 – Detailed notes of review
What is DST?
Reference Notes Wikipedia (2014), Daylight saving time, available from http://en.wikipedia.org/wiki/Daylight_saving_time, accessed on 04 March 2014.
Practice of advancing clocks during the lighter months so that evenings have more apparent daylight and mornings have less. Typically clocks are adjusted 1 hour ahead in spring and 1 hour back in autumn. Daylight savings time versus daylight saving time. Daylight savings refers to potential saving of energy while daylight saving refers to saving of optimising daylight. Also referred to as ‘summer time’ in UK and Germany. In this case, normal time is referred to as winter time. Many countries also observe permanent daylight saving time to avoid issues associated with changing clocks.
Aries M.B.C and Newsham G.R. (2008), Effect of daylight saving time on lighting energy use: A literature review, Energy Policy, 36, pgs. 1858-1866
To shift human activity patterns to make better use of sunlight
What is DST not?
Reference Notes Wikipedia (2014), Daylight saving time, available from http://en.wikipedia.org/wiki/Daylight_saving_time, accessed on 04 March 2014.
Time zones – region that has a uniform standard time for legal, commercial or social purposes.
Where is DST implemented?
Reference Notes Wikipedia (2014), Daylight saving time, available from http://en.wikipedia.org/wiki/Daylight_saving_time, accessed on 04 March 2014.
DST is less practical in the extreme northern and southern regions as sunrise and sunset times are already out on sync with standardised working hours. Similarly, DST is less practical at the equator because there is very little variation in daylight throughout the year. In general, most countries in North America and Europe observe DST. Most countries in Asia and Africa do not. In South America, most countries near the equator do not observe DST. In Oceania, New Zealand and parts of southern Australia observe DST. South Africa observed DST between 1942-1944 (related to WW2).
AngloInfo (2014), Daylight saving time (DST), available from http://saopaulo.angloinfo.com/information/moving/country-file/daylight-saving-time/, accessed on 06 March 2014.
Europe - EU and rest of Europe (Excl. Iceland) - Greenland. North and Central America - USA (Excl. Hawaii and Arizona) - Canada - Bahamas - Bermuda - St-Pierre and Miquelon - Turks and Caicos - Mexico (Excl. Sonora) - Cuba

48
Reference Notes South America - Brazil (Excl. central and northern states) - Chile - Falkland Islands - Paraguay - Uruguay Africa - Namibia - Tunisia Australasia - Australian Capital Territory, New South wales, Victoria, Tasmania, South Australia, and Lord Howe Island - New Zealand - Catham Island Asia - Israel - Lebanon - Syria
Flueckiger L. (2014), Brazil daylight savings on Sunday, The Rio Times, available from http://riotimesonline.com/brazil-news/rio-travel/brazil-daylight-saving-on-sunday/, accessed on 05 March 2014.
Brazil: - Rio Grande do Sul - Santa Catarina - Parana, São Paulo - Rio de Janeiro - Espirito Santo -Minas Gerais - Goias, Matto Grosso - Matto Grosso do Sul - Distrito Federal
Why is DST implemented?
Reference Notes Wikipedia (2014), Daylight saving time, available from http://en.wikipedia.org/wiki/Daylight_saving_time, accessed on 04 March 2014.
Proponents argue that people appreciate extra daylight hours after a typical 9 to 5 working day. DST often supported within urban areas, and by professionals, retailers, and outdoor sportsman and retailers, and tourism businesses. DST often opposed within rural areas, and by farmers, transportation companies, and night-time entertainment businesses.
Aries M.B.C and Newsham G.R. (2008), Effect of daylight saving time on lighting energy use: A literature review, Energy Policy, 36, pgs. 1858-1866
Primarily for energy savings. Several other benefits including reduced traffic fatalities, and commercial activities.
Ebersole, N., Rubin, D., Hannan,W., Darling, E., Frenkel, L., Prerau, D., and Schaeffer, K. (1974). The Year-Round Daylight Saving Time Study, vol. I. Interim Report on the Operation and Effects of Year-Round Daylight Saving Time. US Department of Transportation, Cambridge, USA.
To increase energy savings following the 1973 oil embargo.
Kotchen M.J. and Grant L.E. (2008), Primary rationale for DST has always been to promote energy conservation.

49
Reference Notes Does daylight saving time save energy? Evidence from a natural experiment in Indiana, Working paper 14429, National Bureau of Economic Research, available from , http://www.nber.org/papers/w14429, accessed on 06 March 2014.
Hill S.I., Desobry F., Garnsey E.W., and Chong Y.F. (2010), The impact on energy consumption of daylight saving on clock changes, Energy Policy, 38, pgs. 4955-4965.
Climate change – Energy production is responsible for 30% of total CO2 emissions. Reducing energy consumption reduces CO2 emissions. Further to this, UK uses Open Cycle Gas Turbines (OCGT), which are less energy efficient, to manage peak periods. Security of supply – Energy supply in the UK is under strain and any reduction in energy consumption reduces shortfalls in generation capacity. Fuel poverty – In the UK, households that spend over 10% of income on energy are considered to be fuel impoverished. Energy savings could reduce levels of fuel poverty.
Worthington A.C. (2005), Business expectations and preferences regarding the introduction of daylight saving in Queensland, Economic Analysis and Policy, 34(1), pgs. 1-18.
Businesses in Queensland support the implementation of DST as they have strong economic linkages with neighbouring Victoria, which observes DST. The time delay between the two states creates confusion for customers, transport services, communication between businesses, and employee shifts.
Economic Commission for Latin America and the Caribbean (2009), Energy Efficiency in Latin America and the Caribbean, Project Document, available from http://www.eclac.cl/publicaciones/xml/2/39412/lcw280i.pdf, accessed on 05 March 2014.
DST was implemented in Guatemala to maximise use of natural light, to manage peak demand in the system, and to reduce power bills.
Coate D. and Markowitz S. (2004), the effects of daylight and daylight saving time on US pedestrian fatalities and motor vehicle occupant fatalities, Accident analysis and prevention, 36, pgs. 351-357
Improve matching of daylight hours and activity of the population.
How was DST implemented?
Reference Notes Wikipedia (2014), Daylight saving time, available from http://en.wikipedia.org/wiki/Daylight_saving_time, accessed on 04 March 2014.
Modern DST first conceptualised by George Hudson from New Zealand. The UK were first country to attempt unsuccessfully to adopt DST legislation in 1908. Similarly, the USA also attempted, unsuccessfully, to introduce DST legislation in 1909. Germany was the first country to implement DST in 1916 due to coal shortages and air raid blackouts in WW1. Following Germany, a number of countries, including the UK and USA also adopted DST. However, following WW1, many countries repealed DST.
Time and Date (2014b), Daylight saving time – DST, available from www.timeanddate.com/time/dst/, accessed on 05 March 2014.
In the northern hemisphere, DST begins between Mar-Apr and ends between Sep-Nov. In the southern hemisphere, DST begins between Sep-Nov, and ends between Mar-Apr.
Her Majesty’s Stationery Office (HMSO) (1970), Review of British
In 1968, the UK introduced a 3 year trial which implemented year round DST.

50
Reference Notes Standard Time, Command paper Cmnd 4512, London
Clocks were put forward 1 hour on 1 March 1968 and turned back in October 1971. The system was discontinued as the net affect wasn’t considered adequate.
Ebersole, N., Rubin, D., Hannan,W., Darling, E., Frenkel, L., Prerau, D., and Schaeffer, K. (1974). The Year-Round Daylight Saving Time Study, vol. I. Interim Report on the Operation and Effects of Year-Round Daylight Saving Time. US Department of Transportation, Cambridge, USA.
Year round DST was implemented in the USA in 1973 for a period of 2 years.
Ramos, G.N., Covarrubias, R.R., Sada, J.G., Buitron, H.S., Vargas, E.N., and Rodriguez, R.C. (1998), Energy saving due to the implementation of the daylight saving time in Mexico in 1996, In: Proceedings of the International Conference on Large High Voltage Electric Systems, CIGRE’98, Paris, France, vol. 13, 6pp.
DST was implemented in Mexico in 1996 for a one year trial period following two theoretical studies which estimated annual energy savings of between 0.65% and 1.1%.
Mowani A.M., Yatim B., and Ali M.A.M. (2009), The impact of the daylight saving time on electricity consumption – A case study from Jordan, Energy Policy, 37, pgs. 2042-2051.
DST was observed in Jordan between 2000 and 2008. DST started in March and ended in September / October. The day which DST started and ended varied year on year.
Hill S.I., Desobry F., Garnsey E.W., and Chong Y.F. (2010), The impact on energy consumption of daylight saving on clock changes, Energy Policy, 38, pgs. 4955-4965.
Modelled the impact of proposals to implement YRDST in the UK.
Flueckiger L. (2014), Brazil daylight savings on Sunday, The Rio Times, available from http://riotimesonline.com/brazil-news/rio-travel/brazil-daylight-saving-on-sunday/, accessed on 05 March 2014.
In Brazil, DST starts at midnight on 3rd Sunday of October and ends at midnight on 3rd Sunday of February. Only states in the south, southeast, and centre of Brazil observe DST.
Yacker H.G. (1998), 98-99 C Daylight saving time, Congressional research, available from www.webexhibits.org/daylightsaving/congressionalResearchService.html, accessed on 05 March 2014.
DST was first adopted by the USA in 1918 during WW1. Following the war, DST was abolished. However, some states continued to observe DST. DST was again adopted nationally between 1942 and 1945 during WW2. In 1966, the Uniform Time Act was adopted, due to strong pressure from the transportation industry, to standardise time zones and DST start and end dates. The Act also required all states to observe DST unless they applied for exemption. Today, only Hawaii, Arizona and part of Indiana do not observe DST. Currently, DST starts on first Sunday in April and ends the last Sunday in October.
Economic Commission for Latin America and the Caribbean (2009), Energy Efficiency in Latin America and the Caribbean, Project Document, available from http://www.eclac.cl/publicaciones/xml/2/39412/lcw280i.pdf, accessed on 05 March 2014.
Cuba first adopted DST in 1939, but abolished it after WW2. It was then reinstated in 1963 and has been implemented every year since, although the start and end dates have varied. Guatemala first adopted DST in 2006. DST started at midnight on 30 April 2006 and ended at midnight on 30 September 2006. However, DST was suspended in 2007. An unsuccessful attempt was made in 2009 to reinstate DST.

51
Reference Notes Coate D. and Markowitz S. (2004), the effects of daylight and daylight saving time on US pedestrian fatalities and motor vehicle occupant fatalities, Accident analysis and prevention, 36, pgs. 351-357
Modelled the impact of proposals to implement YRDST in the USA.
Cities versus countries implementing DST
Reference Notes Wikipedia (2014), Daylight saving time, available from http://en.wikipedia.org/wiki/Daylight_saving_time, accessed on 04 March 2014.
The southern states of Brazil observe DST, while continental Brazil, which is closer to the equator, does not. When the USA repealed DST in 1909, New York retained DST locally as it gave them a one hour advantage over stock traders in London, Chicago and Cleveland.
What are the potential impacts on electricity consumption?
Reference Notes Wikipedia (2014), Daylight saving time, available from http://en.wikipedia.org/wiki/Daylight_saving_time, accessed on 04 March 2014.
Early goal of DST was to reduce use of incandescent lighting, modern heating and cooling usage patterns. Current research on how DST affects energy use is limited or contradictory. Several studies have shown there no significant energy savings from DST, with some areas even experiencing an increase in energy consumption.
Time and Date (2014b), Daylight saving time – DST, available from www.timeanddate.com/time/dst/, accessed on 05 March 2014.
Costs: In California, extension of DST has little or no effect on energy savings. Study showed that implementation of DST in California State would cost Indiana households $8.6 million in electricity bills annually. Further to this, it was found that savings on lighting was offset by higher air-conditioning use. Costs associated with updating electronic equipment. Costs to transport companies of adjusting schedules. Benefits: Counter blackouts and other electrical failures that can occur later in the day (but why?) Reduce need for artificial lighting and other home appliances as people will spend less time indoors. In Brazil, DST reportedly reduced energy consumption by 1%.
Aries M.B.C and Newsham G.R. (2008), Effect of daylight saving time on lighting energy use: A literature review, Energy Policy, 36, pgs. 1858-1866
The assumption is that the ‘on-time’ for lighting will be reduced by 1 hour each day with DST. In the USA, it is estimated that this 1 hour saving per day will reduce national energy consumption by 0.5%. However, these savings may be outweighed by increased use of heating in the mornings (cooler regions) and air-conditioners in the afternoons (warmer regions).
Her Majesty’s Stationery Office (HMSO) (1970), Review of British Standard Time, Command paper
The study found that in the UK, morning consumption increased by 2.5%, while evening consumption decreased by 3%, resulting in a net 0.5% energy saving.

52
Reference Notes Cmnd 4512, London
Ebersole, N., Rubin, D., Hannan,W., Darling, E., Frenkel, L., Prerau, D., and Schaeffer, K. (1974). The Year-Round Daylight Saving Time Study, vol. I. Interim Report on the Operation and Effects of Year-Round Daylight Saving Time. US Department of Transportation, Cambridge, USA.
Overall, electricity savings ranged between 0.73% and 4.6% with year round DST – dependent on how savings were calculated. The study also analysed electricity usage between 1963 and 1972 when normal DST was in place. It was found that there was an overall 0.6% reduction in energy use. There is generally a 1.5% increase in energy consumption following the autumn transition. Peak loads also decreased by 0.75% (in Jan and Feb), with the daily winter peak shifting from early in the evening to later in the evening or to the morning.
Bouillon H. (1983), Mikro- und Makroanalyse der Auswirkungen der Sommerzeit auf den Energie-Leistungsbedarf in den verschiedenen Energieverbrauchssektoren der Bundesrepublik Deutschland, IFR Schriftenreihe 13. Dissertation, Technical University, Mu¨ nchen (in German). In Aries M.B.C and Newsham G.R. (2008), Effect of daylight saving time on lighting energy use: A literature review, Energy Policy, 36, pgs. 1858-1866.
Comparison of electricity use between 1979 (without DST) and 1980 (with DST). Electricity use for lighting in residential buildings decreased by 3.9%. However, energy use for heating increased by 1.2%. Overall, electricity use decreased by 1.8%.
Rock, B.A. (1997). Impact of daylight saving time on residential energy use and cost, Energy and Buildings, 25, pgs. 63–68.
A simulation model was used to estimate the energy use of a typical single-family house in 224 locations in the USA. The study found that with DST, electricity use would increase by 0.24% and gas use by 0.05%. Year round DST would decrease electricity and gas use by 0.02%.
Ramos, G.N., Covarrubias, R.R., Sada, J.G., Buitron, H.S., Vargas, E.N., and Rodriguez, R.C. (1998), Energy saving due to the implementation of the daylight saving time in Mexico in 1996, In: Proceedings of the International Conference on Large High Voltage Electric Systems, CIGRE’98, Paris, France, vol. 13, 6pp.
Electricity use in 12 cities, 560 residential homes, 28 commercial buildings and 14 industrial plants were monitored. Electricity usage in 1995 (without DST) was compared to electricity use in 1996 (with DST). Overall, energy use decreased by 0.83% in 1996. Annual maximum demand also decreased by 2.6%. Savings were exclusively from residential homes. No changes in use were detected in commercial and industrial uses.
California Energy Commission (2007a), Effects of daylight saving time on California energy use, Staff Report, available from, http://www.energy.ca.gov/reports/2001-05-23_400-01-013.PDF, accessed on 05 March 2014.
Study used a regression model to look at the effect of DST, DDST and YRDST on overall California electricity use. No change in total electricity use and summer peak demand with DST. However, in cooler months, peak demand decreased by 5%. DDST was less effective in spring/summer/fall months with savings of 0.2% in summer. YRDST resulted in drop in winter peak demand of over 3% and total winter electricity use decrease of 0.5%.
California Energy Commission (2007b), The effect of early daylight saving time on California
Study used a regression model to look at the effect of extending DST by 3 weeks. Extension of DST had little or no effect on energy consumption (0.2% decrease).
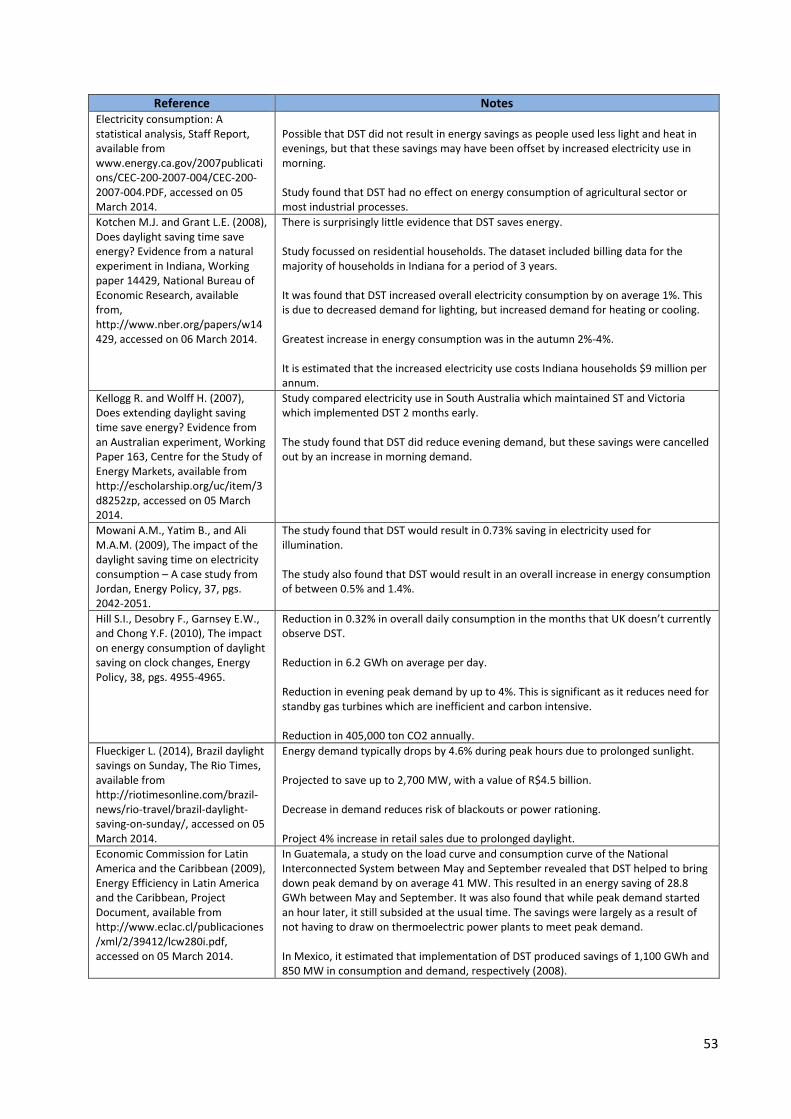
53
Reference Notes Electricity consumption: A statistical analysis, Staff Report, available from www.energy.ca.gov/2007publications/CEC-200-2007-004/CEC-200-2007-004.PDF, accessed on 05 March 2014.
Possible that DST did not result in energy savings as people used less light and heat in evenings, but that these savings may have been offset by increased electricity use in morning. Study found that DST had no effect on energy consumption of agricultural sector or most industrial processes.
Kotchen M.J. and Grant L.E. (2008), Does daylight saving time save energy? Evidence from a natural experiment in Indiana, Working paper 14429, National Bureau of Economic Research, available from, http://www.nber.org/papers/w14429, accessed on 06 March 2014.
There is surprisingly little evidence that DST saves energy. Study focussed on residential households. The dataset included billing data for the majority of households in Indiana for a period of 3 years. It was found that DST increased overall electricity consumption by on average 1%. This is due to decreased demand for lighting, but increased demand for heating or cooling. Greatest increase in energy consumption was in the autumn 2%-4%. It is estimated that the increased electricity use costs Indiana households $9 million per annum.
Kellogg R. and Wolff H. (2007), Does extending daylight saving time save energy? Evidence from an Australian experiment, Working Paper 163, Centre for the Study of Energy Markets, available from http://escholarship.org/uc/item/3d8252zp, accessed on 05 March 2014.
Study compared electricity use in South Australia which maintained ST and Victoria which implemented DST 2 months early. The study found that DST did reduce evening demand, but these savings were cancelled out by an increase in morning demand.
Mowani A.M., Yatim B., and Ali M.A.M. (2009), The impact of the daylight saving time on electricity consumption – A case study from Jordan, Energy Policy, 37, pgs. 2042-2051.
The study found that DST would result in 0.73% saving in electricity used for illumination. The study also found that DST would result in an overall increase in energy consumption of between 0.5% and 1.4%.
Hill S.I., Desobry F., Garnsey E.W., and Chong Y.F. (2010), The impact on energy consumption of daylight saving on clock changes, Energy Policy, 38, pgs. 4955-4965.
Reduction in 0.32% in overall daily consumption in the months that UK doesn’t currently observe DST. Reduction in 6.2 GWh on average per day. Reduction in evening peak demand by up to 4%. This is significant as it reduces need for standby gas turbines which are inefficient and carbon intensive. Reduction in 405,000 ton CO2 annually.
Flueckiger L. (2014), Brazil daylight savings on Sunday, The Rio Times, available from http://riotimesonline.com/brazil-news/rio-travel/brazil-daylight-saving-on-sunday/, accessed on 05 March 2014.
Energy demand typically drops by 4.6% during peak hours due to prolonged sunlight. Projected to save up to 2,700 MW, with a value of R$4.5 billion. Decrease in demand reduces risk of blackouts or power rationing. Project 4% increase in retail sales due to prolonged daylight.
Economic Commission for Latin America and the Caribbean (2009), Energy Efficiency in Latin America and the Caribbean, Project Document, available from http://www.eclac.cl/publicaciones/xml/2/39412/lcw280i.pdf, accessed on 05 March 2014.
In Guatemala, a study on the load curve and consumption curve of the National Interconnected System between May and September revealed that DST helped to bring down peak demand by on average 41 MW. This resulted in an energy saving of 28.8 GWh between May and September. It was also found that while peak demand started an hour later, it still subsided at the usual time. The savings were largely as a result of not having to draw on thermoelectric power plants to meet peak demand. In Mexico, it estimated that implementation of DST produced savings of 1,100 GWh and 850 MW in consumption and demand, respectively (2008).

54
What are the potential economic costs/benefits?
Reference Notes Wikipedia (2014), Daylight saving time, available from http://en.wikipedia.org/wiki/Daylight_saving_time, accessed on 04 March 2014.
Benefits: Increases in revenue in outdoor sports and tourism businesses. Costs: Disrupt meetings, travel, broadcasts, billing systems, and record management. Can negatively affect agriculture, particularly grain and dairy farmers. Can negatively affect transport companies. Can negatively affect night-time entertainment businesses, such as prime-time broadcasting and theatres. Also an economic cost associated with turning back clocks e.g. computer applications, resetting equipment etc.
Ebersole, N., Rubin, D., Hannan,W., Darling, E., Frenkel, L., Prerau, D., and Schaeffer, K. (1974). The Year-Round Daylight Saving Time Study, vol. I. Interim Report on the Operation and Effects of Year-Round Daylight Saving Time. US Department of Transportation, Cambridge, USA.
Some states of the USA experienced an increase in fuel use in (0.5% - 1%). This has been attributed to an increase in outdoor activities.
Worthington A.C. (2005), Business expectations and preferences regarding the introduction of daylight saving in Queensland, Economic Analysis and Policy, 34(1), pgs. 1-18.
Businesses in Queensland generally support DST due to expectations of increased sales and profits, and lower administration / paperwork costs and staffing levels. Thus, it is not only perceived as a change in how businesses operate, but also an economic opportunity. Businesses do not generally support the introduction of state-wide DST. In general, finance, insurance, electricity, gas, water and communications, and cultural and recreational services support DST. In contrast, construction, agriculture, forestry and fishing industries oppose DST. In general, Brisbane and the Gold Coast support DST, while the rural parts of Queensland oppose DST.
The Japan Times (2004), Hokkaido firms try daylight-saving, available from http://www.japantimes.co.jp/news/2004/08/19/national/hokkaido-firms-try-daylight-saving/#.UxhQTvmSxik, accessed on 06 March 2014.
The Chamber of Commerce estimated that the experiment would generate an extra 100 billion yen through increased spending, particularly in the retail, outdoor sports and tourism sectors.
What are the potential social costs/benefits?
Reference Notes Wikipedia (2014), Daylight saving time, available from http://en.wikipedia.org/wiki/Daylight_saving_time, accessed on 04 March 2014.
Benefits: Reduce depression. Increase Vitamin D synthesis in skin with increased sun exposure.

55
Reference Notes DST has been found to reduce traffic fatalities in a number of countries. However, in the UK and USA, there is a noticeable increase in crashes in the two weeks following the spring shift. Decrease in heart attacks in 3 days following autumn transition. Costs: Over exposure to sunlight can increase risk of skin cancer. Disrupt sleep patterns, resulting in reduced efficiency. DST can disrupt sleep patterns. Increase suicide rates in weeks following spring transition. Increase in heart attacks in first 3 days following spring transition. Can affect timing of medical devices embedded within patients.
Time and Date (2014b), Daylight saving time – DST, available from www.timeanddate.com/time/dst/, accessed on 05 March 2014.
Costs: Changing transport schedules can confuse travellers. Benefits: Boost tourism industry. Study estimated that an extra hour of daylight in Northern Ireland could increase tourism revenue by as much as £6.34 million a year.
Taylor B.S. and Hammer S.M. (2008), Shifts to and from daylight saving time and incidence of Myocardial Infarction, The New England Journal of Medicine, 359(18), pgs. 1196-1198.
In Sweden, there is a recorded higher incidence of heart attacks in 3 days following spring transition. Lower incidence of heart attacks in 2 days following autumn transition.
Economic Commission for Latin America and the Caribbean (2009), Energy Efficiency in Latin America and the Caribbean, Project Document, available from http://www.eclac.cl/publicaciones/xml/2/39412/lcw280i.pdf, accessed on 05 March 2014.
In Guatemala, DST was suspended because commuters living outside the city had to wake up too early to avoid traffic. In 2009, the reinstatement of DST in Guatemala failed as there were concerns over safety – majority of crimes take place early in the morning.
Hecq W., Borisov Y., and Totte M. (1993), Daylight saving time effect on fuel consumption and atmospheric pollution, The Science of the Total Environment, 133, pgs. 249-274
The study found that daylight saving in the USA resulted in an increase in evening traffic due to increased leisure travelling. As a result, fuel consumption increased (estimated 22,000 tons oil in 1989). It was found that DST also increases VOCs (0.45%), NOx (0.29%), photochemical pollutants (6.7%) due to increased fuel consumption and the time of day.
Coate D. and Markowitz S. (2004), the effects of daylight and daylight saving time on US pedestrian fatalities and motor vehicle occupant fatalities, Accident analysis and prevention, 36, pgs. 351-357
The study found that there was a reduction in pedestrian fatalities by 171 per annum in the USA (13% of total pedestrian fatalities). As there is greater pedestrian activity in the evening compared to the morning, the extra hour of daylight benefitted a greater number of pedestrians. Reduction in motor vehicle occupant fatalities by 195 per annum (3% of total motor vehicle fatalities).
Ferguson S.A., Preusser D.F., Lund A.K., Zador P.L. and Ulmer R.G. (1995), Daylight Saving Time and Motor Vehicle Crashes: The Reduction in Pedestrian and Vehicle Occupant
DST results in 1 h more of daylight in the evening and 1 hr less daylight in the morning. While DST does result in an increase in morning crashes, the reduction in evening crashes is more significant as there are typically more cars on the road in the evening. If YRDST had been retained between 1987 and 1991, there may have been 901 fewer
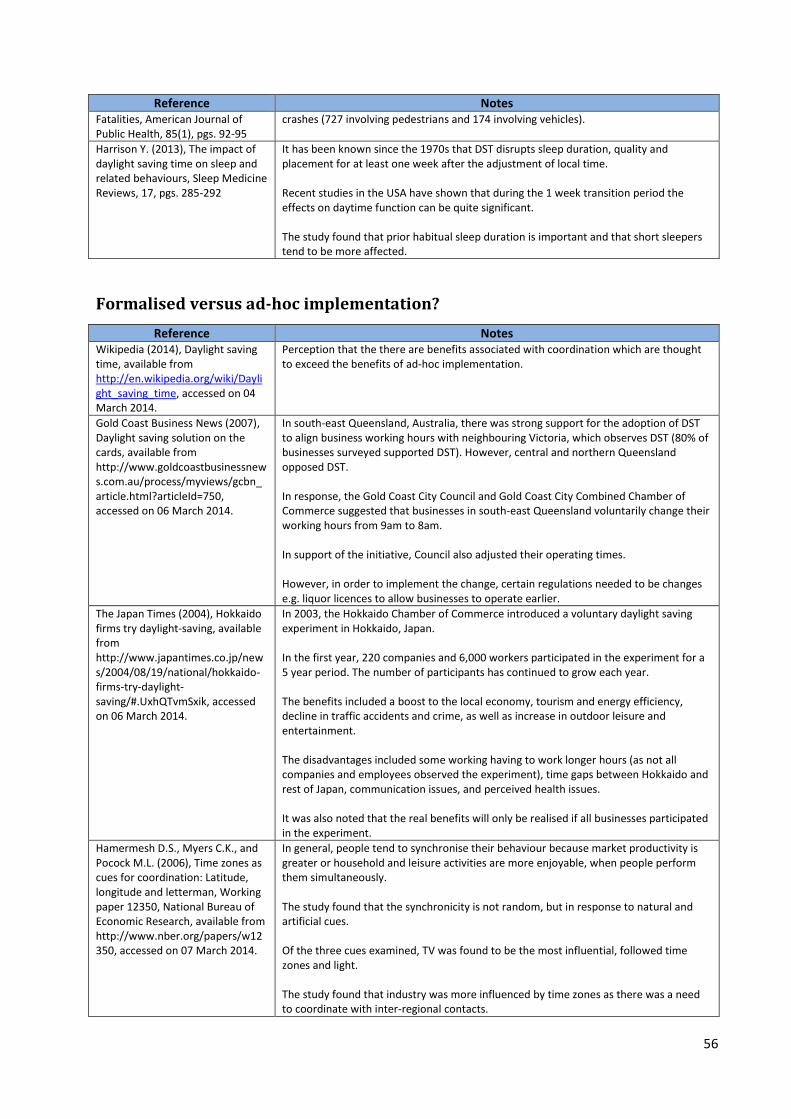
56
Reference Notes Fatalities, American Journal of Public Health, 85(1), pgs. 92-95
crashes (727 involving pedestrians and 174 involving vehicles).
Harrison Y. (2013), The impact of daylight saving time on sleep and related behaviours, Sleep Medicine Reviews, 17, pgs. 285-292
It has been known since the 1970s that DST disrupts sleep duration, quality and placement for at least one week after the adjustment of local time. Recent studies in the USA have shown that during the 1 week transition period the effects on daytime function can be quite significant. The study found that prior habitual sleep duration is important and that short sleepers tend to be more affected.
Formalised versus ad-hoc implementation?
Reference Notes Wikipedia (2014), Daylight saving time, available from http://en.wikipedia.org/wiki/Daylight_saving_time, accessed on 04 March 2014.
Perception that the there are benefits associated with coordination which are thought to exceed the benefits of ad-hoc implementation.
Gold Coast Business News (2007), Daylight saving solution on the cards, available from http://www.goldcoastbusinessnews.com.au/process/myviews/gcbn_article.html?articleId=750, accessed on 06 March 2014.
In south-east Queensland, Australia, there was strong support for the adoption of DST to align business working hours with neighbouring Victoria, which observes DST (80% of businesses surveyed supported DST). However, central and northern Queensland opposed DST. In response, the Gold Coast City Council and Gold Coast City Combined Chamber of Commerce suggested that businesses in south-east Queensland voluntarily change their working hours from 9am to 8am. In support of the initiative, Council also adjusted their operating times. However, in order to implement the change, certain regulations needed to be changes e.g. liquor licences to allow businesses to operate earlier.
The Japan Times (2004), Hokkaido firms try daylight-saving, available from http://www.japantimes.co.jp/news/2004/08/19/national/hokkaido-firms-try-daylight-saving/#.UxhQTvmSxik, accessed on 06 March 2014.
In 2003, the Hokkaido Chamber of Commerce introduced a voluntary daylight saving experiment in Hokkaido, Japan. In the first year, 220 companies and 6,000 workers participated in the experiment for a 5 year period. The number of participants has continued to grow each year. The benefits included a boost to the local economy, tourism and energy efficiency, decline in traffic accidents and crime, as well as increase in outdoor leisure and entertainment. The disadvantages included some working having to work longer hours (as not all companies and employees observed the experiment), time gaps between Hokkaido and rest of Japan, communication issues, and perceived health issues. It was also noted that the real benefits will only be realised if all businesses participated in the experiment.
Hamermesh D.S., Myers C.K., and Pocock M.L. (2006), Time zones as cues for coordination: Latitude, longitude and letterman, Working paper 12350, National Bureau of Economic Research, available from http://www.nber.org/papers/w12350, accessed on 07 March 2014.
In general, people tend to synchronise their behaviour because market productivity is greater or household and leisure activities are more enjoyable, when people perform them simultaneously. The study found that the synchronicity is not random, but in response to natural and artificial cues. Of the three cues examined, TV was found to be the most influential, followed time zones and light. The study found that industry was more influenced by time zones as there was a need to coordinate with inter-regional contacts.

57
Appendix 3 – Other Options
The private sector perceptions workshop elected to score a third scenario – Change the KZN Time
Zone to GMT plus 3 hours. This was then scored. The outcomes are outlined below.
Figure 12 outlines the impacts on economic criteria. The workshop felt that there could be small
gains to economic growth and to the attractiveness of Durban as destination for professionals.
Figure 12: Impacts on economic criteria
In terms of impacts on social criteria, the scenario was believed to contribute significantly to family
time and a better quality of life, but would seriously impact on commuter safety (see Figure 13).
Furthermore, it would was felt that it would not be socially acceptable.
-3
-2
-1
0
1
2
3Employment impact
Growth of Durban's Formal Economy
Contribute to greening of Durban'sEconomy
Attractive destination forprofessionals / business people to
live
Potential to attract privateinvestment
Potential to attract publicinvestment
Business connectivity
Impact on informal trade
Change to GMT +3 Time Zone

58
Figure 13: Impacts on social criteria
With regard to the ‘other’ criteria (see Figure 14), there were large gains to be made by reducing
peak electricity loads, but would have a negative impact on business costs and municipal service
deliver. It was also felt there would be significant institutional difficulties in implementing a new
time zone.
Figure 14: Impacts on institutional criteria
-3
-2
-1
0
1
2
3Commuter safety
Traffic congestion/ change intravel time
Health / Change in quality of lifeSocial / user acceptability
Family time
Change to GMT +3 Time Zone

59
In summary (see Figure 15), the workshop felt whilst there may be some modest economic gains in a
time zone change, the social and other criteria (largely cost to business and institutional hurdles)
impacts would be largely negative, and overall the scenario would have a net negative impact.
Figure 15: Comparison of impacts on all criteria
-15%
-10%
-5%
0%
5%
10%
15%
Economic Social Other Net
Change to GMT +3 Time Zone