Embed Size (px)
Citation preview
RESEARCH SERIES No. 95
HIV/AIDS SERO-PREVALENCE AND SOCIOECONOMIC STATUS:
Evidence from Uganda
IBRAHIM KASIRYE
JANUARY, 2013

RESEARCH SERIES No. 95
HIV/AIDS SERO-PREVALENCE AND SOCIOECONOMIC STATUS:
Evidence from Uganda.
IBRAHIM KASIRYE
JANUARY, 2013
Copyright © Economic Policy Research Centre (EPRC)
The Economic Policy Research Centre (EPRC) is an autonomous not-for-profit organization established in 1993 with a mission to foster sustainable growth and development in Uganda through advancement of research –based knowledge and policy analysis. Since its inception, the EPRC has made significant contributions to national and regional policy formulation and implementation in the Republic of Uganda and throughout East Africa. The Centre has also contributed to national and international development processes through intellectual policy discourse and capacity strengthening for policy analysis, design and management. The EPRC envisions itself as a Centre of excellence that is capable of maintaining a competitive edge in providing national leadership in intellectual economic policy discourse, through timely research-based contribution to policy processes.
Disclaimer: The views expressed in this publication are those of the authors and do not necessarily represent the views of the Economic Policy Research Centre (EPRC) or its management.
Any enquiries can be addressed in writing to the Executive Director on the following address:
Economic Policy Research CentrePlot 51, Pool Road, Makerere University CampusP.O. Box 7841, Kampala, UgandaTel: +256-414-541023/4Fax: +256-414-541022Email: [email protected]: www.eprc.or.ug
iEconomic Policy Research Centre - EPRC
HIV/AIDS Sero-prevalence and Socioeconomic Status: Evidence from Uganda.
ACKNOWLEDGEMENT
The Authors acknowledge support from the African Economic Research Consortium (AERC) to
undertake this research. I also benefited from comments from Finn Tarp, Germano Mwabu,
David Sahn and participants at the AERC biannual workshop in Arusha, Tanzania December
2012. I would like to thank the Measure DHS for making the data available. Any errors are
mine.
ii Economic Policy Research Centre - EPRC
HIV/AIDS Sero-prevalence and Socioeconomic Status: Evidence from Uganda.
TABLE OF CONTENTS
Acknowledgement i
Abstract 1
1.0 Introduction/Background 21.2 Objectives to the study 3
2.0 Research Issue: Theoretical framework review of the literature 52.1 Empirical evidence of the determinants of HIV/AIDS status. 7
3.0 Methodology and Data 93.1 Probit estimation for correlates of sexual behavior and the risk of being HIV positive. 93.2. Data 103.3 Variables used. 113.3.1 Dependent variables 113.3.2 Independent variables 12
4.0 Results 144.1 Descriptive results of sexual behavior and HIV program coverage. 144.2 Concurrent sexual relationships 144.3 Condom use 154.4 Alcohol use during sex 174.5 Ever tested for HIV 174.6 Male circumcision 194.7 The risk of HIV infection and self-perceived chances of contracting HIV. 204.8 Sero-Discordance among infected couples 22
5.0 Conclusions and implications 24
6.0 References 26
7.0 Appendix: Tables 30
EPRC RESEARCH SERIES 40
1Economic Policy Research Centre - EPRC
HIV/AIDS Sero-prevalence and Socioeconomic Status: Evidence from Uganda.
ABSTRACT
Although Uganda reported large reductions in HIV/AIDS prevalence during the 1990s, recent
evidence suggests that country’s rate of new HIV infections is on the rise. This study explores
the factors that are correlated with sexual behavior and the risk of HIV infection using a unique
dataset of 19,500 individuals from the 2011 Uganda AIDS Indicator Survey. This survey tested
individuals 15-49 years of age for sexually transmitted infections, including the HIV virus. The
same survey also collected background information for all tested individuals. This information
is similar to what is collected in a typical demographic and health survey (DHS). We estimate
probit models for the correlates of risky sexual behaviors that can lead to HIV infection such as:
having concurrent sexual partners, no-condom use, and alcohol use during sex. In addition, we
examine correlates of having been tested for HIV prior to the survey. Also, we estimate models
for correlates of the risk of testing HIV positive as well as the self-assessed risks of contracting
HIV. We find that higher education attainment and access to health facilities are important for
adopting safe sexual behaviors as well as the reducing the risk of testing HIV positive. Among
HIV infected couples, we find that women have a higher rate of discordance which is at odds
with the low rates of self-reported extra marital sexual behavior.
2 Economic Policy Research Centre - EPRC
HIV/AIDS Sero-prevalence and Socioeconomic Status: Evidence from Uganda.
1.0 INTRODUCTION/BACKGROUND
HIV/AIDS remains a significant development problem in sub-Sahara Africa (SSA), and
understanding the factors that can halt the spread of the disease is both an economic and a
public health priority. According to the joint United Nations Programme on AIDS (UNAIDS), at
the end of 2011, an estimated 34 million persons were infected with HIV globally, and at least
69% of victims were in SSA—a region with only 12% of the global population (UNAIDS, 2012).
Worse still, the region had 70% of the estimated 2.7 million new HIV infections during the same
period. Clearly, the HIV/AIDS situation in SSA remains dire despite the increased resources
devoted to control of the disease. In the literature, such risky sexual behaviors as having
multiple sexual partners and not using a condom are highlighted as the main drivers of HIV
infections. Among policymakers and researchers, it is now recognized that without sustained
behavioral change, SSA is unlikely to reverse the tide of increasing HIV/AIDS infections. Although
some studies have examined whether sexual behaviors are indeed changing due to HIV/AIDS
(e.g. Glick and Sahn, 2008; Fortson, 2008), the evidence is still inconclusive, and many of the
previous cross-country studies have been plagued by comparability issues.
This paper seeks to add to the existing evidence on this issue by studying the correlates of risk
of HIV infection in Uganda, a country that is considered exemplary because of its proactive
strategy for combating of the spread of HIV/AIDS. Uganda managed to reduce its HIV/AIDS
prevalence rate from 30% in the early 1990s to approximately 6.4% by 2004/05 (Ministry of
Health and ORC Macro, 2006); however by 2011, the HIV prevalence rate had increased to
7.3% (Ministry of Health et al, 2012). This reversal is partly attributed to the behavioral change
campaign that was code named ABC—Abstinence, Being faithful and using Condoms. This
campaign was implemented beginning in the late 1980s (Green et al., 2006). Furthermore,
spending on new HIV/AIDS care and prevention programs has increased the overall significance
of the health sector in Uganda’s national budget. Between 1997/98 and 2001/02, health
spending in Uganda averaged 7 % of the national budget (Government of Uganda, 2008). In
contrast, for the periods 2002/03 and 2005/06, average health spending was more than 12 %
of the national budget.1 Indeed, the recent surge in health spending is attributed to the global
initiative to combat the spread of HIV, which includes the Global Fund for AIDS, Malaria and
Tuberculosis, the Global Alliance for Vaccines and Immunization (GAVI), and the US President’s
Emergency Plan for AIDS Relief (PEPFAR).
Although Uganda has achieved some commendable results in combating the spread of HIV/
AIDS, challenges remain. First, despite a significant decrease in the national HIV/AIDS prevalence
rates, the country has failed to meet its own HIV targets. For example, the current Health
1 Actual spending on HIV/AIDS intervention programs increased from US$ 38.4 million in 2003/04 to US$ 170 million in 2006/07 (MFPED, UAC, and UNDP, 2008).
3Economic Policy Research Centre - EPRC
HIV/AIDS Sero-prevalence and Socioeconomic Status: Evidence from Uganda.
Sector Strategic Plan (HSSP) reports that the sero-prevalence among Ugandans has consistently
remained above the national target of 5 % (Government of Uganda, 2010b). Second, in the
recent past, the country has seen a reversal in the trend in new HIV infections. According to
the Uganda AIDS Commission, the new infections rates nearly doubled from 73,000 in 2002
to over 130,000 by 2009 (Uganda AIDS Commission, 2009).2 Third, only a small proportion
of Ugandans know their HIV status. Thus, a substantial proportion of infected individuals
have never been tested, and such individuals have an increased risk of spreading the disease.
Overall, the increase in new HIV infections may be partly explained by complacency due to the
recent availability of antiretroviral therapies (Government of Uganda, 2010b). Nonetheless,
such reversals not only highlight internal inefficiency in the health system but also cast doubts
on Uganda’s ability to attain its HIV control targets. Against the backdrop of increased spending
on HIV/AIDS prevention and care, the correlates of HIV status must be examined, and we must
consider how these correlates vary within various populations.
1.2 Objectives to the study
In this paper, we investigate the association between individual HIV status, sexual behavior,
and socioeconomic status. Specifically, we consider the following questions: (a) What are
the socio-economic correlates of sexual behaviors? (b) What factors are correlated with the
adoption of the key HIV infection prevention strategies? (c) What are factors are associated
with the risk of being HIV positive? The overriding objective is to understand individual sexual
behaviors and practices relate to the risk of eventual HIV infection.
Uganda is of special interest in this research given its long history of implementing HIV/
AIDS prevention programs. For some time, the country was heralded as a leader in HIV/AIDS
prevention programs.3 Consequently, it would be wise to consider how the country managed
to reverse the increase in HIV/AIDS—at least in the 1990s. Second, as earlier mentioned, there
is evidence to show that new HIV infections are rising in Uganda. The 2009 modes of HIV/AIDS
transmission study for highlighted the major drives of new HIV infection in the country—notably
multiple sexual partners, HIV discordance, mother to child transmission and commercial sex
work (Uganda AIDS Commission, 2009). In response to the rising new HIV infections and the
recognition of the possibility that the HIV/AIDS epidemic in Uganda may have matured, the
government has adopted incorporated additional interventions to control the spread of the
HIV virus. The current national HIV prevention strategy (2011-2015) considers interventions
beyond the ABC to include: prevention of mother to child transmission (PMTCT); roll out of
safe male circumcision; and expansion of ARTs to reduce the overall community viral load
2 These recent changes should be interpreted with caution because they are not based on nationally representative surveys/assessments, as mentioned earlier, but are instead based on information from sentinel sites that test for HIV/AIDS among expectant mothers. Thus, they may produce unreliable data that may have been affected by self-selection bias.
3 Previously, Uganda’s main HIV prevention strategy hinged on the ABC—Abstinence, Being Faithful and Condom Use.
4 Economic Policy Research Centre - EPRC
HIV/AIDS Sero-prevalence and Socioeconomic Status: Evidence from Uganda.
(Uganda AIDS Commission, 2011). The current study investigates whether the national focus
is in line with drivers of sexual behavior.
Although other studies have examined the determinants and impacts of HIV/AIDS prevalence
in Uganda, the majority focuses on the medical aspects of the disease (see, e.g., Ciantia et al.,
2004; Quinn et al., 2000; and Serwadda et al., 1995). Furthermore, there has been no nationally
representative study that combines regular socioeconomic and demographic information with
information on HIV testing in the Uganda literature. Indeed, prior to the 2004/05 survey by
the Uganda Bureau of Statistics and ORC Macro International, all of the previous estimates
of HIV/AIDS prevalence in Uganda were based on sentinel sites and thus may not nationally
representative. Furthermore, despite the advent of DHS type surveys, which also test for HIV
status, all of the previous cross-country studies examining correlates of HIV status have not
involved Uganda (see, e.g., Fortson, 2008; de Walque, 2007b, 2009). Consequently, using the
2011 Uganda AIDS Indicator Survey, which is nationally representative, this paper investigates
how individual sexual behaviors relate to the risk of HIV infection.
The paper is organized as follows. In the next section, we present a theoretical framework
for analyzing the correlates of HIV infection status and review the recent literature on the
likely drivers of HIV status in SSA. Section 3 provides the methodology and data used. Section
4 presents the findings and discussions of the study, and the conclusions are presented in
Section 5.
5Economic Policy Research Centre - EPRC
HIV/AIDS Sero-prevalence and Socioeconomic Status: Evidence from Uganda.
2.0 RESEARCH ISSUE: THEORETICAL FRAMEWORK AND REVIEW OF THE LITERATURE
Given the numerous ways in which an individual can contract HIV/AIDS—which range from sexual
intercourse to blood transmissions, mother-to-child blood transmissions and intravenous drug
use—there is no single theoretical framework that has been used to explain the determinants
of HIV/AIDS status. Rather, a number of authors identify a number of major pathways through
which an individual can contract HIV/AIDS (see, e.g., Glick, 2010, 2007; de Walque, 2007a;
Oster, 2012, 2005). Using the unique characteristics of SSA—which, as mentioned previously,
is the region with the highest HIV infection rates—Glick (2007) identifies two major pathways
linking socioeconomic status to HIV prevalence: sexual behavior and knowledge of HIV/AIDS;
and the poor state of general reproductive health services, which leads to a large number of
sexually transmitted infections (STIs) and the poorly developed health services, because of
which a large proportion of the population do not know their HIV status; and.
One of the most highlighted reproductive health characteristics of SSA is the large number
of untreated non-HIV STIs. It is argued that untreated diseases, such as syphilis and herpes,
increase the susceptibility of an individual to HIV infections. Indeed, such authors as Oster
(2005) posit that this increased susceptibility is one of the major explanations for the differences
in the HIV/AIDS transmission rates in the United States and SSA.4 According to the author, SSA
has experienced more rapid HIV transmission due to the large number of untreated STIs. Other
concerns related to reproductive health include the issues of male circumcision and pregnancy.
According to Ferry et al. (2001), male circumcision rates may partly explain the differences in
the HIV/AIDS prevalence rates within SSA. For instance, HIV/AIDS prevalence rates are much
lower in West African countries, which have a large Muslim population, than in East and Central
Africa countries, which have much lower rates of male circumcision.5 In addition, pregnant
women have higher rates of HIV/AIDS prevalence compared to other sexually active women,
possibly due to reduced immunity during pregnancy. The state of overall health services can
also aid the spread of HIV. Glick (2007) notes that the majority of the adult population in SSA
has never been tested for HIV/AIDS despite the outbreak of the disease more than 20 years
ago. Thus, there is limited knowledge about HIV/AIDS status, which exacerbates the spread of
the disease, as mentioned earlier.
According to Glick (2007), sexual behavior (and in particular, sex with multiple partners) is seen
as the major reason why the countries in SSA have the highest rates of HIV infection. Although
the average lifetime number of sexual partners in SSA is similar to that in other regions, due
to the region’s history of polygamy, men in SSA normally have a number of concurrent sexual
partners, which creates what is known as the “sexual network” in the HIV/AIDS literature.
4 HIV/AIDS was first identified in the gay community in the USA in the early 1980s; however, the spread of disease in the USA has been very limited compared to its spread in SSA (Oster, 2005).
5 Muslim believers practice circumcision on male children as part of their religious rights of passage.
6 Economic Policy Research Centre - EPRC
HIV/AIDS Sero-prevalence and Socioeconomic Status: Evidence from Uganda.
The susceptibility to HIV infections increases with both the number of people in the sexual
network and the duration of sexual relationships. Other sexual behaviors noted as key drivers
of HIV/AIDS in SSA include the practice of cross-generational sexual relationships, particularly
between older men and young girls. This practice explains the large gender differences in HIV
infection rates among teenagers. Thus, sexual behavior, coupled with knowledge, attitudes
and beliefs about HIV/AIDS, can be a key determinant of infection.
Another important socioeconomic factor in HIV/AIDS prevalence is gender: females have far
higher rates of HIV/AIDS infection than men. Even among sero-discordant couples6, women
are more likely to be infected (de Walque, 2007b). No conclusive explanation has been
provided for these higher rates of HIV infection; however, the literature points to a number
of contextual factors that may increase female susceptibility to HIV infection. First, women
become sexually active much earlier than men in SSA, which may increase their lifetime
chances of contracting the disease. Second, because of the unequal power relations within
most households in developing countries, most women cannot exercise control over their
sexuality. Furthermore, because of the lack of empowerment of women in many SSA societies,
some are forced to engage in transactional sex. Also, with the exception of expectant mothers,
who are regularly tested at sentinel sites, women in SSA are less likely than men to be tested
for HIV/AIDS (Gersovitz, 2005).
One of the most examined drivers of HIV infection is the extent of deprivation within a
community. Such authors as Oster (2012) postulate that another reason for the higher HIV/
AIDS infection rates in SSA is the generally high level of poverty and low expected future
incomes. This supposition is based on the premise that sexual behavior in SSA has not changed
drastically despite the onset of the HIV/AIDS epidemic more than 20 years ago. According
to Oster, because of the lower valuation of life (at least in monetary terms), most Africans
engage in risky sexual behavior despite adequate knowledge of the potential consequences.
However, empirical support for the higher poverty-higher HIV/AIDS prevalence hypothesis is
very limited; most authors do not find a significant impact of poverty on HIV/AIDS prevalence
(de Walque, 2009; Lachaud, 2007). In fact, some studies in SSA find that HIV/AIDS prevalence
is linked to higher incomes. However, this finding is mainly explained by the higher HIV/AIDS
infection rates in urban areas, where most of the well-to-do individuals reside, rather than
by incomes per se. In the next subsection, we describe some of the empirical results of the
studies that investigate the correlates of HIV positive status.
6 These are sexual relationships in which one partner is HIV positive and the other is HIV negative.
7Economic Policy Research Centre - EPRC
HIV/AIDS Sero-prevalence and Socioeconomic Status: Evidence from Uganda.
2.1 Empirical evidence of the determinants of HIV/AIDS status.
There is a vast and growing body of literature on the determinants of HIV/AIDS prevalence
and associated sexual behaviors in SSA. Examples of empirical studies from the recent past
include de Walque and Kline (2010), Fortson (2008), Glick and Sahn (2008), de Walque (2007a,
2007b), Oster (2005), and Gersovitz (2005). The main focus for most of these studies is why
SSA has the highest rates of HIV/AIDS infection in the world. The evidence from these (mainly
cross-country) studies is mixed. For example, a number of studies show that the expected
relationship between poor health status and low income does not hold for HIV infections (see,
e.g., Mishra et al., 2007; and Fortson, 2008). Fortson (2008) uses 5 DHS surveys that tested
individuals for HIV/AIDS status to determine that individuals from well-to-do households and
those with higher education levels are more likely to be HIV positive. According to Fortson,
highly educated men and women are more likely to engage in pre-marital sex, which may
increase their susceptibility to HIV infections. Other studies based on both cross-country
analysis and country surveys also point to the positive relation between HIV infection status
and both risky sexual behaviors and economic status. For instance, Gregson et al. (2001) find
a significant relationship between national HIV/AIDS prevalence rates and literacy. Similarly,
based on a survey in the Kisumu district in Western Kenya, Luke (2008) finds that wealthier men
make proportionally larger monetary or other payments to non-steady sexual partners and
that this practice may exacerbate the incidence of unsafe sexual activities, such as unprotected
sex, within this population subgroup.
One of the challenges of understanding the causes and impacts of HIV/AIDS using regular
surveys has been the identification of HIV-positive individuals. Due to the stigma attached
to the disease, only a small proportion of the African population has ever been tested for
HIV/AIDS. As such, most of the earlier analysis of HIV/AIDS prevalence relied on sentinel
data that were collected mainly from women attending antenatal clinics. Starting in the late
1990s, the DHS surveys pioneered the collection of nationally representative information on
HIV knowledge, and more recently, the surveys have tested individuals to more accurately
establish sero-prevalence (Mishra et al., 2007).7 This recent availability of data has spurred
research examining an array of issues, and some of the results dispel earlier preconceived
notions about the disease. As mentioned earlier, Glick and Sahn (2007) show that the limited
testing for HIV among Africans is not due to fear of knowing one’s HIV status but rather to
constrained access to HIV/AIDS testing facilities. de Walque (2009), based on DHS surveys from
Burkina Faso, Cameroon, Ghana, and Kenya, finds that male circumcision has no significant
impact on HIV/AIDS status. In a related study, focusing only on couples, de Walque (2007b)
finds that at least two thirds of infected couples are sero-discordant. In a more recent study,
7 By 2009, the following countries in SSA had DHS type surveys with an HIV testing component: Burkina Faso, Cameroon, Ghana, Kenya, Malawi, Tanzania, and Uganda.
8 Economic Policy Research Centre - EPRC
HIV/AIDS Sero-prevalence and Socioeconomic Status: Evidence from Uganda.
Fortson (2009) finds no significant impact of HIV prevalence on the fertility of women in 12
African countries.
Gersoritz (2005) uses ten DHS surveys for Kenya, Tanzania, Uganda, and Zambia to identify
evidence of behavioral change in response to the pandemic. For example, women in Zambia
are having sex later because of the fear of HIV/AIDS. In contrast, Glick and Sahn (2008) examine
a much larger sample of 16 DHS surveys from eight countries in SSA8 and do not find consistent
reduction in this regard for women or men. In particular, for women, such results are found
only for Benin, Ghana, Mozambique, and Nigeria, while only Uganda and Zambia show a
significant increase in the average age of women at their first instance of sexual intercourse.
Nonetheless, Glick and Sahn (2008) find consistent favorable changes in at least one indicator
of sexual behavior—condom use among unmarried individuals—for both women and men. For
women, with the exception of Nigeria, all of the countries studied show significant increases
in condom use. For men, the only significant increases in condom use are identified for Benin,
Burkina Faso, Ghana, and Mozambique. For the other indicators of non-risky sexual behavior,
such as abstinence and fidelity to one sexual partner, the results vary by country.
A key determinant of access to and comprehension of HIV/AIDS knowledge and information
is education. De Walque (2007a) posits that education is negatively related to HIV infection
rates and identifies various pathways through which education impacts HIV/AIDS infection:
the use of condoms, particularly during sex with non-regular partners; the use of HIV/AIDS
facilities, particularly voluntary counseling and testing centers; and the empowerment of
women to negotiate sex. Based on longitudinal data from a district in Southwestern Uganda,
de Walque (2007a) shows that increased education attainment has large payoffs in terms of
HIV/AIDS reduction. In particular, after the introduction of HIV/AIDS information campaign
in Southwestern Uganda, HIV/AIDS infections decreased by 6 % for individuals with primary
education and 12 % for individuals with secondary education.
8 The countries covered are Benin, Burkina Faso, Ghana, Kenya, Mozambique, Nigeria, Uganda, and Zambia.
9Economic Policy Research Centre - EPRC
HIV/AIDS Sero-prevalence and Socioeconomic Status: Evidence from Uganda.
3.0 METHODOLOGY AND DATA
3.1 Probit estimation for correlates of sexual behavior and the risk of being HIV positive.
Because of the nature of the cross-sectional dataset available and because of econometric
concerns, such as omitted variable bias (e.g., preferences in sexual behavior), we do not claim
to establish a causal relationship between the risk of HIV infection and socioeconomic status.
Instead, we estimate the association between the risk of HIV infection and such factors as
educational attainment, spatial location, and marital behavior (i.e., whether a person has
ever married or has had multiple marriages). Following previous studies that examined the
correlates of HIV infection in Africa (see, e.g., de Walque and Kline 2010; Corno and de Walque,
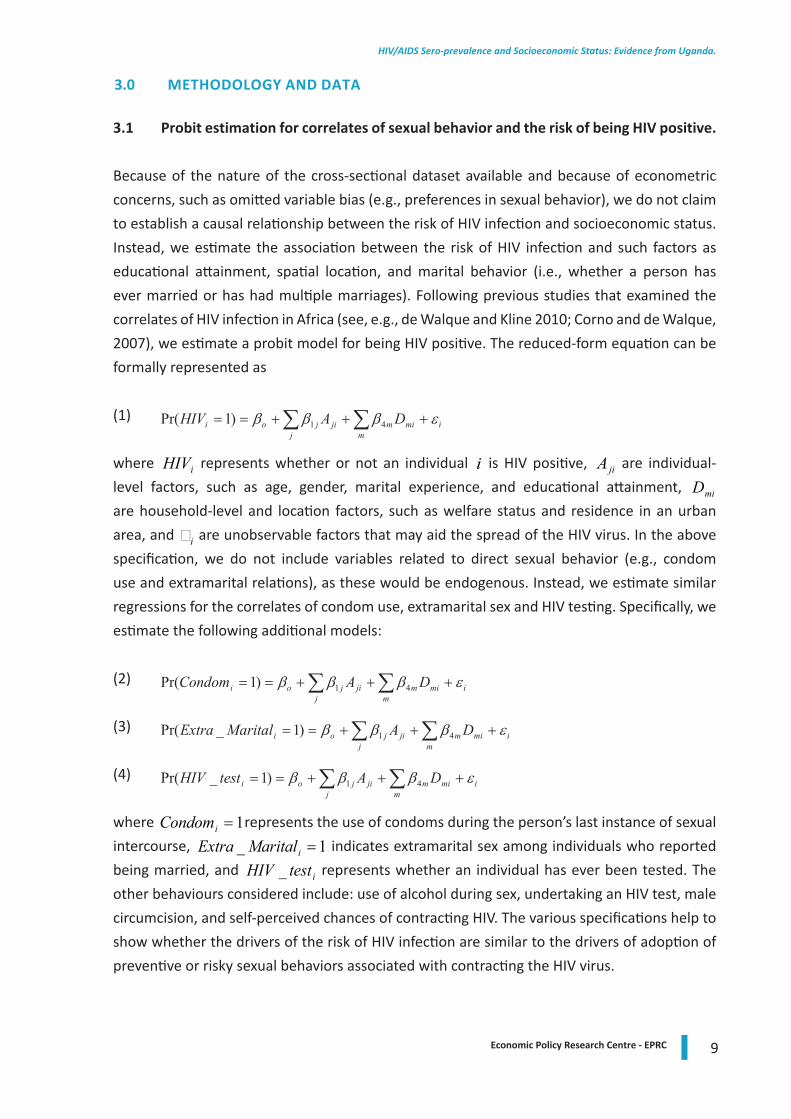
2007), we estimate a probit model for being HIV positive. The reduced-form equation can be
formally represented as
(1)
where iHIV represents whether or not an individual i is HIV positive, jiA are individual-
level factors, such as age, gender, marital experience, and educational attainment, miD
are household-level and location factors, such as welfare status and residence in an urban
area, and ie are unobservable factors that may aid the spread of the HIV virus. In the above
specification, we do not include variables related to direct sexual behavior (e.g., condom
use and extramarital relations), as these would be endogenous. Instead, we estimate similar
regressions for the correlates of condom use, extramarital sex and HIV testing. Specifically, we
estimate the following additional models:
(2)
(3)
(4)
where 1=iCondom represents the use of condoms during the person’s last instance of sexual
intercourse, 1_ =iMaritalExtra indicates extramarital sex among individuals who reported
being married, and itestHIV _ represents whether an individual has ever been tested. The
other behaviours considered include: use of alcohol during sex, undertaking an HIV test, male
circumcision, and self-perceived chances of contracting HIV. The various specifications help to
show whether the drivers of the risk of HIV infection are similar to the drivers of adoption of
preventive or risky sexual behaviors associated with contracting the HIV virus.
10 Economic Policy Research Centre - EPRC
HIV/AIDS Sero-prevalence and Socioeconomic Status: Evidence from Uganda.
If the drivers of HIV infections and sexual behavior are all presented by a vector X , then
equations (1)-(4) can be jointly rewritten as
(5)
where { }iiii SexExtraCondomHIVS _,,= and represent a standard normal cumulative
distribution and 'e represents the parameters to be estimated. To more accurately interpret
the results of the probit estimations, we estimate the marginal effects of the specification in
Eq. (4). The marginal effects model is specified as
(6)
The interpretation of the estimations from Eq. (6) is as follows; for example, it indicates
the effect of a change in the regressor at the mean on HIV prevalence in the HIV infection
specification.
3.2. Data
As mentioned earlier, this study uses the most recent nationally representative survey of HIV
prevalence in Uganda: the 2011 Uganda AIDS Indicator Survey, conducted by the Ministry
of Health in Uganda and ICF International (Ministry of Health et al, 2012). The objective of
this survey, which was supported by the US government, was to obtain national and regional
prevalence estimates of HIV and syphilis infection in Uganda. In addition, the survey sought
to capture information on sexual behaviors and program coverage for HIV related services.
In particular, the survey tested for the following sexually transmitted infections (STIs): HIV,
syphilis, herpes simplex, and hepatitis b. For HIV positive individuals, the survey established the
CD4 count in order to understand the HIV treatment needs. This survey was undertaken during
a period of 7 months (February –September 2011) and employed a two-stage cluster sampling
design. In the first stage, clusters or enumeration areas were the principal sampling unit, and
at least 470 clusters were selected across the country. In the second stage, 25 households
were randomly selected from each cluster.
Furthermore, the survey coverage was expansive, with 11,340 households selected for
analysis. The survey targeted individuals in the sexually active age category: people aged 15-
59 years. Within the selected households, at least 12,153 women and 9,983 men were in the
reproductive age group and were thus eligible for interview and STI testing. All eligible women
and men were asked to voluntarily provide a blood sample for testing STIs. For children ages
15-17 years, consent for testing was sought from parents or guardians. Of all individuals eligible
11Economic Policy Research Centre - EPRC
HIV/AIDS Sero-prevalence and Socioeconomic Status: Evidence from Uganda.
for interview and testing, 96.8 % of the women and 94.1 % of the men could be tested.9 Of the
eligible individuals who could not be tested, approximately half declined to be tested, and the
rest were absent at the time of the survey. Overall, 19,570 individuals (11, 028 women and
8,541 men) aged 15-49 years were tested, and this is the sample that was used in our analysis.
In addition to determining HIV status, the survey also addressed the regular DHS indicators,
including educational attainment, reproductive history, sexual activity, and knowledge and
attitudes regarding STIs. Below, we describe the particular variables used in our analysis.
3.3 Variables used.
3.3.1 Dependent variables
HIV Infection status: As noted earlier, the survey tested eligible women and men for HIV and
other STIs. The results of the laboratory tests indicate which individuals are HIV positive, and
this is our indicator of HIV infection.
Condom Use: For individuals who had had sex in the past 12 months, the survey asked
whether they used a condom during their last sexual encounter. We use this information as
the dependent variable, condom use.
Concurrent sexual relations: The survey asked questions about number of partners with whom
the respondents had had sex in the 12 months preceding the survey, the types of relationships
that they had with these partners, and the overall number of sexual partners that they had
had in their lives. Within the realm of multiple sexual partners, we focus on concurrent sexual
relationships as these are considered more risky than for example polygamous unions (Ministry
of Health, et al., 2012). Following the UNAIDS classification, concurrent sexual relations
are defined as ‘overlapping sexual partnerships where intercourse with one partner occurs
between two acts of intercourse with another partner’ (UNAIDS, 2009). We consider two
variants of concurrent sexual relationships: occurring in the past 6 months (point estimate)
and occurring in the past 12 months (cumulative estimate).
Alcohol use during sex: For sexually active individuals over the past one year, the survey
inquired whether the respondent or their partners drunk alcohol during the last sexual act
over the past 12 months. We define alcohol use if at least one sexual partner was drunk.
HIV testing: The respondents were also asked how many times they had ever taken an HIV test
and whether they had collected the results and whether they have ever tested as a couple. In
addition, women are asked if they had received the test as part of their antenatal services. We
9 The variance between women and men is because men were more likely to be absent from home than women.
12 Economic Policy Research Centre - EPRC
HIV/AIDS Sero-prevalence and Socioeconomic Status: Evidence from Uganda.
define three variables relating to HIV testing: (1) Having ever taken an HIV test; (2) Having ever
taken an HIV test as a couple; and (3) Having received an HIV test as part of antenatal visit.
3.3.2 Independent variables
Demographics: To capture each individual’s demographic characteristics, we consider the
following indicators: age and marital status (married polygamy etc.). The age of the individual
is meant to indicate the extent of the person’s susceptibility to STIs. We include the following
age categories 15-19 years, 20-24 years, 25-29 years, 30-39 years, and 40-49 years. In addition,
we undertake separate estimations for the youth (aged 15-24 years) since they have a relatively
shorter experience of sexual activities compared to older persons. Other age variables
considered include age of the cohabiting partners which may reflect some form of bargaining
in sexual relations within the household. We also estimate separate regressions for women
and men due to previous evidence showing differences in sexual behaviours between women
and men (Dunkle et al., 2004; Jewkes et al., 2003)—especially in forced sex relations.
The other demographic variables used include marital status. Specifically, for each independent
variable, we estimate separate regressions for either married women or men since the
Ugandan public health literature highlight the fact that new HIV infections are highest among
married couples (Uganda AIDS Commission, 2009). Consequently it is important to understand
any differences in sexual behavior among married persons. In addition, the married dummy
variable, we also include an indicator for presence of a polygamous union. The consideration
of polygamy is guided by the fact it remains pervasive in Uganda—at least 25% of women
and 16% of women in our sample are in polygamous union. Secondly, apart from polygamy
increasing the risks of one man infecting multiple partners with STIs, there is evidence to show
that in other African countries, women in polygamous marriages are more likely to engage in
extra marital sexual relationships (de Walque, 2007b).
Socioeconomic characteristics: The major socioeconomic characteristics are related to
educational attainment and proxies for wealth status. We include two major variables to
capture to capture education attainment: number of completed years for primary and
secondary school. Apart from representing the accumulated human capital of the individual,
the education variables may also signal an individual’s ability to receive and process health
information. The survey, similar to the regular DHS surveys, did not solicit information on
household income and did not capture information on household consumption, an effective
income proxy. Following earlier studies that have utilized DHS-type surveys examining sexual
behaviors (e.g. Corno and de Walque, 2012; Ssewanyana and Younger, 2008; Sahn and Stifel,
2003); we use a durable good index as a proxy for household income or wealth. The items
considered for the durable goods index are: radio, television, fridge, motor cycle, car, and
having electricity.
13Economic Policy Research Centre - EPRC
HIV/AIDS Sero-prevalence and Socioeconomic Status: Evidence from Uganda.
Interaction terms: In order to account for life cycle effects on education and wealth status and
the differential impacts of wealth on certain groups, we also include a number of interaction
e.g. (i) between education attainment and wealth status; and (ii) between age categories and
wealth status.
Religious affiliation: As demonstrated by previous authors (e.g. Glick and Sahn, 2009 for
Madagascar), religious beliefs and influences can be important determinants of sexual
behaviours and consequently reduce the risk of HIV infection. We include dummy variables
for the majorly religious denomination i.e. Catholics, Anglican, Moslems, and other religious
denominations (Pentecostals, Baha’i etc.).
Supply level proxy variables: We include a number of variables to proxy for supply level access
to health facilities. In particular, I include: (i) cluster level average to distance to health facilities
and (ii) distance to the market. In addition, in some estimation, we include cluster level
variables for: (iii) HIV testing and (iv) male circumcision coverage.
Location variables: To capture the environment faced by the individual, we include dummies
for urban location. We also include regional dummies to capture location heterogeneity and
ethnicity. The means of the key variables, disaggregated by gender, are provided in Table 1.
14 Economic Policy Research Centre - EPRC
HIV/AIDS Sero-prevalence and Socioeconomic Status: Evidence from Uganda.
4.0 RESULTS
4.1 Descriptive results of sexual behavior and HIV program coverage.
Table 2 shows how individual sexual behavior varies by gender and also age category—
particularly the youth aged 15-24 years. The average age at first sexual intercourse for women
is 16.6 years while their average age at marriage is 17.6. The corresponding statistics for men
are 17.8 years and 22.5 years respectively. The above figures suggest that most women marry
within one year of their sexual debut while men take on average 5 years from sexual debut to
marriage. Table 2 also shows that at least 30% of the young women and 44% of young men
aged 15-24 years are yet to initiate sexual activity i.e. are abstaining from sex. Concurrent
sexual relationships are predominant among men; among women, it is women resident in
urban areas that exhibit concurrent relationships in the past 12 months—3.5%. Also worth
noting is that 6.3% of male youth were engaged in concurrent sexual relationships during the
past 12 months. Finally, alcohol use during sex is significant in both women and men.
With regard to testing for HIV virus, Table 2 shows that more women than men have tested for
HIV. At least 70% of women have tested for HIV compared to 47% for men. The higher testing
rates among women may be attributed to receiving tests during the regular antenatal visits.
Also, there is significant urban bias towards HIV testing with average rates in urban areas at
least 10 percentages higher than average national rates. Furthermore, a large proportion of
individuals have tested more than while only about 20% of individuals have tested for HIV as
couple—the rates are about similar in both rural and urban areas.
With regard to HIV infection, the average rate among women is 8.3% compared to 6.1% for
men. Whereas the HIV infection rates for men are similar across spatial location, for women,
HIV infection rates are higher for urban residents by at least 3 percentage points. Among HIV
positive individuals, only 31% of women and 20% of men have undertaken a CD4 count test
to establish their immunity levels. Based on the CD4 count tests undertaken as part of the
survey, at least one in four individuals that tested HIV positive have a CD4 count below 350—a
level below which the World Health Organization (WHO) recommends starting antiretroviral
therapy (WHO, 2010). On the other hand, Table 2 shows that of HIV positive individuals about
22% of women and 16% of men are accessing ARTs.
4.2 Concurrent sexual relationships
Table 3 shows the correlates for having concurrent sexual relations in the past year for women
and men. The table shows the marginal effect as well the corresponding regression coefficient
and stand error of the coefficient. For women, it is also indicated that older women (aged 40-
49 years) are least likely to engage in concurrent sexual relations compared to women aged 15-
15Economic Policy Research Centre - EPRC
HIV/AIDS Sero-prevalence and Socioeconomic Status: Evidence from Uganda.
19 years. Furthermore, the results in column one indicates that urban women are significantly
more likely to maintain concurrent sexual relationships. However, when only married women
are considered in column II, the magnitude and significance of the urban control reduces;
however, it remains significant for young women as indicated in column V. This suggests this
suggests that it is mainly single young women in urban areas that have multiple sexual partners.
Previous research shows that residence in urban areas can increase the supply of potential
sexual partners due to wider interaction with outsiders than is the case in rural areas (Glick
and Sahn, 2009). Finally, with respect to the interactions, young married women aged 20-24
years from relatively well-do households are significantly more likely to have extra marital sex
compared to married women aged 15-19 years.
Turning to the correlates of concurrent sexual partners for men (columns 6-12), Table 3 shows
that middle aged men are significantly more likely to maintain concurrent sexual relations. In
particular, men aged 30 years and above are about 14% more likely to maintain concurrent
sexual relations than men aged 15-19 years, all else held constant. It is also worth noting that
among married men, those in polygamous relations are not significantly different from their
non-polygamous counterparts with regard to engaging in extra marital sex. Finally, among
married men, the variable for age of cohabiting partner is positive and significant suggesting
that men are more likely to stray as their spouses become older into cross generation sex
relationships.
We do not find any significant influence of education attainment on maintaining concurrent
sexual relations over the past year—for both women and men. Similarly, there is no significant
impact of wealth as a driver of extra-marital sex for both women and men. The interactions
of education and wealth as well as wealth and age are insignificant as well. Finally, we also
considered the possibility of community level variables driving sexual behaviour and estimated
community fixed effects regressions. The fixed effects results (not indicated in the table) for
correlates of concurrent sexual partners remained largely the same as the results reported in
Table 3.
4.3 Condom use
The second sexual behaviour we consider is the use of a condom during the last causal sex
encounter. Advocacy for the use of condoms has been a major component of Uganda’s ABC
strategy and current National HIV prevention strategy (2011-2015) proposes to increase the
cconsistent use of condoms during risky sexual encounters from 50% to 80% by 2015 (Uganda
AIDS Commission, 2011). Given such relatively low condom use during causal sex, it important
to understand which groups consistently use condoms—possibly as means of preventing the
spread of STIs including the HIV virus. The results for correlates of condom use during risky
sex are reported in Table 4 and it is revealed that for women, higher education attainment is
16 Economic Policy Research Centre - EPRC
HIV/AIDS Sero-prevalence and Socioeconomic Status: Evidence from Uganda.
associated with increased condom use but the education effect is only significant among single
young women. Each additional of post primary schooling increases condom use by 3% among
young women compared to counterparts without education. The significance of education
for women may be explained by the fact that highly educated women in SSA are not only
heavily exposed to safe sex information, but are more likely to engage in premarital sexual
relationships (Glick and Sahn, 2007); and maintain concurrent sexual partners (Espetein,
2007). An alternative explanation could be that highly educated women are more assertive,
appreciate and understand the costs of risky sexual behavior and as a consequence are more
likely to demand the use of a condom with non-regular sexual partners.
For all specifications, married individuals especially men less likely to use condoms. This is
consistent with earlier research showing that the surge in use of condoms in SSA has been
mainly among the unmarried (Glick and Sahn, 2009). However, among married men, higher
wealth status as captured by the durable goods index is positive and highly significantly
associated with increased condom use. Assuming that the use of condoms among married is
predominantly for casual sex, the above result can be linked to the fact that multiple sexual
partners can be considered a normal good (whose consumption increases with wealth)—
following the sexual adventure literature (de Walque, 2007a). On the other hand, urban youths
are significantly more likely to use condoms. Also, condom use among married men decreases
with age and this may be explained by the fact that safe sex information in Uganda has mainly
targeted young people.
For the various estimations for correlates of condom use during causal sex we include cluster
level variables for access to health services—to proxy supply level variables for access to health
services. In particular, we include indicators for cluster level HIV testing—a proxies for use of
health services and the log of distance to nearest health facility. The results in Table 4 show
that it is only the distance to clinics that is significant and only for women. Each additional
kilometer to the nearest health facility reduces condom use by women by as much as 2%. Given
that increasing distance can be interpreted as cost, this particular finding suggests that there
is limited access to condoms among poorer married women. For men, cluster level testing for
HIV is also significantly associated with increased condom use among married men. This latter
result suggest that married men who are able to know their HIV status are able to receive
information on safe sex practices including condom use and this is in line with the current
Uganda National HIV prevention strategy 2011-2015 (Uganda AIDS Commission, 2011).
For the regressions for young women and men (aged 15-24 years), the results for the interaction
terms in Table 4 show that wealth may not matter as much for younger than older persons.
The results show that wealth is more important for younger women than older women with
regard to the use of condoms. On the other hand, the interaction term for higher education
17Economic Policy Research Centre - EPRC
HIV/AIDS Sero-prevalence and Socioeconomic Status: Evidence from Uganda.
and wealth is negative and significant suggesting that higher education does not matter for
women in well-to-do households, possibly higher education and wealth status are substitutes
in the demand for safe sex practices.
4.4 Alcohol use during sex
The other major sexual behaviour we consider is alcohol use during sex. There are important
reasons for considering alcohol use during sex in Uganda. The 2011 UAIS shows that the HIV
prevalence for men who used alcohol during sex (11.2%) is about double that for men who do
not use alcohol (5.8%). There is also substantial difference between women—10% of women
who have used alcohol during sex in the past 12 months were HIV positive compared to rate
of 7.6% for women who did not use alcohol (Ministry of Health et al, 2012). Table 5 shows
that for women alcohol use increases with age. In addition, higher education attainment is
significantly associated with the reduced risk of being drunk during the last sexual encounter.
Each additional year of secondary education reduces the risk of alcohol use during sex by as
much as 3%. However, the interaction terms between age and wealth as well as between
education and wealth are all not significant. When only married women are considered,
the age effect disappears suggesting that age controls may be highly correlated with marital
status. However, the education effects remain the same regardless of marital status. Overall,
the results for women suggest that it is mainly married women who use alcohol prior to sex.
Among men, it is mainly men resident in urban areas that use alcohol during sex. In addition,
the negative and significant effect of education on alcohol use is sustained for men; however,
it mainly the effect of years of primary education that is most consistent. Furthermore for
the married category, the interaction of primary education and wealth status is significant
suggesting that for married men, at higher levels of welfare status, increasing primary education
is associated with alcohol use.
4.5 Ever tested for HIV
As mentioned previously, the limited knowledge that individuals have about their HIV status
is seen as one reason why the HIV virus spread at fast pace in SSA. In Uganda, HIV testing
coverage has increased tremendously in the past seven years—from 15% for women and 12%
for men aged 15-49 years in 2004/5 (Ministry of Health and ORC Macro, 2006) to over 69% for
women and 47% for men by 2011 (Table 1). Notwithstanding the relatively high HIV testing
coverage rates, we examine the correlates of ever testing for women and men. The survey
asks how many times an individual has tested for HIV prior to the survey; whether tests were
undertaken as couple; and whether HIV tests were received as part a routine antenatal visit
(for women).
18 Economic Policy Research Centre - EPRC
HIV/AIDS Sero-prevalence and Socioeconomic Status: Evidence from Uganda.
The marginal effects of the correlates of testing for HIV prior to the survey are reported in
Table 6. It is indicated that higher education attainment of women is associated with increased
testing; each additional year of either primary or secondary education increases the likelihood
of HIV testing by about 2%. In addition, age effects as well as the interactions between age and
wealth are statistically significant. The age effects may be explained by the fact that HIV testing
among women is linked with attendance of antenatal clinics and most of the female child
bearing occurs during the ages of 20-29 years. Furthermore, the interaction terms between
age and wealth status reveals that it mainly middle aged and older married women from well-
to-do households that undertake the HIV tests. Also urban women are about 6% more likely to
test for HIV than their rural counterparts, all else held constant.
Education is of also of particular importance to men—each year of secondary education
increase the likelihood of HIV testing by about 3%, all else constant. However, the interaction
terms between education and wealth are insignificant unlike the case for women above. It
is also worth noting that among men there are no significant differences between rural and
urban areas with regard to HIV testing. Table 6 also shows that men in polygamous marriages
are significantly less likely to be tested for HIV than their single counterparts.
For cluster level variables, an increase in the distance of the clinic significantly reduces HIV
testing among women and this suggests that there are some costs involved in accessing HIV
related services. These particular results are similar to those obtained regarding condom use
among women (reported in Table 4) and this may suggest that women face relatively similar
constraints in accessing HIV related services. On the other hand, supply level proxies are
insignificant for the male regressions and this also suggests that higher than average female
testing may be driven by access to antennal services, an issue we examine below.
As earlier mentioned, the survey inquired from married individuals whether they tested as
couple. We undertook separate estimates for couples and the results (not presented in the
table) indicate that younger and middle aged individuals are more likely to test as couple.
Furthermore, higher education attainment is associated with an increased and significant
likelihood of both women and men testing as couple. On the other hand, community level
variables appear unimportant for testing as a couple. In addition, we also examined which
women are likely to receive an HIV test during routine antennal visits. The results (also not
presented in the table) indicated that it mainly women in the prime of child bearing that use
antenatal services and receive testing as part of the services. Distance to health facilities is
major determinant of whether women receive HIV tests at antennal clinics.
19Economic Policy Research Centre - EPRC
HIV/AIDS Sero-prevalence and Socioeconomic Status: Evidence from Uganda.
4.6 Male circumcision
As earlier mentioned, scaling up of safe male circumcision (SMC) services is now a key
component in Uganda’s National HIV Prevention strategy and the Ministry of Health initiated
SMC campaigns in 2010. As such, in Table 7, we examine the correlates of male circumcision
in 2011 and it is indicated that circumcision generally increases with age and wealth status.
This may suggest that circumcision services may only be available in private health facilities
frequented by the relatively well-to-do. Overall, most of the policy variables are insignificant.
Among married men, with the exception of urban residence—which may also be linked to wealth
status mentioned above, there are hardly any significant correlates for male circumcision. This
particular result suggests that most men enter marriage when already circumcised. Indeed,
male circumcision prior to initiation of sexual behaviour can occur due to religious rites (e.g.
among Muslims) or ethnic driven practices (e.g. the imbalu male circumcision ritual practiced
among the Bagisu in Eastern Uganda).
A comparison of the two available sero behavioural surveys in Uganda confirms that there
has not been any significant change in male circumcision rates during the six years—only 25%
of men aged 15-49 years were circumcised in both 2004/5 and 2011 and more 80% of these
were circumcised before the age of 20 years (Ministry of Health et al, 2012). Furthermore, the
2011 UAIS survey also reveals that 50% of the un-circumcised men would be willing to have
the operation. This suggests that there has that there has been limited roll out of the SMC
campaign despite extensive evidence from African countries showing that male circumcision
can reduce the risk of HIV infection by as much as 50% (Weiss et al., 2000).
The current National HIV prevention strategy (2011-2015) proposes to increase male
circumcision rates to 80% by 2016 through conduction 4.2 million safe male circumcision
operations (Uganda AIDS Commission, 2011). However, major health stakeholders such as the
World Health Organization (WHO) have also pointed to the fact that Uganda has failed to invest
significant resources towards SMC. Part of the reason for the lacklustre male circumcision
rates in Uganda is the lack of national champion despite the potential for male circumcision
to reduce new HIV infection. The president of Uganda has been one of the main opponents to
SMCs—especially as an intervention targeting the youth. Indeed, in December 2012, during
both the national celebrations to mark the 2012 World AIDS Day and the end of year national
address, the President of Uganda reaffirmed his opposition to SMC as an HIV prevention
strategy and accused the Uganda AIDS Commission for allowing such confusing messages to
be propagated in Uganda. According to the President,
“Circumcision will not make a man “metallic” and therefore immune to HIV infection”
20 Economic Policy Research Centre - EPRC
HIV/AIDS Sero-prevalence and Socioeconomic Status: Evidence from Uganda.
4.7 The risk of HIV infection and self-perceived chances of contracting HIV.
Table 8 reports the marginal effects and coefficients associated with the risk of testing HIV
positive among women and men. The results for women indicate that age is a significant
correlate of testing HIV positive—older married women are significantly more likely to test
HIV positive and this may be linked to life cycle effects e.g. longer duration in marriage and
its associated risk of exposure to HIV infection. Other significant demographic variables
include the presence of a polygamous union—women in polygamous marriages are 2% more
likely to test HIV positive than their counterparts in non-polygamous unions. For all women,
urban residence is associated with a 4% increased risk of testing HIV positive. However, the
significance of the urban dummy is eliminated when either the married or young women are
considered. This suggests that it may be older single women in urban areas driving the above
results. Our earlier findings regarding the correlates of concurrent sexual partners and condom
use among women (reported in Tables 3 and 4) partly confirm this hypothesis of higher HIV
prevalence among older unmarried women. Given that these are older women, it is possible
that such women have had previous sexual relationships and are currently unmarried due
either divorce or widowed. Related, there is a possibility that after women lose their husbands
to HIV, they move and settle in urban areas.
Also, higher educational attainment is significant and negatively related to risk of testing HIV
positive. Each additional year of secondary schooling reduces the likelihood of testing positive
for HIV among women by as much as 4%—especially among young women. In addition, the
interaction term for secondary education and wealth status is significant suggesting that rich
educated young women are more likely to test HIV positive. The particular result may explained
by the fact that this category of women is less likely to use condom as highlighted in Table 4.
Finally, for women, the community variables that proxy for health supplies are all insignificant.
The education results for men are counter-intuitive—additional years of education of primary
and secondary education area not significantly associated with reducing risk of testing
HIV positive. However, for married men, the interaction term between years of secondary
education and wealth status is negative and significant. This suggests that higher education
attainment and wealth may be complements in the HIV infection process as documented in
earlier studies (e.g. Glick and Sahn, 2007). Nonetheless, this would be at odds with our sexual
adventure hypothesis of increasing sexual partners with increased education and wealth noted
earlier and would also be contrary to earlier studies on HIV infection in SSA that showed the
risk of HIV infection increasing with increases in wealth status (see, e.g., Corno and De Walque
2007 for Lesotho). Table 8 also shows that unlike the case for women, among men, the urban
risk of testing HIV positive is maintained among married men as well as all men combined.
Urban residence—which is also associated with higher welfare status—is associated with a 5%
21Economic Policy Research Centre - EPRC
HIV/AIDS Sero-prevalence and Socioeconomic Status: Evidence from Uganda.
increase in the risk of testing HIV positive for men. Finally, as was the case for women, none
of the supply level community variables have a significant impact on the risk of testing HIV
positive and among young men, all covariates appear insignificant. The latter result may be
explained by the fact that a substantial proportion of young men are yet to make their sexual
debut and also the HIV prevalence among this demographic group is very low—2.1% for men
aged 15-19 years compared to 6.1 for all men aged 15-49 years (Ministry of Health et al, 2012);
consequently, we may be dealing with very few observation of HIV positive young men.
Self-Reported Risk of HIV infection
As earlier mentioned, the survey inquired from individuals about the self-reported chances
of contracting HIV. The possible answers were: high chance; low chance; and do not know.
These qualitative responses are important since a large proportion of individuals consider
themselves to be at a high risk of contracting HIV/AIDS (Table 2 shows that at least 30% of
women and 20% of men rate their chances of contracting HIV as high). Furthermore, these
qualitative responses allow us to gauge if the correlate of the risk of testing HIV positive
and the self-perceived risks of contracting HIV are similar. Table 9 shows the results for the
correlates of a high self-perceived risk of contracting HIV for women and men. For women,
the results indicate that middle aged when significantly consider their chances of HIV infection
as high. Furthermore, the negative and significant interaction terms between age and wealth
status indicate that that is it mainly poor women who rate their chances of contracting HIV as
high. However, when only married women are considered, most of the age controls become
insignificant with the exception for women aged 30-39 years. This may suggest that is mainly
women out of marital unions i.e. single, divorced/separated and widowed women—who rate
their chances of contracting HIV as high. Such categories of women are usually vulnerable and
more deprived than their married counterparts and this main explain the significance of the
age and wealth interaction terms mentioned above.
It is also worth noting that for the various categories of women estimations, women in urban
areas significantly rate their chances of contracting HIV as low. This is at odds with the observed
sexual behavior—especially relating to maintaining multiple sexual partners in Table 3 and also
the higher likelihood of urban women testing HIV positive especially older women who are
currently not in a marriage (Table 8). Also for all the three different types of estimations for
women, those in a polygamous union have a significantly chance of reporting a higher self-
perceived risk of contracting HIV/AIDS. Furthermore, among married women, the variable for
age of cohabiting partner is negative and significant suggesting that women expect male risky
sexual behavior to reduce with age whereas our earlier results for concurrent sexual partners
(Table 3) showed that multiple sexual partners increase with a woman’s aging.
22 Economic Policy Research Centre - EPRC
HIV/AIDS Sero-prevalence and Socioeconomic Status: Evidence from Uganda.
The results for men contrast sharply to that of women. For instance, younger and older
married men significantly report that their chances of contracting HIV are low; indeed, it is
only young men aged 20-24 years who rate their chances of contracting HIV as significantly
high. Also whereas urban married women significantly rate their chances of contracting HIV
as low, urban residence for married men is associated with 4.5% chance of reporting that an
individual’s chance of contracting HIV are high. We do not find similar effects of polygamy on
the risk of reporting high chances of contracting HIV for men. This suggests that men do not
consider polygamous unions are risky conduits for spreading STIs like the HIV virus, as women
do. It is conceivable that men consider their polygamous sexual partners as faithful whereas
women have a less favorable perception about fidelity in a polygamous setting. The above
results qualitatively show that individuals in Uganda understand that risky sexual behavior can
lead to HIV infection. Why they continue to behavior this way despite the know risks, is not
very clear from the data.
4.8 Sero-Discordance among infected couples
The Ugandan AIDS literature highlights sero-discordance (i.e. where one partner is HIV positive
and another negative) as another major driver of HIV infection (Gray et al, 2001; Mermin et
al., 2008; Uganda AIDS Commission, 2009). According to the modes of transmission analysis
for Uganda, at least 35% of new HIV infections in Uganda are attributed to discordant couples
(Uganda AIDS Commission, 2009)—discordant couples are only second to multiple sexual
partners (37%). In order to further explain the HIV infection environment in Uganda, we
also examine the nature of sero-discordance in Uganda and how it relates to overall sexual
behaviour in Uganda using the 2011 UAIS. Following de Walque (2007b) who examined the
pattern of sero-discordance in five African countries (Burkina Faso, Cameroon, Ghana, Kenya,
and Tanzania), we define four possible states of concordance i.e. (i) concordant negative—
when both partners are HIV negative; (ii) concordant positive—when both partners are HIV
positive; (iii) discordant male—when the male partner is HIV positive and female partner HIV
negative; and finally (iv) discordant female—when the male partner is HIV negative and female
partner HIV positive.
Table 10 shows the estimates for discordance in 2011 and it is indicated that 26% of the infected
couples are discordant. The means in column II show that female discordance accounts for 60%
of the overall discordance and this rate is in line with earlier studies e.g. de Walque (2007b)
which showed a higher presence of females among discordant couples. Column III which
considers infected persons who have only been married once shows that female discordance
is not driven by re-marriages. Specifically, women who have been married only once have a
slightly higher rate of female discordance than all infected women (18.8% vs. 15.4%).
Given that discordance is the route to actual concordance and the fact that HIV infection
23Economic Policy Research Centre - EPRC
HIV/AIDS Sero-prevalence and Socioeconomic Status: Evidence from Uganda.
transmission rates are very slow (Gray et al., 2001; Quinn et al., 2000), it is possible that persons
who are discordant have only been married for a shorter duration. We consider couples who
have been cohabiting for at least 10 years—which was considered be the median duration
from infection to HIV/AIDS deaths prior to the advent of ARVs (de Walque, 2007b). Column
IV shows that the rate of both male and female discordance among couples cohabiting for
at least 10 years is nearly similar to the rate for all couples. Finally, we consider whether the
higher female discordance rates are due to polygamy—one male partner infecting a number
of female partners. Column V shows a surprising result—female discordance is substantially
higher among females in non-polygamous unions who have only been married once; however,
this is line with studies in other African countries such as de Walque (2007b) which point
to the possibility of higher than the self- reported rates of extra-marital sex among women.
The above result suggests that married women in Uganda may be engaging in extra marital
sex which is at odds with self-reported low rates of female infidelity. Indeed, in 2011, 3% of
married women reported having concurrent partners in the past 12 months compared to 8.2%
for single women (Ministry of Health et al., 2012). However, only 7% of married women having
concurrent sexual relationships reported using condom compared to 38% for single women.
To the extent that women in such environments do not use protection, this may be driving the
observed HIV/AIDS infection rates—especially female discordance.
In African communities, it is a culturally abominable for a woman to engage in extra-marital
sex and such cultural expectations may bias self-reported responses. Indeed, instances
of miss-reported sexual behaviour are not uncommon in African settings. Studies such as
Gersovitz (2005) as well as Glick and Sahn (2008) show evidence of miss-reporting of age at
first intercourse in African countries. The presence of other persons during the interview has
been documented to result in biased responses during behaviour related surveys (Aquilino
et al., 2000). Consequently, misreporting on extra-marital sexual behaviours may explain the
very low self-reported rates of concurrent sexual relationships in Uganda but a high rate of
female discordance among non-polygamous persons who have only been married once. The
2011 UAIS also documents evidence of inconsistence in self-reported sexual health status.
Specifically, the self-reported HIV prevalence among women and men who had previously
undertaken an HIV test prior to the survey was only about half that established through the
laboratory HIV tests conducted as part of the survey (Ministry of Health et al., 2012). On
the other hand, one can not entirely rule out non-sexual transmission of HIV infections, for
Uganda as well as other African countries. A previous study by Deuchert (2011) shows a large
proportion of self-reported virgins that are HIV positive in Lesotho, Swaziland, and Zimbabwe.
24 Economic Policy Research Centre - EPRC
HIV/AIDS Sero-prevalence and Socioeconomic Status: Evidence from Uganda.
5.0 CONCLUSIONS AND IMPLICATIONS
This paper examines the factors associated with different sexual behaviors as well as the risk
of HIV infection in Uganda, which is a country that has been heralded as exemplary in the fight
against HIV/AIDS but that has recently seen an increase in the rate of new HIV infections. We
use a nationally representative survey that tested individuals aged 15-49 years for HIV virus
and other STIs. In order to the current HIV story for Uganda, we examine the correlates of a
number of sexual behaviours including: maintaining concurrent sexual partners, condom use
during risky sex, and alcohol use during sex. In addition, we also examine correlates for the
use of HIV related services such as testing for HIV, CD-4 testing among HIV positive individuals
and safe male circumcision. Finally, we examine directly the factors associated with the risk of
testing HIV positive, the self-perceived risk of a high chance of contracting HIV, and the nature
of discordance among HIV infected couples. Overall, we find significant gender differences in
terms of sexual behavior. Young women resident in urban areas are more likely to maintain
multiple sexual partners than young men. Proximity to health facilities significantly affects
women’s adoption of safe sex practices.
Our results in section 4 have implications for the current national HIV prevention strategy for
Uganda. First, access to and the cost of health services can be a major hindrance in adopting
safe sex practices. For instance, individuals from well-to-do households are more likely to be
tested for HIV than poorer individuals. Furthermore, there has been a surge in HIV testing
among women and men in Uganda in the past 6 years. Although the majority of HIV testing
services remains free, these facilities are mainly located in urban centers and major hospitals
patronized by richer individuals. Similarly, the use of condoms during sex with casual partners
is most common in urban areas, whose residents can afford the cost of condoms. Consequently,
it is important for the Ministry of Health to continue to subsidize HIV/AIDS services to to
encourage testing” or “to increase the use of these services.
Second, our results point to the importance of education—especially for women—both as a
possible driver for reducing risky sexual behavior and use of key health services. For instance,
higher education attainment is associated with increased use of condoms during risky sex
and the reduced risk of using alcohol during sex. Similarly highly educated women and men
are more likely to have ever undertaken an HIV test compared to their counterparts with
no or poor education. Also highly educated and rich men are less likely to test HIV positive.
Our education results suggest that Uganda’s investment in primary and secondary education
through the UPE and USE programs is a step in the right direction as a long term means of
controlling risky sexual behaviours.
Third, our results show that Uganda has failed to fully operationalize its safe male circumcision
25Economic Policy Research Centre - EPRC
HIV/AIDS Sero-prevalence and Socioeconomic Status: Evidence from Uganda.
campaign—partly due to high level political opposition. Nonetheless, it is important to
emphasize to both to the public and political leadership that SMC is not vaccine and the
interventions is part of a multi-faceted approach to prevent the spread of HIV. Without a
change in the types of messages used to promote SMC and attitudes by the political leadership
regarding SMC, this very important intervention may continue to be neglected in the public
health budget.
Finally, our results regarding the nature of HIV discordance in Uganda point to the possibility
that married women may be engaging more in extra marital sex that what is reported the
demographic and health surveys. At the same time, married women are least likely to use
condoms when engaging in risky sex. To the extent that married women are not targeted
with safe sex information—due to the assumption that it mainly married men affected by
infidelity—implies that this is an important demographic category that is not currently a focus
of attention. The discordance results also points to need emphasize testing HIV as couple so
that appropriate precautions can be undertaken in case one of the partners is sero-discordant.
26 Economic Policy Research Centre - EPRC
HIV/AIDS Sero-prevalence and Socioeconomic Status: Evidence from Uganda.
6.0 REFERENCES
Aquilino, W. S., D, L. Wright, and A. J. Supple (2000). “Response effects due to bystander
presence in CASI and paper-and-pencil surveys of drug use and alcohol use”.
Substance Use and Misuse, 35, 845–867.
Ciantia, F. et al. (2004). “HIV Seroprevalence in Northern Uganda: The Complex
Relationship between AIDS and Conflict.” Journal of Medicine & The Person
2:4.
Cleveland, W. S (1993) Visualising Data AT&T Bell Laboratories. Hobart Press,
Summit, New Jersey.
Corno, L and D. de Walque (2012) “Mines, Migration and HIV/AIDS in Southern Africa”
Journal of African Economies, Vol 21. No. 3: 465-498.
______, (2007) “The Determinants of HIV Infection and Related
Sexual Behaviours: Evidence from Lesotho”. World Bank Policy Research
Working Paper No. 4421.
Djemai, E (2009) “How do Roads Spread AIDS in Africa? A Critique of the Received
Policy Wisdom” Toulouse School of Economics.
Deuchert, E (2011) “The Virgin HIV Puzzle: Can Miss-reporting Account for the High
Proportion of HIV Cases in Self-Reported Virgins?” Journal of African Economies
Vol 20, No1: 60-89.
de Walque, D. and R. Kline (2010) “The Relationship between HIV Infection and
Education: An Analysis of Six Sub-Saharan African Countries” in D. Sahn (ed) The
Socioeconomic Dimensions of HIV/AIDS in Africa: Challenges,
Opportunities, and Misconceptions. Cornell University Press.
de Walque, D. (2009) “Does Education Affect HIV/AIDS Status? Evidence from five
African countries” World Bank Economic Review Vol 23. No. 2: 209-233.
______, (2007a). “How does the impact of an HIV/AIDS information
campaigns vary with educational attainment? Evidence from rural Uganda.”
Journal of Development Economics, 84:2, pp. 686-714.
_____, (2007b) “Sero Discordant Couples in Five African Countries: Implications for
Prevention Strategies.” Population and Development Review. Vol. 33 No. 3:
501-523.
Dunkle KL, R.K. Jewkes., H. C. Brown et al., (2004) “Prevalence and patterns of gender-
based violence and revictimization among women attending antenatal clinics in
Soweto, South Africa”. American Journal of Epidemiology, 160, 230 – 239.
Epstein, H. (2007), The Invisible Cure: Africa, the West, and the Fight Against AIDS.
Penguin Books Ltd, London.
Ferry, B (2001) “Comparison of key parameters of sexual behaviour in four urban
populations with different levels of HIV infection” AIDS Vol 15. S41-50.
27Economic Policy Research Centre - EPRC
HIV/AIDS Sero-prevalence and Socioeconomic Status: Evidence from Uganda.
Fortson, J. G (2009) “HIV/AIDS and Fertility” American Economic Journal: Applied
Economics. Vol 1. No.3: 170-94.
_____, (2008) “The Gradient in Sub-Saharan Africa: Socioeconomic Status and
HIV/AIDS” Demography Vol 45 No. 2: 303-322.
Gersovitz, M (2005) “The HIV Epidemic in Four African Countries seen through the
Demographic and Health Surveys.” Journal of African Economies Vol 14
(June):191-246.
Glick, P (2010) “HIV Prevention in Africa: What Has Been Learned?” in D. Sahn (ed)
The Socioeconomic Dimensions of HIV/AIDS in Africa: Challenges,
Opportunities and Misconceptions. Cornell University Press.
______, (2007) “Reproductive Health and Behaviour, HIV/AIDS, and Poverty in
Africa” Cornell University CFNPP Working Paper No 219.
Glick, P., J. Randriamamonjy and D. E. Sahn (2009) “Determinants of HIV
Knowledge and Condon Use among women in Madagascar: An Analysis
Using Matched Household and Community Data” Africa Development
Review Vol 21. No. 1: 147-179.
Glick, P. J and D. E. Sahn, (2008) “Are African practising Safe Sex: Evidence from
Demographic and Health Surveys for Eight Countries” Economic
Development and Cultural Change Vol 56: 397-439.
_______, (2007) “Changes in HIV/AIDS Knowledge and Testing Behaviour in Africa:
How Much and for whom?” Journal of Population Economics Vol 20 (April):
382-422.
Government of Uganda (2010a) National Development Plan 2010/11-2014/15
(Kampala: National Planning Authority)
______, (2010b). Health Sector Strategic Plan III, 2010-2015. Ministry of Health.
________, (2008). Background to the Budget 2008/09 Fiscal Year: Achieving
Prosperity for all through infrastructure Development Enhancing Employment and
Economic Growth. Ministry of Finance, Planning and Economic
Development, Kampala.
______, (2005a). Health Sector Strategic Plan II, 2005/6-2009/10. Ministry of Health.
_______, (2005b) Annual Health sector performance Report, 2004/5. Ministry of Health,
Kampala.
Gray R.H., Wawer M.J., Brookmeyer R., et al (2001) “Probability of HIV-1 Transmission per
Coital act in Monogamous, Heterosexual, HIV-1-discordant Couples in Rakai,
Uganda”. Lancet 2001 Apr 14; 357:1149-53.
Green, E. C et al (2006) “Uganda’s HIV Prevention Success: The Role of Sexual Behaviour Change
and National Response.” AIDS and Behaviour Vol 10. July: 335-346.
Gregson, S., H. Waddell, and S. Chandiwana (2001) “School Education and HIV Control in Sub
Saharan Africa: From Discord to Harmony” Journal of International Development Vol
28 Economic Policy Research Centre - EPRC
HIV/AIDS Sero-prevalence and Socioeconomic Status: Evidence from Uganda.
13: 467-498.
Jewkes RK, J.B. Levin JB, and L.A. Penn-Kekana LA (2003) “Gender inequalities, intimate
partner violence and HIV preventive practices: findings of a South African cross-
Sectional study”. Social Science and Medicine, 56, 125 – 134.
Lachaud, J. P (2007) “HIV Prevalence and Poverty in Africa: Micro-and macro-econometric
evidence applied to Burkina Faso” Journal of Health Economics Vol. 26: 483-504.
Luke, N. (2008) “Economic Status, Informal Exchange and Sexual Risk in
Kisumu, Kenya” Economic Development and Cultural Change Vol 56: 375-396.
Mermin J., Musinguzi J., Opio A and Kirungi W (2008) Risk Factors for Recent HIV
infection in Uganda. JAMA 2008 Aug 6; 300(5):540-9.
Ministry of Finance Planning and Economic Development, et al (2008) Assessing the
Macroeconomic Impact of HIV/AIDS in Uganda: Phase III Report. Analysis
of the Macroeconomic Impact. Kampala
Ministry of Health, ICF International, CDC-Uganda, et al., (2012) Uganda AIDS Indicator
Survey 2011 (Kampala: Ministry of Health)
Ministry of Health and ORC Macro (2006). Uganda HIV/AIDS Sero-behavioural Survey
2004-2005. (Calverton, Maryland, USA: Ministry of Health and ORC Macro).
Mishra, V et al (2007) “HIV infection does not disproportionately affect the poorest in
Sub-Saharan Africa” AIDS Vol. 21: S17-S28.
Oster, E (2012) “HIV and Sexual Behaviour Change: Why not Africa” Journal of Health
Economics, Vol 31. No. 35-49.
_____, (2005) “Sexually Transmitted Infection, Sexual Behaviour and the
HIV/AIDS Epidemic” Quarterly Journal of Economics Vol. 120. No.2: 467-
515.
Quinn, T. C et al (2000) “Viral load and heterosexual transmission of human
Immunodeficiency virus type I” New England Journal of Medicine. Vol. 342:
921-929.
Sahn, D and D. Stifel (2003) “Exploring Alternative Measures of Welfare in the
Absence of Expenditure Data” Review of Income and Wealth. Vol. 49. No.4:
463-489.
Serwadda, D et al., (1995) “The Social dynamics of HIV transmission as reflected
through discordant couples in rural Uganda” AIDS Vol. 9: 745-750.
Ssewanyana, S and S.D. Younger (2008) “Infant Mortality in Uganda: Determinants, Trends, and Millennium Development Goals” Journal of African Economies
Vol. 17. No.1: 34-61.
Uganda AIDS Commission (2011) National HIV Prevention Strategy 2011-2015: Expanding and Doing HIV Prevention Better (Kampala: Uganda AIDS Commission).
_________, (2009) Uganda Modes of Transmission Study. Kampala: Uganda
AIDS Commission.
29Economic Policy Research Centre - EPRC
HIV/AIDS Sero-prevalence and Socioeconomic Status: Evidence from Uganda.
_________, (2008) UNGASS Country Progress Report Uganda: January 2006 to December
2007. Kampala Uganda AIDS Commission.
UNAIDS (2012). UNAIDS Report on the Global AIDS Epidemic 2012. Geneva: UNAIDS.
UNAIDS (2009). Consultation on Concurrent Sexual Partnerships: Recommendations from a
Meeting of the UNAIDS Reference Group on Estimates, Modelling and Projections
held in Nairobi, Kenya, April 20-21, 2009. London: UNAIDS.
Weiss, H. A., M. A. Quigley and R. J. Hayes (2000). “Male circumcision and risk of HIV
infection in sub-Saharan Africa: a systematic review and meta-analysis.”. Aids. 2000
14 (15): 2361–70
World Health Organization (2010) “Antiretroviral therapy for HIV infection in adults and
adolescents: recommendations for a public health approach, 2010 revision,”
http://www.who.int/hiv/pub/arv/adult2010/en/index.html.
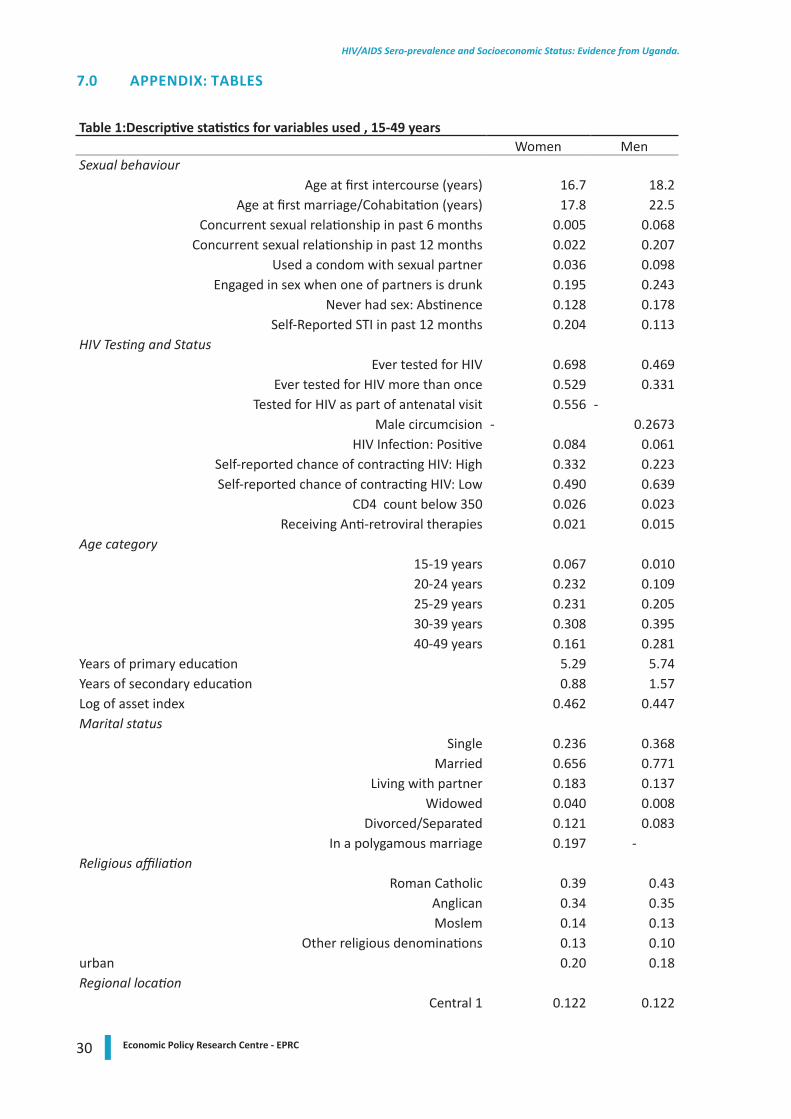
30 Economic Policy Research Centre - EPRC
HIV/AIDS Sero-prevalence and Socioeconomic Status: Evidence from Uganda.
7.0 APPENDIX: TABLES
Table 1:Descriptive statistics for variables used , 15-49 years Women MenSexual behaviour
Age at first intercourse (years) 16.7 18.2Age at first marriage/Cohabitation (years) 17.8 22.5
Concurrent sexual relationship in past 6 months 0.005 0.068Concurrent sexual relationship in past 12 months 0.022 0.207
Used a condom with sexual partner 0.036 0.098Engaged in sex when one of partners is drunk 0.195 0.243
Never had sex: Abstinence 0.128 0.178Self-Reported STI in past 12 months 0.204 0.113
HIV Testing and StatusEver tested for HIV 0.698 0.469
Ever tested for HIV more than once 0.529 0.331Tested for HIV as part of antenatal visit 0.556 -
Male circumcision - 0.2673HIV Infection: Positive 0.084 0.061
Self-reported chance of contracting HIV: High 0.332 0.223Self-reported chance of contracting HIV: Low 0.490 0.639
CD4 count below 350 0.026 0.023Receiving Anti-retroviral therapies 0.021 0.015
Age category15-19 years 0.067 0.01020-24 years 0.232 0.10925-29 years 0.231 0.20530-39 years 0.308 0.39540-49 years 0.161 0.281
Years of primary education 5.29 5.74Years of secondary education 0.88 1.57Log of asset index 0.462 0.447Marital status
Single 0.236 0.368Married 0.656 0.771
Living with partner 0.183 0.137Widowed 0.040 0.008
Divorced/Separated 0.121 0.083In a polygamous marriage 0.197 -
Religious affiliationRoman Catholic 0.39 0.43
Anglican 0.34 0.35Moslem 0.14 0.13
Other religious denominations 0.13 0.10urban 0.20 0.18Regional location
Central 1 0.122 0.122
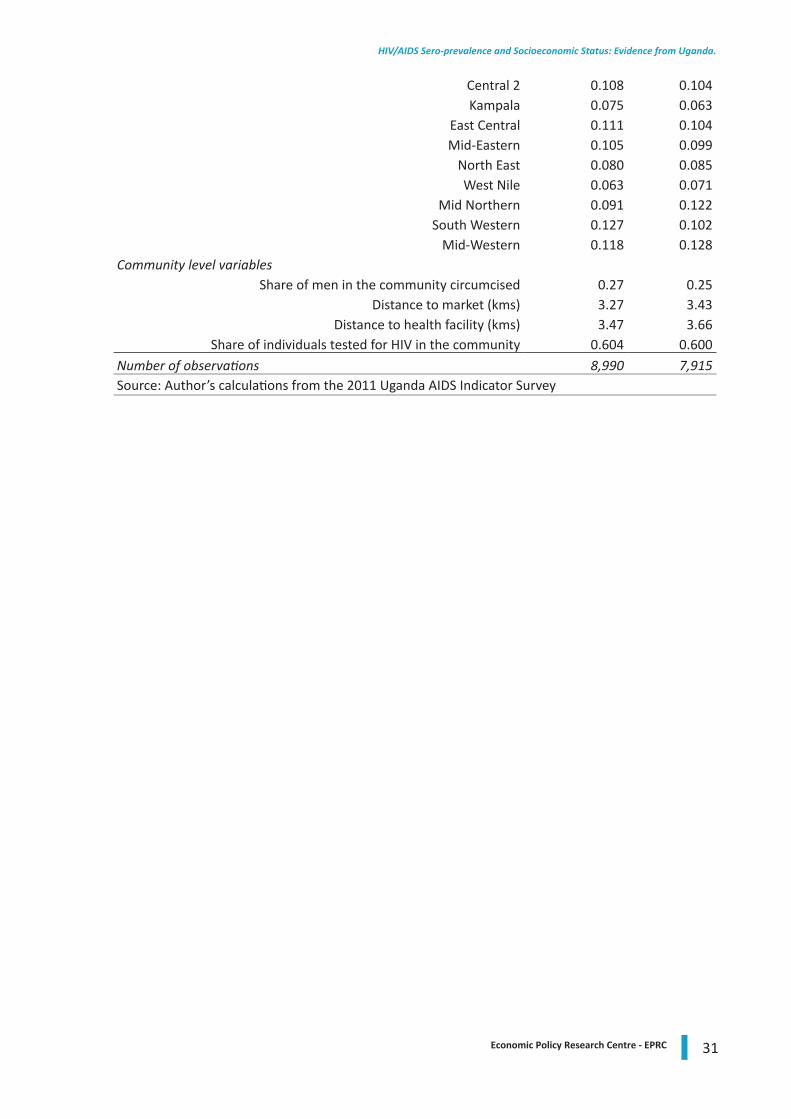
31Economic Policy Research Centre - EPRC
HIV/AIDS Sero-prevalence and Socioeconomic Status: Evidence from Uganda.
Central 2 0.108 0.104Kampala 0.075 0.063
East Central 0.111 0.104Mid-Eastern 0.105 0.099
North East 0.080 0.085West Nile 0.063 0.071
Mid Northern 0.091 0.122South Western 0.127 0.102
Mid-Western 0.118 0.128Community level variables
Share of men in the community circumcised 0.27 0.25Distance to market (kms) 3.27 3.43
Distance to health facility (kms) 3.47 3.66Share of individuals tested for HIV in the community 0.604 0.600
Number of observations 8,990 7,915Source: Author’s calculations from the 2011 Uganda AIDS Indicator Survey
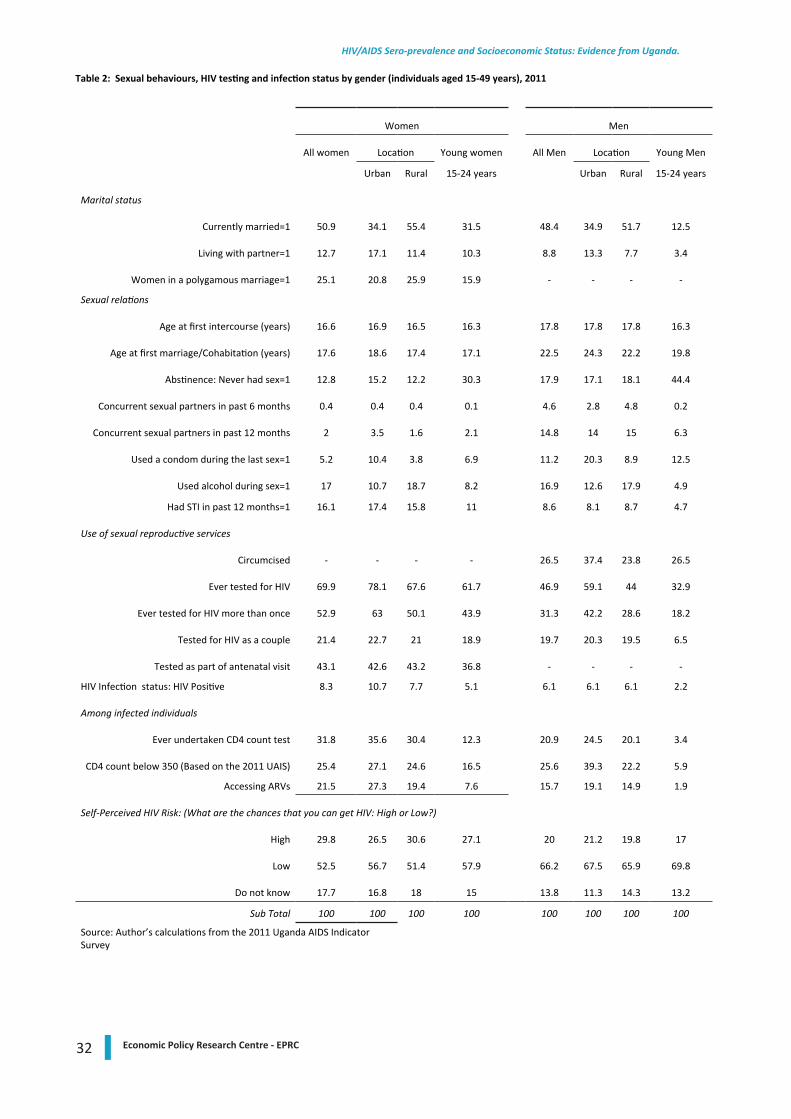
32 Economic Policy Research Centre - EPRC
HIV/AIDS Sero-prevalence and Socioeconomic Status: Evidence from Uganda.
Table 2: Sexual behaviours, HIV testing and infection status by gender (individuals aged 15-49 years), 2011
Women Men
All women Location Young women All Men Location Young Men
Urban Rural 15-24 years Urban Rural 15-24 years
Marital status
Currently married=1 50.9 34.1 55.4 31.5 48.4 34.9 51.7 12.5
Living with partner=1 12.7 17.1 11.4 10.3 8.8 13.3 7.7 3.4
Women in a polygamous marriage=1 25.1 20.8 25.9 15.9 - - - -
Sexual relations
Age at first intercourse (years) 16.6 16.9 16.5 16.3 17.8 17.8 17.8 16.3
Age at first marriage/Cohabitation (years) 17.6 18.6 17.4 17.1 22.5 24.3 22.2 19.8
Abstinence: Never had sex=1 12.8 15.2 12.2 30.3 17.9 17.1 18.1 44.4
Concurrent sexual partners in past 6 months 0.4 0.4 0.4 0.1 4.6 2.8 4.8 0.2
Concurrent sexual partners in past 12 months 2 3.5 1.6 2.1 14.8 14 15 6.3
Used a condom during the last sex=1 5.2 10.4 3.8 6.9 11.2 20.3 8.9 12.5
Used alcohol during sex=1 17 10.7 18.7 8.2 16.9 12.6 17.9 4.9
Had STI in past 12 months=1 16.1 17.4 15.8 11 8.6 8.1 8.7 4.7
Use of sexual reproductive services
Circumcised - - - - 26.5 37.4 23.8 26.5
Ever tested for HIV 69.9 78.1 67.6 61.7 46.9 59.1 44 32.9
Ever tested for HIV more than once 52.9 63 50.1 43.9 31.3 42.2 28.6 18.2
Tested for HIV as a couple 21.4 22.7 21 18.9 19.7 20.3 19.5 6.5
Tested as part of antenatal visit 43.1 42.6 43.2 36.8 - - - -
HIV Infection status: HIV Positive 8.3 10.7 7.7 5.1 6.1 6.1 6.1 2.2
Among infected individuals
Ever undertaken CD4 count test 31.8 35.6 30.4 12.3 20.9 24.5 20.1 3.4
CD4 count below 350 (Based on the 2011 UAIS) 25.4 27.1 24.6 16.5 25.6 39.3 22.2 5.9
Accessing ARVs 21.5 27.3 19.4 7.6 15.7 19.1 14.9 1.9
Self-Perceived HIV Risk: (What are the chances that you can get HIV: High or Low?)
High 29.8 26.5 30.6 27.1 20 21.2 19.8 17
Low 52.5 56.7 51.4 57.9 66.2 67.5 65.9 69.8
Do not know 17.7 16.8 18 15 13.8 11.3 14.3 13.2
Sub Total 100 100 100 100 100 100 100 100
Source: Author’s calculations from the 2011 Uganda AIDS Indicator Survey
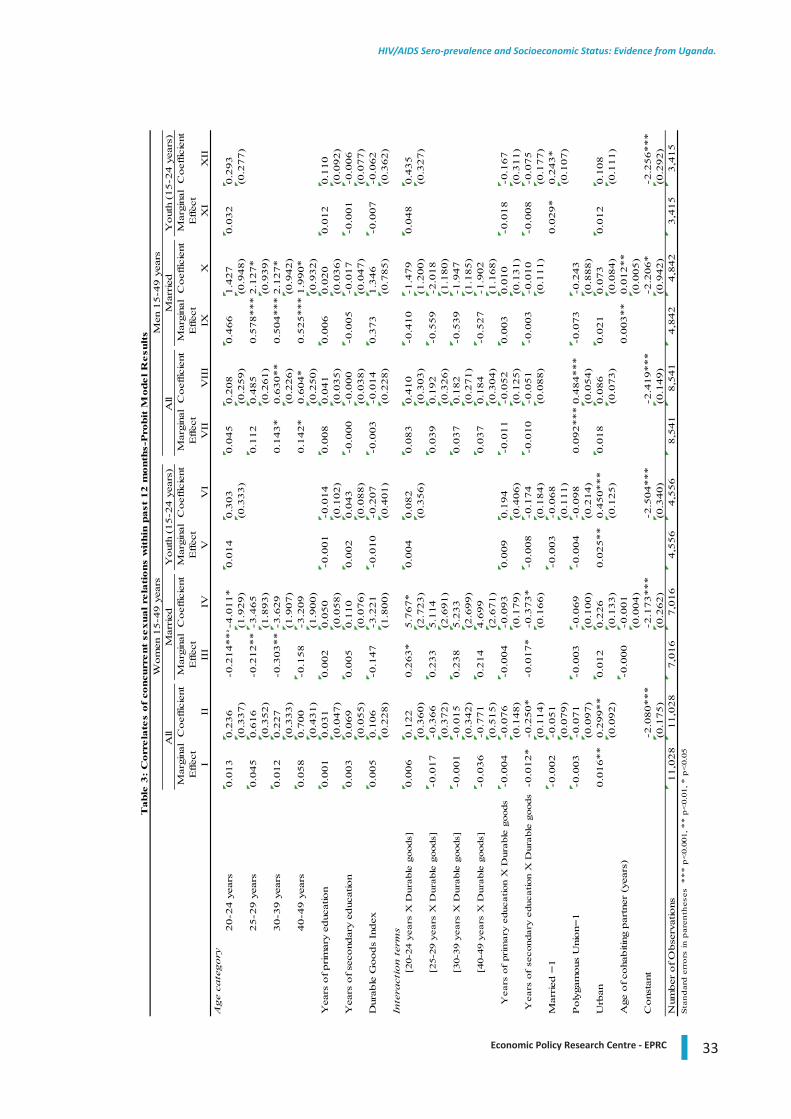
33Economic Policy Research Centre - EPRC
HIV/AIDS Sero-prevalence and Socioeconomic Status: Evidence from Uganda.
Mar
gina
lC
oef
ficie
ntM
argi
nal
Coef
ficie
ntM
argi
nal
Coef
ficie
ntM
argi
nal
Coef
ficie
ntM
argi
nal
Coef
ficie
ntM
argi
nal
Coef
ficie
ntE
ffec
tE
ffec
tE
ffec
tE
ffec
tE
ffec
tE
ffec
tI
IIII
IIV
VV
IV
IIV
III
IXX
XI
XII
Age
cate
gory
20-2
4 y
ears
0.0
13
0.2
36
-0.2
14*** -
4.0
11*
0.0
14
0.3
03
0.0
45
0.2
08
0.4
66
1.4
27
0.0
32
0.2
93
(0.3
37)
(1.9
29)
(0.3
33)
(0.2
59)
(0.9
48)
(0.2
77)
25-2
9 y
ears
0.0
45
0.6
16
-0.2
12**
-3.4
65
0.1
12
0.4
85
0.5
78***
2.1
27*
(0.3
52)
(1.8
93)
(0.2
61)
(0.9
39)
30-3
9 y
ears
0.0
12
0.2
27
-0.3
03**
-3.6
29
0.1
43*
0.6
30**
0.5
04***
2.1
27*
(0.3
33)
(1.9
07)
(0.2
26)
(0.9
42)
40-4
9 y
ears
0.0
58
0.7
00
-0.1
58
-3.2
09
0.1
42*
0.6
04*
0.5
25***
1.9
90*
(0.4
31)
(1.9
00)
(0.2
50)
(0.9
32)
Yea
rs o
f prim
ary
educ
atio
n0.0
01
0.0
31
0.0
02
0.0
50
-0.0
01
-0.0
14
0.0
08
0.0
41
0.0
06
0.0
20
0.0
12
0.1
10
(0.0
47)
(0.0
58)
(0.1
02)
(0.0
35)
(0.0
36)
(0.0
92)
Yea
rs o
f se
cond
ary
educ
atio
n0.0
03
0.0
69
0.0
05
0.1
10
0.0
02
0.0
43
-0.0
00
-0.0
00
-0.0
05
-0.0
17
-0.0
01
-0.0
06
(0.0
55)
(0.0
76)
(0.0
88)
(0.0
38)
(0.0
47)
(0.0
77)
Dur
able
Goods
Index
0.0
05
0.1
06
-0.1
47
-3.2
21
-0.0
10
-0.2
07
-0.0
03
-0.0
14
0.3
73
1.3
46
-0.0
07
-0.0
62
(0.2
28)
(1.8
00)
(0.4
01)
(0.2
28)
(0.7
85)
(0.3
62)
Inte
ract
ion t
erm
s[2
0-24
yea
rs X
Dur
able
goo
ds]
0.0
06
0.1
22
0.2
63*
5.7
67*
0.0
04
0.0
82
0.0
83
0.4
10
-0.4
10
-1.4
79
0.0
48
0.4
35
(0.3
60)
(2.7
23)
(0.3
56)
(0.3
03)
(1.2
00)
(0.3
27)
[25-
29 y
ears
X D
urab
le g
oods
]-0
.017
-0.3
66
0.2
33
5.1
14
0.0
39
0.1
92
-0.5
59
-2.0
18
(0.3
72)
(2.6
91)
(0.3
26)
(1.1
80)
[30-
39 y
ears
X D
urab
le g
oods
]-0
.001
-0.0
15
0.2
38
5.2
33
0.0
37
0.1
82
-0.5
39
-1.9
47
(0.3
42)
(2.6
99)
(0.2
71)
(1.1
85)
[40-
49 y
ears
X D
urab
le g
oods
]-0
.036
-0.7
71
0.2
14
4.6
99
0.0
37
0.1
84
-0.5
27
-1.9
02
(0.5
15)
(2.6
71)
(0.3
04)
(1.1
68)
Yea
rs o
f pr
imar
y ed
ucat
ion
X D
urab
le g
oods
-0.0
04
-0.0
76
-0.0
04
-0.0
93
0.0
09
0.1
94
-0.0
11
-0.0
52
0.0
03
0.0
10
-0.0
18
-0.1
67
(0.1
48)
(0.1
79)
(0.4
06)
(0.1
25)
(0.1
31)
(0.3
11)
Yea
rs o
f se
cond
ary
educ
atio
n X
Dur
able
goo
ds-0
.012*
-0.2
50*
-0.0
17*
-0.3
73*
-0.0
08
-0.1
74
-0.0
10
-0.0
51
-0.0
03
-0.0
10
-0.0
08
-0.0
75
(0.1
14)
(0.1
66)
(0.1
84)
(0.0
88)
(0.1
11)
(0.1
77)
Mar
ried
=1
-0.0
02
-0.0
51
-0.0
03
-0.0
68
0.0
29*
0.2
43*
(0.0
79)
(0.1
11)
(0.1
07)
Poly
gam
ous
Uni
on=
1-0
.003
-0.0
71
-0.0
03
-0.0
69
-0.0
04
-0.0
98
0.0
92***
0.4
84***
-0.0
73
-0.2
43
(0.0
97)
(0.1
00)
(0.2
14)
(0.0
54)
(0.8
88)
Urb
an0.0
16**
0.2
99**
0.0
12
0.2
26
0.0
25**
0.4
50***
0.0
18
0.0
86
0.0
21
0.0
73
0.0
12
0.1
08
(0.0
92)
(0.1
33)
(0.1
25)
(0.0
73)
(0.0
84)
(0.1
11)
Age
of co
habiti
ng p
artn
er (
year
s)-0
.000
-0.0
01
0.0
03**
0.0
12**
(0.0
04)
(0.0
05)
Cons
tant
-2.0
80***
-2.1
73***
-2.5
04***
-2.4
19***
-2.2
06*
-2.2
56***
(0.1
75)
(0.2
62)
(0.3
40)
(0.1
49)
(0.9
42)
(0.2
92)
Num
ber
of O
bse
rvat
ions
11,0
28
11,0
28
7,0
16
7,0
16
4,5
56
4,5
56
8,5
41
8,5
41
4,8
42
4,8
42
3,4
15
3,4
15
Yout
h (1
5-2
4 y
ears
)M
en 1
5-4
9 y
ears
Table
3:
Corr
ela
tes
of
concu
rrent
sexual re
lati
ons
wit
hin
past
12 m
onth
s-P
robit
Model R
esu
lts
Sta
nd
ard
err
ors
in p
aren
thes
es *
**
p<
0.00
1, *
* p
<0.
01, *
p<
0.05
All
Mar
ried
Yout
h (1
5-2
4 y
ears
)W
om
en 1
5-4
9 y
ears
All
Mar
ried
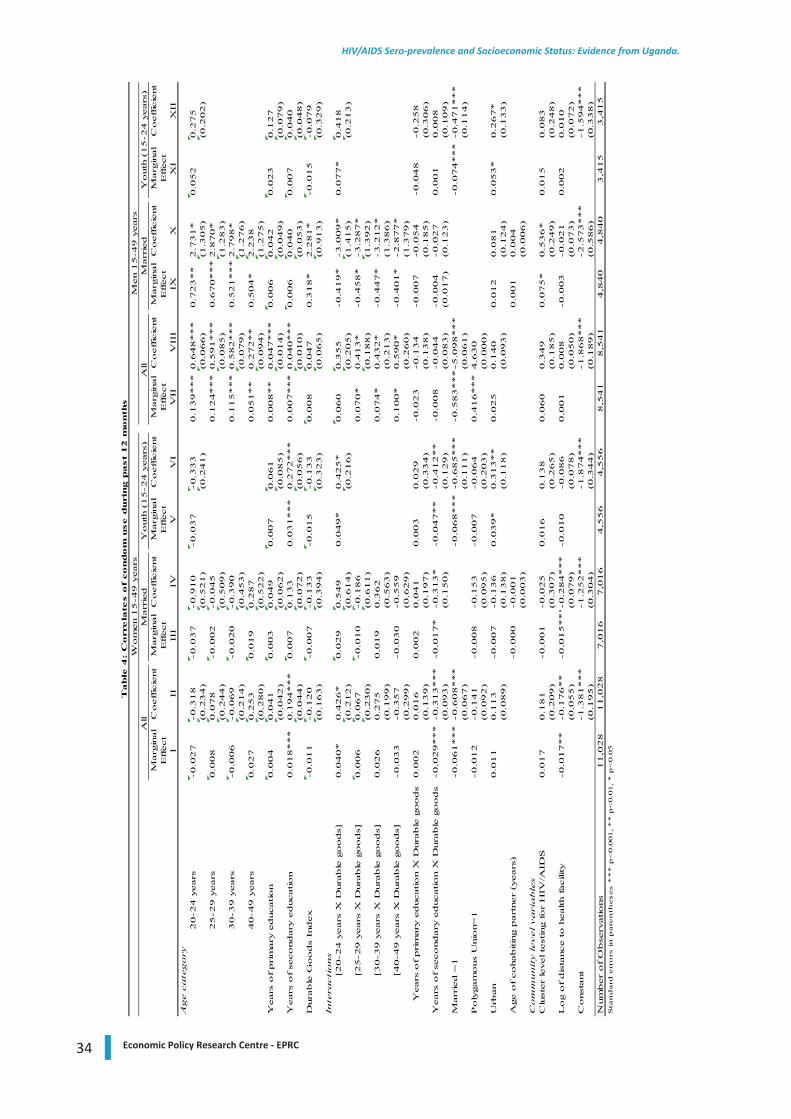
34 Economic Policy Research Centre - EPRC
HIV/AIDS Sero-prevalence and Socioeconomic Status: Evidence from Uganda.
Marg
inal
Coeffic
ient
Marg
inal
Coeffic
ient
Marg
inal
Coeffic
ient
Marg
inal
Coeffic
ient
Marg
inal
Coeffic
ient
Marg
inal
Coeffic
ient
Effect
Effect
Effect
Effect
Effect
Effect
III
III
IVV
VI
VII
VII
IIX
XX
IX
IIA
ge c
ate
gory
20-2
4 y
ears
-0.0
27
-0.3
18
-0.0
37
-0.9
10
-0.0
37
-0.3
33
0.1
39***
0.6
48***
0.7
23**
2.7
31*
0.0
52
0.2
75
(0.2
34)
(0.5
21)
(0.2
41)
(0.0
66)
(1.3
05)
(0.2
02)
25-2
9 y
ears
0.0
08
0.0
78
-0.0
02
-0.0
45
0.1
24***
0.5
91***
0.6
70***
2.8
70*
(0.2
44)
(0.5
09)
(0.0
85)
(1.2
83)
30-3
9 y
ears
-0.0
06
-0.0
69
-0.0
20
-0.3
90
0.1
15***
0.5
82***
0.5
21***
2.7
98*
(0.2
14)
(0.4
53)
(0.0
79)
(1.2
76)
40-4
9 y
ears
0.0
27
0.2
53
0.0
19
0.2
87
0.0
51**
0.2
72**
0.5
04*
2.2
38
(0.2
80)
(0.5
22)
(0.0
94)
(1.2
75)
Years
of prim
ary
education
0.0
04
0.0
41
0.0
03
0.0
49
0.0
07
0.0
61
0.0
08**
0.0
47***
0.0
06
0.0
42
0.0
23
0.1
27
(0.0
42)
(0.0
62)
(0.0
85)
(0.0
14)
(0.0
49)
(0.0
79)
Years
of se
condary
education
0.0
18***
0.1
94***
0.0
07
0.1
33
0.0
31***
0.2
72***
0.0
07***
0.0
40***
0.0
06
0.0
40
0.0
07
0.0
40
(0.0
44)
(0.0
72)
(0.0
56)
(0.0
10)
(0.0
53)
(0.0
48)
Dura
ble
Goods
Index
-0.0
11
-0.1
20
-0.0
07
-0.1
33
-0.0
15
-0.1
33
0.0
08
0.0
47
0.3
18*
2.2
81*
-0.0
15
-0.0
79
(0.1
63)
(0.3
94)
(0.3
23)
(0.0
65)
(0.9
13)
(0.3
29)
Inte
racti
ons
[20-2
4 y
ears
X D
ura
ble
goods]
0.0
40*
0.4
26*
0.0
29
0.5
49
0.0
49*
0.4
25*
0.0
60
0.3
55
-0.4
19*
-3.0
09*
0.0
77*
0.4
18
(0.2
12)
(0.6
14)
(0.2
16)
(0.2
05)
(1.4
15)
(0.2
13)
[25-2
9 y
ears
X D
ura
ble
goods]
0.0
06
0.0
67
-0.0
10
-0.1
86
0.0
70*
0.4
13*
-0.4
58*
-3.2
87*
(0.2
30)
(0.6
11)
(0.1
88)
(1.3
92)
[30-3
9 y
ears
X D
ura
ble
goods]
0.0
26
0.2
75
0.0
19
0.3
62
0.0
74*
0.4
32*
-0.4
47*
-3.2
12*
(0.1
99)
(0.5
63)
(0.2
13)
(1.3
86)
[40-4
9 y
ears
X D
ura
ble
goods]
-0.0
33
-0.3
57
-0.0
30
-0.5
59
0.1
00*
0.5
90*
-0.4
01*
-2.8
77*
(0.2
99)
(0.6
29)
(0.2
60)
(1.3
79)
Years
of prim
ary
education X
Dura
ble
goods
0.0
02
0.0
16
0.0
02
0.0
41
0.0
03
0.0
29
-0.0
23
-0.1
34
-0.0
07
-0.0
54
-0.0
48
-0.2
58
(0.1
39)
(0.1
97)
(0.3
34)
(0.1
38)
(0.1
85)
(0.3
06)
Years
of se
condary
education X
Dura
ble
goods
-0.0
29***
-0.3
13***
-0.0
17*
-0.3
13*
-0.0
47**
-0.4
12**
-0.0
08
-0.0
44
-0.0
04
-0.0
27
0.0
01
0.0
08
(0.0
93)
(0.1
50)
(0.1
29)
(0.0
83)
(0.0
17)
(0.1
23)
(0.1
09)
Marr
ied =
1-0
.061***
-0.6
08***
-0.0
68***
-0.6
85***
-0.5
83***
-5.0
98***
-0.0
74***
-0.4
71***
(0.0
67)
(0.1
11)
(0.0
61)
(0.1
14)
Poly
gam
ous
Unio
n=
1-0
.012
-0.1
41
-0.0
08
-0.1
53
-0.0
07
-0.0
64
0.4
16***
4.6
30
(0.0
92)
(0.0
95)
(0.2
03)
(0.0
00)
Urb
an
0.0
11
0.1
13
-0.0
07
-0.1
36
0.0
39*
0.3
13**
0.0
25
0.1
40
0.0
12
0.0
81
0.0
53*
0.2
67*
(0.0
89)
(0.1
38)
(0.1
18)
(0.0
93)
(0.1
24)
(0.1
33)
Age o
f cohabitin
g p
art
ner
(years
)-0
.000
-0.0
01
0.0
01
0.0
04
(0.0
03)
(0.0
06)
Com
munit
y level vari
able
sC
lust
er
level te
stin
g for
HIV
/AID
S0.0
17
0.1
81
-0.0
01
-0.0
25
0.0
16
0.1
38
0.0
60
0.3
49
0.0
75*
0.5
36*
0.0
15
0.0
83
(0.2
09)
(0.3
07)
(0.2
65)
(0.1
85)
(0.2
49)
(0.2
48)
Log o
f dis
tance to h
ealth facili
ty-0
.017**
-0.1
76**
-0.0
15***-
0.2
84***
-0.0
10
-0.0
86
0.0
01
0.0
08
-0.0
03
-0.0
21
0.0
02
0.0
10
(0.0
55)
(0.0
79)
(0.0
78)
(0.0
50)
(0.0
73)
(0.0
72)
Const
ant
-1.3
81***
-1.2
52***
-1.8
74***
-1.8
68***
-2.5
73***
-1.5
94***
(0.1
95)
(0.3
04)
(0.3
44)
(0.1
89)
(0.5
86)
(0.3
38)
Num
ber
of O
bse
rvations
11,0
28
11,0
28
7,0
16
7,0
16
4,5
56
4,5
56
8,5
41
8,5
41
4,8
40
4,8
40
3,4
15
3,4
15
Wom
en 1
5-4
9 y
ears
Men 1
5-4
9 y
ears
Table
4:
Corr
ela
tes o
f condom
use d
uri
ng p
ast
12 m
onth
s
Sta
nd
ard
err
ors
in
pare
nth
eses *
**
p<
0.0
01, *
* p
<0.0
1, *
p<
0.0
5
All
Marr
ied
Youth
(15-2
4 y
ears
)A
ll M
arr
ied
Youth
(15-2
4 y
ears
)
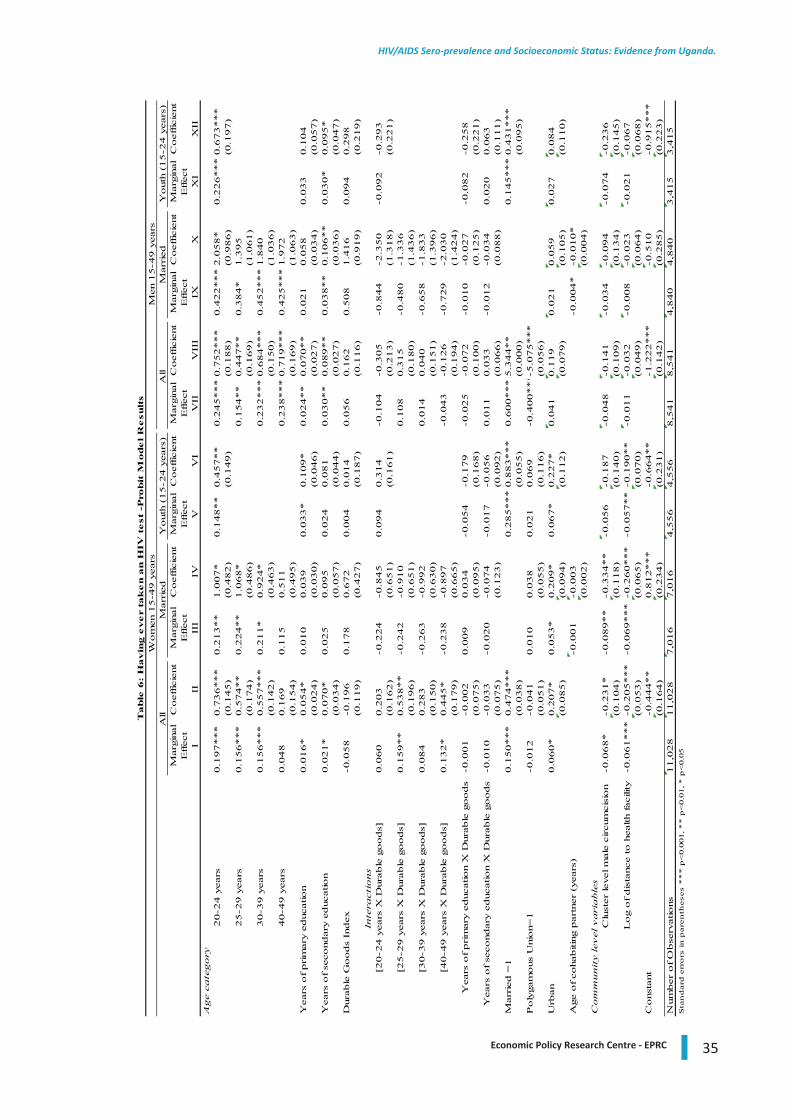
35Economic Policy Research Centre - EPRC
HIV/AIDS Sero-prevalence and Socioeconomic Status: Evidence from Uganda.
Marg
inal
Co
eff
icie
nt
Marg
inal
Co
eff
icie
nt
Marg
inal
Co
eff
icie
nt
Marg
inal
Co
eff
icie
nt
Marg
inal
Co
eff
icie
nt
Marg
inal
Co
eff
icie
nt
Eff
ect
Eff
ect
Eff
ect
Eff
ect
Eff
ect
Eff
ect
III
III
IVV
VI
VII
VII
IIX
XX
IX
IIA
ge c
ate
go
ry2
0-2
4 y
ears
0.1
97
**
*0
.73
6*
**
0.2
13
**
1.0
07
*0
.14
8*
*0
.45
7*
*0
.24
5*
**
0.7
52
**
*0
.42
2*
**
2.0
58
*0
.22
6*
**
0.6
73
**
*(0
.14
5)
(0.4
82
)(0
.14
9)
(0.1
88
)(0
.98
6)
(0.1
97
)2
5-2
9 y
ears
0.1
56
**
*0
.57
4*
*0
.22
4*
*1
.06
8*
0.1
54
**
0.4
47
**
0.3
84
*1
.39
5(0
.17
4)
(0.4
86
)(0
.16
9)
(1.0
61
)3
0-3
9 y
ears
0.1
56
**
*0
.55
7*
**
0.2
11
*0
.92
4*
0.2
32
**
*0
.68
4*
**
0.4
52
**
*1
.84
0(0
.14
2)
(0.4
63
)(0
.15
0)
(1.0
36
)4
0-4
9 y
ears
0.0
48
0.1
69
0.1
15
0.5
11
0.2
38
**
*0
.71
9*
**
0.4
25
**
*1
.97
2(0
.15
4)
(0.4
95
)(0
.16
9)
(1.0
63
)Y
ears
of
prim
ary
ed
ucatio
n0
.01
6*
0.0
54
*0
.01
00
.03
90
.03
3*
0.1
09
*0
.02
4*
*0
.07
0*
*0
.02
10
.05
80
.03
30
.10
4(0
.02
4)
(0.0
30
)(0
.04
6)
(0.0
27
)(0
.03
4)
(0.0
57
)Y
ears
of
seco
nd
ary
ed
ucatio
n0
.02
1*
0.0
70
*0
.02
50
.09
50
.02
40
.08
10
.03
0*
*0
.08
9*
*0
.03
8*
*0
.10
6*
*0
.03
0*
0.0
95
*(0
.03
4)
(0.0
57
)(0
.04
4)
(0.0
27
)(0
.03
6)
(0.0
47
)D
ura
ble
Go
od
s In
dex
-0.0
58
-0.1
96
0.1
78
0.6
72
0.0
04
0.0
14
0.0
56
0.1
62
0.5
08
1.4
16
0.0
94
0.2
98
(0.1
19
)(0
.42
7)
(0.1
87
)(0
.11
6)
(0.9
19
)(0
.21
9)
Inte
racti
on
s[2
0-2
4 y
ears
X D
ura
ble
go
od
s]0
.06
00
.20
3-0
.22
4-0
.84
50
.09
40
.31
4-0
.10
4-0
.30
5-0
.84
4-2
.35
0-0
.09
2-0
.29
3(0
.16
2)
(0.6
51
)(0
.16
1)
(0.2
13
)(1
.31
8)
(0.2
21
)[2
5-2
9 y
ears
X D
ura
ble
go
od
s]0
.15
9*
*0
.53
8*
*-0
.24
2-0
.91
00
.10
80
.31
5-0
.48
0-1
.33
6(0
.19
6)
(0.6
51
)(0
.18
0)
(1.4
36
)[3
0-3
9 y
ears
X D
ura
ble
go
od
s]0
.08
40
.28
3-0
.26
3-0
.99
20
.01
40
.04
0-0
.65
8-1
.83
3(0
.15
0)
(0.6
30
)(0
.15
1)
(1.3
96
)[4
0-4
9 y
ears
X D
ura
ble
go
od
s]0
.13
2*
0.4
45
*-0
.23
8-0
.89
7-0
.04
3-0
.12
6-0
.72
9-2
.03
0(0
.17
9)
(0.6
65
)(0
.19
4)
(1.4
24
)Y
ears
of
prim
ary
ed
ucatio
n X
Dura
ble
go
od
s-0
.00
1-0
.00
20
.00
90
.03
4-0
.05
4-0
.17
9-0
.02
5-0
.07
2-0
.01
0-0
.02
7-0
.08
2-0
.25
8(0
.07
5)
(0.0
95
)(0
.16
8)
(0.1
00
)(0
.12
5)
(0.2
21
)Y
ears
of
seco
nd
ary
ed
ucatio
n X
Dura
ble
go
od
s-0
.01
0-0
.03
3-0
.02
0-0
.07
4-0
.01
7-0
.05
60
.01
10
.03
3-0
.01
2-0
.03
40
.02
00
.06
3(0
.07
5)
(0.1
23
)(0
.09
2)
(0.0
66
)(0
.08
8)
(0.1
11
)M
arr
ied
=1
0.1
50
**
*0
.47
4*
**
0.2
85
**
*0
.88
3*
**
0.6
00
**
*5
.34
4*
*0
.14
5*
**
0.4
31
**
*(0
.03
8)
(0.0
55
)(0
.00
0)
(0.0
95
)P
oly
gam
ous
Unio
n=
1-0
.01
2-0
.04
10
.01
00
.03
80
.02
10
.06
9-0
.40
0*
**-
5.0
75
**
*(0
.051)
(0.0
55)
(0.1
16)
(0.0
56
)U
rban
0.0
60*
0.2
07*
0.0
53*
0.2
09*
0.0
67*
0.2
27*
0.0
41
0.1
19
0.0
21
0.0
59
0.0
27
0.0
84
(0.0
85)
(0.0
94)
(0.1
12)
(0.0
79
)(0
.10
5)
(0.1
10
)A
ge o
f co
hab
itin
g p
art
ner
(years
)-0
.001
-0.0
03
-0.0
04
*-0
.01
0*
(0.0
02
)(0
.00
4)
Co
mm
un
ity l
ev
el
va
ria
ble
sC
lust
er
level m
ale
circum
cis
ion
-0.0
68
*-0
.23
1*
-0.0
89
**
-0.3
34
**
-0.0
56
-0.1
87
-0.0
48
-0.1
41
-0.0
34
-0.0
94
-0.0
74
-0.2
36
(0.1
04
)(0
.11
8)
(0.1
40
)(0
.10
9)
(0.1
34
)(0
.14
5)
Lo
g o
f d
ista
nce t
o h
ealth f
acili
ty-0
.06
1*
**
-0.2
05
**
*-0
.06
9*
**
-0.2
60
**
*-0
.05
7*
*-0
.19
0*
*-0
.01
1-0
.03
2-0
.00
8-0
.02
3-0
.02
1-0
.06
7(0
.05
3)
(0.0
65
)(0
.07
0)
(0.0
49
)(0
.06
4)
(0.0
68
)C
onst
ant
-0.4
44
**
0.8
12
**
*-0
.66
4*
*-1
.22
2*
**
-0.5
10
-0.9
15
**
*(0
.16
4)
(0.2
34
)(0
.23
1)
(0.1
42
)(0
.28
5)
(0.2
23
)N
um
ber
of
Ob
serv
atio
ns
11
,02
81
1,0
28
7,0
16
7,0
16
4,5
56
4,5
56
8,5
41
8,5
41
4,8
40
4,8
40
3,4
15
3,4
15
Sta
nd
ard
err
ors
in
pare
nth
eses *
**
p<
0.0
01, *
* p
<0.0
1, *
p<
0.0
5
Table
6:
Havin
g e
ve
r ta
ke
n a
n H
IV t
est
-Pro
bit
Mode
l R
esu
lts
Wom
en 1
5-4
9 y
ears
Men 1
5-4
9 y
ears
All
Marr
ied
Youth
(15-2
4 y
ears
)A
ll M
arr
ied
Yo
uth
(1
5-2
4 y
ears
)
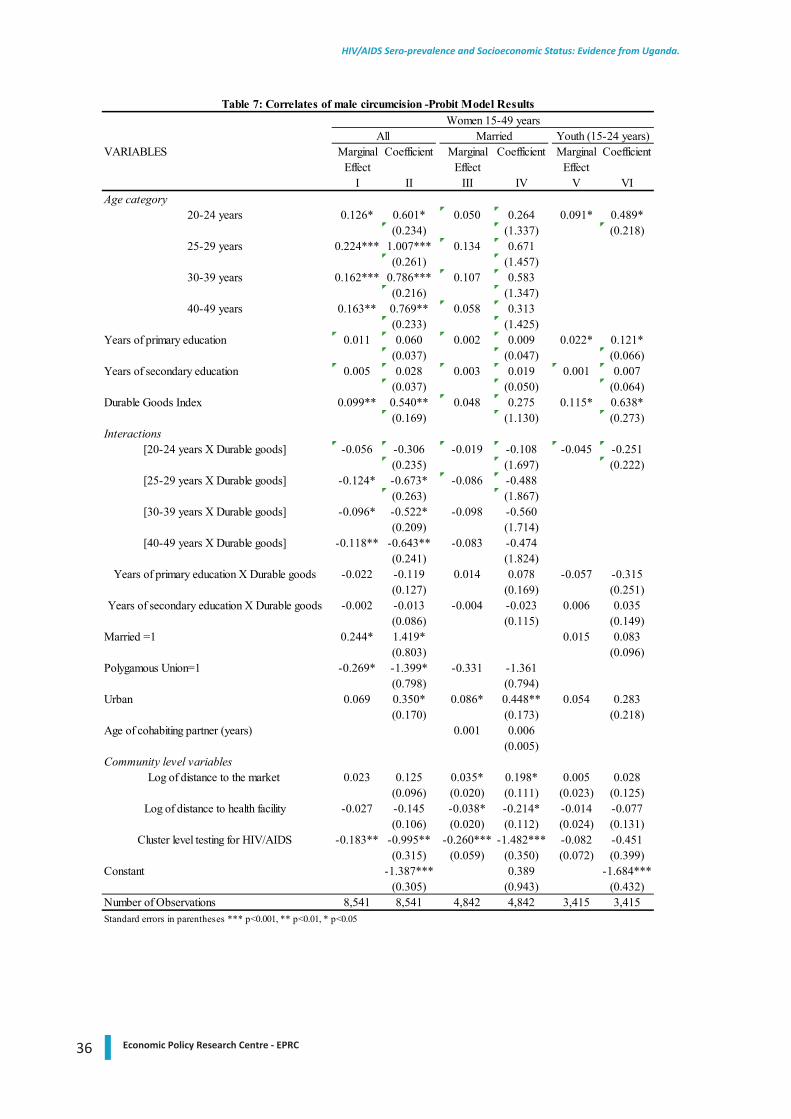
36 Economic Policy Research Centre - EPRC
HIV/AIDS Sero-prevalence and Socioeconomic Status: Evidence from Uganda.
VARIABLES Marginal Coefficient Marginal Coefficient Marginal CoefficientEffect Effect Effect
I II III IV V VIAge category
20-24 years 0.126* 0.601* 0.050 0.264 0.091* 0.489*(0.234) (1.337) (0.218)
25-29 years 0.224*** 1.007*** 0.134 0.671(0.261) (1.457)
30-39 years 0.162*** 0.786*** 0.107 0.583(0.216) (1.347)
40-49 years 0.163** 0.769** 0.058 0.313(0.233) (1.425)
Years of primary education 0.011 0.060 0.002 0.009 0.022* 0.121*(0.037) (0.047) (0.066)
Years of secondary education 0.005 0.028 0.003 0.019 0.001 0.007(0.037) (0.050) (0.064)
Durable Goods Index 0.099** 0.540** 0.048 0.275 0.115* 0.638*(0.169) (1.130) (0.273)
Interactions[20-24 years X Durable goods] -0.056 -0.306 -0.019 -0.108 -0.045 -0.251
(0.235) (1.697) (0.222)[25-29 years X Durable goods] -0.124* -0.673* -0.086 -0.488
(0.263) (1.867)[30-39 years X Durable goods] -0.096* -0.522* -0.098 -0.560
(0.209) (1.714)[40-49 years X Durable goods] -0.118** -0.643** -0.083 -0.474
(0.241) (1.824)Years of primary education X Durable goods -0.022 -0.119 0.014 0.078 -0.057 -0.315
(0.127) (0.169) (0.251)Years of secondary education X Durable goods -0.002 -0.013 -0.004 -0.023 0.006 0.035
(0.086) (0.115) (0.149)Married =1 0.244* 1.419* 0.015 0.083
(0.803) (0.096)Polygamous Union=1 -0.269* -1.399* -0.331 -1.361
(0.798) (0.794)Urban 0.069 0.350* 0.086* 0.448** 0.054 0.283
(0.170) (0.173) (0.218)Age of cohabiting partner (years) 0.001 0.006
(0.005)Community level variables
Log of distance to the market 0.023 0.125 0.035* 0.198* 0.005 0.028(0.096) (0.020) (0.111) (0.023) (0.125)
Log of distance to health facility -0.027 -0.145 -0.038* -0.214* -0.014 -0.077(0.106) (0.020) (0.112) (0.024) (0.131)
Cluster level testing for HIV/AIDS -0.183** -0.995** -0.260*** -1.482*** -0.082 -0.451(0.315) (0.059) (0.350) (0.072) (0.399)
Constant -1.387*** 0.389 -1.684***(0.305) (0.943) (0.432)
Number of Observations 8,541 8,541 4,842 4,842 3,415 3,415
Table 7: Correlates of male circumcision -Probit Model Results
Standard errors in parentheses *** p<0.001, ** p<0.01, * p<0.05
Women 15-49 yearsAll Married Youth (15-24 years)
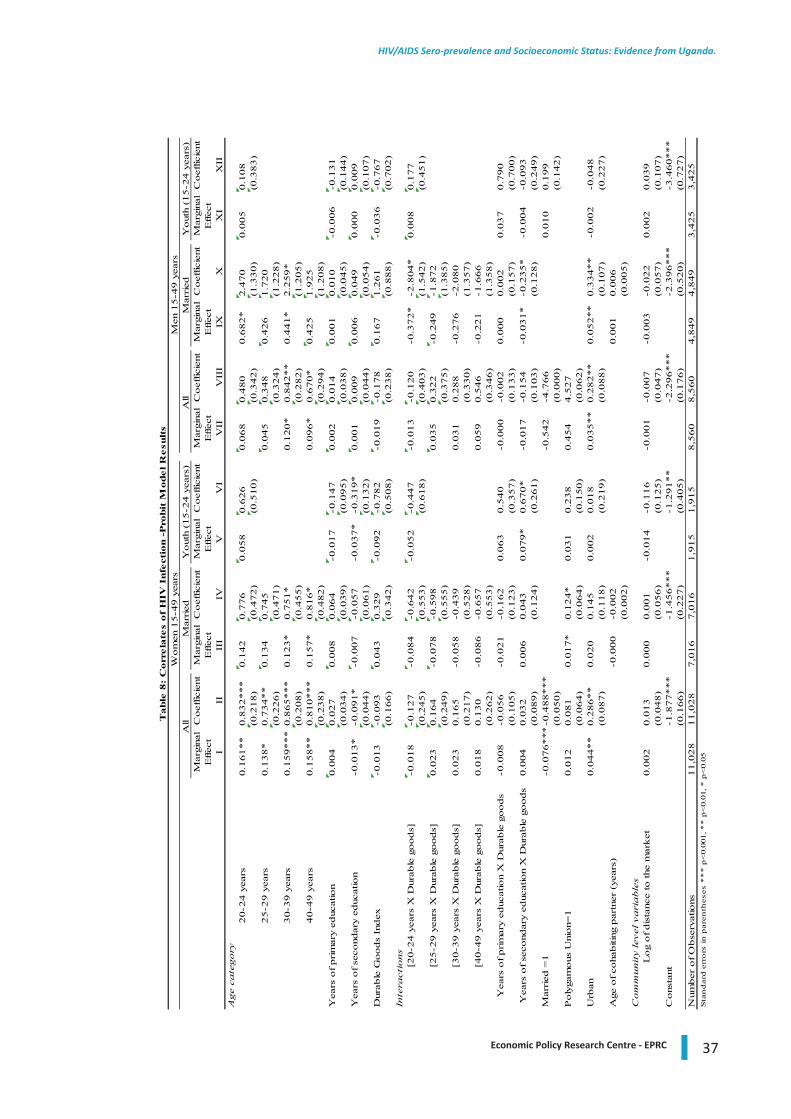
37Economic Policy Research Centre - EPRC
HIV/AIDS Sero-prevalence and Socioeconomic Status: Evidence from Uganda.
Mar
gina
lC
oef
ficie
ntM
argi
nal
Coef
ficie
ntM
argi
nal
Coef
ficie
ntM
argi
nal
Coef
ficie
ntM
argi
nal
Coef
ficie
ntM
argi
nal
Coef
ficie
ntE
ffec
tE
ffec
tE
ffec
tE
ffec
tE
ffec
tE
ffec
tI
IIII
IIV
VV
IV
IIV
III
IXX
XI
XII
Age
cate
gory
20-2
4 y
ears
0.1
61**
0.8
32***
0.1
42
0.7
76
0.0
58
0.6
26
0.0
68
0.4
80
0.6
82*
2.4
70
0.0
05
0.1
08
(0.2
18)
(0.4
72)
(0.5
10)
(0.3
42)
(1.3
30)
(0.3
83)
25-2
9 y
ears
0.1
38*
0.7
34**
0.1
34
0.7
45
0.0
45
0.3
48
0.4
26
1.7
20
(0.2
26)
(0.4
71)
(0.3
24)
(1.2
28)
30-3
9 y
ears
0.1
59***
0.8
65***
0.1
23*
0.7
51*
0.1
20*
0.8
42**
0.4
41*
2.2
59*
(0.2
08)
(0.4
55)
(0.2
82)
(1.2
05)
40-4
9 y
ears
0.1
58**
0.8
10***
0.1
57*
0.8
16*
0.0
96*
0.6
70*
0.4
25
1.9
25
(0.2
38)
(0.4
82)
(0.2
94)
(1.2
08)
Yea
rs o
f prim
ary
educ
atio
n0.0
04
0.0
27
0.0
08
0.0
64
-0.0
17
-0.1
47
0.0
02
0.0
14
0.0
01
0.0
10
-0.0
06
-0.1
31
(0.0
34)
(0.0
39)
(0.0
95)
(0.0
38)
(0.0
45)
(0.1
44)
Yea
rs o
f se
cond
ary
educ
atio
n-0
.013*
-0.0
91*
-0.0
07
-0.0
57
-0.0
37*
-0.3
19*
0.0
01
0.0
09
0.0
06
0.0
49
0.0
00
0.0
09
(0.0
44)
(0.0
61)
(0.1
32)
(0.0
44)
(0.0
54)
(0.1
07)
Dur
able
Goods
Index
-0.0
13
-0.0
93
0.0
43
0.3
29
-0.0
92
-0.7
82
-0.0
19
-0.1
78
0.1
67
1.2
61
-0.0
36
-0.7
67
(0.1
66)
(0.3
42)
(0.5
08)
(0.2
38)
(0.8
88)
(0.7
02)
Inte
ract
ions
[20-2
4 y
ears
X D
urab
le g
oods]
-0.0
18
-0.1
27
-0.0
84
-0.6
42
-0.0
52
-0.4
47
-0.0
13
-0.1
20
-0.3
72*
-2.8
04*
0.0
08
0.1
77
(0.2
45)
(0.5
53)
(0.6
18)
(0.4
03)
(1.5
42)
(0.4
51)
[25-2
9 y
ears
X D
urab
le g
oods]
0.0
23
0.1
64
-0.0
78
-0.5
98
0.0
35
0.3
22
-0.2
49
-1.8
72
(0.2
49)
(0.5
55)
(0.3
75)
(1.3
85)
[30-3
9 y
ears
X D
urab
le g
oods]
0.0
23
0.1
65
-0.0
58
-0.4
39
0.0
31
0.2
88
-0.2
76
-2.0
80
(0.2
17)
(0.5
28)
(0.3
30)
(1.3
57)
[40-4
9 y
ears
X D
urab
le g
oods]
0.0
18
0.1
30
-0.0
86
-0.6
57
0.0
59
0.5
46
-0.2
21
-1.6
66
(0.2
62)
(0.5
53)
(0.3
46)
(1.3
58)
Yea
rs o
f prim
ary
educ
atio
n X
Dur
able
goods
-0.0
08
-0.0
56
-0.0
21
-0.1
62
0.0
63
0.5
40
-0.0
00
-0.0
02
0.0
00
0.0
02
0.0
37
0.7
90
(0.1
05)
(0.1
23)
(0.3
57)
(0.1
33)
(0.1
57)
(0.7
00)
Yea
rs o
f se
cond
ary
educ
atio
n X
Dur
able
goods
0.0
04
0.0
32
0.0
06
0.0
43
0.0
79*
0.6
70*
-0.0
17
-0.1
54
-0.0
31*
-0.2
35*
-0.0
04
-0.0
93
(0.0
89)
(0.1
24)
(0.2
61)
(0.1
03)
(0.1
28)
(0.2
49)
Mar
ried
=1
-0.0
76***
-0.4
88***
-0.5
42
-4.7
66
0.0
10
0.1
99
(0.0
50)
(0.0
00)
(0.1
42)
Poly
gam
ous
Uni
on=
10.0
12
0.0
81
0.0
17*
0.1
24*
0.0
31
0.2
38
0.4
54
4.5
27
(0.0
64)
(0.0
64)
(0.1
50)
(0.0
62)
Urb
an0.0
44**
0.2
86**
0.0
20
0.1
45
0.0
02
0.0
18
0.0
35**
0.2
82**
0.0
52**
0.3
34**
-0.0
02
-0.0
48
(0.0
87)
(0.1
18)
(0.2
19)
(0.0
88)
(0.1
07)
(0.2
27)
Age
of co
habiti
ng p
artn
er (
year
s)-0
.000
-0.0
02
0.0
01
0.0
06
(0.0
02)
(0.0
05)
Com
munit
y le
vel
vari
able
sL
og
of dis
tanc
e to
the
mar
ket
0.0
02
0.0
13
0.0
00
0.0
01
-0.0
14
-0.1
16
-0.0
01
-0.0
07
-0.0
03
-0.0
22
0.0
02
0.0
39
(0.0
48)
(0.0
56)
(0.1
25)
(0.0
47)
(0.0
57)
(0.1
07)
Cons
tant
-1.8
77***
-1.4
56***
-1.2
91**
-2.2
96***
-2.3
96***
-3.4
60***
(0.1
66)
(0.2
27)
(0.4
05)
(0.1
76)
(0.5
20)
(0.7
27)
Num
ber
of O
bse
rvat
ions
11,0
28
11,0
28
7,0
16
7,0
16
1,9
15
1,9
15
8,5
60
8,5
60
4,8
49
4,8
49
3,4
25
3,4
25
Sta
nd
ard
err
ors
in p
aren
thes
es *
**
p<
0.00
1, *
* p
<0.
01, *
p<
0.05
Table
8:
Corr
ela
tes
of
HIV
Infe
ctio
n -
Pro
bit
Model R
esu
lts
Wom
en 1
5-4
9 y
ears
Men
15-4
9 y
ears
All
Mar
ried
Yout
h (1
5-2
4 y
ears
)A
ll M
arried
Yout
h (1
5-2
4 y
ears
)
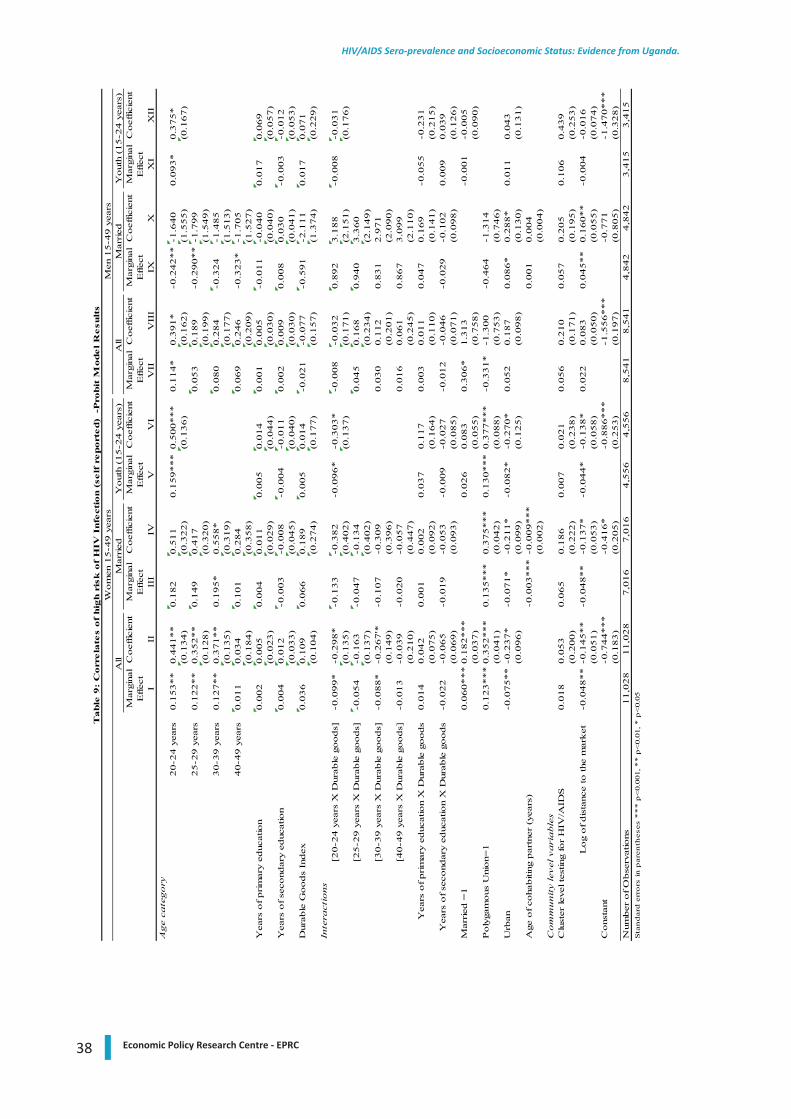
38 Economic Policy Research Centre - EPRC
HIV/AIDS Sero-prevalence and Socioeconomic Status: Evidence from Uganda.
Mar
gina
lC
oef
ficie
ntM
argi
nal
Coef
ficie
ntM
argi
nal
Coef
ficie
ntM
argi
nal
Coef
ficie
ntM
argi
nal
Coef
ficie
ntM
argi
nal
Coef
ficie
ntE
ffec
tE
ffec
tE
ffec
tE
ffec
tE
ffec
tE
ffec
tI
IIII
IIV
VV
IV
IIV
III
IXX
XI
XII
Age
cate
gory
20-2
4 y
ears
0.1
53**
0.4
41**
0.1
82
0.5
11
0.1
59***
0.5
00***
0.1
14*
0.3
91*
-0.2
42**
-1.6
40
0.0
93*
0.3
75*
(0.1
34)
(0.3
22)
(0.1
36)
(0.1
62)
(1.5
55)
(0.1
67)
25-2
9 y
ears
0.1
22**
0.3
52**
0.1
49
0.4
17
0.0
53
0.1
89
-0.2
90**
-1.7
99
(0.1
28)
(0.3
20)
(0.1
99)
(1.5
49)
30-3
9 y
ears
0.1
27**
0.3
71**
0.1
95*
0.5
58*
0.0
80
0.2
84
-0.3
24
-1.4
85
(0.1
35)
(0.3
19)
(0.1
77)
(1.5
13)
40-4
9 y
ears
0.0
11
0.0
34
0.1
01
0.2
84
0.0
69
0.2
46
-0.3
23*
-1.7
05
(0.1
84)
(0.3
58)
(0.2
09)
(1.5
27)
Yea
rs o
f prim
ary
educ
atio
n0.0
02
0.0
05
0.0
04
0.0
11
0.0
05
0.0
14
0.0
01
0.0
05
-0.0
11
-0.0
40
0.0
17
0.0
69
(0.0
23)
(0.0
29)
(0.0
44)
(0.0
30)
(0.0
40)
(0.0
57)
Yea
rs o
f se
cond
ary
educ
atio
n0.0
04
0.0
12
-0.0
03
-0.0
08
-0.0
04
-0.0
11
0.0
02
0.0
09
0.0
08
0.0
30
-0.0
03
-0.0
12
(0.0
33)
(0.0
45)
(0.0
40)
(0.0
30)
(0.0
41)
(0.0
53)
Dur
able
Goods
Index
0.0
36
0.1
09
0.0
66
0.1
89
0.0
05
0.0
14
-0.0
21
-0.0
77
-0.5
91
-2.1
11
0.0
17
0.0
71
(0.1
04)
(0.2
74)
(0.1
77)
(0.1
57)
(1.3
74)
(0.2
29)
Inte
ract
ions
[20-2
4 y
ears
X D
urab
le g
oods]
-0.0
99*
-0.2
98*
-0.1
33
-0.3
82
-0.0
96*
-0.3
03*
-0.0
08
-0.0
32
0.8
92
3.1
88
-0.0
08
-0.0
31
(0.1
35)
(0.4
02)
(0.1
37)
(0.1
71)
(2.1
51)
(0.1
76)
[25-2
9 y
ears
X D
urab
le g
oods]
-0.0
54
-0.1
63
-0.0
47
-0.1
34
0.0
45
0.1
68
0.9
40
3.3
60
(0.1
37)
(0.4
02)
(0.2
34)
(2.1
49)
[30-3
9 y
ears
X D
urab
le g
oods]
-0.0
88*
-0.2
67'*
-0.1
07
-0.3
09
0.0
30
0.1
12
0.8
31
2.9
71
(0.1
49)
(0.3
96)
(0.2
01)
(2.0
90)
[40-4
9 y
ears
X D
urab
le g
oods]
-0.0
13
-0.0
39
-0.0
20
-0.0
57
0.0
16
0.0
61
0.8
67
3.0
99
(0.2
10)
(0.4
47)
(0.2
45)
(2.1
10)
Yea
rs o
f prim
ary
educ
atio
n X
Dur
able
goods
0.0
14
0.0
42
0.0
01
0.0
02
0.0
37
0.1
17
0.0
03
0.0
11
0.0
47
0.1
69
-0.0
55
-0.2
31
(0.0
75)
(0.0
92)
(0.1
64)
(0.1
10)
(0.1
41)
(0.2
15)
Yea
rs o
f se
cond
ary
educ
atio
n X
Dur
able
goods
-0.0
22
-0.0
65
-0.0
19
-0.0
53
-0.0
09
-0.0
27
-0.0
12
-0.0
46
-0.0
29
-0.1
02
0.0
09
0.0
39
(0.0
69)
(0.0
93)
(0.0
85)
(0.0
71)
(0.0
98)
(0.1
26)
Mar
ried
=1
0.0
60***
0.1
82***
0.0
26
0.0
83
0.3
06*
1.3
13
-0.0
01
-0.0
05
(0.0
37)
(0.0
55)
(0.7
58)
(0.0
90)
Poly
gam
ous
Uni
on=
10.1
23***
0.3
52***
0.1
35***
0.3
75***
0.1
30***
0.3
77***
-0.3
31*
-1.3
00
-0.4
64
-1.3
14
(0.0
41)
(0.0
42)
(0.0
88)
(0.7
53)
(0.7
46)
Urb
an-0
.075**
-0.2
37*
-0.0
71*
-0.2
11*
-0.0
82*
-0.2
70*
0.0
52
0.1
87
0.0
86*
0.2
88*
0.0
11
0.0
43
(0.0
96)
(0.0
99)
(0.1
25)
(0.0
98)
(0.1
30)
(0.1
31)
Age
of co
habiti
ng p
artn
er (
year
s)-0
.003***
-0.0
09***
0.0
01
0.0
04
(0.0
02)
(0.0
04)
Com
munit
y le
vel
vari
able
sC
lust
er le
vel t
estin
g fo
r H
IV/A
IDS
0.0
18
0.0
53
0.0
65
0.1
86
0.0
07
0.0
21
0.0
56
0.2
10
0.0
57
0.2
05
0.1
06
0.4
39
(0.2
00)
(0.2
22)
(0.2
38)
(0.1
71)
(0.1
95)
(0.2
53)
Log
of dis
tanc
e to
the
mar
ket
-0
.048**
-0.1
45**
-0.0
48**
-0.1
37*
-0.0
44*
-0.1
38*
0.0
22
0.0
83
0.0
45**
0.1
60**
-0.0
04
-0.0
16
(0.0
51)
(0.0
53)
(0.0
58)
(0.0
50)
(0.0
55)
(0.0
74)
Cons
tant
-0.7
44***
-0.4
16*
-0.8
86***
-1.5
56***
-0.7
71
-1.4
70***
(0.1
83)
(0.2
05)
(0.2
53)
(0.1
97)
(0.8
05)
(0.3
28)
Num
ber
of O
bse
rvat
ions
11,0
28
11,0
28
7,0
16
7,0
16
4,5
56
4,5
56
8,5
41
8,5
41
4,8
42
4,8
42
3,4
15
3,4
15
Sta
nd
ard
err
ors
in p
aren
thes
es *
**
p<
0.00
1, *
* p
<0.
01, *
p<
0.05
Table
9:
Corr
ela
tes
of
hig
h r
isk
of
HIV
Infe
ctio
n (
self
report
ed)
-P
robit
Model R
esu
lts
Wom
en 1
5-4
9 y
ears
Men
15-4
9 y
ears
All
Mar
ried
Yout
h (1
5-2
4 y
ears
)A
ll M
arried
Yout
h (1
5-2
4 y
ears
)
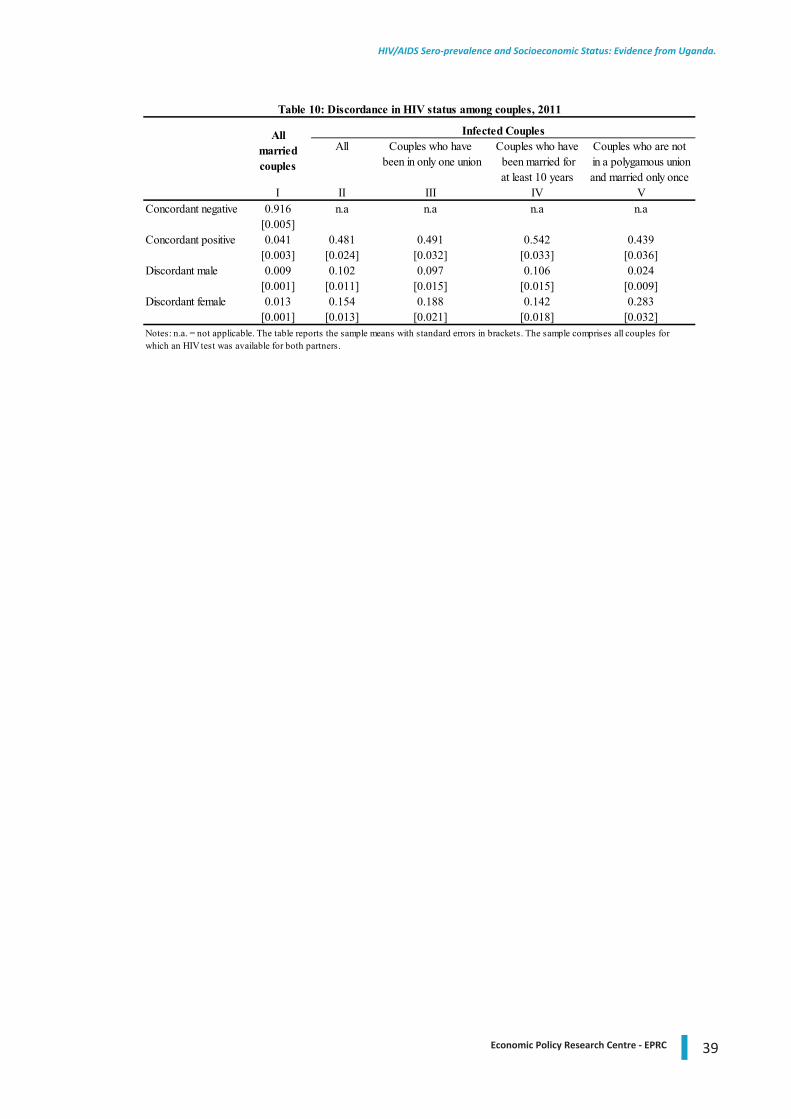
39Economic Policy Research Centre - EPRC
HIV/AIDS Sero-prevalence and Socioeconomic Status: Evidence from Uganda.
All Couples who have Couples who have Couples who are not been in only one union been married for in a polygamous union
at least 10 years and married only once I II III IV V
Concordant negative 0.916 n.a n.a n.a n.a[0.005]
Concordant positive 0.041 0.481 0.491 0.542 0.439[0.003] [0.024] [0.032] [0.033] [0.036]
Discordant male 0.009 0.102 0.097 0.106 0.024[0.001] [0.011] [0.015] [0.015] [0.009]
Discordant female 0.013 0.154 0.188 0.142 0.283[0.001] [0.013] [0.021] [0.018] [0.032]
Table 10: Discordance in HIV status among couples, 2011
Infected CouplesAll married couples
Notes: n.a. = not applicable. The table reports the sample means with standard errors in brackets. The sample comprises all couples for which an HIV test was available for both partners.
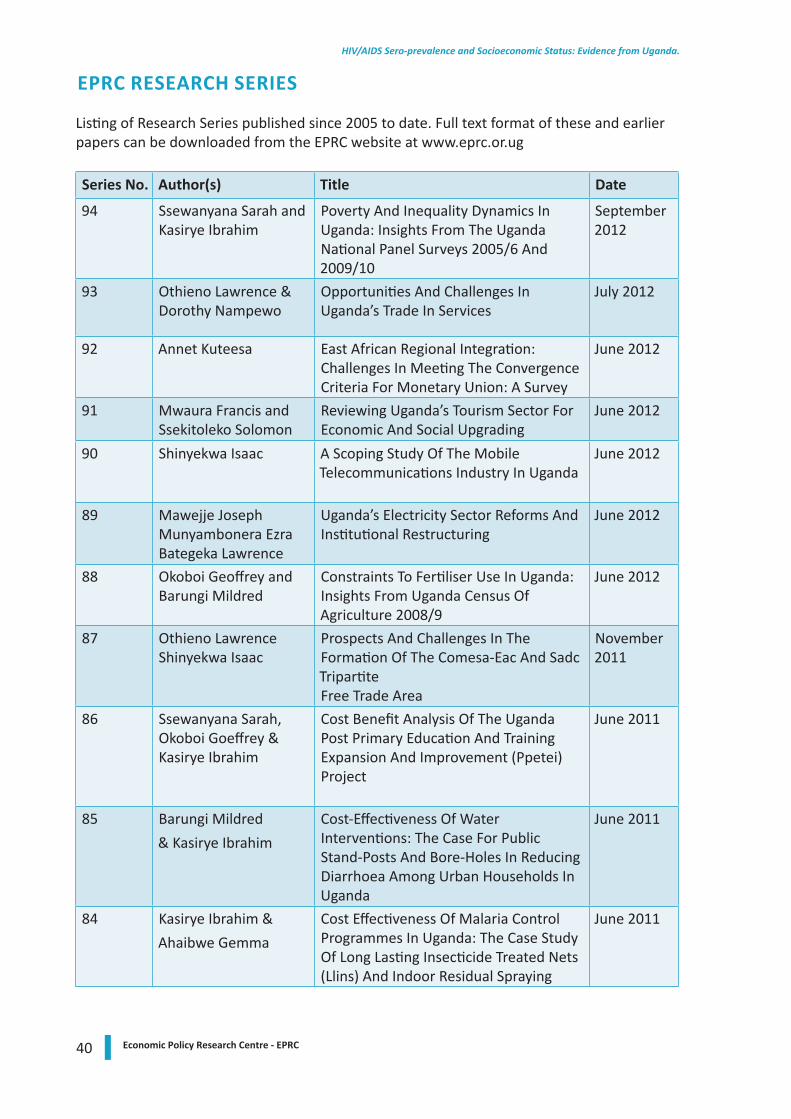
40 Economic Policy Research Centre - EPRC
HIV/AIDS Sero-prevalence and Socioeconomic Status: Evidence from Uganda.
EPRC RESEARCH SERIES
Listing of Research Series published since 2005 to date. Full text format of these and earlier papers can be downloaded from the EPRC website at www.eprc.or.ug
Series No. Author(s) Title Date
94 Ssewanyana Sarah and Kasirye Ibrahim
Poverty And Inequality Dynamics In Uganda: Insights From The Uganda National Panel Surveys 2005/6 And 2009/10
September 2012
93 Othieno Lawrence & Dorothy Nampewo
Opportunities And Challenges In Uganda’s Trade In Services
July 2012
92 Annet Kuteesa East African Regional Integration: Challenges In Meeting The Convergence Criteria For Monetary Union: A Survey
June 2012
91 Mwaura Francis and Ssekitoleko Solomon
Reviewing Uganda’s Tourism Sector For Economic And Social Upgrading
June 2012
90 Shinyekwa Isaac A Scoping Study Of The Mobile Telecommunications Industry In Uganda
June 2012
89 Mawejje JosephMunyambonera EzraBategeka Lawrence
Uganda’s Electricity Sector Reforms And Institutional Restructuring
June 2012
88 Okoboi Geoffrey and Barungi Mildred
Constraints To Fertiliser Use In Uganda: Insights From Uganda Census Of Agriculture 2008/9
June 2012
87 Othieno Lawrence Shinyekwa Isaac
Prospects And Challenges In The Formation Of The Comesa-Eac And Sadc TripartiteFree Trade Area
November 2011
86 Ssewanyana Sarah,Okoboi Goeffrey & Kasirye Ibrahim
Cost Benefit Analysis Of The Uganda Post Primary Education And Training Expansion And Improvement (Ppetei) Project
June 2011
85 Barungi Mildred
& Kasirye Ibrahim
Cost-Effectiveness Of Water Interventions: The Case For Public Stand-Posts And Bore-Holes In Reducing Diarrhoea Among Urban Households In Uganda
June 2011
84 Kasirye Ibrahim &
Ahaibwe Gemma
Cost Effectiveness Of Malaria Control Programmes In Uganda: The Case Study Of Long Lasting Insecticide Treated Nets (Llins) And Indoor Residual Spraying
June 2011
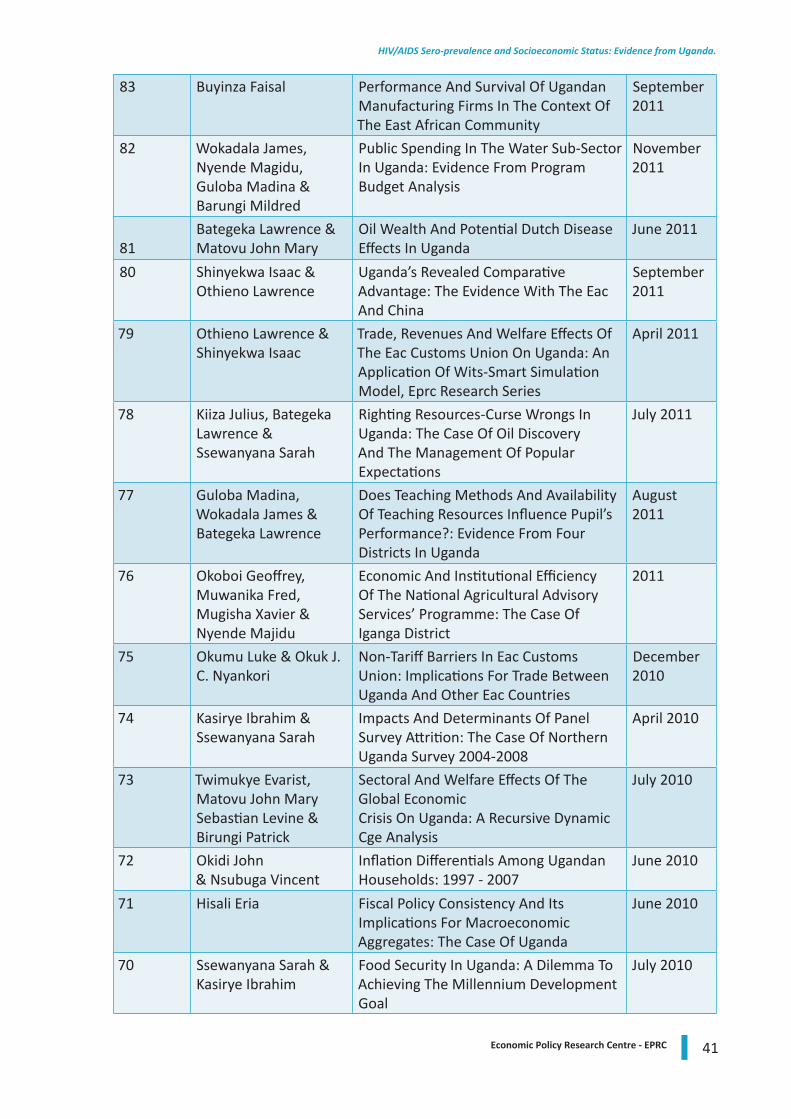
41Economic Policy Research Centre - EPRC
HIV/AIDS Sero-prevalence and Socioeconomic Status: Evidence from Uganda.
83 Buyinza Faisal Performance And Survival Of Ugandan Manufacturing Firms In The Context Of The East African Community
September 2011
82 Wokadala James, Nyende Magidu, Guloba Madina & Barungi Mildred
Public Spending In The Water Sub-Sector In Uganda: Evidence From Program Budget Analysis
November 2011
81Bategeka Lawrence & Matovu John Mary
Oil Wealth And Potential Dutch Disease Effects In Uganda
June 2011
80 Shinyekwa Isaac & Othieno Lawrence
Uganda’s Revealed Comparative Advantage: The Evidence With The Eac And China
September2011
79 Othieno Lawrence & Shinyekwa Isaac
Trade, Revenues And Welfare Effects Of The Eac Customs Union On Uganda: An Application Of Wits-Smart Simulation Model, Eprc Research Series
April 2011
78 Kiiza Julius, Bategeka Lawrence & Ssewanyana Sarah
Righting Resources-Curse Wrongs In Uganda: The Case Of Oil Discovery And The Management Of Popular Expectations
July 2011
77 Guloba Madina, Wokadala James & Bategeka Lawrence
Does Teaching Methods And Availability Of Teaching Resources Influence Pupil’s Performance?: Evidence From Four Districts In Uganda
August 2011
76 Okoboi Geoffrey, Muwanika Fred, Mugisha Xavier & Nyende Majidu
Economic And Institutional Efficiency Of The National Agricultural Advisory Services’ Programme: The Case Of Iganga District
2011
75 Okumu Luke & Okuk J. C. Nyankori
Non-Tariff Barriers In Eac Customs Union: Implications For Trade Between Uganda And Other Eac Countries
December 2010
74 Kasirye Ibrahim & Ssewanyana Sarah
Impacts And Determinants Of Panel Survey Attrition: The Case Of Northern Uganda Survey 2004-2008
April 2010
73 Twimukye Evarist,Matovu John MarySebastian Levine &Birungi Patrick
Sectoral And Welfare Effects Of The Global EconomicCrisis On Uganda: A Recursive Dynamic Cge Analysis
July 2010
72 Okidi John & Nsubuga Vincent
Inflation Differentials Among Ugandan Households: 1997 - 2007
June 2010
71 Hisali Eria Fiscal Policy Consistency And Its Implications For Macroeconomic Aggregates: The Case Of Uganda
June 2010
70 Ssewanyana Sarah & Kasirye Ibrahim
Food Security In Uganda: A Dilemma To Achieving The Millennium Development Goal
July 2010
42 Economic Policy Research Centre - EPRC
HIV/AIDS Sero-prevalence and Socioeconomic Status: Evidence from Uganda.
69 Okoboi Geoffrey Improved Inputs Use And Productivity In Uganda’s Maize Sector
March 2010
68 Ssewanyana Sarah & Kasirye Ibrahim
Gender Differences In Uganda: The Case For Access To Education And Health Services
May 2010
67 Ssewanyana Sarah Combating Chronic Poverty In Uganda: Towards A New Strategy
June 2010
66 Sennoga Edward & Matovu John Mary
Public Spending Composition And Public Sector Efficiency: Implications For Growth And Poverty Reduction In Uganda
February. 2010
65 Christopher Adam The Conduct Of Monetary Policy In Uganda: An Assessment
September 2009
64 Matovu John Mary, Twimukye Evarist, Nabiddo Winnie & Guloba Madina
Impact Of Tax Reforms On Household Welfare
May 2009
63 Sennoga Edward, Matovu John Mary & Twimukye Evarist
Tax Evasion And Widening The Tax Base In Uganda
May 2009
62 Twimukye Evarist & Matovu John
Macroeconomic And Welfare Consequences Of High Energy Prices
May 2009
61 Matovu John & Twimukye Evarist
Increasing World Food Price: Blessing Or Curse?
May 2009
60 Sennoga Edward, Matovu John & Twimukye Evarist
Social Cash Transfers For The Poorest In Uganda
May 2009
59 Twimukye Evarist, Nabiddo Winnie & Matovu John
Aid Allocation Effects On Growth And Poverty: A Cge Framework
May 2009
58 Bategetka Lawrence, Guloba Madina & Kiiza Julius
Gender And Taxation: Analysis Of Personal Income Tax (PIT)
April 2009
57 Ssewanyana Sarah Gender And Incidence Of Indirect Taxation: Evidence From Uganda
April 2009
56 Kasirye Ibrahim & Hisali Eria
The Socioeconomic Impact Of HIV/AIDS On Education Outcomes In Uganda: School Enrolment And The Schooling Gap In 2002/03
November 2008
55 Ssewanyana Sarah & Okidi John
A Micro Simulation Of The Uganda Tax System (UDATAX) And The Poor From 1999 To 2003
October2008
54 Okumu Mike, Nakajjo Alex & Isoke Doreen
Socioeconomic Determinants Of Primary Dropout: The Logistic Model Analysis
February. 2008
43Economic Policy Research Centre - EPRC
HIV/AIDS Sero-prevalence and Socioeconomic Status: Evidence from Uganda.
53 Akunda Bwesigye Denis
An Assessment Of The Casual Relationship Between Poverty And Hiv/Aids In Uganda
September. 2007
52 Rudaheranwa Nichodemus, Guloba Madina & Nabiddo Winnie
Costs Of Overcoming Market Entry Constraints To Uganda’s Export-Led Growth Strategy
August 2007
51 Kasirye Ibrahim Vulnerability And Poverty Dynamics In Uganda, 1992-1999
August 2007
50 Sebaggala Richard Wage Determination And Gender Discrimination In Uganda
May 2007
49 Ainembabazi J. Herbert Landlessness Within The Vicious Cycle Of Poverty In Ugandan Rural Farm Household: Why And How It Is Born?
May 2007
48 Obwona Marios & Ssewanyana Sarah
Development Impact Of Higher Education In Africa: The Case Of Uganda
January2007
47 Abuka Charles, Egesa Kenneth, Atai Imelda & Obwona Marios
Firm Level Investment: Trends, Determinants And Constraints
March 2006
46 Okidi A. John, Ssewanyana Sarah Bategeka Lawrence & Muhumuza Fred
Distributional And Poverty Impacts Of Uganda’s Growth: 1992 To 2003
December 2005
45 Okidi John A , Ssewanyana Sarah, Bategeka Lawrence & Muhumuza Fred
Growth Strategies And Conditions For Pro-Poor Growth: Uganda’s Experience
December 2005
44 Obwona Marios , Wasswa Francis & Nambwaayo Victoria
Taxation Of The Tobacco Industry In Uganda: The Case For Excise Duty On Cigarettes
November2005
43 Obwona Marios & Ndhaye Stephen
Do The HIPC Debt Initiatives Really Achieve The Debt Sustainability Objectives? Uganda’s Experience
August 2005
42 Rudaheranwa Nichodemus
Trade Costs Relating To Transport Barriers On Uganda’s Trade
May 2005

44 Economic Policy Research Centre - EPRC
HIV/AIDS Sero-prevalence and Socioeconomic Status: Evidence from Uganda.


Economic Policy Research Centre
Plot 51, Pool Road, Makerere University Campus
P.O. Box 7841, Kampala, Uganda
Tel: +256-414-541023/4, Fax: +256-414-541022
Email: [email protected], Web: www.eprc.or.ug