Embed Size (px)
Citation preview

Software & IT Services M&A Pulse
2020 H2 ReviewMarch 9, 2021
Amsterdam ● Brussels ● Budapest ● Cardiff ● Chicago ● Cluj-Napoca ● Denver ● Detroit ● Düsseldorf ● Göteborg ● Lisbon ● London ●Malmö ● Milan ● Mumbai ● Munich ● New York ● Paris ● São Paulo ● Shanghai ● Singapore ● Stockholm ● Stuttgart ● Tokyo ● Warsaw
● Zurich

Corporate Finance International (‘CFI’) is pleased topresent the Software & IT Services M&A Pulse 2020second half year Review. This report providescommentary and analysis on current market trends andM&A activity within the Software & IT Services sector.
In just a few months’ time, the COVID-19 crisis hasbrought about years of change in the way companies inall sectors and regions do business. Companies haveaccelerated the digitisation of their customer and supply-chain interactions and of their internal operations bythree to four years. We hope you find this editioninformative and we would encourage you to reach out toour European sector specialists (Ramon Schuitevoerder,Clément Barbot, Andre Wassmann, João Santos, SamForman, Mats Axell and Mario van Gasse) if you wouldlike to discuss our perspective on current sector trendsand M&A opportunities or our relevant sector andtransaction experience.
CFI is a group of middle-market investment banks andcorporate finance advisory boutiques with over 250bankers specialising in cross-border acquisitions,divestitures, capital raising, and related services all over
the world. CFI focuses exclusively on middle-markettransactions, with deal sizes ranging from EUR 10 millionto EUR 500 million. In 2020, CFI completed over 140M&A transactions, involving parties in 18 countries and 4continents.
Our Software & IT Services team provides best-in-class,cross-border M&A advisory services to family andentrepreneurially owned companies, private equity funds,family offices, venture capitalists, start-ups and publiclytraded companies. Our extensive sector knowledge andtransaction experience spans the Adtech & Martech,BI/Big Data, Enterprise Software, Fintech, Infrastructure,IT Security, IT Services, Managed Services and Near- andOffshoring domains.
Our professionals have global relationships with leadingtechnology companies and financial investors. Thoughtfuladvice, extensive experience of structuring andnegotiating complex transactions, and a sector focus thatsupports in-depth understanding of trends anddevelopments impacting our clients, has resulted in atrack record of long-term relationships with clientsseeking extraordinary value.
Inside this review
www.thecfigroup.com | Software & IT Services M&A Pulse 2
Pag.4 Pag.7 Pag.8
Pag.9 Pag.18 Pag.19
Recent CFI deal case studies Summary Stock market index vs. sub-sector
M&A activity and valuations per sub-sector
Private equity Tombstones
Case study 3SummaryIntroduction

www.thecfigroup.com | Software & IT Services M&A Pulse 3
Case study 3SummaryIntroduction
Ramon [email protected] +31 (0)6 21 22 49 02
Clément [email protected] +33 (0)6 32 56 88 74
Sam FormanUnited [email protected] +44 (0) 759 040 8682
João [email protected] +351 (91) 918 3188
Mats [email protected] +46 (0)708 18 55 60
Mario van [email protected]+32 (0)495 59 49 48
Andre [email protected] +49 151 12 96 1732
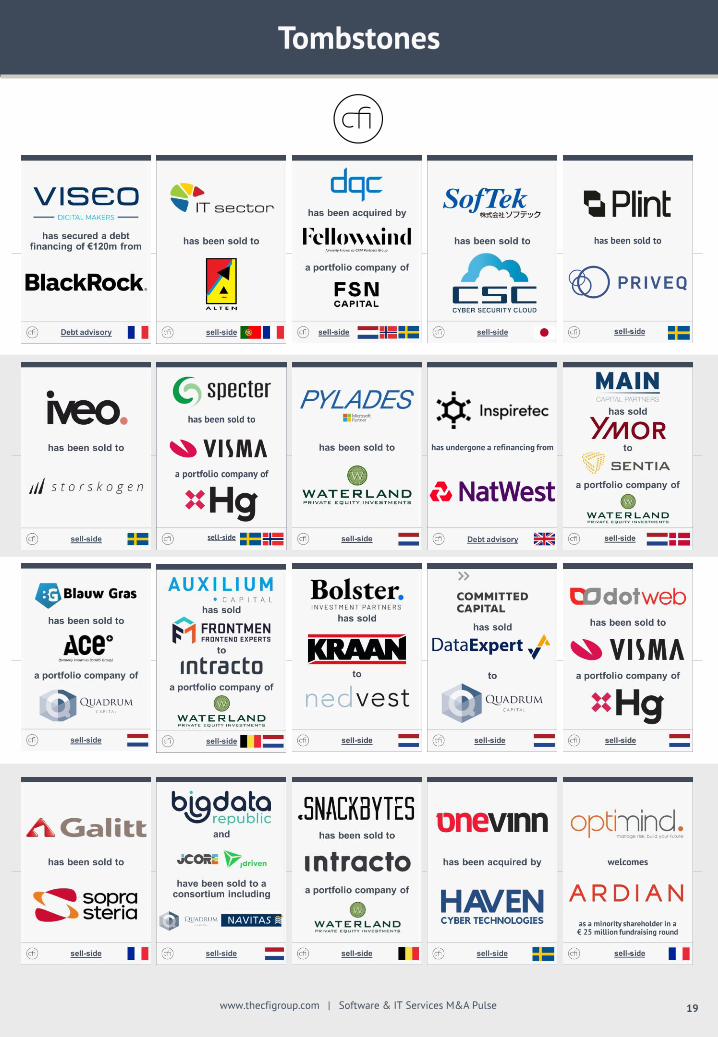
Recent tombstones
Soichiro [email protected]+81 90 3918 4157

www.thecfigroup.com | Software & IT Services M&A Pulse 4
Company OverviewCreated in 2000 by Olivier Dhonte and Eric Perrier, VISEO is aFrench IT Services & Digital player that uses technology as apowerful lever of transformation and innovation to help its clientstake advantage of digital opportunities, address new usages andcompete with new players who change the rules of the game.
VISEO combines agility and complementarity areas of expertise –design of new products and services, digitisation of businessprocesses, data valuation, digital assets development, unifiedcommerce and smart factory – to make digital a real lever ofcompetitiveness and performance.
VISEO posted more than EUR 220 million in revenue for 2020, ofwhich a third is delivered from international clients, and has morethan 2,000 employees in 13 countries.
FunderFounded in 1988, BlackRock is an asset manager and privateequity firm based in New York, New York. The firm provides awide range of services such as investment banking, riskmanagement, advisory, equity, fixed income, balanced portfolios,and asset management. The firm seeks to invest in real estate,education, retail, energy, healthcare, materials, financial services,software, and information technology sectors.
Marketing HighlightsVISEO showed great resilience to the COVID-19 pandemic and theprocess resulted in a successful transaction with BlackRock.
This financing will be used for capital reorganisation and futureacquisitions.
Process HighlightsCFI initiated discussions and negotiations in a narrow process,which ultimately resulted in a successful transaction with VISEOand Blackrock, that closed on January 18th, 2021.
Transaction TypeUnitranche debt financing
SectorIT Services
Deal ValueEUR 120 million
DateJanuary 2021
Deal makers
Jean-Marc TeurquetilPartner, [email protected]+33 608 05 09 40
Case study 3SummaryCase Study 1
Clément BarbotDirector, [email protected] +33 (0)6 32 56 88 74

www.thecfigroup.com | Software & IT Services M&A Pulse 5
Company OverviewFounded in 2005 in Portugal by a team of industry specialists,ITSector is an international expert in digital transformation in thefinancial sector. Acting in 20 countries with more than 500employees, ITSector serves as a one-stop shop for banks andcredit unions, providing high value-added services and advancedtechnology across the whole value chain.
BuyerCreated in 1988, and based in 25 countries with 37,000employees, ALTEN is a European leader in Engineering andTechnology Consulting. The company carries out design andresearch projects for the Tech and IT divisions of major clients inindustry, telecoms and services. ALTEN’s stock is listed incompartment A of the Euronext Paris market; it is also in the SBF120, the IT CAC 50 index and MIDCAP100.
Marketing highlightsFor ITSector, this transaction represents business expansion andthe promotion of knowledge in the markets where ALTENoperates. For the buyer, the strategic acquisition not onlyreinforces the presence of the ALTEN Group in the field ofinformation technology but also increases its skills andspecialisation in the financial sector.
ITSector employs more than 500 people.
Process highlightsThis process was conducted by the Portuguese and French ITTeam advisors, amongst international industrials and privateequity firms. The company showed great resilience to the COVID-19 pandemic, and the process resulted in a successful transactionwith ALTEN on December 22nd, 2020.
Transaction TypeSell-side M&A
SectorIT Services
Deal ValueUndisclosed
DateDecember 2020
Deal makers
João SantosPartner, [email protected] +351 (91) 918 3188
Clément BarbotDirector, [email protected] +33 (0)6 32 56 88 74
Case study 3SummaryCase Study 2

www.thecfigroup.com | Software & IT Services M&A Pulse 6
Company OverviewDQC Sverige AB offers customised cloud-based digitalcollaboration solutions based on Microsoft 365, SharePoint andAZURE technology. The customers are well-known globalcompanies that operate in a variety of industries. DQC operatesnationwide but is established with offices in Gothenburg andStockholm. In recent years, the company has enjoyed a verystrong growth rate whilst increasing profitability markedly.
BuyerFellowmind is a group based in the Netherlands and is one ofEurope’s leading providers of digital collaboration solutionsimplemented on Microsoft platforms: Dynamics 365, PowerPlatform, Teams, Microsoft365 and AZURE. Fellowmind has about1,400 employees and a total revenue of approx. EUR 200 million.Fellowmind’s majority owner is the private equity firm FSNCapital, which manages approximately EUR 2.2 billion.
Marketing HighlightsDQC’s is the market leader in Sweden within Microsoft’s ModernWork technologies. A long-term strategy established in 2007,focusing on delivering premium services to enterprise customers,has resulted in strong growth and increasing profitability. Themarket for collaboration solutions is currently thriving due tostrong external factors such as globalisation and the increasingdemand for flexible workplace solutions.
Process HighlightsCFI has a long-standing relationship with the owners of DQC. Justover five years ago, CFI and DQC established a long-term plan fora change of ownership. After a few years, the company wascontacted by Fellowmind who realised that DQC would completeits offering within Microsoft 365 services on the Swedish market.After many long and productive meetings, it was obvious that thematch was perfect from a busines and a cultural perspective. CFIworked closely with the sellers and successfully project-led thetransaction from start to finish.
Transaction TypeSell-side M&A
SectorEnterprise Software
Deal ValueUndisclosed
DateNovember 2020
Deal makers
Mats AxellPartner, [email protected] +46 (0)708 18 55 60
Carl EgerlundhAssociate, [email protected] +46 (0)739 60 50 10
Case study 3SummaryCase Study 3

24.0x
26.3x
17.2x
26.6x
18.6x
28.3x
8.1x
12.6x
17.6x
0.0x 5.0x 10.0x 15.0x 20.0x 25.0x 30.0x
AdTech & MarTech
BI/Big data
Enterprise Software
Fintech
Infrastructure
IT Security
IT Services
Managed services
Near- and Offshoring
6.3x
8.1x
6.0x
7.8x
4.8x
6.7x
0.9x
2.5x
3.0x
0.0x 2.0x 4.0x 6.0x 8.0x 10.0x
AdTech & MarTech
BI/Big data
Enterprise Software
Fintech
Infrastructure
IT Security
IT Services
Managed services
Near- and Offshoring
www.thecfigroup.com | Software & IT Services M&A Pulse 7
TEV/Revenue
Type of Deals
Type of Buyers
SummarySummary H2 2020
TEV/EBITDA
Mean
5.2xMedian
6.0x
+33.7% vs 2020 H1 +50.6% vs 2020 H1
Mean
19.8xMedian
18.6x
+23.8% vs 2020 H1 +36.8% vs 2020 H1
70%65% 65% 65% 66%
74%
64%68%
46%
30%35% 35% 35% 34%
26%
36%32%
54%
0%
10%
20%
30%
40%
50%
60%
70%
80%
AdTech &
MarTech
BI/Big data Enterprise
Software
Fintech Infratructure IT Security IT Services Managed
services
Near- and
OffshoringDomestic Cross-border
93% 94% 94% 95% 94% 90% 95% 95% 95%
7% 6% 6% 5% 6% 10%5% 5% 5%
0%
20%
40%
60%
80%
100%
AdTech &
MarTech
BI/Big data Enterprise
Software
Fintech Infratructure IT Security IT Services Managed
services
Near- and
OffshoringStrategic Financial

www.thecfigroup.com | Software & IT Services M&A Pulse 8
SummaryStock Performance
Stock Market Performance (LTM)
Stock Market Performance (LTM)
60%
80%
100%
120%
140%
160%
180%
Jan-20 Apr-20 Jul-20 Oct-20 Jan-21
AdTech FinTech Software BI/ Big data Infrastructure Nasdaq S&P Stoxx
60%
80%
100%
120%
140%
160%
180%
Jan-20 Apr-20 Jul-20 Oct-20 Jan-21
Nearshoring MS IT services IT security Nasdaq S&P Stoxx

www.thecfigroup.com | Software & IT Services M&A Pulse 9
Trends
Stock Market Valuation (in EURm)
Selected Transactions
SummaryAdTech & MarTech
CompanyRevenues Revenues Revenues EBITDA Market
Cap Enterprise
ValueEV/
RevenuesEV/EBITDA EV/EBITDA EV/EBITDA
FY 2019 FY 2020 FY 2021 FY 2020 current 3-year avg next FYFacebook 63,165 75,410 88,578 34,679 515,930 577,733 7.7x 16.7x 15.9x 13.2x BrightView 2,132 2,096 1,993 199 1,422 2,342 1.1x 11.7x 10.4x 10.0x Brightcove 165 173 177 10 751 722 4.2x 69.0x 68.0x 33.2x Criteo 2,020 1,830 707 177 1,785 1,435 0.8x 8.1x 7.2x 6.6x HubSpot 603 775 954 -10 20,163 19,098 24.7x - 606.2x 159.7x Twitter 3,091 3,260 3,882 458 46,354 43,312 13.3x 94.6x 58.3x -Alphabet 144,206 159,960 185,730 48,022 1,066,247 1,152,011 7.2x 24.0x 27.3x -New Relic 414 540 545 42 3,202 2,885 5.3x 69.1x 124.6x 90.9x Tremor International 291 334 395 49 932 639 1.9x 13.2x 13.3x 11.4x Magnite 140 181 226 31 5,616 4,658 25.8x 152.1x 170.7x 98.3x
Mean 9.2x 50.9x 110.2x 52.9x Median 6.3x 24.0x 42.8x 23.2x
Rolling CTA Index
Announced Date
Buyer Target EV (EURm) EV/Revenue EV/EBITDA
Dec-20 BrandBee Cloud Republic 4.1 1.7x 10.8x
Dec-20 Storskogen IVEO CFI Confidential
Oct-20 SAP Emarsys - - -
Oct-20 Sichuan Tourism Simei Media 735.12 1.9x 20.4x
Sep-20 SEMrush Prowly - - -
Jul-20 Mediaocean 4C Insights 150 - -
Jul-20 AMM MediaMob 3.67 1.3x 10.8x
Jul-20 Endurance International WaJao 29.73 3.5x -
‒ AdTech is key for development in the advertisingindustry and is expected to record exponential growthduring the coming years.
‒ Technologies that provide solutions to challenges suchas ad fraud, transparency and privacy issues will beattractive targets going forward.
‒ COVID-19 and lockdown measures will boost e-commerce and related services significantly.
‒ From almost exclusively being used by bigorganisations, AI and machine learning is starting togain serious traction within smaller companies.
‒ In addition, there is a growing trend away fromemploying typical platforms like Apple and Google andinstead use third-party tools for designing, directing andpromoting ads.
‒ AdTech is still an active market for M&A, with interestshown from both technology focused strategic buyersand financial buyers such as private equity and ventureinvestors.
20%
60%
100%
140%
180%
Dec-19 Mar-20 Jun-20 Sep-20 Dec-20
Variable Median
Enterprise Value 2,888
Market Cap 3,192
EV/ NTM Sales 4.7x
EV/NTM EBITDA 15.0x

www.thecfigroup.com | Software & IT Services M&A Pulse 10
Trends
Selected Transactions
SummaryBusiness Intelligence/Big Data
CompanyRevenues Revenues Revenues EBITDA Market
Cap Enterprise
ValueEV/
RevenuesEV/EBITDA EV/EBITDA EV/EBITDA
FY 2019 FY 2020 FY 2021 FY 2020 current 3-year avg next FYAltair Engineering 410 374 401 35 2,253 3,825 10.2x 109.9x 110.9x 100.3x Cloudera 409 711 713 -179 4,828 4,639 6.5x - - 26.0x Inovalon 574 586 623 166 1,606 3,810 6.5x 22.9x 20.9x 17.1x MicroStrategy 435 422 - 72 6,068 8,134 19.3x 113.5x 189.8x -Open Text 2,515 2,813 2,757 1,013 10,506 12,437 4.4x 12.3x 12.4x 11.8x Splunk 1,537 2,113 1,784 -175 22,662 23,036 10.9x - - -Dynatrace 372 491 576 -94 12,342 12,673 25.8x - 423.8x 72.1x Teradata 1,697 1,611 1,555 165 4,205 4,387 2.7x 26.6x 20.5x 13.4x
Mean 10.8x 57.0x 129.7x 40.1x Median 8.4x 26.6x 65.9x 21.6x
Stock Market Valuation (in EURm)
Rolling CTA Index
‒ When COVID-19 hit, organisations using traditionalanalytics techniques that rely heavily on large amountsof historical data realised one important thing: many ofthese models might no longer be relevant. Essentially,the pandemic changed everything, rendering a lot ofdata useless.
‒ In turn, forward-looking data and analytics teams arepivoting from traditional AI relying on big data to aclass of analytics that requires less, or ‘small’ and morevaried data.
‒ Complementary to the transitioning from big data to
small data, several distinct themes dominate the BI/Bigdata domain, including (1) the acceleration of change indata and analytics: leveraging innovations in AI,improved composability and more efficient integrationof more diverse data sources and (2) operationalisingbusiness value trough more effective XOps, herewithenabling better decision-making and turning data andanalytics into an integral part of business.
Announced Date
Buyer Target EV (EURm) EV/Revenue EV/EBITDA
Dec-20 Conclusion Hot Item - - -
Oct-20 TIBCO Software Information Builders 842 3.6x -
Oct-20 Twilio Segment 2,468 - -
Aug-20 Emerson Electric Open Systems International 1,354 9.3x 22.6x
Aug-20 American Express Kabbage 845 4.4x -
Jul-20 Black Knight Optimal Blue 1,548 15.7x -
Jul-20 Hewlett-Packard Enterprise Silver Peak Systems 781 8.8x -
20%
60%
100%
140%
180%
Dec-19 Mar-20 Jun-20 Sep-20 Dec-20
Variable Median
Enterprise Value 3,150
Market Cap 2,468
EV/ NTM Sales 5.2x
EV/NTM EBITDA 33.8x

www.thecfigroup.com | Software & IT Services M&A Pulse 11
Trends
Selected Transactions
SummaryEnterprise Software
Stock Market Valuation (in EURm)
Rolling CTA Index
Announced Date
Buyer Target EV (EURm) EV/Revenue EV/EBITDA
Dec-20 Gilde Buy-Out Partners To-Increase 113 - -
Dec-20 Main Capital Partners Exody E-Business Intelligence - - -
Nov-20 IK Investment Partners GeoDynamics - - -
Nov-20 Allgeier IT Solutions AURELO - - -
Sep-20 Techstep Optidev 19 1.1x 7.7x
Jul-20 Eurazeo PME Easy Vista 120 2.9x 19.5x
Jul-20 Help/Systems GlobalSCAPE 187 5.3x 12.4x
Jul-20 Clarivate CPA Global 5,995 - -
Jul-20 Amdocs Openet Telecom 155 2.6x -
CompanyRevenues Revenues Revenues EBITDA Market
Cap Enterprise
ValueEV/
RevenuesEV/EBITDA EV/EBITDA EV/EBITDA
FY 2019 FY 2020 FY 2021 FY 2020 current 3-year avg next FYAVEVA Group 869 953 921 275 12,053 8,419 8.8x 30.7x 33.8x 31.1x Constellation Software 3,118 3,482 3,936 1,040 23,886 23,851 6.9x 22.9x 23.5x 20.4x Dassault Systemes 4,018 4,452 4,774 1,312 48,292 50,369 11.3x 38.4x 35.4x 29.3x Enghouse Systems 258 333 359 117 2,129 2,004 6.0x 17.2x 19.1x 16.6x International Business Machines 68,927 64,580 61,185 12,942 87,571 130,879 2.0x 10.1x 9.1x 8.5x Intuit 5,968 6,932 7,358 2,215 93,107 87,322 12.6x 39.4x 39.4x 33.5x Micro Focus International 2,979 2,667 2,330 1,042 1,626 5,199 1.9x 5.0x 5.1x 6.2x Microsoft 110,016 129,365 135,037 59,030 1,501,096 1,475,582 11.4x 25.0x 25.9x 22.8x Oracle 34,539 35,336 33,006 15,540 148,643 181,285 5.1x 11.7x 11.5x 10.8x SAP 27,553 27,338 26,929 9,009 127,298 131,698 4.8x 14.6x 15.7x 15.2x Sage Group 2,190 2,166 2,135 571 7,405 7,596 3.5x 13.3x 14.1x 15.7x
Mean 6.8x 20.7x 21.1x 19.1x Median 6.0x 17.2x 19.1x 16.6x
‒ Strong M&A activity has continued in the EnterpriseSoftware sector with a total of 438 deals during H22020, with software deals proving to be resilient to theeffects of lockdowns.
‒ The sector landscape is always evolving, even duringthe pandemic, with startups in new product categoriesdisrupting established vendors and well-known namescombining to stay on top of the market.
‒ Cloud-based apps have driven rapid change in thesector both in terms of the software that runs in thecloud and the hardware that powers it.
‒ From an M&A standpoint, private equity has shown alarge appetite for enterprise software companies, beingattracted by the subscription models that allowpredictable and recurring cash flows that are suited toleveraged buyouts.
‒ Strategic buyers seem to be focusing their sights oncompanies helping to improve communications,streamline processes or facilitate remote workingcapabilities.
20%
60%
100%
140%
180%
Dec-19 Mar-20 Jun-20 Sep-20 Dec-20
Variable Median
Enterprise Value 42,551
Market Cap 40,477
EV/ NTM Sales 5.6x
EV/NTM EBITDA 18.7x

www.thecfigroup.com | Software & IT Services M&A Pulse 12
Trends
Selected Transactions
SummaryFintech
XXXX
Stock Market Valuation (in EURm)
Rolling CTA Index
‒ Despite mixed headwinds and pandemic-relatedchallenges facing the industry, COVID-19 also has beenchanging consumer behavior in favour of the industrythrough increased usage of digital payments and onlineproducts/service channels.
‒ Governments are likely to continue engaging in thefintech sector, hereby primarily focusing on regulation.
‒ Even though safety will be the primary focus,governments will foster investments in the fintechdomain to encourage growth.
‒ Since many early stage fintech companies are havingdifficulties in attracting funding, it is expected that a
trend of consolidation will become apparent within thefintech domain in 2021.
‒ Larger companies, such as POS lending companiesKlarna and Affirm, will enjoy continued investorinterest, evidenced by recent financing rounds of EUR100 million plus.
‒ While 2020 has seen a pullback in total deal activityand a shakeout among the less-capitalised startups,continued M&A focus on fintech opportunities isexpected.
Announced Date
Buyer Target EV (EURm) EV/Revenue EV/EBITDA
Dec-20 SumUp Tiller Systems - - -
Dec-20 NEC Corporation Avaloq 2,300 4.2x 26.4x
Nov-20 Lightspeed ShopKeep 372 8.4x -
Nov-20 Nexi Nets 7,800 10.8x 54.0x
Nov-20 Nuvei Smart2Pay 221 - -
Oct-20 Clearstream FondCenter 425 - -
Sep-20 Silver Lake Management Klarna 587 11.0x -
Jul-20 TCV Revolut 580 24.6x -
Jul-20 Tencent N26 570 119.0x -
Jul-20 PayPal Honey Science 4,000 14.6x -
CompanyRevenues Revenues Revenues EBITDA Market
Cap Enterprise
ValueEV/
RevenuesEV/EBITDA EV/EBITDA EV/EBITDA
FY 2019 FY 2020 FY 2021 FY 2020 current 3-year avg next FYBasware Oyj 148 152 156 21 531 573 3.8x 27.1x 36.2x 27.2x Bottomline Technologies 370 400 390 47 1,774 1,699 4.2x 36.5x 28.9x 20.6x PayPal 15,666 18,802 21,142 4,033 264,244 265,106 14.1x 65.7x 60.9x 42.7x Fidelity National Information Services 9,232 11,011 11,241 4,614 69,357 85,417 7.8x 18.5x 19.1x 17.0x Fiserv 9,102 13,028 12,464 4,407 62,617 81,295 6.2x 18.4x 19.4x 15.7x Adyen 2,657 960 1,337 582 65,309 62,708 65.3x 107.7x 110.7x 75.8x Lightspeed POS 67 109 172 -34 8,598 7,178 66.1x - - -PayPoint 240 244 116 77 459 437 1.8x 5.7x 6.5x 8.2x Qiwi 543 288 241 145 470 94 0.3x 0.7x 0.7x 0.7x SimCorp 455 495 546 145 4,286 4,224 8.5x 29.1x 27.9x 25.4x Temenos 868 813 893 368 9,066 9,649 11.9x 26.2x 22.4x 23.8x Worldline 2,382 2,786 5,286 663 20,937 14,846 5.3x 22.4x 17.6x 11.4x Square 4,211 7,781 10,849 353 86,101 105,798 13.6x 299.7x 279.2x 191.5x
Mean 16.1x 54.8x 52.5x 38.3x Median 7.8x 26.6x 25.2x 22.2x
20%
60%
100%
140%
180%
Dec-19 Mar-20 Jun-20 Sep-20 Dec-20
Variable Median
Enterprise Value 10,193
Market Cap 9,330
EV/ NTM Sales 7.3x
EV/NTM EBITDA 21.5x

www.thecfigroup.com | Software & IT Services M&A Pulse 13
Trends
Selected Transactions
SummaryIT Infrastructure
CompanyRevenues Revenues Revenues EBITDA Market
Cap Enterprise
ValueEV/
RevenuesEV/EBITDA EV/EBITDA EV/EBITDA
FY 2019 FY 2020 FY 2021 FY 2020 current 3-year avg next FYAkamai Technologies 2,585 2,805 2,813 1,035 13,309 14,862 5.3x 14.4x 14.1x 12.1x Arista Networks 2,154 2,033 2,210 667 19,604 18,134 8.9x 27.2x 23.9x 21.1x Broadcom 20,105 21,228 21,735 10,008 165,199 199,641 9.4x 19.9x 18.9x 15.7x Citrix Systems 2,690 2,839 2,769 727 13,503 14,752 5.2x 20.3x 18.5x 15.5x CommVault Systems 614 604 589 16 2,625 2,386 4.0x 151.7x 43.6x 19.9x F5 Networks 1,988 2,100 2,107 521 10,123 9,686 4.6x 18.6x 16.4x 13.2x Micro Focus International 2,979 2,667 2,330 1,042 1,626 5,199 1.9x 5.0x 5.1x 6.2x NetApp 5,349 4,884 4,629 1,060 13,164 12,440 2.5x 11.7x 11.3x 12.0x NetScout Systems 786 803 685 131 1,781 1,820 2.3x 13.9x 13.6x 11.3x Pegasystems 814 893 1,022 -93 9,770 9,808 11.0x - - 188.4x Software AG 891 835 828 178 2,775 2,555 3.1x 14.3x 12.7x 15.3x Progress Software 369 391 427 141 1,643 1,943 5.0x 13.7x 14.1x 12.3x Radware 225 219 223 15 1,043 849 3.9x 57.9x 35.0x 25.7x NTT DATA 16,857 18,766 17,678 2,736 17,730 21,850 1.2x 8.0x 8.6x 8.6x ServiceNow 3,092 3,965 4,732 603 92,439 94,661 23.9x 157.0x 118.2x 66.2x VMware 8,195 9,683 9,653 1,840 13,450 52,387 5.4x 28.5x 20.7x 13.7x Mean 6.1x 37.5x 25.0x 28.6x Median 4.8x 18.6x 16.4x 14.5x
Stock Market Valuation (in EURm)
Rolling CTA Index
Announced date
Buyer Target EV (EURm) EV/Revenue EV/EBITDA
Nov-20 365 Services Atlantic Metro Communications - - -
Oct-20 I Squared Capital GTT 2,150 5.7x 12.0x
Sep-20 Telefonaktiebolaget LM Ericsson CradlePoint 929 8.0x -
Sep-20 DataBank Zayo Group 1,202 - -
Jul-20 Hewlett-Packard Enterprise Silver Peak Systems 817 - -
‒ Whilst many industries have witnessed considerableshifts in light of the global pandemic, IT infrastructurehas proven to be one of the most resilient sub-sectors.
‒ The mass adoption of cloud-based technology and therenewed focus on IT infrastructure by internationalgovernments have been key drivers of growth in H22020.
‒ The sustained growth has attracted private equity funds,accompanied by an estimated USD 853 billion of drypowder, to the sub-sector. Private equity transactionsaccounted for 22% of IT infrastructure deals in H2 2020.
‒ As more capital is deployed in the sector this is likely tospur innovation, while inadvertently prompting a waveof M&A activity as large corporates substitute R&Dexpenditure and organic development to focus onacquisitions strategies.
‒ Throughout 2020, the M&A market has been dominatedby US acquirers with cross-border transactionsremaining above 30% during H2 2020.
20%
60%
100%
140%
180%
Dec-19 Mar-20 Jun-20 Sep-20 Dec-20
Variable Median
Enterprise Value 8,034
Market Cap 8,333
EV/ NTM Sales 4.0x
EV/NTM EBITDA 12.6x

www.thecfigroup.com | Software & IT Services M&A Pulse 14
Trends
Selected Transactions
SummaryIT Security
CompanyRevenues Revenues Revenues EBITDA Market
Cap Enterprise
ValueEV/
RevenuesEV/EBITDA EV/EBITDA EV/EBITDA
FY 2019 FY 2020 FY 2021 FY 2020 current 3-year avg next FYCheck Point Software Technologies 1,782 1,811 1,758 817 13,418 12,211 6.7x 14.9x 14.9x 14.6x SecureWorks Corp. Class A 442 495 462 -8 160 921 1.9x - 274.2x 37.2x CyberArk Software Ltd. 388 407 406 19 5,239 4,856 11.9x 252.5x 99.9x 155.4x FireEye, Inc. 794 825 828 -28 3,914 3,935 4.8x - 1,018.3x 31.3x Fortinet, Inc. 1,933 2,276 2,519 492 23,174 22,356 9.8x 45.5x 42.3x 30.8x Intercede Group plc 11 12 13 2 58 52 4.4x 30.9x 36.1x 24.8x F-Secure Oyj 217 220 234 33 611 597 2.7x 18.0x 20.7x 16.4x Palo Alto Networks, Inc. 2,551 3,077 3,398 294 31,752 31,497 10.2x 107.1x 80.6x 39.5x Proofpoint, Inc. 794 921 988 25 6,595 6,650 7.2x 270.8x 105.4x 40.1x Qualys, Inc. 287 318 330 114 3,302 3,211 10.1x 28.3x 28.3x 24.4x Sophos Group Plc 446 489 - -49 - - - - - -VeriSign, Inc. 1,100 1,110 1,133 764 18,490 19,364 17.4x 25.4x 25.5x 25.9x Varonis Systems, Inc. 227 257 300 -52 5,913 5,425 21.1x - - 395.1x Trend Micro Incorporated 1,354 1,430 1,417 511 6,202 4,477 3.1x 8.8x 9.8x 10.7x OneSpan Inc. 227 169 186 7 867 769 4.5x 106.8x 48.0x 48.4x Zix Corporation 155 179 201 43 477 703 3.9x 16.5x 19.8x 14.8x Mean 8.0x 71.2x 121.6x 60.6x Median 6.7x 28.3x 36.1x 30.8x
Stock Market Valuation (in EURm)
Rolling CTA Index
Announced Date
Buyer Target EV (EURm) EV/Revenue EV/EBITDA
Dec-20 Defensury Zer0Data 31 - -
Dec-20 NortonLifeLock Avira 359 5.2x 39.5x
Dec-20 Atos Motiv ICT Security - - -
Dec-20 Veritas Capital Northrop Grumman 2,800 - -
Nov-20 Nasdaq Verafin 951 - -
Nov-20 Palo Alto Networks Expanse 567 - -
Nov-20 FireEye Respond Software 168 - -
Oct-20 Francisco Partners Forcepoint 931 1.6x -
Sep-20 Infocert(Tinexa) Authada - - -
Aug-20 Fastly Signal Sciences 657 - -
‒ The need for security is an emerging megatrend thatincreases awareness of businesses and creates manifolduse cases.
‒ Cybercrime becomes better organised and damage hasincreased tremendously; permanent innovation in theTech sector to build solutions against fraud is required.
‒ Work is being organised more and more throughdecentral hub solutions caused by COVID-19 regulation– leading to far higher requirements to securitystandards. This in a consequence leads to moreinorganic add-ons to product portfolios.
‒ As the pandemic caused companies to re-evaluate theirstructure and focus on core business, the resultingdivestments are sure to drive M&A activity. One of thebiggest deals, Northrop, underlines this trend.
‒ The amount of available capital in the market and theresulting pressure to allocate it are generally favourableconditions.
‒ Significant value increase of Tech providers, especiallyrepresented by players from tech hubs such Israel.
20%
60%
100%
140%
180%
Dec-19 Mar-20 Jun-20 Sep-20 Dec-20
Variable Median
Enterprise Value 3,142
Market Cap 3,329
EV/ NTM Sales 5.2x
EV/NTM EBITDA 24.3x

www.thecfigroup.com | Software & IT Services M&A Pulse 15
Trends
Selected Transactions
SummaryIT Services
CompanyRevenues Revenues Revenues EBITDA Market
Cap Enterprise
ValueEV/
RevenuesEV/EBITDA EV/EBITDA EV/EBITDA
FY 2019 FY 2020 FY 2021 FY 2020 current 3-year avg next FYAccenture 38,142 39,825 39,379 7,489 138,856 131,909 3.3x 17.6x 18.7x 18.0x Atos 11,588 11,181 11,319 1,523 7,000 9,036 0.8x 5.9x 5.4x 5.4x Bechtle 5,374 5,807 6,417 368 6,804 6,928 1.2x 18.8x 19.5x 17.2x Capgemini 14,125 15,848 16,838 2,649 23,470 32,055 2.0x 12.1x 12.7x 11.7x Capita 4,193 3,786 3,922 351 767 2,154 0.6x 6.1x 5.1x 5.2x Computacenter 5,759 6,306 7,264 295 2,883 2,866 0.5x 9.7x 10.0x 9.7x CGI 8,092 8,076 8,036 1,489 14,184 18,087 2.2x 12.2x 12.1x 11.0x DXC Technology 17,931 17,621 14,539 2,731 5,427 8,903 0.5x 3.3x 3.1x 4.3x Devoteam 762 756 787 90 845 786 1.0x 8.7x 8.6x 8.7x Fujitsu 30,794 31,937 28,388 3,573 25,740 24,675 0.8x 6.9x 8.3x 8.0x Ordina 372 369 382 51 320 319 0.9x 6.3x 7.0x 6.6x NEC 3,204 3,044 3,131 232 1,324 1,966 0.6x 8.5x 6.6x 6.2x Neurones 22,699 25,624 23,371 2,504 13,418 18,721 0.7x 7.5x 9.1x 8.5x Nippon Telegraph and Telephone 510 525 551 68 651 493 0.9x 7.3x 7.3x 6.9x Reply 92,559 98,509 91,402 26,930 85,954 144,944 1.5x 5.4x 5.6x 6.0x Sopra Steria Group 1,183 1,242 1,397 199 3,865 3,757 3.0x 18.9x 19.0x 16.6x Mean 1.3x 9.7x 10.0x 9.5x Median 0.9x 8.1x 8.4x 8.2x
Stock Market Valuation (in EURm)
Rolling CTA Index
Announced Date
Buyer Target EV (EURm) EV/Revenue EV/EBITDA
Dec-20 Netrix Prosum (IT Services Business Unit) - - -
Dec-20 Alten IT Sector CFI Confidential
Nov-20 Ratiodata Accesa IT Systems - - -
Nov-20 Tata Consultancy Services Postbank Systems - - -
Oct-20 China Reform Culture Beijing Huatec Information Tech. 138 - -
Oct-20 Rightpoint Consulting Somethingdigital - - -
Sep-20 Devoteam Fourcast - - -
Aug-20 Triton Investment Management HiQ International 367 - 17.0x
Jul-20 Wipro IVIA Serviços de Informática 20 1.7x -
Jul-20 Qvest Media Dimensional - - -
‒ M&A activity in IT Services slowed slightly overallduring the first half of 2020, as companies reduced oreliminated many forms of spending in response to thepandemic. However, after a few months of adjusting tothe crisis, low interest rates — coupled with a potentialvaccine in sight — improved M&A activity dramaticallyin the second half of the year in the sector.
‒ Furthermore, while the pandemic has hurt the broadereconomy, the IT Services sector has been less impacted,as consumers and businesses have looked fortechnology solutions to support digital transformation.
‒ Although deal volume stayed low compared to prioryears in 2020, tech deal-makers appear to haveincreasing levels of optimism, which could lead torecord-breaking activity in 2021.
20%
60%
100%
140%
180%
Dec-19 Mar-20 Jun-20 Sep-20 Dec-20
Variable Median
Enterprise Value 8,535
Market Cap 5,439
EV/ NTM Sales 0.8x
EV/NTM EBITDA 7.4x

www.thecfigroup.com | Software & IT Services M&A Pulse 16
Trends
Selected Transactions
SummaryManaged Services
Stock Market Valuation (in EURm)
Rolling CTA Index
Announced Date
Buyer Target EV (EURm) EV/Revenue EV/EBITDA
Nov-20 SIGEFI Private Equity PACK Solutions - - -
Oct-20 Netcall Oakwood Technologies - - 176.0x
Oct-20 Stonecourt Capital 365 Services - - -
Sep-20 Groupe DFM Nevox - - -
Sep-20 Cognizant Technology Solutions 10th Magnitude 112 7.4x -
Sep-20 Holding Baelen Gaillard Factoria - - -
Sep-20 MML Capital Partners Click Networks - - -
Sep-20 WIIT myLoc managed IT 50 3.1x 6.8x
Sep-20 Vosko Networking Damecon Group - - -
Jul-20 GSH Private Capital Getronics Belgium 200 - -
CompanyRevenues Revenues Revenues EBITDA Market
Cap Enterprise
ValueEV/
RevenuesEV/EBITDA EV/EBITDA EV/EBITDA
FY 2019 FY 2020 FY 2021 FY 2020 current 3-year avg next FYAmdocs 3,624 3,724 3,497 702 8,316 7,925 2.1x 11.3x 11.0x 10.5x GoDaddy 2,667 2,907 3,051 452 11,483 13,510 4.6x 29.9x 24.6x 16.7x Softcat 1,124 1,226 1,372 113 3,519 3,444 2.8x 30.6x 30.8x 27.6x Rackspace Technology 2,178 2,375 2,493 500 3,486 6,250 2.6x 12.5x 10.6x 9.6x HCL Technologies 7,465 8,972 8,592 2,228 28,359 28,131 3.1x 12.6x 13.5x 12.3x Proact IT Group 322 346 391 35 298 295 0.9x 8.3x 8.4x 7.2x Redcentric 106 100 107 9 221 237 2.4x 27.3x 12.8x 8.4x United Internet 5,194 5,362 5,529 1,162 7,360 8,931 1.7x 7.7x 7.4x 7.3x
Mean 2.5x 17.5x 14.9x 12.4x Median 2.5x 12.6x 11.9x 10.1x
‒ The Managed Services sector has remained robustduring the pandemic, backed by the continuity given bymulti-year contracts which provides downsideprotection in times of uncertainty from COVID-19.
‒ This sentiment is shared by the segment as a whole.However, the gains are expected to be concentratedamong the players that are the most mature and themost competitive in their markets.
‒ MSPs in select end-markets such as hospitality andtravel have been, on the other hand, materiallyimpacted by the pandemic.
‒ Several companies are accelerating ongoing cloud
migration as workforces for both small and largeenterprises shift to working-from-home.
‒ This shift, which is expected to persist in a post-COVID-19 era, has driven significant demand forremote-centric solutions, particularly security services.
‒ For this reason, legacy IT service providers areexhibiting an increasing hunger to acquire smaller nichemanaged services specialists.
‒ M&A volume for Managed Services has followed thistrend with an y-o-y increase, with a total of 963 deals(vs. 865 in H2 2019).
20%
60%
100%
140%
180%
Dec-19 Mar-20 Jun-20 Sep-20 Dec-20
Variable Median
Enterprise Value 6,867
Market Cap 3,866
EV/ NTM Sales 2.1x
EV/NTM EBITDA 8.9x

www.thecfigroup.com | Software & IT Services M&A Pulse 17
Trends
Selected Transactions
SummaryNear- & Offshoring
Rolling CTA Index
Stock Market Valuation (in EURm)
Announced Date
Buyer Target EV (EURm) EV/Revenue EV/EBITDA
Oct-20 Accenture Zag 26 - -
Oct-20 TenPearls TCT Computing Group - - -
Oct-20 Inflexion Private Equity Partners Sparta Global - - -
Aug-20 Ant Capital Partners Softbrain 174 2.2x 15.0x
Jul-20 Planlogic SW Business Solutions - - -
Jul-20 Wipro IVIA Serviços de Informática 20 1.7x -
CompanyRevenues Revenues Revenues EBITDA Market
Cap Enterprise
ValueEV/
RevenuesEV/EBITDA EV/EBITDA EV/EBITDA
FY 2019 FY 2020 FY 2021 FY 2020 current 3-year avg next FYCognizant Technology Solutions 14,995 14,607 14,698 2,531 32,273 32,133 2.2x 12.7x 11.7x 11.6x HCL Technologies 7,465 8,972 8,581 2,228 28,429 27,555 3.1x 12.4x 13.2x 12.0x Infosys 10,213 11,525 11,397 2,875 61,383 59,019 5.1x 20.5x 20.5x 18.7x Larsen & Toubro Infotech 1,167 1,381 1,404 263 7,554 7,257 5.3x 27.5x 27.1x 23.6x Persistent Systems 415 451 474 64 1,441 1,286 2.9x 20.2x 17.9x 16.7x Tata Consultancy Services 18,093 19,923 18,642 5,345 126,496 120,605 6.1x 22.6x 23.4x 23.1x Tech Mahindra 4,292 4,680 4,314 744 10,479 8,595 1.8x 11.5x 11.2x 11.1x Wipro 7,237 7,746 7,020 1,552 26,136 23,395 3.0x 15.1x 15.0x 13.9x
Mean 3.7x 17.8x 17.5x 16.3x Median 3.0x 17.6x 16.5x 15.3x
‒ The pandemic has accelerated the transition to remoteworking which has subsequently boosted corporates’confidence in managing and delivering projectsremotely.
‒ Remote working is expected to drive cost-savingsenabling growth in both offshoring and onshoringoutsourcing practices.
‒ Corporates are likely to accelerate their outsourcingoperations with purchasing decisions being driven byspeed, quality, flexibility, and cost as opposed to moretraditional factors such as geography.
‒ As geographic location becomes a less influential factorin purchasing decisions, cross-border transactions arelikely to become more prevalent as acquirers look toforeign markets for growth and cost savingopportunities. In the H2 2020, over 50% of transactionswere cross-border transactions.
20%
60%
100%
140%
180%
Dec-19 Mar-20 Jun-20 Sep-20 Dec-20
Variable Median
Enterprise Value 17,839
Market Cap 19,365
EV/ NTM Sales 2.1x
EV/NTM EBITDA 10.3x

www.thecfigroup.com | Software & IT Services M&A Pulse 18
Trends
Trends
Capital Invested by Exit Type
SummaryPrivate Equity
Capital Invested & Deal Count
Total Capital Raised & Fund Count
Capital Raised by Countries
‒ After a fall in Q2 2020, PE deal activity came boomingback in H2 2020 to record its third-highest annual valuein over a decade. Meanwhile, quarterly deal volume hita fresh peak in Q4 2020.
‒ Managers moved quickly to close on assets thatbenefitted from the IT adoption and transformationtrend, highlighted by IT deal volume proportions hittinga new high.
‒ IT exit volume proportions substantially increased in2020, hitting a new high. Close to 20% of all exitvolume came from the sector, up from 12% a decade
ago, predictably mirroring the trend seen in dealmaking.
‒ PE fundraising experienced an extremely strong year,with capital raised hitting its third-highest value ever,though fund counts dipped to a new trough.
‒ Looking to 2021, we expect sector confidence willpropel deal activity to a new high, fueled by tight creditspreads, low interest rates, and a healthy fundraisingenvironment
1,040 422 219 319 377 407 483 631 941 897 1,022 1,117 981 1,002
11.9 10.7
7.9
10.6 12.2 13.0
14.0
16.9
19.5 19.2 20.4
21.8 21.7 20.2
0
5
10
15
20
25
-
200
400
600
800
1,000
1,200
2007 2008 2009 2010 2011 2012 2013 2014 2015 2016 2017 2018 2019 2020
Deal
co
un
t (x
1,0
00
)
Cap
ital
in
vest
ed
(E
UR
bn
)
Capital invested Deal count
425 329 197 169 201 255 345 413 444 495 533 598 567 427
865 788
556 593
657 699
767
929 848
897 880 800
608
408
-
200
400
600
800
1,000
-
100
200
300
400
500
600
700
2007 2008 2009 2010 2011 2012 2013 2014 2015 2016 2017 2018 2019 2020
Fu
nd
co
un
t
Cap
ital
rai
sed
(E
UR
bn
)
Total capital raised Fund count
62%13%
3%
4%
1%
2%
3%1%
12%
USA
UK
China
France
India
Germany
Japan
Netherlands
50%
19%
25%
6%
0%
Secondary Buyout
Merger/Acquisition
Buyout
IPO
Other
www.thecfigroup.com | Software & IT Services M&A Pulse
Case study 3SummaryTombstones
19

Disclaimer
www.thecfigroup.com | Software & IT Services M&A Pulse 20
This market overview is not an offer to sell or asolicitation of an offer to buy any security. It is notintended to be directed to investors as a basis for makingan investment decision. This market overview does notrate or recommend securities of individual companies,nor does it contain sufficient information upon which tomake an investment decision.Corporate Finance International B.V., its affiliates and/orassociated companies will seek to provide investmentbanking and/or other services to one or more of thecompanies mentioned in this market overview.Corporate Finance International B.V., its affiliates and/orassociated companies, and/or the analysts who preparedthis market update, may own securities of one or more ofthe companies mentioned in this market overview.The information provided in this market overview wasobtained from sources believed to be reliable, but itsaccuracy cannot be guaranteed. It is not to be construedas legal, accounting, financial, or investment advice.Information, opinions, and estimates reflect CorporateFinance International B.V.’s, its affiliates’ and/orassociated companies’ judgment as of the date ofpublication and are subject to change without notice.Corporate Finance International B.V., its affiliates and/or
associated companies undertakes no obligation to notifyany recipient of this market overview of any such change.The charts and graphs used in this market overview havebeen compiled by Corporate Finance International B.V.,its affiliates and/or associated companies solely forillustrative purposes. All charts are as of the date ofissuance of this market overview, unless otherwise noted.Any index included in the document may not be inclusiveof all companies in the relevant industry and is not acomposite index of that relevant industry’s sector returns.Index and sector returns are past performance which isnot an indicator of future results.This market overview is not directed to, or intended fordistribution to, any person in any jurisdiction where suchdistribution would be contrary to law or regulation, orwhich would Corporate Finance International B.V., itsaffiliates and/or associated companies to licensing orregistration requirements in such jurisdiction.© 2021 Corporate Finance International B.V., Amstelzijde85, 1184 TZ Amstelveen, the Netherlands.
Case study 3SummaryContact & Disclaimer
France91 rue du Faubourg Saint-HonoréFR-75008 ParisT +331 44 13 88 18
NetherlandsAmstelzijde 85NL, 1184 TZ AmstelveenT +318 82 06 03 46
United Kingdom23 Berkeley SquareW1J 6HE LondonT +440 845 643 5500
PortugalAv. Nossa Senhora doRosário,603 – Bloco 1-2º M, 2750-179 CascaisT +351 21 48 18 390
SwedenSveavägen 9111 57 StockholmT +31 42 19 20
BelgiumZuiderlaan 14B 1731, Brussels (Zellik)T: +32 (0)495 59 49 52
GermanyNeuer Zollhof 340221 DüsseldorfT: +49 211 137 070
JapanSumitomo Fudosan3-2-11 Kudankita, TokyoT: +81-3-35 14 13 81


![[ 1 ] - CFI](https://img.pdfslide.net/doc/110x75/62745ab3b8755b501d68081b/-1-cfi.jpg)