Embed Size (px)
Citation preview
7/28/2019 Soil Investigations
http://slidepdf.com/reader/full/soil-investigations 1/32
TECHNICAL REPORT ON THE SOIL INVESTIGATION FOR THE
ARGYLE INTERNATIONAL AIRPORT PROJ ECT,
SAINT VINCENT
06/09/2006
7/28/2019 Soil Investigations
http://slidepdf.com/reader/full/soil-investigations 2/32
1
Contents
1. Introduction 1
2. Geography of Saint Vincent 1
3. Geologic Recognition 3
3.1. Petrologic characterization of the material of the site 4
3.2. Seismicity of the area 7
3.3. Geotechnical characterization of the rocks of the site 8
3.4. Behavior of the subsoil material in the perforations 9
4. Work methodology 11
4.1. Field work 11
4.2. Location of the test pits and perforations 144.3. Lithology of the test pits and perforations 19
4.4. Hydrogeology 20
4.4.1. Permeability tests on site 20
4.4.2 Detection of water levels 21
4.5. Work methodology in the laboratory 22
5. Tests results 23
5.1 Mt. Coke elevation 24
5.2 Cut elevation: stations 98+0.00 to 114+0.00 26
5.3 Elevation to the left of station 200+0.00 (Argyle Hill) 27
5.4 Elevation: stations 260+0.00 to 274+0.00 27
5.5 Second stage of Investigation 28
6. General conclusions and recommendations 33
Annex 1. Longitudinal lithologic profile on the centerline of the runway
Annex 2. Lithology of perforations and test pits
Annex 3. Graphical design CBR.
Annex 5. Result of compression tests of rock nuclei
Annex. 6. Summary Table for perforations
7/28/2019 Soil Investigations
http://slidepdf.com/reader/full/soil-investigations 3/32
2
1 Introduction
The present report is the result of soil investigation that was done in the project area of
the Argyle International Airport, in the island of Saint Vincent, with the objective of knowing the geo-mechanic characteristics of the soil in the site designated for therunway. As a result we hope to define the parameters for the design complying with anagreement that was made between the governments of the Republic of Cuba, theBolivarian Republic of Venezuela and Saint Vincent and the Grenadines.
2- Geography of Saint Vincent
Saint Vincent is located within the southern part of the Lesser Antilles of the Caribbean.It is approximately 100 miles to the west of Barbados, 68 miles to the north of Grenada
and about 190 miles to the north of Trinidad. Saint Vincent is the largest of 32 islandsand cays that constitute the nation of Saint Vincent and the Grenadines. It is more or less of an oval form with 29 kms in length and 17.5 kms in width. The island consists of a central axial mountain range that begins in the north at the site known as La Soufrière,an active volcano 1178ms in height, and finishes in the south at the site known as St.
Andrew, 736ms in height. This volcanic mountain range almost divides the island in twoequal halves, an Eastern or windward side and a leeward side. The north-south center line of the island shows migration originating from the volcanic activity, with
predominance of olivine, Scoria cones and basalts, product of the small explosiveeruptions (Rowley 1978a).
The Eastern Caribbean is an example of a system of arc of islands formed on theextremes of the convergent plate (in other words, on a subjacent zone where twotectonic plates meet and the denser plate forces the lighter plate downwards). This isthe main cause of the volcanic and seismic activity in the Eastern Caribbean. Most of the earthquakes that happen in the Eastern Caribbean are of tectonic or volcanic origin.The tectonic earthquakes are generated when the accumulated energy flows and
produces the movement of the plates. The volcanic earthquakes are generated by themovement of magma within the lithosphere. The magma is less dense than thesurrounding rocks, for such reason it rises to the surface, while the rocks move, in that way generating earthquakes. In fact, more than 75% of earthquakes happen in the limitsof the convergent plates. The countries of the Eastern Caribbean are therefore very
susceptible to earthquakes.
7/28/2019 Soil Investigations
http://slidepdf.com/reader/full/soil-investigations 4/32
3
3- Geologic recognition
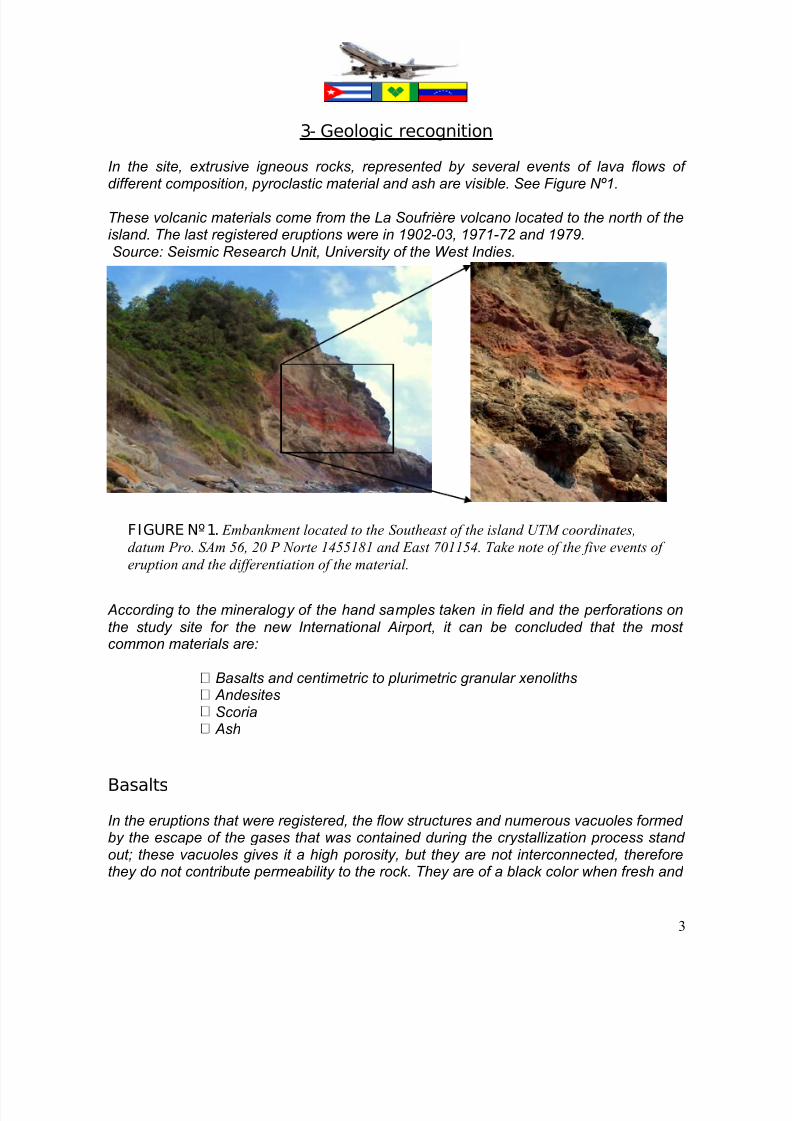
In the site, extrusive igneous rocks, represented by several events of lava flows of
different composition, pyroclastic material and ash are visible. See Figure Nº1.
These volcanic materials come from the La Soufrière volcano located to the north of theisland. The last registered eruptions were in 1902-03, 1971-72 and 1979.Source: Seismic Research Unit, University of the West Indies.
According to the mineralogy of the hand samples taken in field and the perforations onthe study site for the new International Airport, it can be concluded that the most common materials are:
Basalts and centimetric to plurimetric granular xenoliths Andesites Scoria
Ash
Basalts
In the eruptions that were registered, the flow structures and numerous vacuoles formed by the escape of the gases that was contained during the crystallization process stand out; these vacuoles gives it a high porosity, but they are not interconnected, thereforethey do not contribute permeability to the rock. They are of a black color when fresh and
FIGURE Nº 1. Embankment located to the Southeast of the island UTM coordinates,
datum Pro. SAm 56, 20 P Norte 1455181 and East 701154. Take note of the five events of
eruption and the differentiation of the material.
7/28/2019 Soil Investigations
http://slidepdf.com/reader/full/soil-investigations 5/32
4
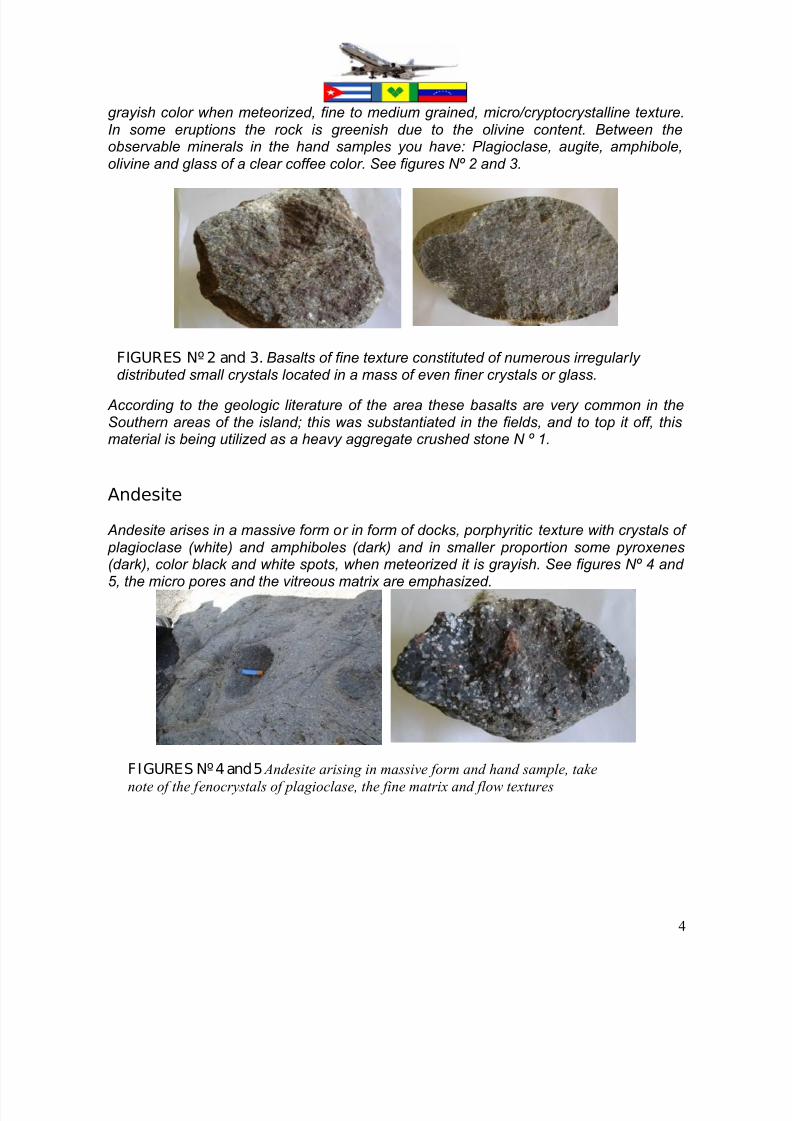
grayish color when meteorized, fine to medium grained, micro/cryptocrystalline texture.In some eruptions the rock is greenish due to the olivine content. Between theobservable minerals in the hand samples you have: Plagioclase, augite, amphibole,olivine and glass of a clear coffee color. See figures Nº 2 and 3.
According to the geologic literature of the area these basalts are very common in theSouthern areas of the island; this was substantiated in the fields, and to top it off, thismaterial is being utilized as a heavy aggregate crushed stone N º 1.
Andesite
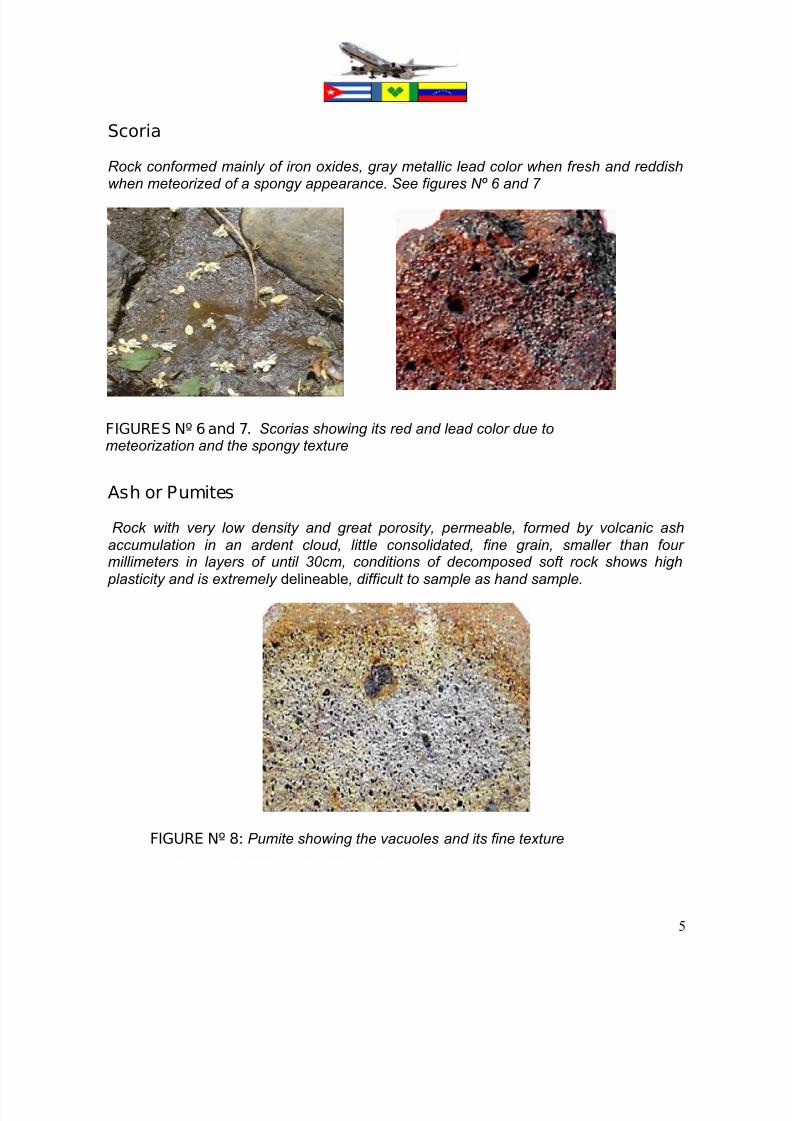
Andesite arises in a massive form or in form of docks, porphyritic texture with crystals of plagioclase (white) and amphiboles (dark) and in smaller proportion some pyroxenes
(dark), color black and white spots, when meteorized it is grayish. See figures Nº 4 and 5, the micro pores and the vitreous matrix are emphasized.
FIGURES Nº 2 and 3. Basalts of fine texture constituted of numerous irregularly
distributed small crystals located in a mass of even finer crystals or glass.
FIGURES Nº 4 and 5Andesite arising in massive form and hand sample, take
note of the fenocrystals of plagioclase, the fine matrix and flow textures
7/28/2019 Soil Investigations
http://slidepdf.com/reader/full/soil-investigations 6/32
5
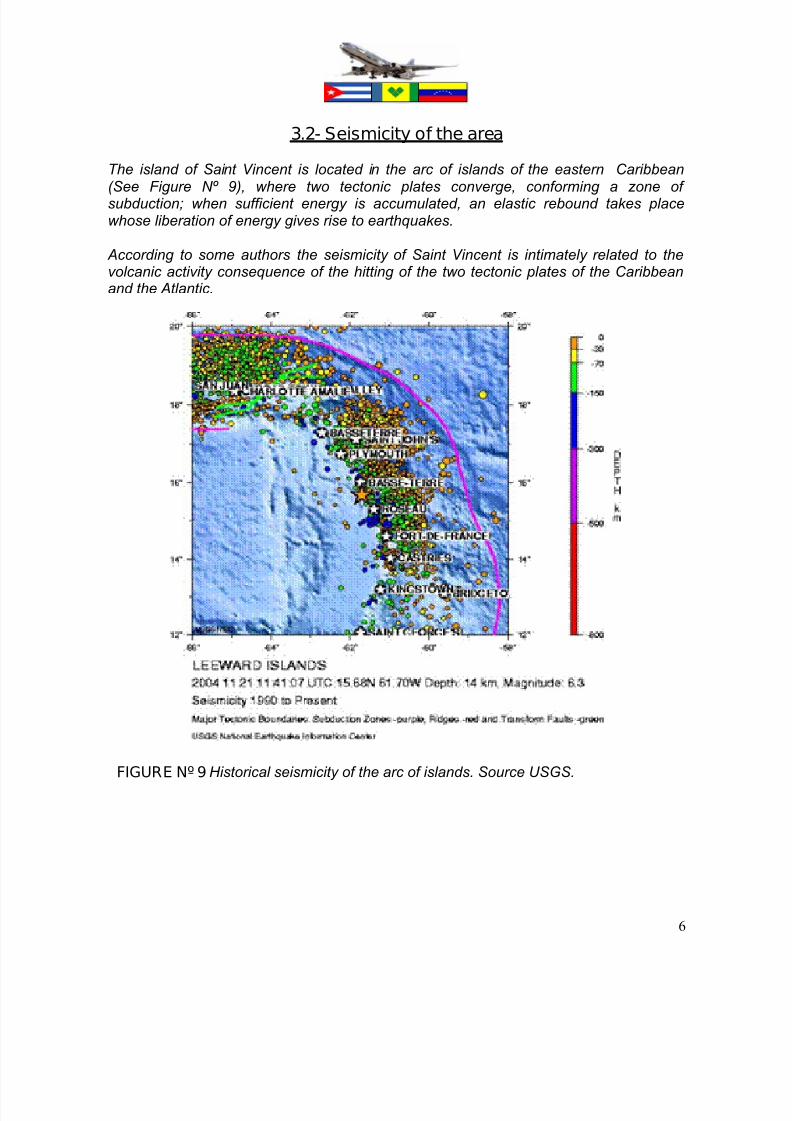
FIGURE Nº 8: Pumite showing the vacuoles and its fine texture
Scoria
Rock conformed mainly of iron oxides, gray metallic lead color when fresh and reddish
when meteorized of a spongy appearance. See figures Nº 6 and 7
Ash or Pumites
Rock with very low density and great porosity, permeable, formed by volcanic ashaccumulation in an ardent cloud, little consolidated, fine grain, smaller than four
millimeters in layers of until 30cm, conditions of decomposed soft rock shows high plasticity and is extremely delineable, difficult to sample as hand sample.
FIGURES Nº 6 and 7. Scorias showing its red and lead color due tometeorization and the spongy texture
7/28/2019 Soil Investigations
http://slidepdf.com/reader/full/soil-investigations 7/32
6
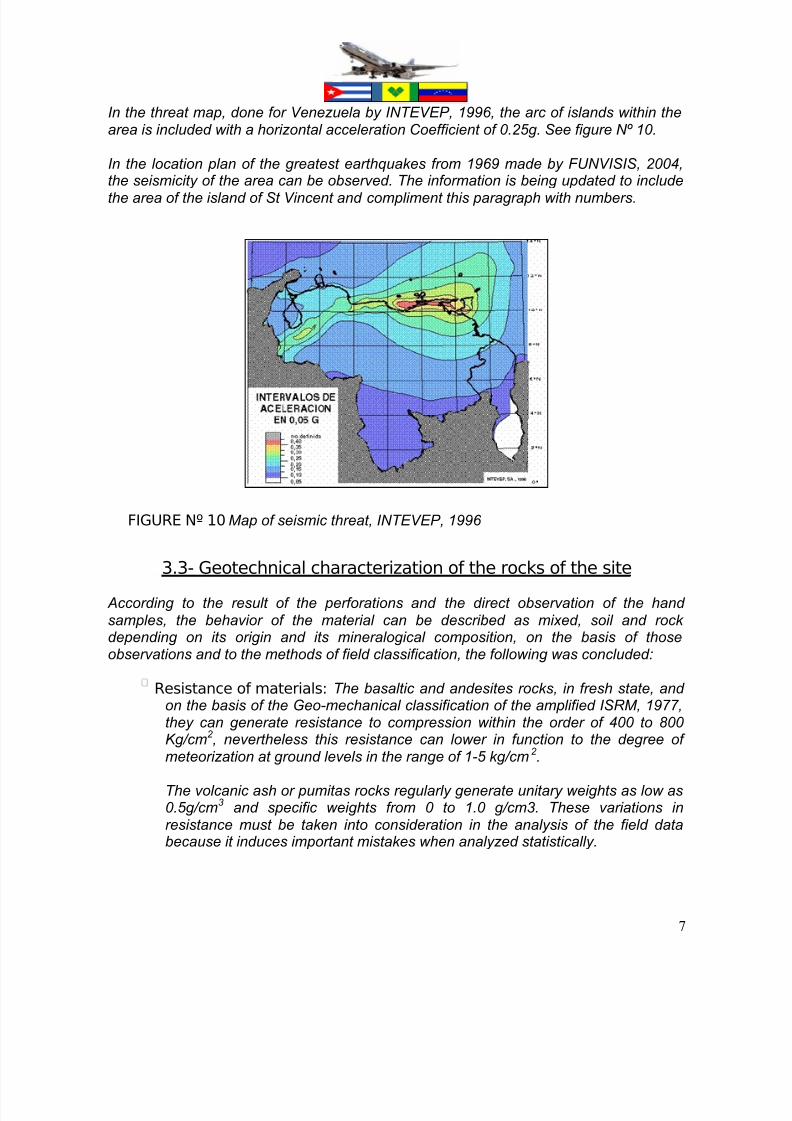
FIGURE Nº 9 Historical seismicity of the arc of islands. Source USGS.
3.2- Seismicity of the area
The island of Saint Vincent is located in the arc of islands of the eastern Caribbean
(See Figure Nº 9), where two tectonic plates converge, conforming a zone of subduction; when sufficient energy is accumulated, an elastic rebound takes placewhose liberation of energy gives rise to earthquakes.
According to some authors the seismicity of Saint Vincent is intimately related to thevolcanic activity consequence of the hitting of the two tectonic plates of the Caribbeanand the Atlantic.
7/28/2019 Soil Investigations
http://slidepdf.com/reader/full/soil-investigations 8/32
7
FIGURE Nº 10 Map of seismic threat, INTEVEP, 1996
In the threat map, done for Venezuela by INTEVEP, 1996, the arc of islands within thearea is included with a horizontal acceleration Coefficient of 0.25g. See figure Nº 10.
In the location plan of the greatest earthquakes from 1969 made by FUNVISIS, 2004,
the seismicity of the area can be observed. The information is being updated to includethe area of the island of St Vincent and compliment this paragraph with numbers.
3.3- Geotechnical characterization of the rocks of the site
According to the result of the perforations and the direct observation of the hand samples, the behavior of the material can be described as mixed, soil and rock depending on its origin and its mineralogical composition, on the basis of thoseobservations and to the methods of field classification, the following was concluded:
Resistance of materials: The basaltic and andesites rocks, in fresh state, and on the basis of the Geo-mechanical classification of the amplified ISRM, 1977,they can generate resistance to compression within the order of 400 to 800 Kg/cm2 , nevertheless this resistance can lower in function to the degree of
meteorization at ground levels in the range of 1-5 kg/cm2 .
The volcanic ash or pumitas rocks regularly generate unitary weights as low as0.5g/cm3 and specific weights from 0 to 1.0 g/cm3. These variations inresistance must be taken into consideration in the analysis of the field databecause it induces important mistakes when analyzed statistically.
7/28/2019 Soil Investigations
http://slidepdf.com/reader/full/soil-investigations 9/32
8
Meteorization: These rocks meteorize mainly to fine soil of medium to high plasticity and those of porphyritic texture can meteorize to sands of mediumgrains. In this type of rocks the meteorization is differential, reason why it isvery common to find rocks in meteorized rock state hard and good conditioned
RMdf next to rocks totally decomposed and soft or RDb.
3.4- Behavior of the subsoil material in the perforations
On the basis of all that was said before, the following was concluded:
The nature of the material is volcanic and highly unstable chemically and mechanically.
Its resistance to meteorization is differentiated by its origin and its mineralogical composition.
Its resistance to penetration is in function of its degree of meteorization. Therefore we have in a same perforation, thicknesses of soil and rock bodies parallelly,with random and not zoned variations.
Initially for this project, a series of perforations by percussion and rotation were prepared where the following was carried out:
Perforation method: perforations by the percussion and rotation method combined were done, whose determination is only made on site and at themoment at which the materials vary its resistance to penetration.
The method of perforation used was based on the ASTM-D1586 standards, that which allows you to find the relative resistance of the different formations of thesoil quickly and simply. In this test, the number of blows needed to perforate30cm (one foot) is counted that which represents one sample in the form of tube that was broken vertically and the number of blows (N) is correlated empirically with the resistence of the soil.
The taking of samples was continuous and very detailed trying, inclusively, totake samples in the washing zone.
The distribution of the perforations were more frequent in the less sloped areasand distributed with higher frequency in the zones of lower slope and less inthe hills, this is due to the fact that the topography is controlled by themeteorization differential, leaving the greater heights to the rocks with greater resistance and the flat and semi-flat zones to softer rocks. The depth of the perforations is based on the quality of the rock or soil asfoundation material in each perforation reason why the depth is only decided according to the quality of the recovered material, and always considering todeepen 3 meters in relation to the height of the runway.
7/28/2019 Soil Investigations
http://slidepdf.com/reader/full/soil-investigations 10/32
9
4- Work Methodology
4.1 Field Work
The work in the fields was done by means of the exploration of the soil by methods of preliminary character, to elaborate the study referred to in the results of the laboratory tests, through the following activities:
1. Technical visits by the team to the field: where the visual inspection wascarried out with the purpose of observing the characteristics that the soil has, tolater select the suitable sites where the sampling was done.
2. Opening and closing of test pits: the work in the field was realized by doing investigations in form of test pits up to a depth of 5.00 ms, where altered samples
were taken so as to perform physical and mechanical tests.3. Perforations: these were done with the aim of determining the characteristics,
thickness and stratification of the subsoil materials and also to find its resistanceto penetration. The perforations using percussion were done following thespecifications of ASTM D1586 norm. This norm was chosen because it rendersthe best practical results and gives very useful information in terms of the subsoil when compared to the rest of the preliminary exploratory procedures. The utility and importance of this test are in the correlations made in the field and thelaboratory in diverse soils, mainly in sands, that allows you to approximately relate the compactness, the angle of internal friction and in clays the value of thesimple compressive strength, with the number of blows necessary, in this soil, for
the standard penetrometer to penetrate the 30cms specified in the requirements.This was done with equipment for perforation that consists of:
·Chisel type reels, continuous drills for superficial holes, with inner diameter of the drill of empty piston rod between 2.2” and 6.5”. Manual drills with solid scoops with inner diameter of 2.2” and 6.5”.
· 140 lbs Percussion hammer. · Divided spoon type Samplers. · Pipe for sampling with unions to connect the divided spoon samplers. · Heads and connected axis. · Tripod. · Monkey wrenches, retaining baskets, derrick of bars, mecate. · Bottles, spatulas, markers, chalk, metric tape. · Level and plummet.
Once the perforation site has been located, the tripod is raised with the pulley connected to it. The level of the equipment was verified with a level. The mecate was
passed through the channel of the pulley and it was supported, coiling it on the rotating cylinder of the machine approximately ¾ times in the counterclockwise sense. Later, the
perforation tube was assembled, the sampler and the hammer head was joined on.
7/28/2019 Soil Investigations
http://slidepdf.com/reader/full/soil-investigations 11/32
10
Once the equipment was assembled, the motor was put into operation; then thehammer with mecate was suspended until an approximate height of 1 m, leaving it tofall freely on the surface of the land. In the inner circle of the print left by the hammer, ahole of 15 cms depth and 10 cms diameter was opened; this was done with the aim of
eliminating the layer of loose material.The sampling was done with the sequence of operations indicated: · On the sampler the length that will be penetrated was marked with chalk, in this
case three marks of 15cms each were done; that corresponded to the 15cmsof repair and 30cms of normal penetration.
· The sampler set, bar and head was placed in the site that will be perforated in avertical position and then the execution of blows with the hammer begun,suspending it until a height of 30” (0,76m) and dropping it freely on the head.
· The number of blows applied for each increase of 0,15m was counted. · Additionally when rejection to the standard penetration was evident, rotating
perforation with the injection of water was done.
4. Geophysical soundings: geophysical soundings were done in the study area of interest for the new Argyle International Airport. Parallel, the geological surveysof surface was done. The applied seismic methods were those of refraction and seismic reflection. In these methods, the time of propagation of the elastic waves,between the site where the seismic waves are generated and the different observing points of arrival. A series of sensors in straight lines at knowndistances were used, forming what is known as seismic laying or line of refractionor seismic reflection. At a known distance on the extreme of laying, in the point of detonation, generating seismic waves, with the aid of a hammer in some pointsand in others by the detonation of explosives, which caused vibrations in the land
that were detected by each of the sensors in the laying. The basic equipment consists of the sensors; the acquisition unit , where themovements of the land detected by each sensor are stored; the connectioncables between the sensors and the unit of acquisition; the trigger cable, which isresponsible to mark the moment in which the registry in the acquisition unit begins. The registries of each sensor have information of the movements of theland based on the time, that which are generated in order to register parametersfor the design. These registries are analyzed in the refraction to obtain the time of arrival of the first waves from the detonation point to each sensor, and in thereflection to obtain data of the waves that are reflected in the different interfacesof the soil.
Additionally, one of the applications of the refraction method, that will beobtained, is the determination of the depth to the base, and for the determinationof the conditions (meteorization, fracturation) and competence of the rock in the
places where the structures will located. The method uses the arrival of the first waves to the geophones, P waves, but also as the arrival of S waves, in such away that the dynamic Poisson's ratio and other modules can be determined.
7/28/2019 Soil Investigations
http://slidepdf.com/reader/full/soil-investigations 12/32
11
4.1. Selection of measurement sites: The selection of sites for therealization of tests was oriented by the necessities of the project, for which13 soundings were made, generating longitudinal and cross-sectional sections in the area of interest. For this, measurements were done in 11
sites in the zone of the airstrip and 2 outside this area with the intention of comparing the measurements with other soil deposits, and these other areas are additionally considered to be obstacles.
4.2- Location of the test pits and perforations
The location of the test pits and perforations obeyed a trefoil distribution in the area of the runway (45m) and in some sites outside this strip considered of interest because of the diversity of the materials found, in order to be able to later correlate the results on
the layout strip. It is important to mention that in the distribution of the investigation, thefirst variant for the location of the runway was considered, and later the definitive variant was taken into consideration.
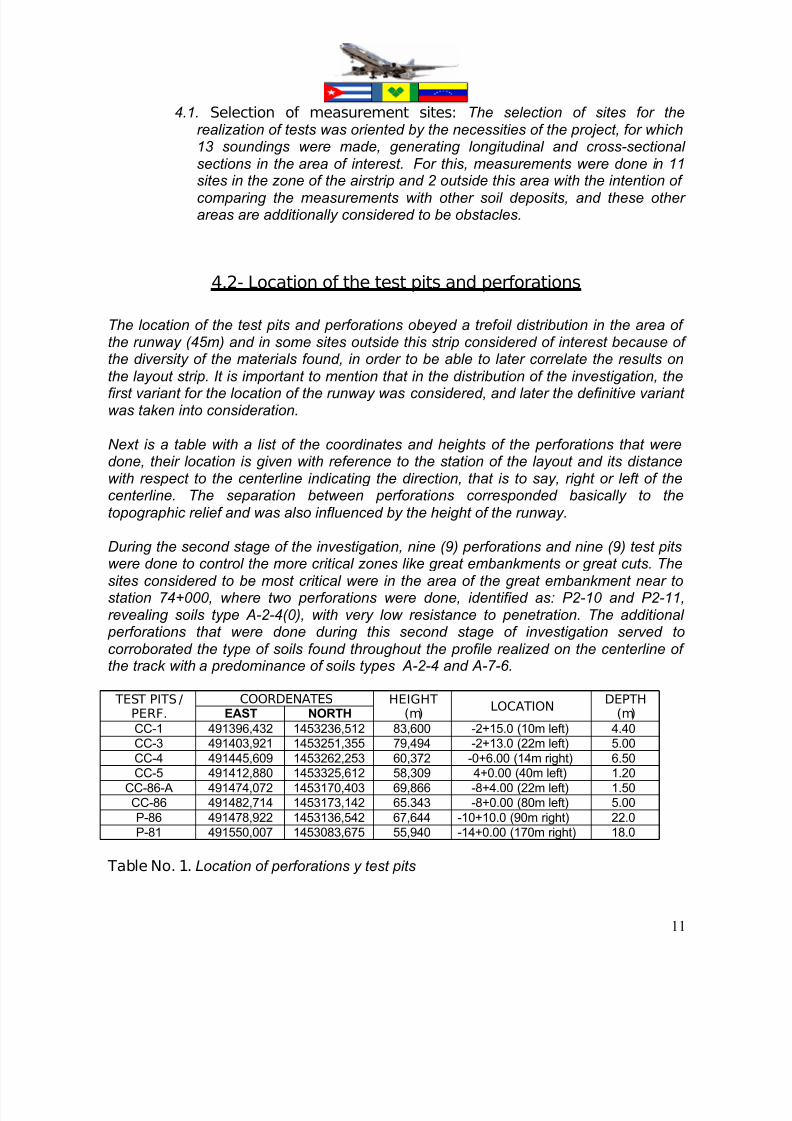
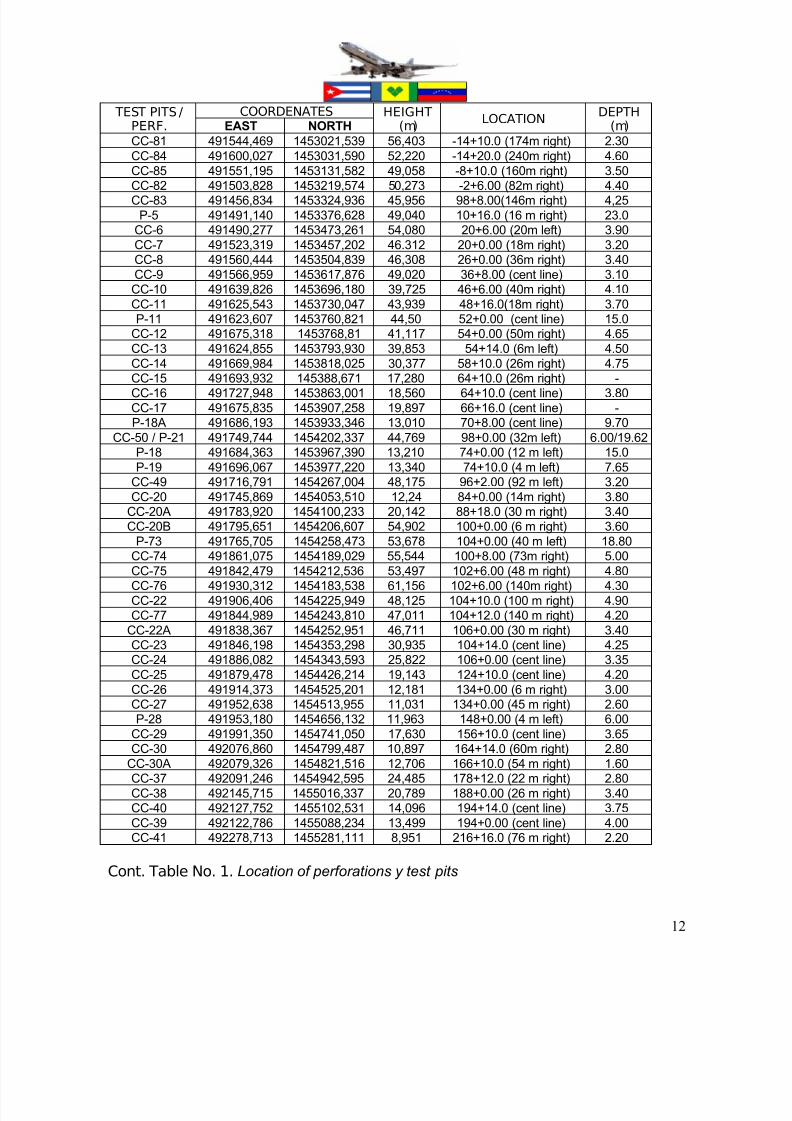
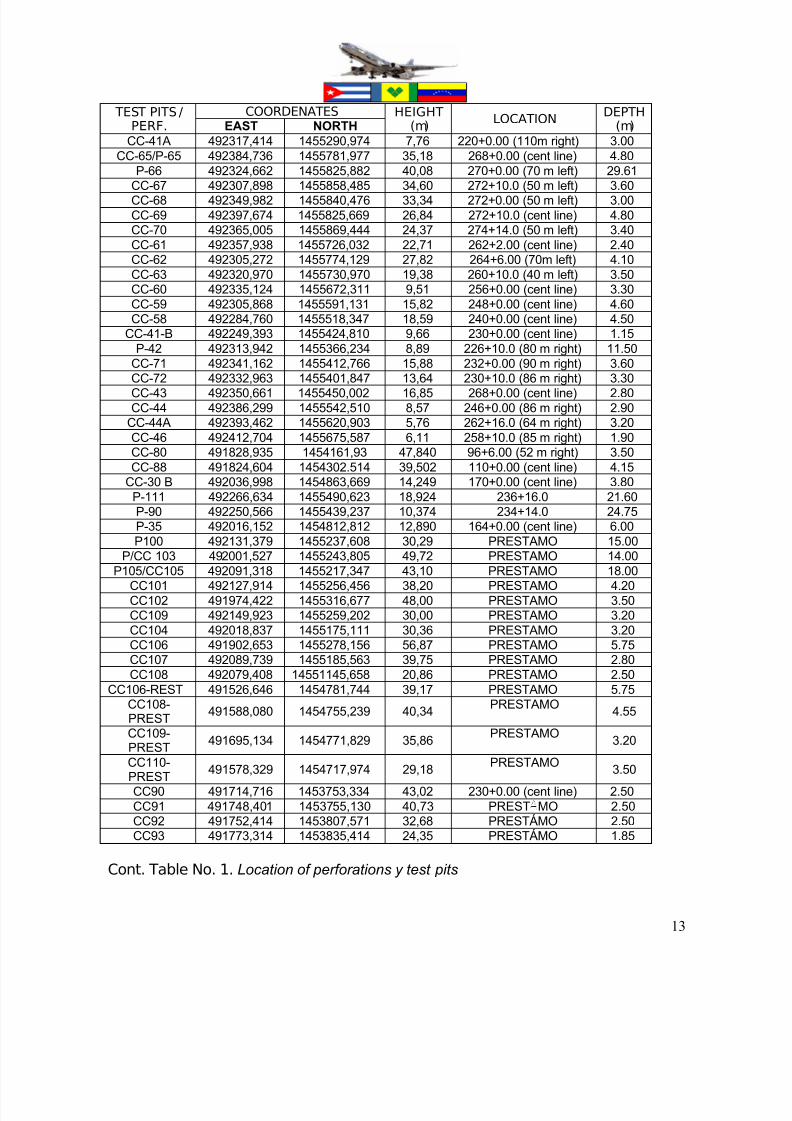
Next is a table with a list of the coordinates and heights of the perforations that weredone, their location is given with reference to the station of the layout and its distancewith respect to the centerline indicating the direction, that is to say, right or left of thecenterline. The separation between perforations corresponded basically to thetopographic relief and was also influenced by the height of the runway.
During the second stage of the investigation, nine (9) perforations and nine (9) test pits
were done to control the more critical zones like great embankments or great cuts. Thesites considered to be most critical were in the area of the great embankment near tostation 74+000, where two perforations were done, identified as: P2-10 and P2-11,revealing soils type A-2-4(0), with very low resistance to penetration. The additional
perforations that were done during this second stage of investigation served tocorroborated the type of soils found throughout the profile realized on the centerline of the track with a predominance of soils types A-2-4 and A-7-6.
TEST PITS /
PERF.
COORDENATES HEIGHT
(m)LOCATION
DEPTH
(m)EAST NORTH
CC-1 491396,432 1453236,512 83,600 -2+15.0 (10m left) 4.40CC-3 491403,921 1453251,355 79,494 -2+13.0 (22m left) 5.00
CC-4 491445,609 1453262,253 60,372 -0+6.00 (14m right) 6.50CC-5 491412,880 1453325,612 58,309 4+0.00 (40m left) 1.20
CC-86-A 491474,072 1453170,403 69,866 -8+4.00 (22m left) 1.50CC-86 491482,714 1453173,142 65.343 -8+0.00 (80m left) 5.00P-86 491478,922 1453136,542 67,644 -10+10.0 (90m right) 22.0P-81 491550,007 1453083,675 55,940 -14+0.00 (170m right) 18.0
Table No. 1. Location of perforations y test pits
7/28/2019 Soil Investigations
http://slidepdf.com/reader/full/soil-investigations 13/32
12
TEST PITS /PERF.
COORDENATES HEIGHT(m)
LOCATIONDEPTH
(m)EAST NORTH
CC-81 491544,469 1453021,539 56,403 -14+10.0 (174m right) 2.30CC-84 491600,027 1453031,590 52,220 -14+20.0 (240m right) 4.60CC-85 491551,195 1453131,582 49,058 -8+10.0 (160m right) 3.50
CC-82 491503,828 1453219,574 50,273 -2+6.00 (82m right) 4.40CC-83 491456,834 1453324,936 45,956 98+8.00(146m right) 4,25P-5 491491,140 1453376,628 49,040 10+16.0 (16 m right) 23.0
CC-6 491490,277 1453473,261 54,080 20+6.00 (20m left) 3.90CC-7 491523,319 1453457,202 46.312 20+0.00 (18m right) 3.20CC-8 491560,444 1453504,839 46,308 26+0.00 (36m right) 3.40CC-9 491566,959 1453617,876 49,020 36+8.00 (cent line) 3.10CC-10 491639,826 1453696,180 39,725 46+6.00 (40m right) 4.10CC-11 491625,543 1453730,047 43,939 48+16.0(18m right) 3.70P-11 491623,607 1453760,821 44,50 52+0.00 (cent line) 15.0
CC-12 491675,318 1453768,81 41,117 54+0.00 (50m right) 4.65CC-13 491624,855 1453793,930 39,853 54+14.0 (6m left) 4.50CC-14 491669,984 1453818,025 30,377 58+10.0 (26m right) 4.75
CC-15 491693,932 145388,671 17,280 64+10.0 (26m right) -CC-16 491727,948 1453863,001 18,560 64+10.0 (cent line) 3.80CC-17 491675,835 1453907,258 19,897 66+16.0 (cent line) -P-18A 491686,193 1453933,346 13,010 70+8.00 (cent line) 9.70
CC-50 / P-21 491749,744 1454202,337 44,769 98+0.00 (32m left) 6.00/19.62P-18 491684,363 1453967,390 13,210 74+0.00 (12 m left) 15.0P-19 491696,067 1453977,220 13,340 74+10.0 (4 m left) 7.65
CC-49 491716,791 1454267,004 48,175 96+2.00 (92 m left) 3.20CC-20 491745,869 1454053,510 12,24 84+0.00 (14m right) 3.80
CC-20A 491783,920 1454100,233 20,142 88+18.0 (30 m right) 3.40CC-20B 491795,651 1454206,607 54,902 100+0.00 (6 m right) 3.60
P-73 491765,705 1454258,473 53,678 104+0.00 (40 m left) 18.80CC-74 491861,075 1454189,029 55,544 100+8.00 (73m right) 5.00CC-75 491842,479 1454212,536 53,497 102+6.00 (48 m right) 4.80CC-76 491930,312 1454183,538 61,156 102+6.00 (140m right) 4.30CC-22 491906,406 1454225,949 48,125 104+10.0 (100 m right) 4.90CC-77 491844,989 1454243,810 47,011 104+12.0 (140 m right) 4.20
CC-22A 491838,367 1454252,951 46,711 106+0.00 (30 m right) 3.40CC-23 491846,198 1454353,298 30,935 104+14.0 (cent line) 4.25CC-24 491886,082 1454343,593 25,822 106+0.00 (cent line) 3.35CC-25 491879,478 1454426,214 19,143 124+10.0 (cent line) 4.20CC-26 491914,373 1454525,201 12,181 134+0.00 (6 m right) 3.00CC-27 491952,638 1454513,955 11,031 134+0.00 (45 m right) 2.60P-28 491953,180 1454656,132 11,963 148+0.00 (4 m left) 6.00
CC-29 491991,350 1454741,050 17,630 156+10.0 (cent line) 3.65
CC-30 492076,860 1454799,487 10,897 164+14.0 (60m right) 2.80CC-30A 492079,326 1454821,516 12,706 166+10.0 (54 m right) 1.60CC-37 492091,246 1454942,595 24,485 178+12.0 (22 m right) 2.80CC-38 492145,715 1455016,337 20,789 188+0.00 (26 m right) 3.40CC-40 492127,752 1455102,531 14,096 194+14.0 (cent line) 3.75CC-39 492122,786 1455088,234 13,499 194+0.00 (cent line) 4.00CC-41 492278,713 1455281,111 8,951 216+16.0 (76 m right) 2.20
Cont. Table No. 1. Location of perforations y test pits
7/28/2019 Soil Investigations
http://slidepdf.com/reader/full/soil-investigations 14/32
13
TEST PITS /PERF.
COORDENATES HEIGHT(m)
LOCATIONDEPTH
(m)EAST NORTH
CC-41A 492317,414 1455290,974 7,76 220+0.00 (110m right) 3.00CC-65/P-65 492384,736 1455781,977 35,18 268+0.00 (cent line) 4.80
P-66 492324,662 1455825,882 40,08 270+0.00 (70 m left) 29.61
CC-67 492307,898 1455858,485 34,60 272+10.0 (50 m left) 3.60CC-68 492349,982 1455840,476 33,34 272+0.00 (50 m left) 3.00CC-69 492397,674 1455825,669 26,84 272+10.0 (cent line) 4.80CC-70 492365,005 1455869,444 24,37 274+14.0 (50 m left) 3.40CC-61 492357,938 1455726,032 22,71 262+2.00 (cent line) 2.40CC-62 492305,272 1455774,129 27,82 264+6.00 (70m left) 4.10CC-63 492320,970 1455730,970 19,38 260+10.0 (40 m left) 3.50CC-60 492335,124 1455672,311 9,51 256+0.00 (cent line) 3.30CC-59 492305,868 1455591,131 15,82 248+0.00 (cent line) 4.60CC-58 492284,760 1455518,347 18,59 240+0.00 (cent line) 4.50
CC-41-B 492249,393 1455424,810 9,66 230+0.00 (cent line) 1.15P-42 492313,942 1455366,234 8,89 226+10.0 (80 m right) 11.50
CC-71 492341,162 1455412,766 15,88 232+0.00 (90 m right) 3.60
CC-72 492332,963 1455401,847 13,64 230+10.0 (86 m right) 3.30CC-43 492350,661 1455450,002 16,85 268+0.00 (cent line) 2.80CC-44 492386,299 1455542,510 8,57 246+0.00 (86 m right) 2.90
CC-44A 492393,462 1455620,903 5,76 262+16.0 (64 m right) 3.20CC-46 492412,704 1455675,587 6,11 258+10.0 (85 m right) 1.90CC-80 491828,935 1454161,93 47,840 96+6.00 (52 m right) 3.50CC-88 491824,604 1454302.514 39,502 110+0.00 (cent line) 4.15
CC-30 B 492036,998 1454863,669 14,249 170+0.00 (cent line) 3.80P-111 492266,634 1455490,623 18,924 236+16.0 21.60P-90 492250,566 1455439,237 10,374 234+14.0 24.75P-35 492016,152 1454812,812 12,890 164+0.00 (cent line) 6.00P100 492131,379 1455237,608 30,29 PRESTAMO 15.00
P/CC 103 492001,527 1455243,805 49,72 PRESTAMO 14.00P105/CC105 492091,318 1455217,347 43,10 PRESTAMO 18.00
CC101 492127,914 1455256,456 38,20 PRESTAMO 4.20CC102 491974,422 1455316,677 48,00 PRESTAMO 3.50CC109 492149,923 1455259,202 30,00 PRESTAMO 3.20CC104 492018,837 1455175,111 30,36 PRESTAMO 3.20CC106 491902,653 1455278,156 56,87 PRESTAMO 5.75CC107 492089,739 1455185,563 39,75 PRESTAMO 2.80CC108 492079,408 14551145,658 20,86 PRESTAMO 2.50
CC106-REST 491526,646 1454781,744 39,17 PRESTAMO 5.75CC108-PREST
491588,080 1454755,239 40,34PRESTAMO
4.55
CC109-PREST
491695,134 1454771,829 35,86PRESTAMO
3.20
CC110-PREST
491578,329 1454717,974 29,18PRESTAMO
3.50
CC90 491714,716 1453753,334 43,02 230+0.00 (cent line) 2.50CC91 491748,401 1453755,130 40,73 PREST MO 2.50CC92 491752,414 1453807,571 32,68 PRESTÁMO 2.50CC93 491773,314 1453835,414 24,35 PRESTÁMO 1.85
Cont. Table No. 1. Location of perforations y test pits
7/28/2019 Soil Investigations
http://slidepdf.com/reader/full/soil-investigations 15/32
14
4.3- Lithology of the perforations and test pits
The soil indices properties were taken based on the test pits made on the layout, near
to the centerline of the runway. With the purpose of constructing the lithologic profile onthe center line, the results of each perforation and test pit up to a distance of 25 ms fromthe center line were correlated.
The average depth of the test pits is 3.50ms and the average depth of the layer of vegetation is 50cms.
The presented lithologic profile specifies the lithology of the definitive variant,constructed based on the results of extracted soil from the perforations and test pits,and is presented in Annex 1. In this profile it is appreciable that the predominant soil classifications are A-2-4, A-2-7 and A-7-6 throughout the layout.
Presented in Annex 2 is the detail of the lithologic columns of some characteristic perforations and test pits, that complemented the definition of the profile, and are of importance, due to their location, for the design of vitally important structures for the
project, as is the case of perforation 90 that is found on the banks of the river close tostation 230+0.00. In this lithologic column, one can see the variation of disintegratablerock with alluvial and mass of sand from the river bed, observing the heterogeneity of the materials, necessary to be considered in the design of the structure that will be
projected in this site.
Perforations 18 and 19 are also presented with their columns and one can see that
although they are close, perforation 18 has a predominance of clayey materials and perforation 19 has a predominance of sandy materials. These perforations arebordering station 74+0.00 in a valley area.
In the second round of investigation, nine (9) perforations were done where all thematerials displayed a degree of very variable density, generally characterized by anumber of blows SPT of around 10 with few cases up to 40 in first 5,00m,. Only indepths greater than 8,00m was rejection encountered (more than 80 blows). Thehighest values were found to correspond with the ashes of a blackish color below thelevels previously mentioned. Generally, underneath the ashes, the formation of basalt and andesites within a clayey matrix was found, in which the SPT tests have generally indicated rejection, nevertheless these pyroclastic flows, are almost always observed tobe affected by an intense fracturing of tectonic origin.
7/28/2019 Soil Investigations
http://slidepdf.com/reader/full/soil-investigations 16/32
15
4.4- Hydrogeology
4.4.1- On site permeability tests
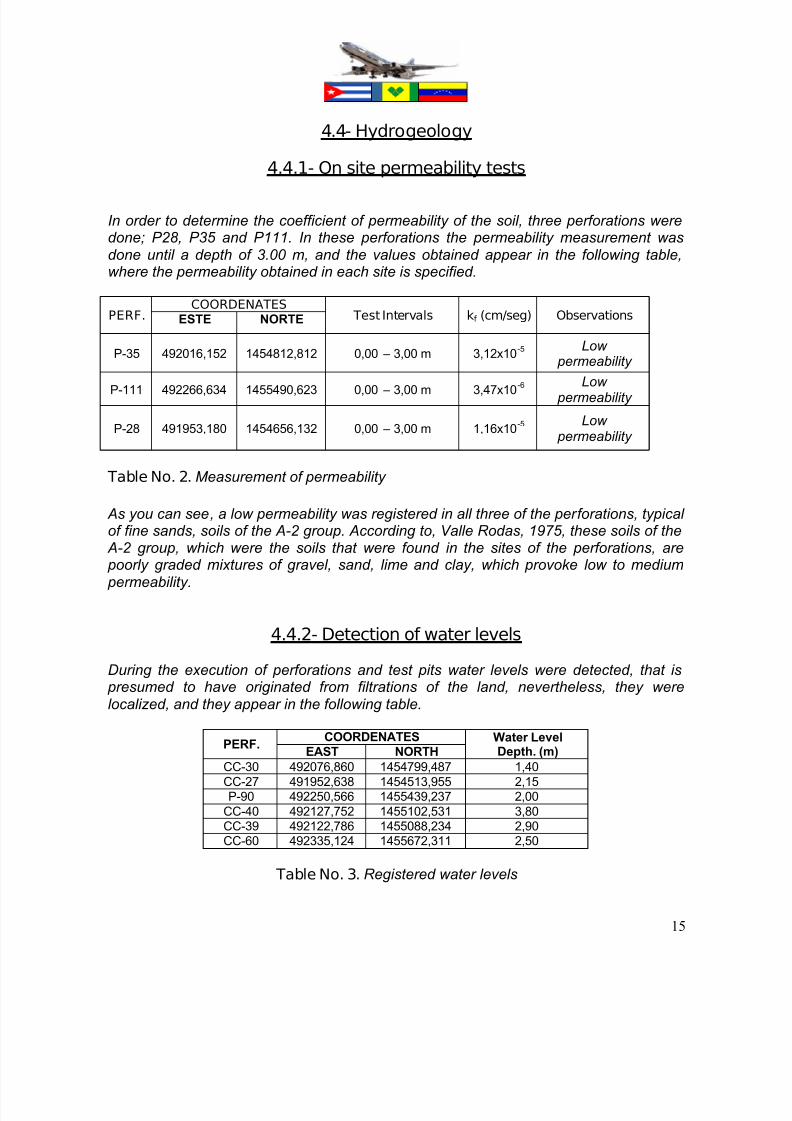
In order to determine the coefficient of permeability of the soil, three perforations weredone; P28, P35 and P111. In these perforations the permeability measurement wasdone until a depth of 3.00 m, and the values obtained appear in the following table,where the permeability obtained in each site is specified.
PERF.COORDENATES
Test Intervals kf (cm/seg) ObservationsESTE NORTE
P-35 492016,152 1454812,812 0,00 – 3,00 m 3,12x10⁻⁵ Low permeability
P-111 492266,634 1455490,623 0,00 – 3,00 m 3,47x10⁻⁶ Low permeability
P-28 491953,180 1454656,132 0,00 – 3,00 m 1,16x10⁻⁵ Low permeability
Table No. 2. Measurement of permeability
As you can see, a low permeability was registered in all three of the perforations, typical of fine sands, soils of the A-2 group. According to, Valle Rodas, 1975, these soils of the
A-2 group, which were the soils that were found in the sites of the perforations, are
poorly graded mixtures of gravel, sand, lime and clay, which provoke low to medium permeability.
4.4.2- Detection of water levels
During the execution of perforations and test pits water levels were detected, that is presumed to have originated from filtrations of the land, nevertheless, they werelocalized, and they appear in the following table.
PERF.COORDENATES Water Level
Depth. (m)EAST NORTHCC-30 492076,860 1454799,487 1,40CC-27 491952,638 1454513,955 2,15P-90 492250,566 1455439,237 2,00
CC-40 492127,752 1455102,531 3,80CC-39 492122,786 1455088,234 2,90CC-60 492335,124 1455672,311 2,50
Table No. 3. Registered water levels
7/28/2019 Soil Investigations
http://slidepdf.com/reader/full/soil-investigations 17/32
16
In the perforation 18-A, the water table was detected at 6,80m being influenced by thesea level, having registered the highest values between 6.80 – 7,00m. Different measurements were made during different days and the lowest values registered are
close 9,10m.
4. 5- Methodology- Laboratory work
With the aim of determining the physical-mechanical characteristics of the subsoil that define its behavior, the laboratory tests were done following standardized norms. Thesamples that were taken to the laboratory were selected in such a way that the most important levels are those that appear as the results of the group of samples.
The altered samples were chosen directly during the revision of the samples that were
in the boxes of each sounding. The unaltered samples were sampled in the layers of clayey type materials. The laboratory tests that were conducted are mentioned next:
Visual examination of the samples
Test for the determination of the percentage of humidity (ASTM D2216)
Test of consistency limits (ASTM D4318)
Test of granulometry (ASTM C136)
Test to determine the specific weight with pycnometer (ASTM D854)
Test of modified compaction (Cuban Norm of 2004)
Test of natural Density (Cuban Norm 156:2002)
CBR Test (ASTM D1883)
HRB System of classification (ASTM D3282)
5- Tests Results
The test pits were divided in groups in order to generate the results in sectors of the
work area, therefore test pits and perforations were located on the layout and on theelevations studied as future soil reserves. In a general sense, the study area dispose of a type of soil that is generally a clayey sand of medium-low plasticity, especially when it refers to the ash, nevertheless it is evident that the characteristics of the materials could be modified by the actions of perforation. As for the mechanical characteristics, theseare very variable according to the levels shown and, above all, depending on thealteration of the samples, because of the perforation. Due to these considerations, it was decided that the test results are considered as “intervals”, rather than “points”, and
7/28/2019 Soil Investigations
http://slidepdf.com/reader/full/soil-investigations 18/32
17
the interpretation of the same results, was done in correlation with the results of theinvestigations in field (SPT tests).
The test pits that were done on the runway strip are included on the layout, that which
generates results of soils that are predominantly of the A-2-4, A-2-7 group type.
Test pits were done in the area of the taxiways, where there was an average layer of vegetation of 50 cms and the soils found there are characterized as being of the A-2-4and A-7-6 groups. In the case where excavations are necessary in this area, these soilscan be used in the first layers of fill. In the second stage of the investigation, additional test pits and two perforations were done, that which registered values of penetrationbetween 15 and 40 up to 5,50m of depth. From this value the penetration resulted to begreater than the rejection.
A small elevation located adjacent to the platform area was investigated, towards thesouthwest of the same (CC106-PREST, CC108-PREST, CC109-PREST, CC110-PREST, – see location in the table No.1), giving as result soils of the groups A-2-7 and
A-7-5, in a study of 2.90 m depth, with an average depth of the vegetation layer of 45cm. These are appropriate materials for the construction of embankments compacted to 98% minimum, of its maximum dry density. However, the minimum degree of compaction can be greater than the CBR obtained according to the project.
Additionally, the natural and loose densities in all the soils were determined, with theobjective of knowing the changes of volume that they will experience when being excavated or compacted. The different types of soils experienced the changes of volume that are presented at continuation:
From natural state to excavated state: 1.567
From loose state to the state when it is compacted at 0.95 of its maximum dry density the value is: 1.256
In annex 3 appears the graph of the design CBR for the runway, where it is observed that the definitive value is 15%.
5.1- Mt. Coke Elevation
The area located in the stations -12+0.00 to 50+0.00, includes the approach area and
head 02, zone of cut. The soils present in this elevation are of the A-2-6 and A-2-7 type, displaying high values of plasticity, LL greater than 25% and plastic index greater than 6. A material characterized to be A-1-B was found, only in the area that facesStubbs Bay, nevertheless it is advisable to indicate, that of all the perforations that weredone in this area (81, 83, 86) rock nuclei with dimensions suitable for testing wereobtained, the compression test was done to these rocks and the average valuesobtained, in the area where the rock was found to be less fractured, are in the order of magnitude of 600kg/cm3, which means that the superficial soil is limy sand, but the base
7/28/2019 Soil Investigations
http://slidepdf.com/reader/full/soil-investigations 19/32
18
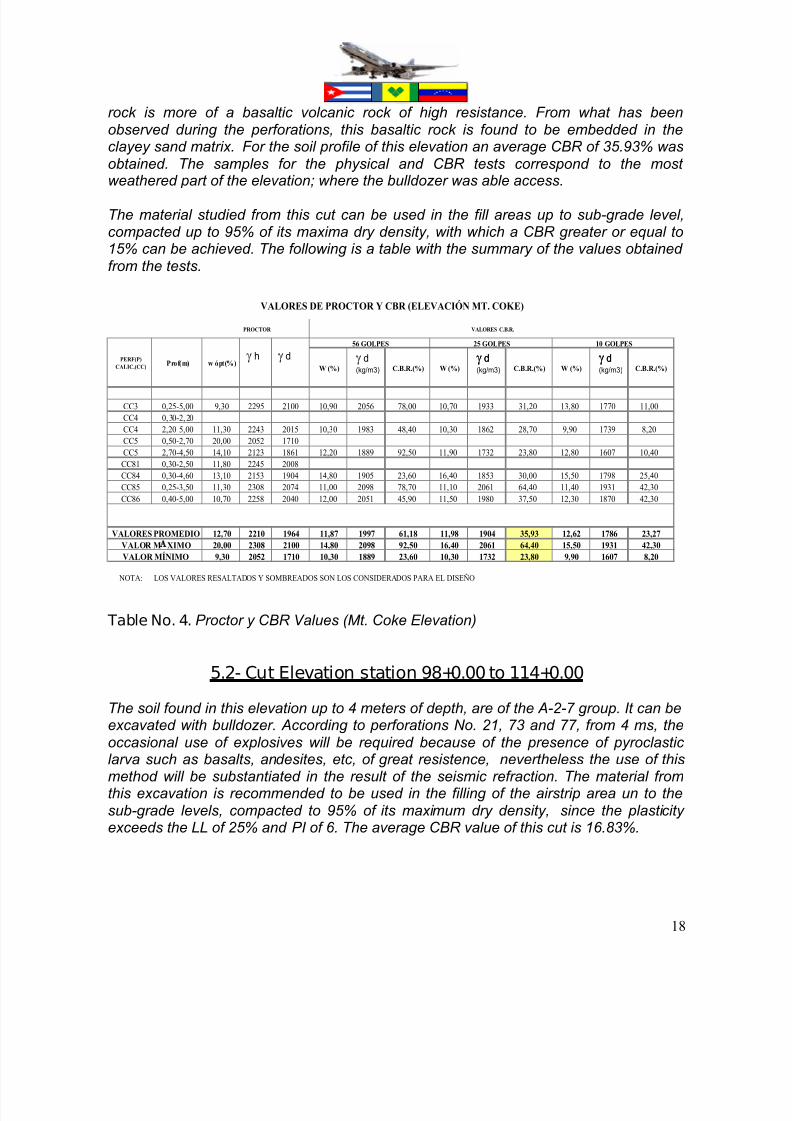
rock is more of a basaltic volcanic rock of high resistance. From what has beenobserved during the perforations, this basaltic rock is found to be embedded in theclayey sand matrix. For the soil profile of this elevation an average CBR of 35.93% wasobtained. The samples for the physical and CBR tests correspond to the most
weathered part of the elevation; where the bulldozer was able access.
The material studied from this cut can be used in the fill areas up to sub-grade level,compacted up to 95% of its maxima dry density, with which a CBR greater or equal to15% can be achieved. The following is a table with the summary of the values obtained from the tests.
W (%) C.B.R.(%) W (%) C.B.R.(%) W (%) C.B.R.(%)
CC3 0,25-5,00 9,30 2295 2100 10,90 2056 78,00 10,70 1933 31,20 13,80 1770 11,00CC4 0,30-2,20CC4 2,20-5,00 11,30 2243 2015 10,30 1983 48,40 10,30 1862 28,70 9,90 1739 8,20CC5 0,50-2,70 20,00 2052 1710CC5 2,70-4,50 14,10 2123 1861 12,20 1889 92,50 11,90 1732 23,80 12,80 1607 10,40CC81 0,30-2,50 11,80 2245 2008CC84 0,30-4,60 13,10 2153 1904 14,80 1905 23,60 16,40 1853 30,00 15,50 1798 25,40CC85 0,25-3,50 11,30 2308 2074 11,00 2098 78,70 11,10 2061 64,40 11,40 1931 42,30CC86 0,40-5,00 10,70 2258 2040 12,00 2051 45,90 11,50 1980 37,50 12,30 1870 42,30
12,70 2210 1964 11,87 1997 61,18 11,98 1904 35,93 12,62 1786 23,2720,00 2308 2100 14,80 2098 92,50 16,40 2061 64,40 15,50 1931 42,309,30 2052 1710 10,30 1889 23,60 10,30 1732 23,80 9,90 1607 8,20
NOTA: LOS VALORES RESALTADOS Y SOMBREADOS SON LOS CONSIDERADOS PARA EL DISEÑO
VALORES DE PROCTOR Y CBR (ELEVACIÓN MT. COKE)
10 GOLPES
VALORES C.B.R.
PERF(P)CALIC.(CC) Prof(m) w ópt(%)
VALORES PROMEDIOVALOR M XIMOVALOR MÍNIMO
PROCTOR
56 GOLPES 25 GOLPES
g h g d g d(kg/m3)
g d g dg d(kg/m3)
g d(kg/m3)
Table No. 4. Proctor y CBR Values (Mt. Coke Elevation)
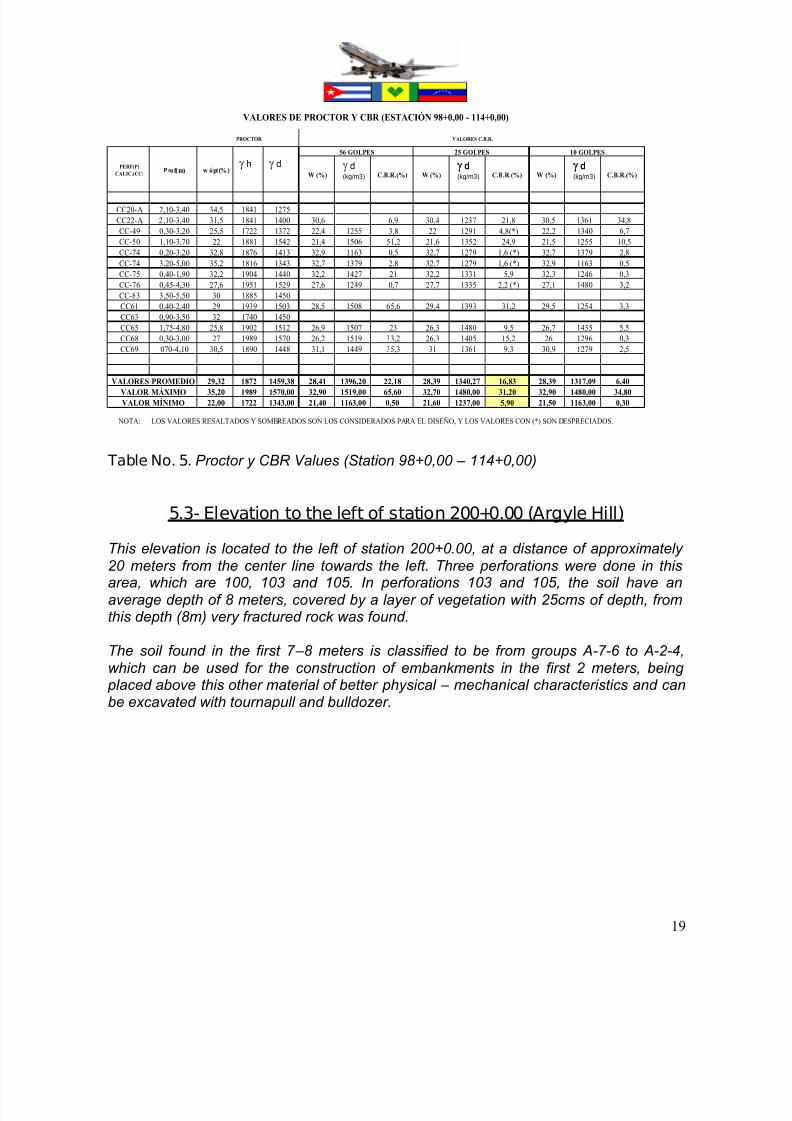
5.2- Cut Elevation station 98+0.00 to 114+0.00
The soil found in this elevation up to 4 meters of depth, are of the A-2-7 group. It can beexcavated with bulldozer. According to perforations No. 21, 73 and 77, from 4 ms, theoccasional use of explosives will be required because of the presence of pyroclastic
larva such as basalts, andesites, etc, of great resistence, nevertheless the use of thismethod will be substantiated in the result of the seismic refraction. The material fromthis excavation is recommended to be used in the filling of the airstrip area un to thesub-grade levels, compacted to 95% of its maximum dry density, since the plasticity exceeds the LL of 25% and PI of 6. The average CBR value of this cut is 16.83%.
7/28/2019 Soil Investigations
http://slidepdf.com/reader/full/soil-investigations 20/32
19
W (%) C.B.R.(%) W (%) C.B.R.(%) W (%) C.B.R.(%)
CC20-A 2,10-3,40 34,5 1841 1275CC22-A 2,10-3,40 31,5 1841 1400 30,6 6,9 30,4 1237 21,8 30,5 1361 34,8CC-49 0,30-3,20 25,5 1722 1372 22,4 1255 3,8 22 1291 4,8(*) 22,2 1340 6,7CC-50 1,10-3,70 22 1881 1542 21,4 1506 51,2 21,6 1352 24,9 21,5 1255 10,5CC-74 0,20-3,20 32,8 1876 1413 32,9 1163 0,5 32,7 1279 1,6 (*) 32,7 1379 2,8CC-74 3,20-5,00 35,2 1816 1343 32,7 1379 2,8 32,7 1279 1,6 (*) 32,9 1163 0,5CC-75 0,40-1,90 32,2 1904 1440 32,2 1427 21 32,2 1331 5,9 32,3 1246 0,3CC-76 0,45-4,30 27,6 1951 1529 27,6 1249 0,7 27,7 1335 2,2 (*) 27,1 1480 3,2CC-83 3,50-5,50 30 1885 1450CC61 0,40-2,40 29 1939 1503 28,5 1508 65,6 29,4 1393 31,2 29,5 1254 3,3CC63 0,90-3,50 32 1740 1450CC65 1,75-4,80 25,8 1902 1512 26,9 1507 23 26,3 1480 9,5 26,7 1435 5,5CC68 0,30-3,00 27 1989 1570 26,2 1519 33,2 26,3 1405 15,2 26 1296 0,3CC69 070-4,10 30,5 1890 1448 31,1 1449 35,3 31 1361 9,3 30,9 1279 2,5
29,32 1872 1459,38 28,41 1396,20 22,18 28,39 1340,27 16,83 28,39 1317,09 6,4035,20 1989 1570,00 32,90 1519,00 65,60 32,70 1480,00 31,20 32,90 1480,00 34,8022,00 1722 1343,00 21,40 1163,00 0,50 21,60 1237,00 5,90 21,50 1163,00 0,30
VALORES PROMEDIOVALOR MÁXIMOVALOR MÍNIMO
NOTA: LOS VALORES RESALTADOS Y SOMBREADOS SON LOS CONSIDERADOS PARA EL DISEÑO, Y LOS VALORES CON (*) SON DESPRECIADOS.
PROCTOR
56 GOLPES 25 GOLPES 10 GOLPES
VALORES C.B.R.
PERF(P)CALIC.(CC) Prof(m) w ópt(%)
VALORES DE PROCTOR Y CBR (ESTACIÓN 98+0,00 - 114+0,00)
g h g d g d(kg/m3)
g d g dg d(kg/m3)
g d(kg/m3)
Table No. 5. Proctor y CBR Values (Station 98+0,00 – 114+0,00)
5.3- Elevation to the left of station 200+0.00 (Argyle Hill)
This elevation is located to the left of station 200+0.00, at a distance of approximately
20 meters from the center line towards the left. Three perforations were done in thisarea, which are 100, 103 and 105. In perforations 103 and 105, the soil have anaverage depth of 8 meters, covered by a layer of vegetation with 25cms of depth, fromthis depth (8m) very fractured rock was found.
The soil found in the first 7 –8 meters is classified to be from groups A-7-6 to A-2-4,which can be used for the construction of embankments in the first 2 meters, being
placed above this other material of better physical – mechanical characteristics and canbe excavated with tournapull and bulldozer.
7/28/2019 Soil Investigations
http://slidepdf.com/reader/full/soil-investigations 21/32
20
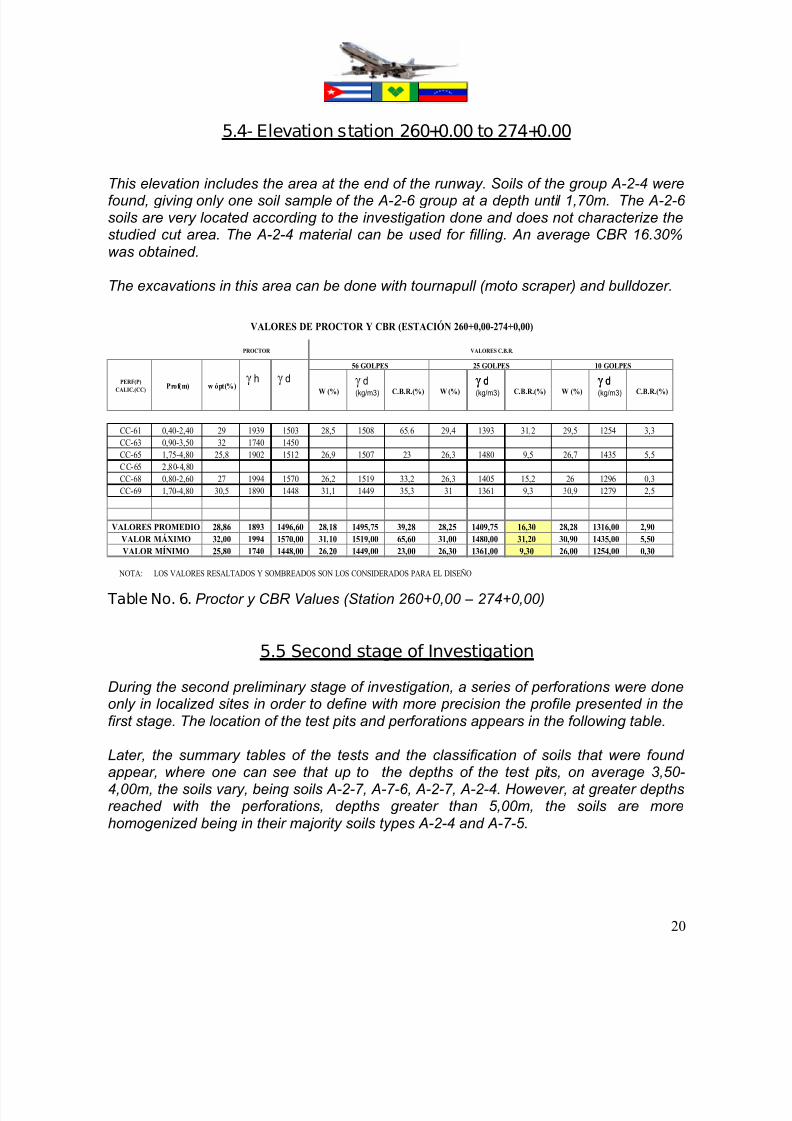
5.4- Elevation station 260+0.00 to 274+0.00
This elevation includes the area at the end of the runway. Soils of the group A-2-4 werefound, giving only one soil sample of the A-2-6 group at a depth until 1,70m. The A-2-6 soils are very located according to the investigation done and does not characterize thestudied cut area. The A-2-4 material can be used for filling. An average CBR 16.30%was obtained.
The excavations in this area can be done with tournapull (moto scraper) and bulldozer.
W (%) C.B.R.(%) W (%) C.B.R.(%) W (%) C.B.R.(%)
CC-61 0,40-2,40 29 1939 1503 28,5 1508 65,6 29,4 1393 31,2 29,5 1254 3,3
CC-63 0,90-3,50 32 1740 1450
CC-65 1,75-4,80 25,8 1902 1512 26,9 1507 23 26,3 1480 9,5 26,7 1435 5,5
CC-65 2,80-4,80
CC-68 0,80-2,60 27 1994 1570 26,2 1519 33,2 26,3 1405 15,2 26 1296 0,3
CC-69 1,70-4,80 30,5 1890 1448 31,1 1449 35,3 31 1361 9,3 30,9 1279 2,5
28,86 1893 1496,60 28,18 1495,75 39,28 28,25 1409,75 16,30 28,28 1316,00 2,9032,00 1994 1570,00 31,10 1519,00 65,60 31,00 1480,00 31,20 30,90 1435,00 5,5025,80 1740 1448,00 26,20 1449,00 23,00 26,30 1361,00 9,30 26,00 1254,00 0,30
VALORES DE PROCTOR Y CBR (ESTACIÓN 260+0,00-274+0,00)
10 GOLPES
VALORES C.B.R.
PERF(P)CALIC.(CC) Prof(m) w ópt(%)
LOS VALORES RESALTADOS Y SOMBREADOS SON LOS CONSIDERADOS PARA EL DISEÑO NOTA:
VALORES PROMEDIOVALOR MÁXIMOVALOR MÍNIMO
PROCTOR
56 GOLPES 25 GOLPES
g h g d g d(kg/m3)
g d g dg d(kg/m3)
g d(kg/m3)
Table No. 6. Proctor y CBR Values (Station 260+0,00 – 274+0,00)
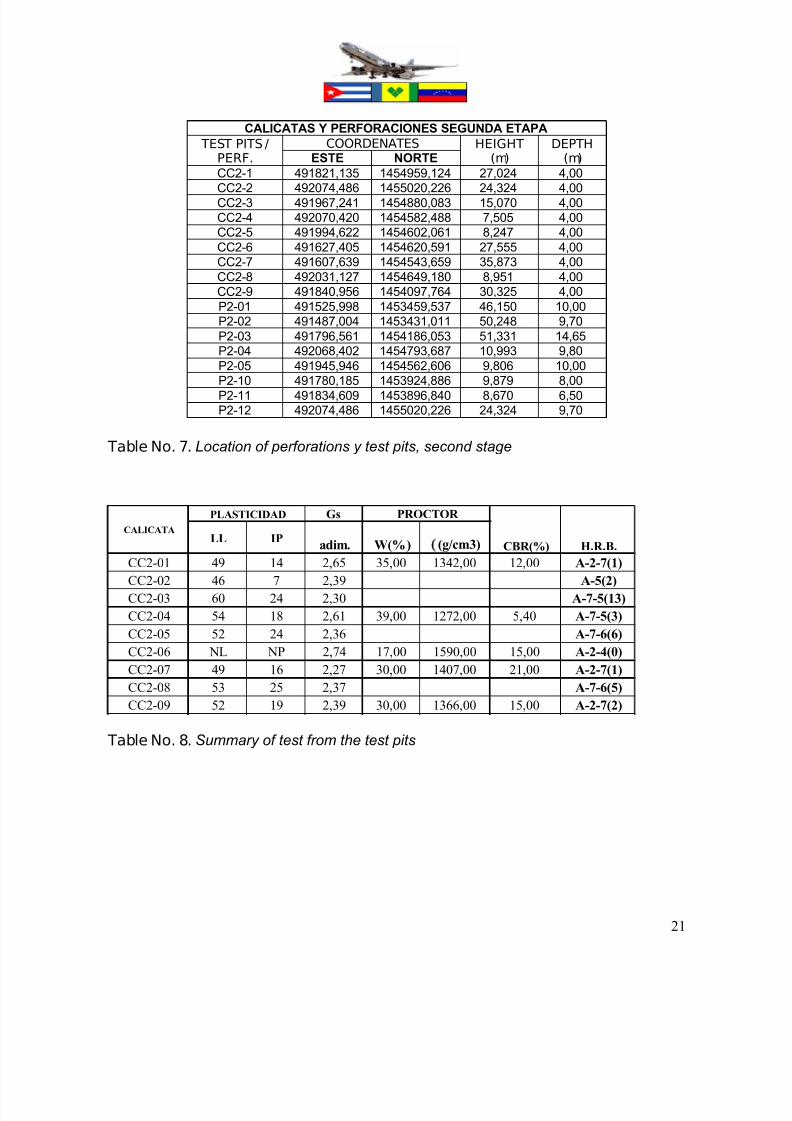
5.5 Second stage of Investigation
During the second preliminary stage of investigation, a series of perforations were doneonly in localized sites in order to define with more precision the profile presented in thefirst stage. The location of the test pits and perforations appears in the following table.
Later, the summary tables of the tests and the classification of soils that were found appear, where one can see that up to the depths of the test pits, on average 3,50-4,00m, the soils vary, being soils A-2-7, A-7-6, A-2-7, A-2-4. However, at greater depthsreached with the perforations, depths greater than 5,00m, the soils are morehomogenized being in their majority soils types A-2-4 and A-7-5.
7/28/2019 Soil Investigations
http://slidepdf.com/reader/full/soil-investigations 22/32
21
CALICATAS Y PERFORACIONES SEGUNDA ETAPA
TEST PITS /
PERF.
COORDENATES HEIGHT
(m)
DEPTH
(m)ESTE NORTE
CC2-1 491821,135 1454959,124 27,024 4,00
CC2-2 492074,486 1455020,226 24,324 4,00CC2-3 491967,241 1454880,083 15,070 4,00CC2-4 492070,420 1454582,488 7,505 4,00CC2-5 491994,622 1454602,061 8,247 4,00CC2-6 491627,405 1454620,591 27,555 4,00CC2-7 491607,639 1454543,659 35,873 4,00CC2-8 492031,127 1454649,180 8,951 4,00CC2-9 491840,956 1454097,764 30,325 4,00P2-01 491525,998 1453459,537 46,150 10,00P2-02 491487,004 1453431,011 50,248 9,70P2-03 491796,561 1454186,053 51,331 14,65P2-04 492068,402 1454793,687 10,993 9,80P2-05 491945,946 1454562,606 9,806 10,00
P2-10 491780,185 1453924,886 9,879 8,00P2-11 491834,609 1453896,840 8,670 6,50P2-12 492074,486 1455020,226 24,324 9,70
Table No. 7. Location of perforations y test pits, second stage
Gs
LL IPadim. W(%) (g/cm3)
CC2-01 49 14 2,65 35,00 1342,00 12,00 A-2-7(1)CC2-02 46 7 2,39 A-5(2)
CC2-03 60 24 2,30 A-7-5(13)
CC2-04 54 18 2,61 39,00 1272,00 5,40 A-7-5(3)
CC2-05 52 24 2,36 A-7-6(6)
CC2-06 NL NP 2,74 17,00 1590,00 15,00 A-2-4(0)
CC2-07 49 16 2,27 30,00 1407,00 21,00 A-2-7(1)
CC2-08 53 25 2,37 A-7-6(5)
CC2-09 52 19 2,39 30,00 1366,00 15,00 A-2-7(2)
PROCTOR
H.R.B.
CALICATA
PLASTICIDAD
CBR(%)
Table No. 8. Summary of test from the test pits
7/28/2019 Soil Investigations
http://slidepdf.com/reader/full/soil-investigations 23/32
22
Gs
LL IP 10 40 200adim. H.R.B.
P2 01 M-6-8 2,55-4,00 NL NP 99 72 25 2,70 A-2-4(0)
M-9-10 4,00-5,00 NL NP 98 71 21 2,75 A-2-4(0)P2 02 M-2-3 0,55-1,50 40 11 96 70 23 2,75 A-2-6(0)M-4-9 1,55-6,50 76 20 99 85 52 2,49 A-7-5(9)
M-10-12 7,55-9,70 75 19 97 60 36 A-7-5(2)P2 03 M-11 8,0 NL NP 63 33 17 A-2-4(0)
M-12-18 9,55-14,65 NL NP 71 37 21 2,53 A-2-4(0)P2 04 M-4,5,6 2,50-3,50 32 11 96 74 27 2,79 A-2-6(0)
M-7 3,50-4,00 37 16 99 77 24 A-2-6(0)M-8-15 4,00- 53 23 98 86 43 2,68 A-7-5(3)
P2 05 M-5-8 2,05-4,00 NL NP 98 74 24 A-2-4(0)M-9-10 4,05-5,00 30 9 97 60 7 A-2-4(0)
M-11-15 5,55-9,80 NL NP 92 62 16 A-2-4(0)P2 10 M-3,4 1,05-2,05 31 10 96 65 17 2,71 A-2-4(0)
M-5-11 2,50-5,50 NL NP 94 58 13 2,72 A-2-4(0)M-12-17 5,55-7,93 NL NP 98 81 17 2,76 A-2-4(0)P2 11 M-3-6 1,05-1,50 98 73 27 2,78 A-2-4(0)
M-7,8 3,05-3,50 NL NP 92 61 16 A-2-4(0)M-9-13 4,05-6,50 36 11 96 59 20 2,78 A-2-6(0)
P2 12 M-2-3 0,55-1,50 98 73 32 2,77 A-2-6(0)M-6-10 2,50-5,00 31 10 98 75 18 2,71 A-2-4(0)
M-11-15 5,55-9,70 NL NP 95 59 14 A-2-4(0)
PASANTESPERF(P) Ident. Prof(m)
PLASTICIDAD
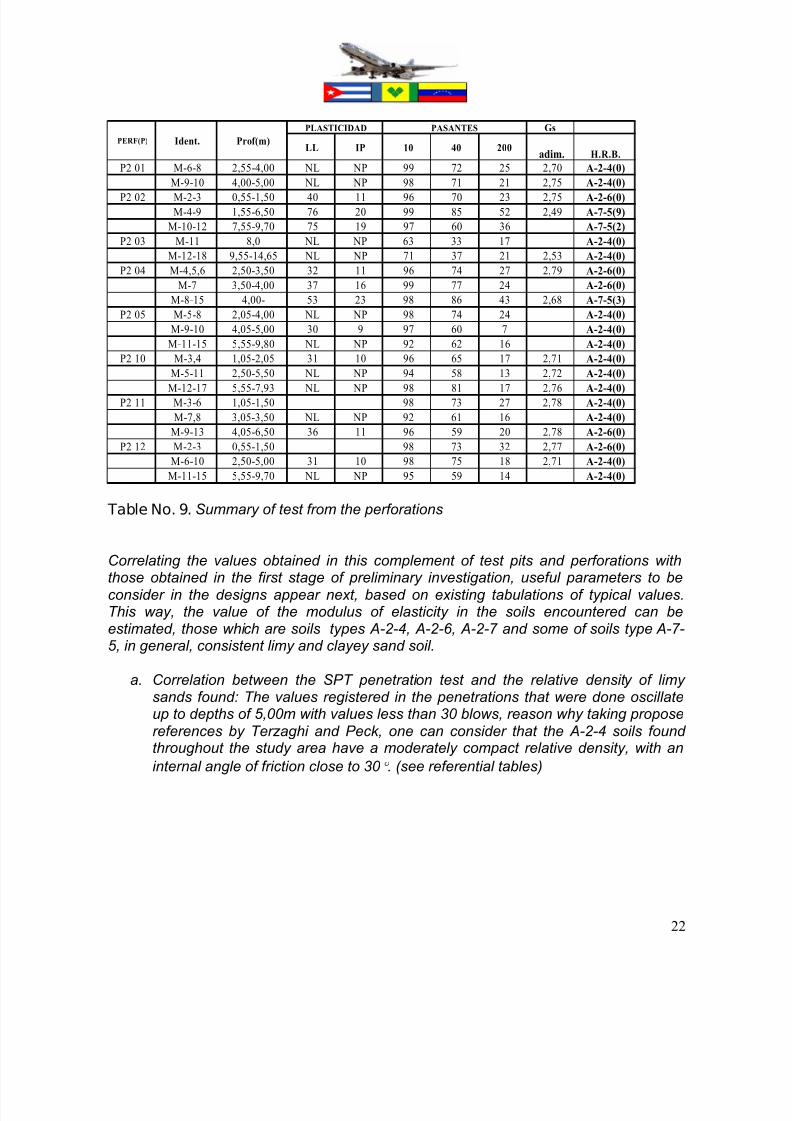
Table No. 9. Summary of test from the perforations
Correlating the values obtained in this complement of test pits and perforations withthose obtained in the first stage of preliminary investigation, useful parameters to beconsider in the designs appear next, based on existing tabulations of typical values.This way, the value of the modulus of elasticity in the soils encountered can beestimated, those which are soils types A-2-4, A-2-6, A-2-7 and some of soils type A-7-5, in general, consistent limy and clayey sand soil.
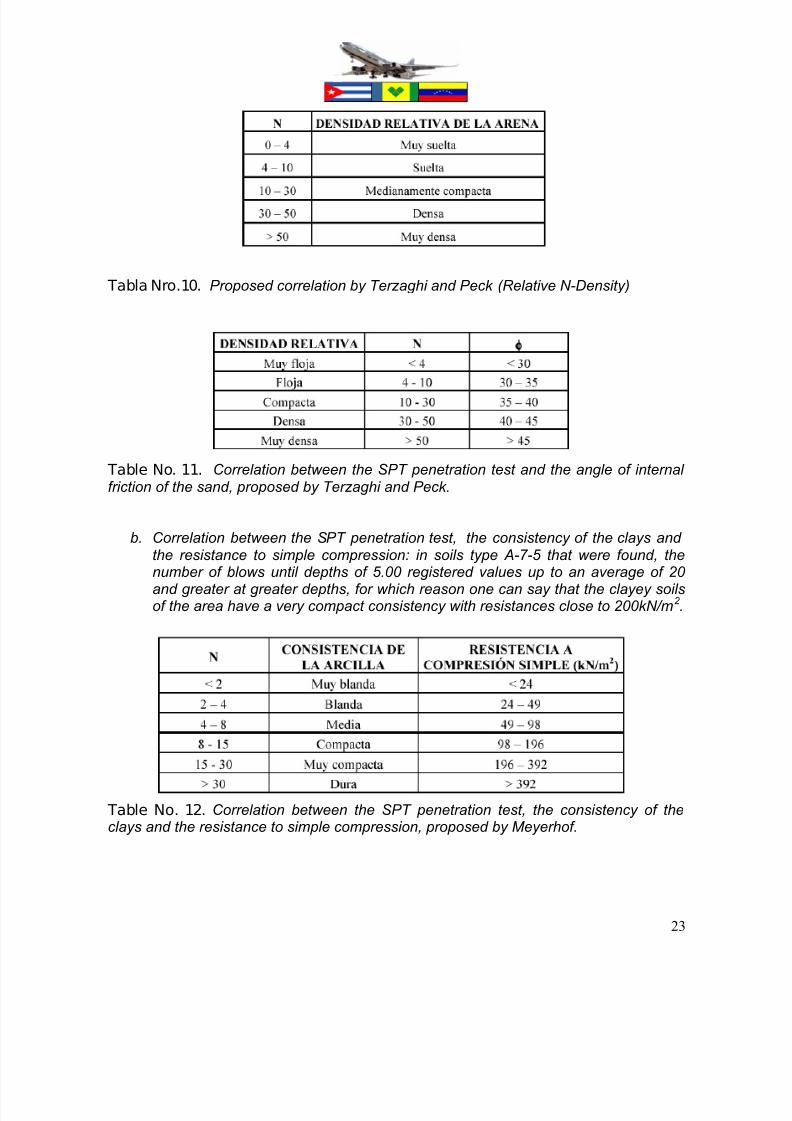
a. Correlation between the SPT penetration test and the relative density of limy sands found: The values registered in the penetrations that were done oscillateup to depths of 5,00m with values less than 30 blows, reason why taking proposereferences by Terzaghi and Peck, one can consider that the A-2-4 soils found
throughout the study area have a moderately compact relative density, with aninternal angle of friction close to 30 . (see referential tables)
7/28/2019 Soil Investigations
http://slidepdf.com/reader/full/soil-investigations 24/32
23
Tabla Nro.10. Proposed correlation by Terzaghi and Peck (Relative N-Density)
Table No. 11. Correlation between the SPT penetration test and the angle of internal friction of the sand, proposed by Terzaghi and Peck.
b. Correlation between the SPT penetration test, the consistency of the clays and the resistance to simple compression: in soils type A-7-5 that were found, thenumber of blows until depths of 5.00 registered values up to an average of 20 and greater at greater depths, for which reason one can say that the clayey soilsof the area have a very compact consistency with resistances close to 200kN/m2 .
Table No. 12. Correlation between the SPT penetration test, the consistency of theclays and the resistance to simple compression, proposed by Meyerhof.
7/28/2019 Soil Investigations
http://slidepdf.com/reader/full/soil-investigations 25/32
24
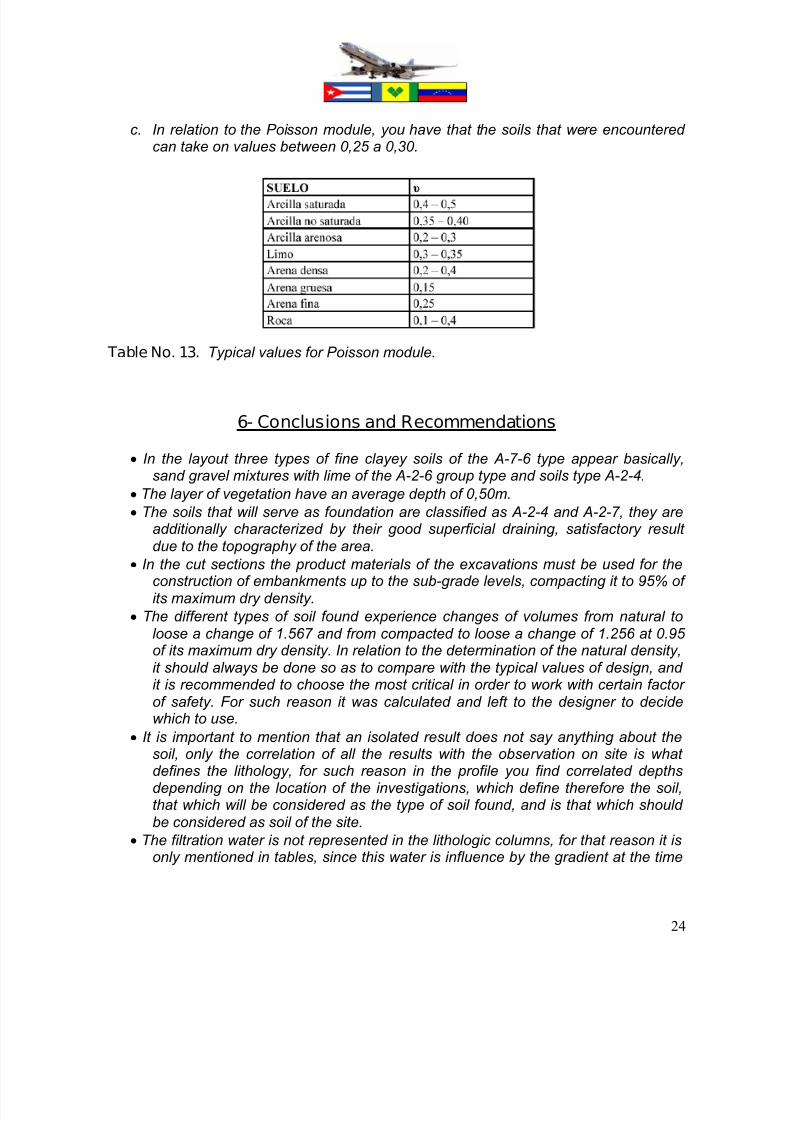
c. In relation to the Poisson module, you have that the soils that were encountered can take on values between 0,25 a 0,30.
Table No. 13. Typical values for Poisson module.
6- Conclusions and Recommendations
In the layout three types of fine clayey soils of the A-7-6 type appear basically,sand gravel mixtures with lime of the A-2-6 group type and soils type A-2-4.
The layer of vegetation have an average depth of 0,50m. The soils that will serve as foundation are classified as A-2-4 and A-2-7, they are
additionally characterized by their good superficial draining, satisfactory result due to the topography of the area.
In the cut sections the product materials of the excavations must be used for theconstruction of embankments up to the sub-grade levels, compacting it to 95% of its maximum dry density.
The different types of soil found experience changes of volumes from natural toloose a change of 1.567 and from compacted to loose a change of 1.256 at 0.95 of its maximum dry density. In relation to the determination of the natural density,it should always be done so as to compare with the typical values of design, and it is recommended to choose the most critical in order to work with certain factor of safety. For such reason it was calculated and left to the designer to decidewhich to use.
It is important to mention that an isolated result does not say anything about the
soil, only the correlation of all the results with the observation on site is what defines the lithology, for such reason in the profile you find correlated depthsdepending on the location of the investigations, which define therefore the soil,that which will be considered as the type of soil found, and is that which should be considered as soil of the site.
The filtration water is not represented in the lithologic columns, for that reason it isonly mentioned in tables, since this water is influence by the gradient at the time
7/28/2019 Soil Investigations
http://slidepdf.com/reader/full/soil-investigations 26/32
25
of digging the test pit, it is only represented when one is certain of the level of thewater table.
The soils classified as A-2-6 and A-2-7, can be used to fill the embankments that will be constructed, and not in layers of the sub-base and base of the pavement
structure. According to the technical assignment received the 15/10/06, the value of the CBR
support capacity for the sub-base and/or base layer of 50%, has not beenachieved by any of the materials from the reserve and cut areas of the layout inthe investigation. In the excavations done with bulldozer, the last 30cm of thesurface of the sub-grade level will be compacted to its maximum dry density.Where the excavation is done with explosives, the last 50 cm beneath the sub-grade level must be replaced, to ensure that this thickness of material iscompacted to its maximum dry density.
To do the excavations until a depth 5,50m, in the runway strip, from station 10+000 to station 272+000, you should use tournapull or motor scrapers.
The compacting of the fillings must be carried out using mixed compactors:vibratory – landfill and vibratory - smooth tires. A design CBR of 15% is recommended for pavement
The slope recommended for the embankments based on the materials from thesite is 1,5:1, since natural embankments have been observed to be totally stablewith even negative slopes. It is important to guarantee the terrace in the slopeswith heights that they do not surpass 7,5m and berms close to 3,00m.
The use of vaults is recommended to span the Yambou river bed, designed as tri-articulated curved prefabricated structures of reinforced concrete, with itsgeometry and dimensions defined by the hydraulic engineer. The idea of the
vault as a way of spanning the river bed is supposed to change the structural material by structural form, being the work by means of compressions a lot moreefficient than the work by means of flexion, due to the fact that it uses all theresistant capacity of the section. These vaults are structures composed of voussoirs equivalent to a half-section of the arc with variable width in functionof the dimensions of the element. The base can be supported on a previously built foundation “in situ”, each half being sustain in its key against the other,which makes it is independently stable during its assembly, thus not needing of any proppings. This makes it possible for a team of workers to mount between 15 and 20 lineal meters per day, only needing two cranes in the assembly of the first
pieces and one in the rest. Geometry should be designed and calculated
specifically for the hydraulic conditions present in the site, on the basis of theanti-funicular means of loads.
For the protection of the embankments, the TERRATREL systems arerecommended, those which are walls with areas that can be used for vegetationin the slope, using metallic frame works of high adhesion (“Tierra Armada” type)for the reinforcement. These systems tend to protect the soil from the impact of rain drops, reduce the speed of the drainage of the water by increase of rugosity
7/28/2019 Soil Investigations
http://slidepdf.com/reader/full/soil-investigations 27/32
26
and increase the infiltration by holes made by roots, animals, etc. In general, thevegetation must be formed by selected species, susceptible to sustaining itself and to grow in the local conditions, since the same species from the region offer an innate guarantee. Another important function is the control of the water
content in the superior layers of the soil, thanks to the evapo-transpiration of the plants. When one talks about the improvement in the appearance that is obtained with the vegetation, one can comment that the effect is not only confined to theappearance, but to many other aspects, like the insulating effect, for the noises,that can be obtained with some types of vegetation, which can have greater interest in urban and residential zones.
Eng. Belén León A.Head of Soils Laboratory
Eng. Leonardo Pérez PérezCommission Coordinator of theArgyle International Airport
7/28/2019 Soil Investigations
http://slidepdf.com/reader/full/soil-investigations 28/32
27
ANNEX 1.
Longitudinal Lithologic Profileon the center line of the Runway
7/28/2019 Soil Investigations
http://slidepdf.com/reader/full/soil-investigations 29/32
28
ANNEX 2.
Lithology of the perforations and test pits
7/28/2019 Soil Investigations
http://slidepdf.com/reader/full/soil-investigations 30/32
29
ANNEX 3.
Graphical design CBR.
7/28/2019 Soil Investigations
http://slidepdf.com/reader/full/soil-investigations 31/32
30
ANNEX 4.
Results of compression tests of rock nuclei
7/28/2019 Soil Investigations
http://slidepdf.com/reader/full/soil-investigations 32/32
ANNEX 5.
Summary Table of perforations