Embed Size (px)
Citation preview
UlyssesSolar Observations from Pole to Pole
http://ulysses.jpl.nasa.gov
http://www.nasa.gov
Ulysses has returned a wealth
of data to help us understand the
global structure of our star, the
Sun. Ulysses is a joint mission of
the National Aeronautics and Space
Administration and the European
Space Agency. The Jet Propulsion
Laboratory manages the mission
for NASA.
National Aeronautics and Space Administration
European Space Agency
EW-2005-12-017-JPL
1
National Aeronautics andSpace Administration
Jet Propulsion LaboratoryCalifornia Institute of TechnologyPasadena, California
JPL 410-053
JPL 400-1133 Rev.1 12/05Maunder Mystery Story
Objective
The completion of the following activities will allow students to see how a theory develops from inception through various studies where supporting evidence is found and how current technology might be used in supporting the theory. We will be looking at the theory set out by E. W. Maunder concerning the correlation be-tween numbers of sunspots and Earth’s climate. Maunder believed that the low sunspot activity observed during the 17th–18th centu-ries was a major cause for the climate change that occurred during a period known as the “Little Ice Age,” when temperatures became signifi cantly cooler.
Grade Levels
The activities are keyed to Grades 5–8.
Setup for Classroom
Students will be assigned to detective teams of four persons each. They will be provided with three clues to complete their research.
Overview
There are three activities in this mystery. They are set up in the same order in which the theory progressed. First, the students will learn about E. W. Maunder and his wife Annie. Then the student teams will follow the clues. The fi rst two activities have to do with Maunder and his predecessors and their explorations of sunspots (clue #2 has three parts). The third activity introduces students to what tree rings tell us about sunspot history. The Internet links provided will give you supplemental information or back up activi-ties that are presented here.
What Is the Maunder Minimum?
Temperatures in northern Europe became cooler beginning about 1300, and became very cold about 1560–1850. The period from about the mid-14th century to the mid-19th century is known as the Little Ice Age. The Maunder Minimum refers to a period of time during the mid-1600s to the early 1700s (about 1645–1715) when solar observers noted a virtual absence of sunspots, corre-
sponding to very cold temperatures during northern European win-ters, when normally ice-free bodies of water froze. The Maunder Minimum period was the coldest part of the Little Ice Age.
Background Information
Why are we studying the Sun? It has become important to us here on Earth to understand the solar activity that occurs during solar minimum and solar maximum. The activity appears to affect the solar wind, which in turn affects radio transmissions and satellite communications. Solar activity is determined by the number of sunspots present. Sunspots are related to the active areas of the Sun where eruptions like solar fl ares originate.
The Ulysses Discoveries
Ulysses is on an exploration mission to study our star, the Sun. What has the Ulysses mission discovered? How has the mis-sion interpreted the observed sunspots and their minimum and maximum cycles? Ulysses has investigated a solar minimum heliosphere, passing by both poles during the minimum. (The term “heliosphere” refers to the Sun’s environment.) In recent years (2000–2001), Ulysses has been sending back information while the Sun is in a solar maximum cycle. The primary objective of the Ulysses Solar Maximum Mission was to study the Sun over the poles at or near maximum solar conditions. The most recent information (2003) shows a decline in solar activity; however, sometimes powerful storms can occur as the cycle ends. Ulysses, having studied the Sun during solar minimum and solar maximum years, has allowed scientists to create a three-dimensional picture of the Sun and its heliosphere.
Although the Ulysses space probe does not have imaging instru-ments on board, it has been able to gather and transmit a great deal of useful information about the Sun’s environment. Using this information, scientists have created a “map” of the Sun’s heliosphere. Using instruments to fi gure out something we don’t have pictures of is the way scientists mapped the ocean fl oor and Earth’s interior. Information is used to create a picture of what the actual model might look like. The Ulysses map of the Sun’s helio-sphere includes magnetic fi elds, energized particles, solar storms, and solar winds.
We depend on satellites that orbit Earth for communications via telephone and television and for weather forecasts. These com-munications can be interrupted by events happening on the Sun. These events infl uence space weather, including solar storms that affect the solar wind. It is this wind and its magnetic forces that affect our communication systems. It is important to understand how these storms occur and possibly learn how to predict them.
Other Information
A picture of Ulysses can be found at http://ulysses.jpl.nasa.gov or at http://helio.estec.esa.nl/ulysses. Sunspot activity during the Ulysses mission can be seen on the NASA lithograph, “Sunspot Activity,” JPL 400-819C 3/99.
Defi nitions
Sunspot: A dark spot on the Sun’s surface that indicates a con-centration of magnetic forces. Sunspots are actually about 2000 degrees Celsius cooler than the solar surface, and only look dark because they emit light faintly.
Sunspot Cycle: The change in the number of sunspots from one period of its maximum to the next, over the course of about 11 years.
(Defi nitions from “Solar Storms and You: Exploring Sunspots and Solar Activity Cycles,” NASA EG-2000-03-002-GSFC.)
Extensions
Question to explore: How do the solar wind and magnetic fi eld change during sunspot maximum conditions?
http://sunearth.gsfc.nasa.govhttp://sunearth.gsfc.nasa.gov/edask.htm
T E A C H E R ’ S . D I R E C T I O N S
Educators —
Please take a moment to evaluate this product athttp://ehb2.gsfc.nasa.gov/edcats/educational_wallsheetYour evaluation and suggestions are vital to continually improving NASA educational materials.
Thank you.
EW-2005-12-017-JPL
2
National Aeronautics andSpace Administration
Jet Propulsion LaboratoryCalifornia Institute of TechnologyPasadena, California
JPL 410-053
JPL 400-1133 Rev.1 12/05The Importance of Sunspots
Background
If your students don’t have a clear understanding of what sunspots are, the following websites have simple activities that will allow your students to observe and draw sunspots, much like earlier astronomers, including Galileo and the Maunders. Galileo Galilei fi rst observed and recorded sunspots around 1610. Other people — some were scientists, some not — observed and recorded sunspots after 1610.
Resources
Activity called “Observing the Sun For Yourself” as published in “Living with a Star: Teacher Resources for Understanding Connections Between the Sun and Earth,” by The Sun–Earth Connection Education Forum, NASA Goddard Space Flight Center and UCB/SSL (EG-2001-01-005-GSFC). This educator guide can be found at — http://solar-center.Stanford.edu/observe/observe.html
Plotting Sunspot Activity (for slightly older students): http://www.windows.ucar.edu/tour/link=/teacher_resources/sunspotplot_edu.html&INPUT_STRING=ulysses&SEARCH_TYPE=phrase&USER_LEVEL=mid
1.
2.
A story and activity about sunspots from NASA:http://www.thursdaysclassroom.com/index_14oct99.html
The following sites are from a publication by the Sun–Earth Connection Education Forum.
— Galileo’s sunspot drawings:http://galileo.rice.edu/sci/observations/sunspot_drawings.html
— Pictures of the Sun, including sunspots: http://sunearth.gsfc.nasa.gov/sechtml/tut.html
Extra Background Information
3.
4.
T E A C H E R ’ S . D I R E C T I O N S
National Standards Addressed
ScienceNS.5-8.1 Understand about scientifi c inquiry
NS.5-8.4 Earth’s history and Earth in the solar system
NS.5-8.5 Science and technology
NS.5-8.6 Personal and social perspectives: populations, resources and environments, science and technology in society
NS.5-8.7 History and nature of science
MathematicsNM-num.6-8.3 Compute fl uently and make reasonable estimates.
NM-num.6-8.1 Understand numbers, ways of representing num-bers, relationships among numbers, and number systems.
NMData.6-8.1 Formulate questions that can be addressed with data, and collect, organize, and display relevant data to answer questions.
NMData.6-8.3 Develop and evaluate inferences and predictions that are based on data.
NMProb.rea.pk-12.3 Develop and evaluate mathematical argu-ments and proofs.
NMProb.conn.pk-12.3 Recognize and apply mathematics in con-texts outside of mathematics.
Language ArtsNL-Engk-12.1 Reading for perspective
NL-Engk-12.3 Evaluation strategies
NL-Engk12.4 Communication skills
NL.Engk-12.7 Evaluating data
NL-Enk-12.8 Developing research skills
Visual ArtsNA-VA.5-8.4 Understanding the visual arts in relation to history and culture
NA-VA.5-8.6 Making connections between visual arts and other disciplines
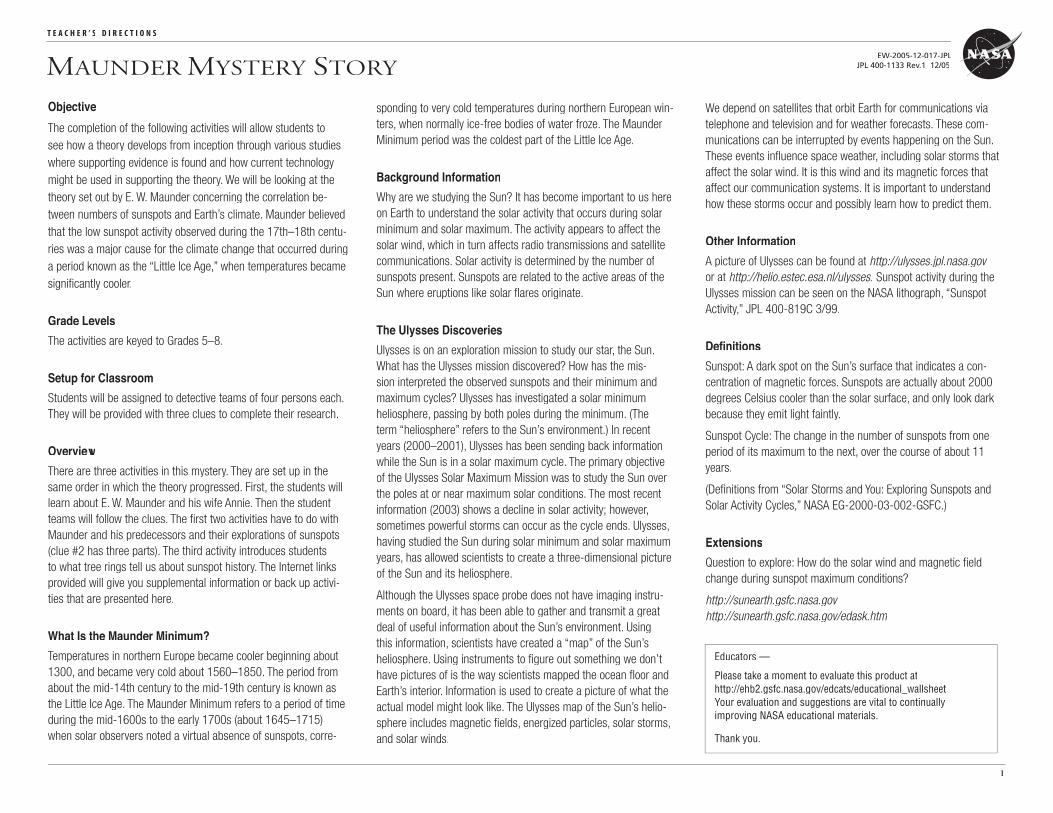
This graph shows the amount of sunspot activity during Ulysses’ fi rst set of solar passes (1994–1995) and the estimated sunspot activity during solar maximum (2000–2001).
This is a little history about the observing of sunspot cycles by various groups of people:http://sunearth.gsfc.nasa.gov/sechtml/litho3.html You might want to read it aloud at the end of this lesson.
A picture showing a Maunder “butterfl y diagram” (a plot showing the migration pattern of sunspot formation toward the solar equator during the 11-year solar cycle):http://www.ucar.edu/communications/quarterly/summer00/chart.html
1.
2.
225
200
175
150
125
100
75
50
25
0
250
Sm
ooth
ed S
unsp
ot N
umbe
r
1992 1993 1994 1995 1996 1997 1998 1999 2000 2001
Year
2002 2003 2004 2005 2006
Cycle 22 Cycle 23
First North Solar Pass
First South Solar Pass
Ulysses Second Solar Orbit
Second South Solar Pass
Second North Solar Pass
EW-2005-12-017-JPL
3
National Aeronautics andSpace Administration
Jet Propulsion LaboratoryCalifornia Institute of TechnologyPasadena, California
JPL 410-053
JPL 400-1133 Rev.1 12/05
Maunder Mystery Clue #1: The Connection to Mathematics
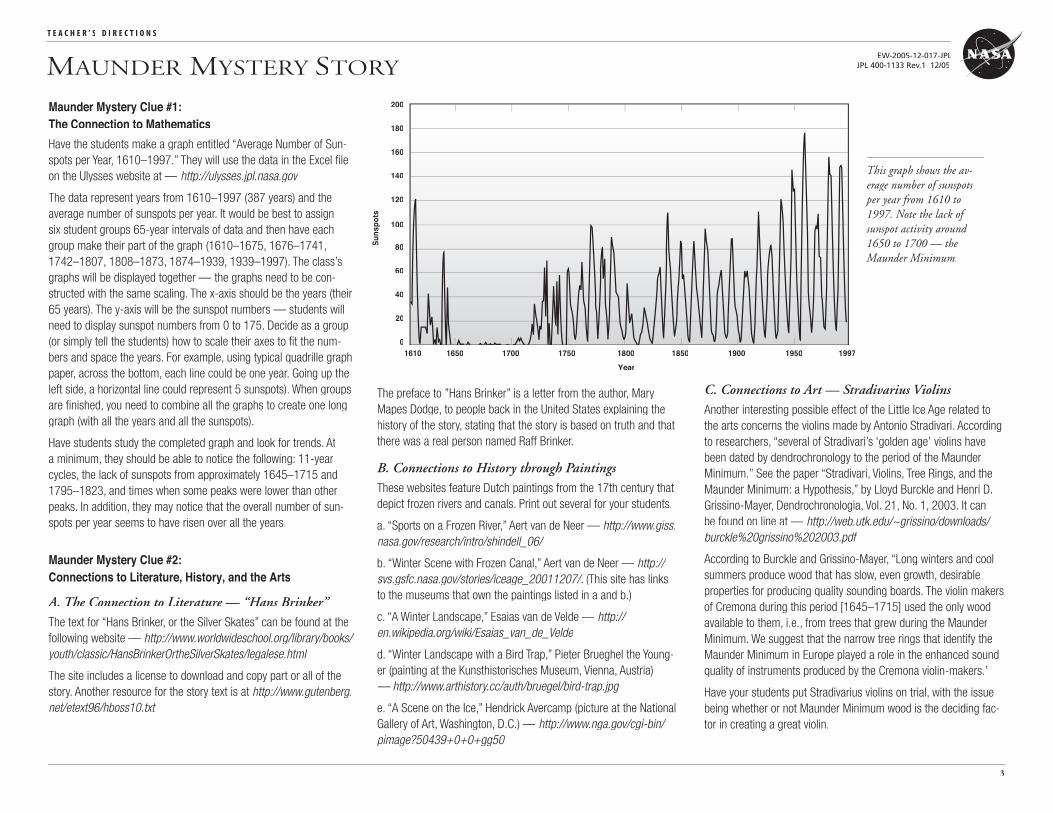
Have the students make a graph entitled “Average Number of Sun-spots per Year, 1610–1997.” They will use the data in the Excel fi le on the Ulysses website at — http://ulysses.jpl.nasa.gov
The data represent years from 1610–1997 (387 years) and the average number of sunspots per year. It would be best to assign six student groups 65-year intervals of data and then have each group make their part of the graph (1610–1675, 1676–1741, 1742–1807, 1808–1873, 1874–1939, 1939–1997). The class’s graphs will be displayed together — the graphs need to be con-structed with the same scaling. The x-axis should be the years (their 65 years). The y-axis will be the sunspot numbers — students will need to display sunspot numbers from 0 to 175. Decide as a group (or simply tell the students) how to scale their axes to fi t the num-bers and space the years. For example, using typical quadrille graph paper, across the bottom, each line could be one year. Going up the left side, a horizontal line could represent 5 sunspots). When groups are fi nished, you need to combine all the graphs to create one long graph (with all the years and all the sunspots).
Have students study the completed graph and look for trends. At a minimum, they should be able to notice the following: 11-year cycles, the lack of sunspots from approximately 1645–1715 and 1795–1823, and times when some peaks were lower than other peaks. In addition, they may notice that the overall number of sun-spots per year seems to have risen over all the years.
Maunder Mystery Clue #2: Connections to Literature, History, and the Arts
A. The Connection to Literature — “Hans Brinker”The text for “Hans Brinker, or the Silver Skates” can be found at the following website — http://www.worldwideschool.org/library/books/youth/classic/HansBrinkerOrtheSilverSkates/legalese.html
The site includes a license to download and copy part or all of the story. Another resource for the story text is at http://www.gutenberg.net/etext96/hboss10.txt
Maunder Maunder Maunder ystery Story
T E A C H E R ’ S . D I R E C T I O N S
This graph shows the av-erage number of sunspots per year from 1610 to 1997. Note the lack of sunspot activity around 1650 to 1700 — the Maunder Minimum.
Year
180
160
140
120
100
80
60
40
20
0
200
Sun
spot
s
1650 1700 1750 1800 1850 1900 19501610 1997
The preface to ”Hans Brinker” is a letter from the author, Mary Mapes Dodge, to people back in the United States explaining the history of the story, stating that the story is based on truth and that there was a real person named Raff Brinker.
B. Connections to History through Paintings These websites feature Dutch paintings from the 17th century that depict frozen rivers and canals. Print out several for your students.
a. “Sports on a Frozen River,” Aert van de Neer — http://www.giss.nasa.gov/research/intro/shindell_06/
b. “Winter Scene with Frozen Canal,” Aert van de Neer — http://svs.gsfc.nasa.gov/stories/iceage_20011207/. (This site has links to the museums that own the paintings listed in a and b.)
c. “A Winter Landscape,” Esaias van de Velde — http://en.wikipedia.org/wiki/Esaias_van_de_Velde
d. “Winter Landscape with a Bird Trap,” Pieter Brueghel the Young-er (painting at the Kunsthistorisches Museum, Vienna, Austria) — http://www.arthistory.cc/auth/bruegel/bird-trap.jpg
e. “A Scene on the Ice,” Hendrick Avercamp (picture at the National Gallery of Art, Washington, D.C.) — http://www.nga.gov/cgi-bin/pimage?50439+0+0+gg50
C. Connections to Art — Stradivarius Violins Another interesting possible effect of the Little Ice Age related to the arts concerns the violins made by Antonio Stradivari. According to researchers, “several of Stradivari’s ‘golden age’ violins have been dated by dendrochronology to the period of the Maunder Minimum.” See the paper “Stradivari, Violins, Tree Rings, and the Maunder Minimum: a Hypothesis,” by Lloyd Burckle and Henri D. Grissino-Mayer, Dendrochronologia, Vol. 21, No. 1, 2003. It can be found on line at — http://web.utk.edu/~grissino/downloads/burckle%20grissino%202003.pdf
According to Burckle and Grissino-Mayer, “Long winters and cool summers produce wood that has slow, even growth, desirable properties for producing quality sounding boards. The violin makers of Cremona during this period [1645–1715] used the only wood available to them, i.e., from trees that grew during the Maunder Minimum. We suggest that the narrow tree rings that identify the Maunder Minimum in Europe played a role in the enhanced sound quality of instruments produced by the Cremona violin-makers.”
Have your students put Stradivarius violins on trial, with the issue being whether or not Maunder Minimum wood is the deciding fac-tor in creating a great violin.
EW-2005-12-017-JPL
4
National Aeronautics andSpace Administration
Jet Propulsion LaboratoryCalifornia Institute of TechnologyPasadena, California
JPL 410-053
JPL 400-1133 Rev.1 12/05
the situation in Maunder’s time. He wondered whether sunspot cycles might have something to do with the difference. He hy-pothesized that the cold temperatures of the period that became known as the Little Ice Age might have occurred because the sun-spot count was low in number. When he presented this concept in the 1880s, his ideas were ridiculed and dismissed. There was no way to prove Maunder’s sunspot theory. Despite this setback, An-nie and E. Walter Maunder continued to do research and wrote on many different astronomical projects. It wasn’t until 1974, when scientist John A. (Jack) Eddy did work with tree rings that sup-ported Maunder’s idea, that the coldest part of the Little Ice Age (17th–18th centuries) was named “The Maunder Minimum.”
Maunder Sunspot Theory — What Do You Think?
The following activities are the clues (and possible proof) that have brought Annie and E. Walter Maunder’s sunspot theory back into focus.
Keep track of whether you agree with Annie and Walter.
Circle yes or no —
Clue #1: Sunspot graph yes no
Clue #2 :
A. The story of “Hans Brinker” yes no probably took place during the Little Ice Age
B. The Dutch paintings yes no
C. Stradivarius violins yes no
Clue #3:
Tree rings yes no
NOTE: The defi nition of “climate” is the weather conditions averaged over
30 years or more.
Who were Edward Walter and Annie Scott Dill Maunder and what do they have to do with our study of the Sun?
E. Walter Maunder
Edward Walter (E. Walter) Maunder was born in England on April 12, 1851. He was a solar observer and photographed the Sun at the Royal Greenwich Observatory. The Solar Department at the Observatory was founded in 1873. He was the founder of the British Astronomical Association and was president of the associa-tion from 1892–1893. He was elected to the Royal Astronomical Society as a Fellow in 1875. He married Annie Scott Dill in 1895. E. Walter Maunder died March 21, 1928. (The British Astronomical Association presidential portrait can be found at — http://www.britastro.com/mars/directrs.htm)
Annie S.D. Maunder
Annie Scott Dill was born April 14, 1868. She was extremely well-educated. She had passed the Cambridge University degree ex-aminations with honors in mathematics, but was unable to receive a degree because she was a woman. She worked with Walter at the Royal Greenwich Observatory from 1891 until they were married in 1895. Annie had to resign from her job after they were married; however, she and her husband continued to work together (and publish together) until his death. Once married, Annie became known as Annie S. D. Maunder. Annie was elected to the Royal Astronomical Society in 1916. She died on September 15, 1947.
A Climate–Sunspot Theory
As E.W. Maunder observed and collected data on sunspots, he noticed a pattern that confi rmed an earlier idea that sunspots had maximums and minimums. It appeared that people who lived in the late 17th and early 18th centuries didn’t see as many sunspots as had been previously reported. Additionally, the Northern Lights were nonexistent at the time. Maunder noticed this and thought that it might be signifi cant. He also noticed that the climate had changed and wondered if this fact was related to the number of sunspots. Maunder was interested in Dutch paintings done during the 1600s that showed frozen canals — completely different than
The Maunders
S T U D E N T . P A G E
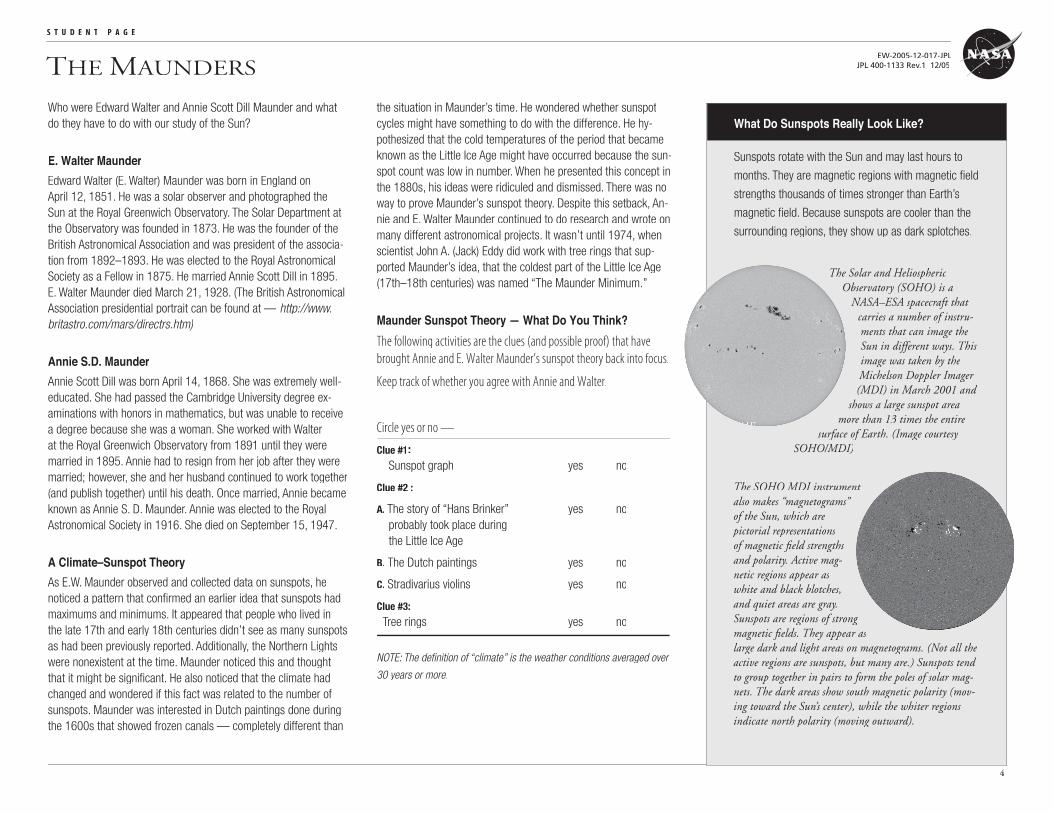
The Solar and Heliospheric Observatory (SOHO) is a
NASA–ESA spacecraft that carries a number of instru-ments that can image the Sun in different ways. This image was taken by the Michelson Doppler Imager (MDI) in March 2001 and
shows a large sunspot area more than 13 times the entire
surface of Earth. (Image courtesy SOHO/MDI)
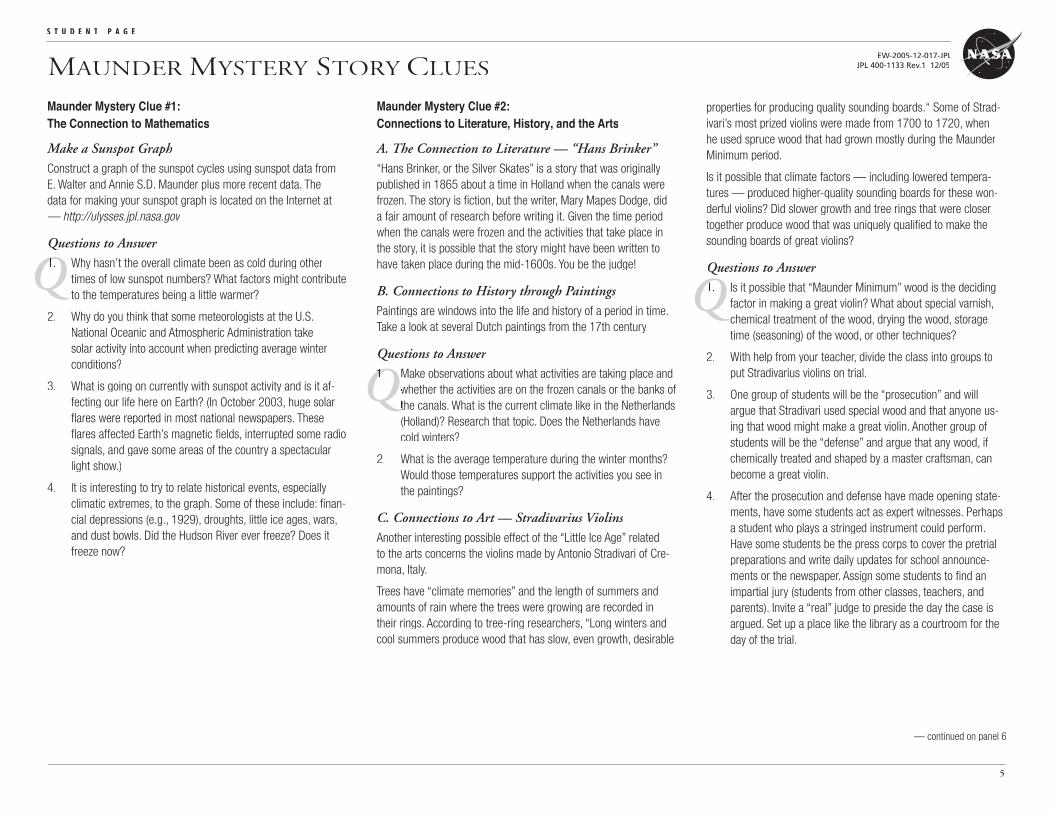
The SOHO MDI instrument also makes “magnetograms” of the Sun, which are pictorial representations of magnetic fi eld strengths and polarity. Active mag-netic regions appear as white and black blotches, and quiet areas are gray. Sunspots are regions of strong magnetic fi elds. They appear as large dark and light areas on magnetograms. (Not all the active regions are sunspots, but many are.) Sunspots tend to group together in pairs to form the poles of solar mag-nets. The dark areas show south magnetic polarity (mov-ing toward the Sun’s center), while the whiter regions indicate north polarity (moving outward).
What Do Sunspots Really Look Like?
Sunspots rotate with the Sun and may last hours to
months. They are magnetic regions with magnetic fi eld
strengths thousands of times stronger than Earth’s
magnetic fi eld. Because sunspots are cooler than the
surrounding regions, they show up as dark splotches.
EW-2005-12-017-JPL
5
National Aeronautics andSpace Administration
Jet Propulsion LaboratoryCalifornia Institute of TechnologyPasadena, California
JPL 410-053
JPL 400-1133 Rev.1 12/05
Q
Q
Maunder Mystery Systery Systery tory Clues
S T U D E N T . P A G E
Maunder Mystery Clue #2: Connections to Literature, History, and the Arts
A. The Connection to Literature — “Hans Brinker” “Hans Brinker, or the Silver Skates” is a story that was originally published in 1865 about a time in Holland when the canals were frozen. The story is fi ction, but the writer, Mary Mapes Dodge, did a fair amount of research before writing it. Given the time period when the canals were frozen and the activities that take place in the story, it is possible that the story might have been written to have taken place during the mid-1600s. You be the judge!
B. Connections to History through Paintings Paintings are windows into the life and history of a period in time. Take a look at several Dutch paintings from the 17th century.
Questions to AnswerMake observations about what activities are taking place and QMake observations about what activities are taking place and Qwhether the activities are on the frozen canals or the banks of Qwhether the activities are on the frozen canals or the banks of Qthe canals. What is the current climate like in the Netherlands
Qthe canals. What is the current climate like in the Netherlands
Q(Holland)? Research that topic. Does the Netherlands have cold winters?
What is the average temperature during the winter months? Would those temperatures support the activities you see in the paintings?
C. Connections to Art — Stradivarius Violins Another interesting possible effect of the “Little Ice Age” related to the arts concerns the violins made by Antonio Stradivari of Cre-mona, Italy.
Trees have “climate memories” and the length of summers and amounts of rain where the trees were growing are recorded in their rings. According to tree-ring researchers, “Long winters and cool summers produce wood that has slow, even growth, desirable
Q1.Q2.
properties for producing quality sounding boards.“ Some of Strad-ivari’s most prized violins were made from 1700 to 1720, when he used spruce wood that had grown mostly during the Maunder Minimum period.
Is it possible that climate factors — including lowered tempera-tures — produced higher-quality sounding boards for these won-derful violins? Did slower growth and tree rings that were closer together produce wood that was uniquely qualifi ed to make the sounding boards of great violins?
Questions to AnswerIs it possible that “Maunder Minimum” wood is the deciding factor in making a great violin? What about special varnish, chemical treatment of the wood, drying the wood, storage time (seasoning) of the wood, or other techniques?
With help from your teacher, divide the class into groups to put Stradivarius violins on trial.
One group of students will be the “prosecution” and will argue that Stradivari used special wood and that anyone us-ing that wood might make a great violin. Another group of students will be the “defense” and argue that any wood, if chemically treated and shaped by a master craftsman, can become a great violin.
After the prosecution and defense have made opening state-ments, have some students act as expert witnesses. Perhaps a student who plays a stringed instrument could perform. Have some students be the press corps to cover the pretrial preparations and write daily updates for school announce-ments or the newspaper. Assign some students to fi nd an impartial jury (students from other classes, teachers, and parents). Invite a “real” judge to preside the day the case is argued. Set up a place like the library as a courtroom for the day of the trial.
Q1.Q2.
3.
4.
— continued on panel 6
Q
Maunder Mystery Clue #1: The Connection to Mathematics
Make a Sunspot GraphConstruct a graph of the sunspot cycles using sunspot data from E. Walter and Annie S.D. Maunder plus more recent data. The data for making your sunspot graph is located on the Internet at — http://ulysses.jpl.nasa.gov
Questions to AnswerWhy hasn’t the overall climate been as cold during other times of low sunspot numbers? What factors might contribute to the temperatures being a little warmer?
Why do you think that some meteorologists at the U.S. National Oceanic and Atmospheric Administration take solar activity into account when predicting average winter conditions?
What is going on currently with sunspot activity and is it af-fecting our life here on Earth? (In October 2003, huge solar fl ares were reported in most national newspapers. These fl ares affected Earth’s magnetic fi elds, interrupted some radio signals, and gave some areas of the country a spectacular light show.)
It is interesting to try to relate historical events, especially climatic extremes, to the graph. Some of these include: fi nan-cial depressions (e.g., 1929), droughts, little ice ages, wars, and dust bowls. Did the Hudson River ever freeze? Does it freeze now?
Q1.Q2.
3.
4.
EW-2005-12-017-JPL
6
National Aeronautics andSpace Administration
Jet Propulsion LaboratoryCalifornia Institute of TechnologyPasadena, California
JPL 410-053
JPL 400-1133 Rev.1 12/05
S T U D E N T . P A G E
Maunder Mystery Story Ctory Ctory lues (cont’d)
Maunder Mystery Clue #3: The Connection to Life Science
Tree RingsTrees mainly do their growing in the spring and summer (espe-cially in the northern part of the U.S.). During the spring, after the ground begins to thaw, trees take in great amounts of water, combine it with the sugar they’ve stored in their roots and inside the branches, and send that to the branches. The branch cells grow, and also sprout leaf buds and fl owers. They grow rapidly during the spring as more water is made available to them. Their growth slows during the summer as they begin to store food. The growth comes to a stop in the fall as the tree loses its leaves and becomes dormant for the winter. The tree’s yearly growth cycle shows up as a “ring.” Within a yearly ring, the spring growth shows as lighter-colored wood, consisting of large, thin-walled cells (which are weaker). The summer growth is darker-colored wood, consisting of smaller, thicker, stronger cells. Further, if the tree had a “good” growing year — with lots of sunshine and water — the ring will be wide; smaller rings indicate poorer growing years.
Any tree branch cut (and polished somewhat) will show this pattern. Look at some cut branches for the spring and summer growth (this is best done using a hand lens). The tree was cut in the fall of 2003 at the fi nish of the 2003 spring/summer grow-ing cycle. The outermost layer is the bark; the next inner layer is the growing layer. Underneath these, the next ring in is the 2003 growth ring; the next inner ring grew during 2002, and so on.
Tree Rings and the Sunspot CycleTree ring data matches up to the 11-year sunspot cycle. Scientist Jack Eddy confi rmed this in 1974. Many scientists did not believe E. Walter and Annie Maunder’s ideas. They thought the people who recorded sunspot data during the years 1645–1715 could not have done it accurately. Jack Eddy suspected the opposite and was able to fi nd confi rmation for the sunspot numbers in tree ring size.
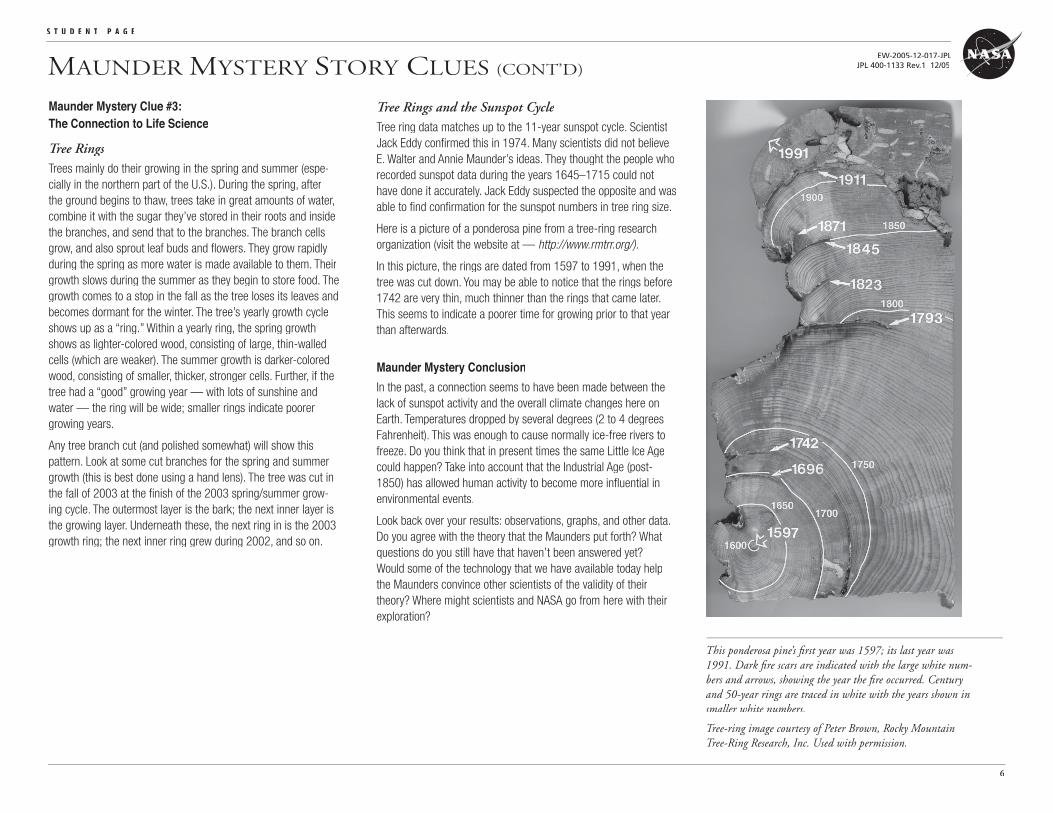
Here is a picture of a ponderosa pine from a tree-ring research organization (visit the website at — http://www.rmtrr.org/).
In this picture, the rings are dated from 1597 to 1991, when the tree was cut down. You may be able to notice that the rings before 1742 are very thin, much thinner than the rings that came later. This seems to indicate a poorer time for growing prior to that year than afterwards.
Maunder Mystery Conclusion
In the past, a connection seems to have been made between the lack of sunspot activity and the overall climate changes here on Earth. Temperatures dropped by several degrees (2 to 4 degrees Fahrenheit). This was enough to cause normally ice-free rivers to freeze. Do you think that in present times the same Little Ice Age could happen? Take into account that the Industrial Age (post-1850) has allowed human activity to become more infl uential in environmental events.
Look back over your results: observations, graphs, and other data. Do you agree with the theory that the Maunders put forth? What questions do you still have that haven’t been answered yet? Would some of the technology that we have available today help the Maunders convince other scientists of the validity of their theory? Where might scientists and NASA go from here with their exploration?
This ponderosa pine’s fi rst year was 1597; its last year was 1991. Dark fi re scars are indicated with the large white num-bers and arrows, showing the year the fi re occurred. Century and 50-year rings are traced in white with the years shown in smaller white numbers.
Tree-ring image courtesy of Peter Brown, Rocky Mountain Tree-Ring Research, Inc. Used with permission.
EW-2005-12-017-JPL
7
National Aeronautics andSpace Administration
Jet Propulsion LaboratoryCalifornia Institute of TechnologyPasadena, California
JPL 410-053
JPL 400-1133 Rev.1 12/05
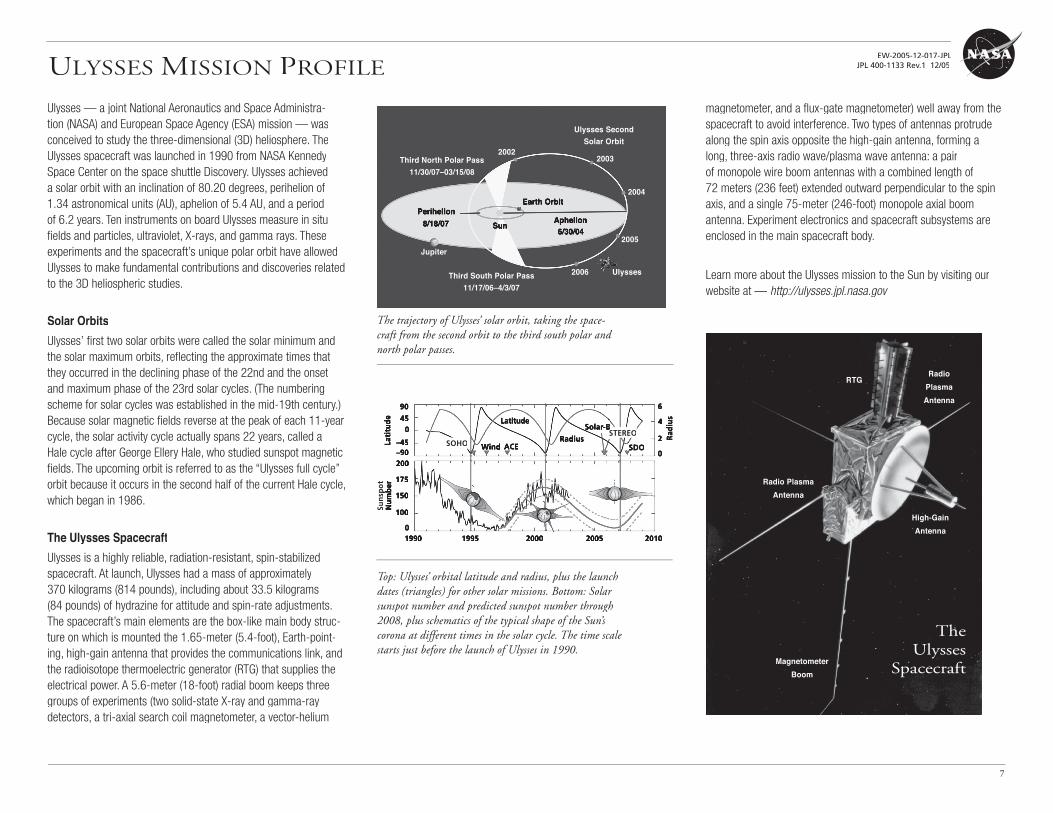
Ulysses — a joint National Aeronautics and Space Administra-tion (NASA) and European Space Agency (ESA) mission — was conceived to study the three-dimensional (3D) heliosphere. The Ulysses spacecraft was launched in 1990 from NASA Kennedy Space Center on the space shuttle Discovery. Ulysses achieved a solar orbit with an inclination of 80.20 degrees, perihelion of 1.34 astronomical units (AU), aphelion of 5.4 AU, and a period of 6.2 years. Ten instruments on board Ulysses measure in situ fi elds and particles, ultraviolet, X-rays, and gamma rays. These experiments and the spacecraft’s unique polar orbit have allowed Ulysses to make fundamental contributions and discoveries related to the 3D heliospheric studies.
Solar Orbits
Ulysses’ fi rst two solar orbits were called the solar minimum and the solar maximum orbits, refl ecting the approximate times that they occurred in the declining phase of the 22nd and the onset and maximum phase of the 23rd solar cycles. (The numbering scheme for solar cycles was established in the mid-19th century.) Because solar magnetic fi elds reverse at the peak of each 11-year cycle, the solar activity cycle actually spans 22 years, called a Hale cycle after George Ellery Hale, who studied sunspot magnetic fi elds. The upcoming orbit is referred to as the “Ulysses full cycle” orbit because it occurs in the second half of the current Hale cycle, which began in 1986.
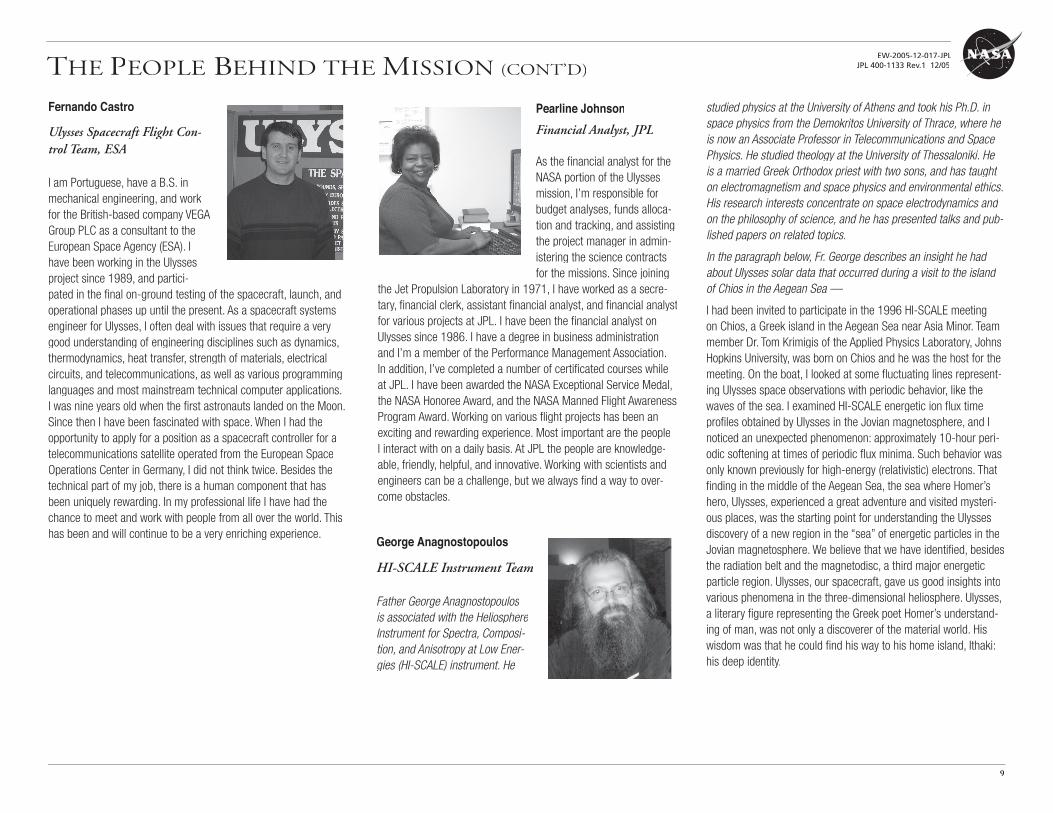
The Ulysses Spacecraft
Ulysses is a highly reliable, radiation-resistant, spin-stabilized spacecraft. At launch, Ulysses had a mass of approximately 370 kilograms (814 pounds), including about 33.5 kilograms (84 pounds) of hydrazine for attitude and spin-rate adjustments. The spacecraft’s main elements are the box-like main body struc-ture on which is mounted the 1.65-meter (5.4-foot), Earth-point-ing, high-gain antenna that provides the communications link, and the radioisotope thermoelectric generator (RTG) that supplies the electrical power. A 5.6-meter (18-foot) radial boom keeps three groups of experiments (two solid-state X-ray and gamma-ray detectors, a tri-axial search coil magnetometer, a vector-helium
Ulysses Mission Profi le
magnetometer, and a fl ux-gate magnetometer) well away from the spacecraft to avoid interference. Two types of antennas protrude along the spin axis opposite the high-gain antenna, forming a long, three-axis radio wave/plasma wave antenna: a pair of monopole wire boom antennas with a combined length of 72 meters (236 feet) extended outward perpendicular to the spin axis, and a single 75-meter (246-foot) monopole axial boom antenna. Experiment electronics and spacecraft subsystems are enclosed in the main spacecraft body.
Learn more about the Ulysses mission to the Sun by visiting our website at — http://ulysses.jpl.nasa.gov
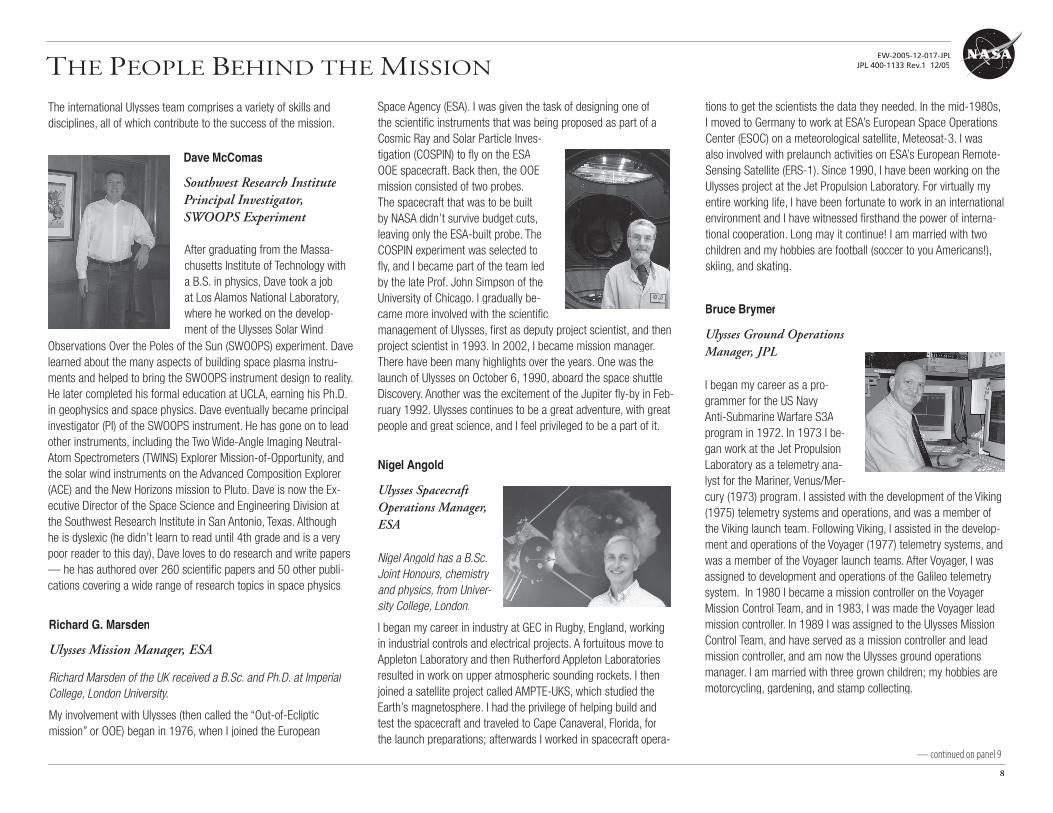
Top: Ulysses’ orbital latitude and radius, plus the launch dates (triangles) for other solar missions. Bottom: Solar sunspot number and predicted sunspot number through 2008, plus schematics of the typical shape of the Sun’s corona at different times in the solar cycle. The time scale starts just before the launch of Ulysses in 1990.
Earth Orbit
Sun
Perihelion8/18/07
Ulysses Second Solar Orbit
Jupiter
The trajectory of Ulysses’ solar orbit, taking the space-craft from the second orbit to the third south polar and north polar passes.
Aphelion6/30/04
Third North Polar Pass11/30/07–03/15/08
Third South Polar Pass11/17/06–4/3/07
20022003
2004
2005
2006
Radio Plasma
Antenna
Magnetometer
Boom
High-Gain
Antenna
Radio
Plasma
Antenna
RTG
The Ulysses
Spacecraft
Ulysses
0
–90200
150
90
0
45
–45
1990
175
100
1995 2000 2005 2010
6
Sun
spo
t Su
nsp
ot
Nu
mb
er
4
2
0
Rad
ius
STEREOSTEREOSOHOSOHO Wind ACE
Radius
LatitudeSolar-BSolar-BSolar-B
SDO
Lati
tud
e
EW-2005-12-017-JPL
8
National Aeronautics andSpace Administration
Jet Propulsion LaboratoryCalifornia Institute of TechnologyPasadena, California
JPL 410-053
JPL 400-1133 Rev.1 12/05
Dave McComas
Southwest Research InstitutePrincipal Investigator, SWOOPS Experiment
The People Behind the Mission
Richard G. Marsden
Ulysses Mission Manager, ESA
Richard Marsden of the UK received a B.Sc. and Ph.D. at Imperial College, London University.
My involvement with Ulysses (then called the “Out-of-Ecliptic mission” or OOE) began in 1976, when I joined the European
Nigel Angold
Ulysses Spacecraft Operations Manager, ESA
Nigel Angold has a B.Sc. Joint Honours, chemistry and physics, from Univer-sity College, London.
I began my career in industry at GEC in Rugby, England, working in industrial controls and electrical projects. A fortuitous move to Appleton Laboratory and then Rutherford Appleton Laboratories resulted in work on upper atmospheric sounding rockets. I then joined a satellite project called AMPTE-UKS, which studied the Earth’s magnetosphere. I had the privilege of helping build and test the spacecraft and traveled to Cape Canaveral, Florida, for the launch preparations; afterwards I worked in spacecraft opera-
The international Ulysses team comprises a variety of skills and disciplines, all of which contribute to the success of the mission.
Space Agency (ESA). I was given the task of designing one of the scientifi c instruments that was being proposed as part of a Cosmic Ray and Solar Particle Inves-tigation (COSPIN) to fl y on the ESA OOE spacecraft. Back then, the OOE mission consisted of two probes. The spacecraft that was to be built by NASA didn’t survive budget cuts, leaving only the ESA-built probe. The COSPIN experiment was selected to fl y, and I became part of the team led by the late Prof. John Simpson of the University of Chicago. I gradually be-came more involved with the scientifi c management of Ulysses, fi rst as deputy project scientist, and then project scientist in 1993. In 2002, I became mission manager. There have been many highlights over the years. One was the launch of Ulysses on October 6, 1990, aboard the space shuttle Discovery. Another was the excitement of the Jupiter fl y-by in Feb-ruary 1992. Ulysses continues to be a great adventure, with great people and great science, and I feel privileged to be a part of it.
tions to get the scientists the data they needed. In the mid-1980s, I moved to Germany to work at ESA’s European Space Operations Center (ESOC) on a meteorological satellite, Meteosat-3. I was also involved with prelaunch activities on ESA’s European Remote-Sensing Satellite (ERS-1). Since 1990, I have been working on the Ulysses project at the Jet Propulsion Laboratory. For virtually my entire working life, I have been fortunate to work in an international environment and I have witnessed fi rsthand the power of interna-tional cooperation. Long may it continue! I am married with two children and my hobbies are football (soccer to you Americans!), skiing, and skating.
Bruce Brymer
Ulysses Ground Operations Manager, JPL
I began my career as a pro-grammer for the US Navy Anti-Submarine Warfare S3A program in 1972. In 1973 I be-gan work at the Jet Propulsion Laboratory as a telemetry ana-lyst for the Mariner, Venus/Mer-cury (1973) program. I assisted with the development of the Viking (1975) telemetry systems and operations, and was a member of the Viking launch team. Following Viking, I assisted in the develop-ment and operations of the Voyager (1977) telemetry systems, and was a member of the Voyager launch teams. After Voyager, I was assigned to development and operations of the Galileo telemetry system. In 1980 I became a mission controller on the Voyager Mission Control Team, and in 1983, I was made the Voyager lead mission controller. In 1989 I was assigned to the Ulysses Mission Control Team, and have served as a mission controller and lead mission controller, and am now the Ulysses ground operations manager. I am married with three grown children; my hobbies are motorcycling, gardening, and stamp collecting.
— continued on panel 9
After graduating from the Massa-chusetts Institute of Technology with a B.S. in physics, Dave took a job at Los Alamos National Laboratory, where he worked on the develop-ment of the Ulysses Solar Wind
Observations Over the Poles of the Sun (SWOOPS) experiment. Dave learned about the many aspects of building space plasma instru-ments and helped to bring the SWOOPS instrument design to reality. He later completed his formal education at UCLA, earning his Ph.D. in geophysics and space physics. Dave eventually became principal investigator (PI) of the SWOOPS instrument. He has gone on to lead other instruments, including the Two Wide-Angle Imaging Neutral-Atom Spectrometers (TWINS) Explorer Mission-of-Opportunity, and the solar wind instruments on the Advanced Composition Explorer (ACE) and the New Horizons mission to Pluto. Dave is now the Ex-ecutive Director of the Space Science and Engineering Division at the Southwest Research Institute in San Antonio, Texas. Although he is dyslexic (he didn’t learn to read until 4th grade and is a very poor reader to this day), Dave loves to do research and write papers — he has authored over 260 scientifi c papers and 50 other publi-cations covering a wide range of research topics in space physics.
EW-2005-12-017-JPL
9
National Aeronautics andSpace Administration
Jet Propulsion LaboratoryCalifornia Institute of TechnologyPasadena, California
JPL 410-053
JPL 400-1133 Rev.1 12/05The People Behind the Mission (cont’d)
Fernando Castro
Ulysses Spacecraft Flight Con-trol Team, ESA
I am Portuguese, have a B.S. in mechanical engineering, and work for the British-based company VEGA Group PLC as a consultant to the European Space Agency (ESA). I have been working in the Ulysses project since 1989, and partici-pated in the fi nal on-ground testing of the spacecraft, launch, and operational phases up until the present. As a spacecraft systems engineer for Ulysses, I often deal with issues that require a very good understanding of engineering disciplines such as dynamics, thermodynamics, heat transfer, strength of materials, electrical circuits, and telecommunications, as well as various programming languages and most mainstream technical computer applications. I was nine years old when the fi rst astronauts landed on the Moon. Since then I have been fascinated with space. When I had the opportunity to apply for a position as a spacecraft controller for a telecommunications satellite operated from the European Space Operations Center in Germany, I did not think twice. Besides the technical part of my job, there is a human component that has been uniquely rewarding. In my professional life I have had the chance to meet and work with people from all over the world. This has been and will continue to be a very enriching experience.
Pearline Johnson
Financial Analyst, JPL
As the fi nancial analyst for the NASA portion of the Ulysses mission, I’m responsible for budget analyses, funds alloca-tion and tracking, and assisting the project manager in admin-istering the science contracts for the missions. Since joining
the Jet Propulsion Laboratory in 1971, I have worked as a secre-tary, fi nancial clerk, assistant fi nancial analyst, and fi nancial analyst for various projects at JPL. I have been the fi nancial analyst on Ulysses since 1986. I have a degree in business administration and I’m a member of the Performance Management Association. In addition, I’ve completed a number of certifi cated courses while at JPL. I have been awarded the NASA Exceptional Service Medal, the NASA Honoree Award, and the NASA Manned Flight Awareness Program Award. Working on various fl ight projects has been an exciting and rewarding experience. Most important are the people I interact with on a daily basis. At JPL the people are knowledge-able, friendly, helpful, and innovative. Working with scientists and engineers can be a challenge, but we always fi nd a way to over-come obstacles.
George Anagnostopoulos
HI-SCALE Instrument Team
Father George Anagnostopoulos is associated with the Heliosphere Instrument for Spectra, Composi-tion, and Anisotropy at Low Ener-gies (HI-SCALE) instrument. He
studied physics at the University of Athens and took his Ph.D. in space physics from the Demokritos University of Thrace, where he is now an Associate Professor in Telecommunications and Space Physics. He studied theology at the University of Thessaloniki. He is a married Greek Orthodox priest with two sons, and has taught on electromagnetism and space physics and environmental ethics. His research interests concentrate on space electrodynamics and on the philosophy of science, and he has presented talks and pub-lished papers on related topics.
In the paragraph below, Fr. George describes an insight he had about Ulysses solar data that occurred during a visit to the island of Chios in the Aegean Sea —
I had been invited to participate in the 1996 HI-SCALE meeting on Chios, a Greek island in the Aegean Sea near Asia Minor. Team member Dr. Tom Krimigis of the Applied Physics Laboratory, Johns Hopkins University, was born on Chios and he was the host for the meeting. On the boat, I looked at some fl uctuating lines represent-ing Ulysses space observations with periodic behavior, like the waves of the sea. I examined HI-SCALE energetic ion fl ux time profi les obtained by Ulysses in the Jovian magnetosphere, and I noticed an unexpected phenomenon: approximately 10-hour peri-odic softening at times of periodic fl ux minima. Such behavior was only known previously for high-energy (relativistic) electrons. That fi nding in the middle of the Aegean Sea, the sea where Homer’s hero, Ulysses, experienced a great adventure and visited mysteri-ous places, was the starting point for understanding the Ulysses discovery of a new region in the “sea” of energetic particles in the Jovian magnetosphere. We believe that we have identifi ed, besides the radiation belt and the magnetodisc, a third major energetic particle region. Ulysses, our spacecraft, gave us good insights into various phenomena in the three-dimensional heliosphere. Ulysses, a literary fi gure representing the Greek poet Homer’s understand-ing of man, was not only a discoverer of the material world. His wisdom was that he could fi nd his way to his home island, Ithaki: his deep identity.