Embed Size (px)
Citation preview

SOLAR REPORT MARCH 2016
Australian Energy Council
DD MM YYYY
© Australian Energy Council
Level 14, 50 Market Street, Melbourne
VIC 3000
SOLAR REPORT MARCH 2017 Australian Energy Council

2
2
Table of contents
STATE OF SOLAR PV IN AUSTRALIA ................................................................................3
LOWER INSTALLATION NUMBERS, BIGGER SYSTEM SCALE .......................................6
ESTIMATED RESIDENTIAL PV GENERATION ................................................................. 10
LEVELISED COST OF ENERGY ........................................................................................ 11
PAYBACK PERIOD, DETAILED MODEL ........................................................................... 14
SOLAR NEWS ROUND UP ................................................................................................. 16
METHODOLOGY APPENDIX .............................................................................................. 17
1. Solar installations methodology ............................................................................................................ 17
2. Levelised Cost of Electricity Methodology ............................................................................................ 17
3. Payback period methodology ............................................................................................................... 19
3
3
STATE OF SOLAR PV IN AUSTRALIA
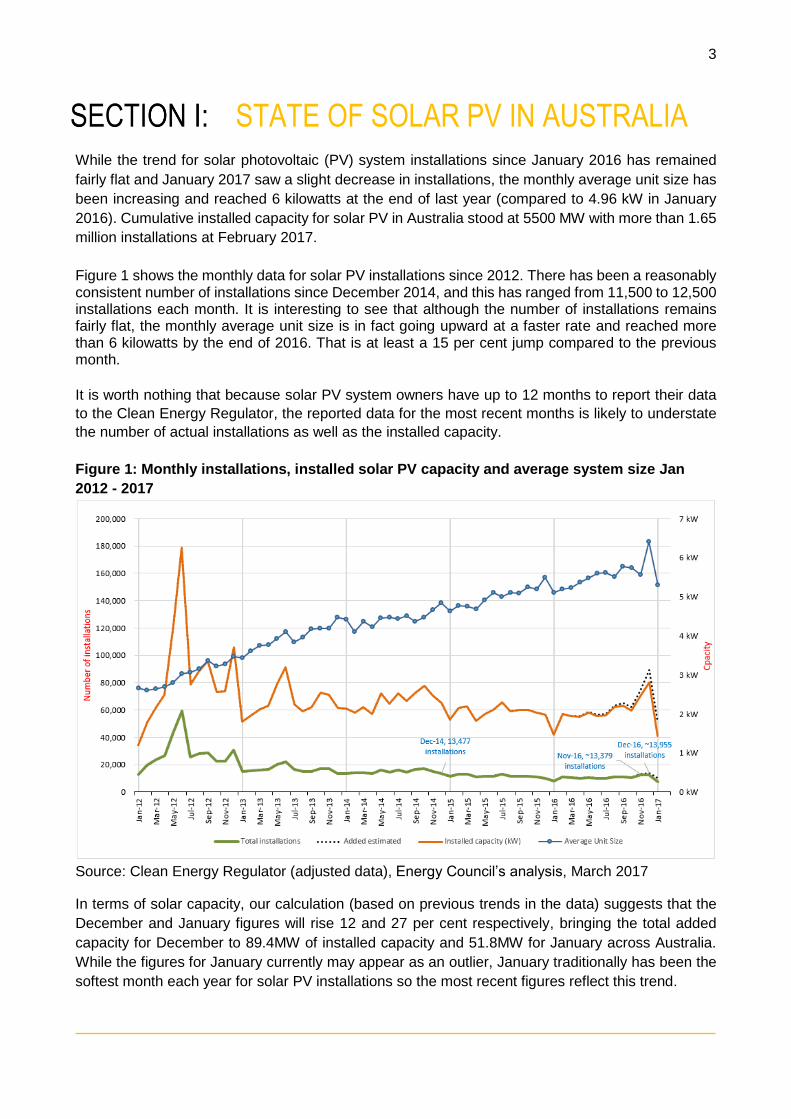
While the trend for solar photovoltaic (PV) system installations since January 2016 has remained
fairly flat and January 2017 saw a slight decrease in installations, the monthly average unit size has
been increasing and reached 6 kilowatts at the end of last year (compared to 4.96 kW in January
2016). Cumulative installed capacity for solar PV in Australia stood at 5500 MW with more than 1.65
million installations at February 2017.
Figure 1 shows the monthly data for solar PV installations since 2012. There has been a reasonably consistent number of installations since December 2014, and this has ranged from 11,500 to 12,500 installations each month. It is interesting to see that although the number of installations remains fairly flat, the monthly average unit size is in fact going upward at a faster rate and reached more than 6 kilowatts by the end of 2016. That is at least a 15 per cent jump compared to the previous month.
It is worth nothing that because solar PV system owners have up to 12 months to report their data
to the Clean Energy Regulator, the reported data for the most recent months is likely to understate
the number of actual installations as well as the installed capacity.
Figure 1: Monthly installations, installed solar PV capacity and average system size Jan
2012 - 2017
Source: Clean Energy Regulator (adjusted data), Energy Council’s analysis, March 2017
In terms of solar capacity, our calculation (based on previous trends in the data) suggests that the
December and January figures will rise 12 and 27 per cent respectively, bringing the total added
capacity for December to 89.4MW of installed capacity and 51.8MW for January across Australia.
While the figures for January currently may appear as an outlier, January traditionally has been the
softest month each year for solar PV installations so the most recent figures reflect this trend.
4
4
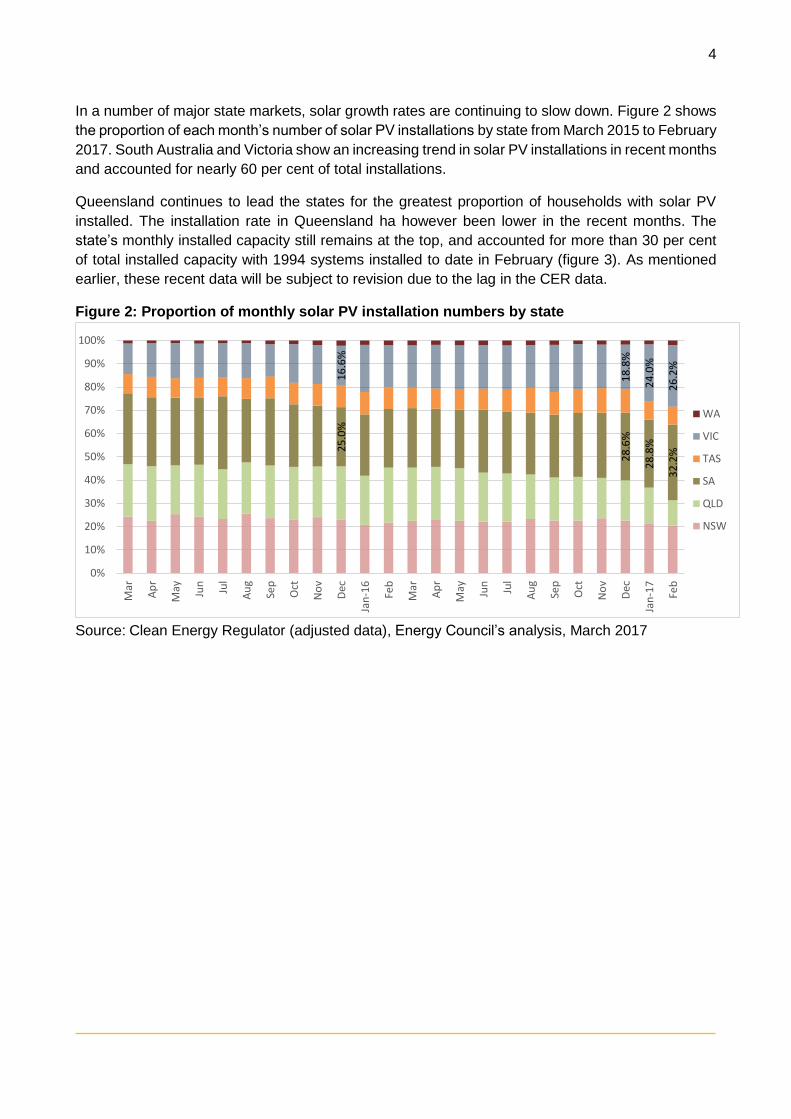
In a number of major state markets, solar growth rates are continuing to slow down. Figure 2 shows
the proportion of each month’s number of solar PV installations by state from March 2015 to February
2017. South Australia and Victoria show an increasing trend in solar PV installations in recent months
and accounted for nearly 60 per cent of total installations.
Queensland continues to lead the states for the greatest proportion of households with solar PV
installed. The installation rate in Queensland ha however been lower in the recent months. The
state’s monthly installed capacity still remains at the top, and accounted for more than 30 per cent
of total installed capacity with 1994 systems installed to date in February (figure 3). As mentioned
earlier, these recent data will be subject to revision due to the lag in the CER data.
Figure 2: Proportion of monthly solar PV installation numbers by state
Source: Clean Energy Regulator (adjusted data), Energy Council’s analysis, March 2017
25
.0%
28
.6%
28
.8%
32
.2%
16
.6%
18
.8%
24
.0%
26
.2%
0%
10%
20%
30%
40%
50%
60%
70%
80%
90%
100%
Mar
Ap
r
May Jun
Jul
Au
g
Sep
Oct
No
v
Dec
Jan
-16
Feb
Mar
Ap
r
May Jun
Jul
Au
g
Sep
Oct
No
v
Dec
Jan
-17
Feb
WA
VIC
TAS
SA
QLD
NSW

5
5
Figure 3: Proportion of monthly installed solar PV capacity by state
Note: The Northern Territory and the ACT have been excluded, due to their small population size.
Source: Clean Energy Regulator (adjusted data), Energy Council’s analysis, March 2017
28
.42
%
28
.67
%
27
.36
%
27
.03
%
30
.40
%
26
.88
%
27
.89
%
25
.87
%
25
.93
%
25
.86
%
26
.80
%
25
.58
%
25
.06
%
24
.80
%
25
.09
%
26
.52
%
26
.34
%
27
.67
%
26
.86
%
28
.05
%
29
.42
%
30
.01
%
30
.32
%
33
.92
%
11
.16
%
12
.68
%
13
.65
%
13
.30
%
13
.40
%
14
.38
%
13
.60
%
15
.46
%
15
.35
%
15
.59
%
18
.77
%
16
.04
%
16
.95
%
17
.23
%
17
.20
%
17
.41
%
17
.17
%
16
.96
%
18
.61
%
18
.26
%
17
.81
%
17
.51
%
23
.83
%
25
.40
%
0%
10%
20%
30%
40%
50%
60%
70%
80%
90%
100%M
ar
Ap
r
May Jun
Jul
Au
g
Sep
Oct
No
v
Dec
Jan
20
16
Feb
Mar
Ap
r
May Jun
Jul
Au
g
Sep
Oct
No
v
Dec
Jan
20
17
Feb
WA
VIC
TAS
SA
QLD
NSW

6
6
LOWER INSTALLATION NUMBERS, BIGGER SYSTEM SCALE
Since the announcement of the closure of the Hazelwood power station closure in November last year, there has been a rise in electricity prices. This coincides with an increase in the number of rooftop solar PV systems installed, having peaked in December 2016 following the drop in December 2014 (see figure 1). Although there is a downward trend for solar PV systems installations, the average capacity of units is trending upward. To better understand the adoption pattern of different unit sizes, figure 4 shows the number of solar PV installations at varying system size ranges.
Grouping the installed panels into different size ranges in each calendar month reveals a clear trend towards the installation of larger systems. The early adoption of small solar panels of less than 2.5 kW was the greatest in June 2011, accounting for 68.3 per cent of total installations for the month. It was stated that up until mid-2012, the most popular solar system size sold in Australia was the 1.5 kW system. The reason being is that the solar rebate at and before that time was generous, where a multiplier was placed on the number of small-scaled technology certificates that can be created for the first 1.5 kW of solar installedi.
Figure 4: Monthly installations by size category
Source: Australian PV Institute (APVI) Solar Map, 2016
The number of systems with less than 2.5 kW in capacity has been declining, having been replaced by bigger systems (up to 4.5 kW) from early 2013. The percentage of larger solar PV systems installed has continued to grow (see table 1). The average installed system size is currently between 4.5 to 6.5 kW, and these represent 43.8 per cent of total installations. The number of systems with

7
7
a capacity of less than 2.5 kW has dropped significantly and accounted for around 12.2 per cent of total installations at June 2016, equivalent to the total number of installed system units s greater than 6.5 kW in size.
Table 1: The percentage of number of installations of different unit size in June since 2011 <2.5kW 2.5-4.5 kW 4.5-6.5 kW 6.5-9.5 kW 9.5-14 kW 14-25 kW 25+ kW
Jun-11 68.3% 24.3% 5.9% 0.4% 0.8% 0.2% 0.1%
Jun-12 46.4% 33.8% 17.9% 0.8% 0.8% 0.2% 0.1%
Jun-13 22.6% 33.6% 39.5% 1.6% 1.5% 0.6% 0.5%
Jun-14 20.1% 36.8% 37.4% 1.9% 1.7% 0.9% 1.1%
Jun-15 15.7% 34.3% 40.9% 3.3% 2.5% 1.7% 1.6%
Jun-16 12.2% 31.7% 43.8% 4.9% 3.3% 2.0% 2.0%
Source: Australian PV Institute (APVI) Solar Map, Australian Energy Council analysis, 2016
What are the causes?
Australia has continued to experience higher household power bills (figure 5) over the past decade. With the retirement of the Hazelwood power station in Victoria wholesale electricity costs have risen, so energy cost pressures will continue. At the same time, we have seen increased supply reliability issues in some parts of the NEM.
Figure 5: Household energy price index
Source: Australian Bureau of Statistics (2016) Consumer Price Index, Australia, June 2016ii
The Australian Energy Market Commission’s most recent annual Residual Electricity Price Trends report also states that the annual electricity bill will increase in the majority of states, except Queensland. This was attributed largely to increases in the competitive market component of electricity pricesiii. Victoria and South Australia are expected to experience the greatest rise in electricity prices, with the expectation that there will be a further jump in their electricity bills in 2017/18. Consequently, consumers are likely to seek to better manage their power bills which will
50
100
150
200
250
300
350
400
Ind
ex J
un
19
90
=1
00
Electricity Gas

8
8
help continue to drive interest in solar (as well as battery storage in future). As mentioned above we have already seen South Australia and Victoria installing more solar PV systems.
Figure 6: Annual electricity bill trend for a representative consumer across jurisdiction
Source: 2016 Electricity Price Trends, Australian Energy Market Commission, 2016
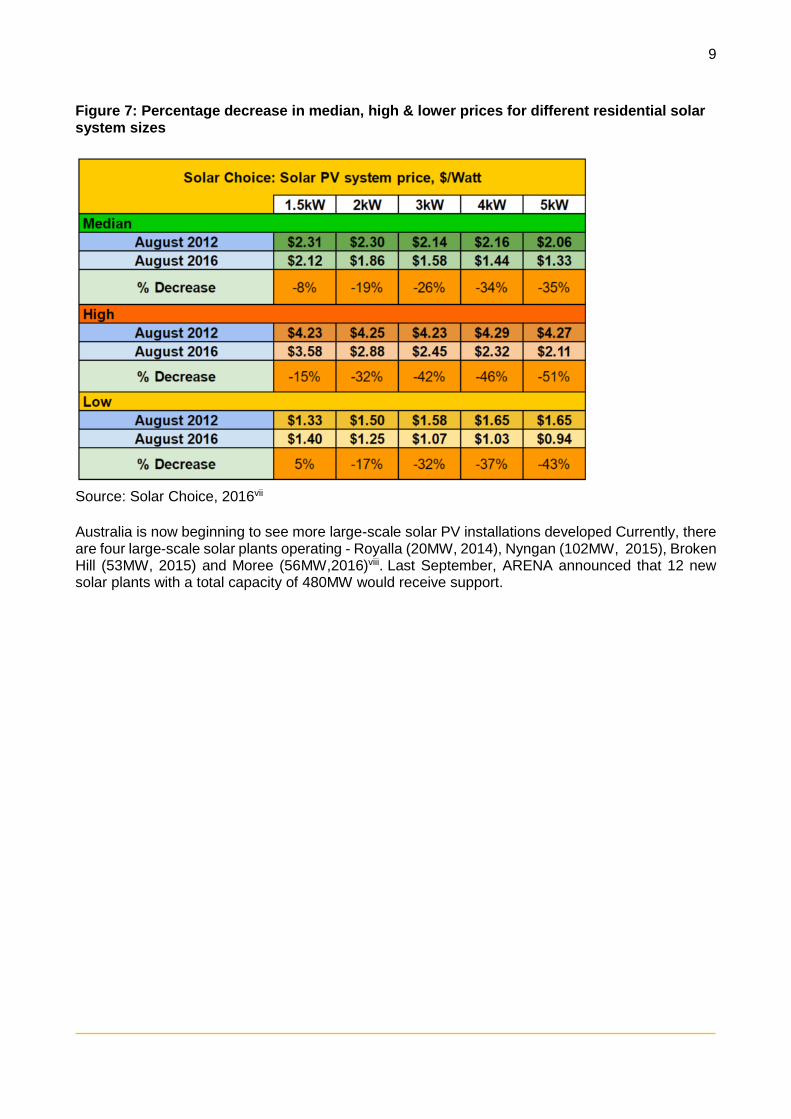
Another reason for the increase in solar PV installations is the drop in the cost of solar technologies. Interestingly, SolarChoice has noted that while the average price drop for 1.5 kW systems between August 2012 and 2016 – was about 8 per cent, while the average reduction in price for 4 kW and 5 kW systems was nearly 35 per cent. High-end prices for these systems dropped by nearly half between 2012 and 2016. A 1.5 kW system produces about 6 kWh (units) of electricity per day. The capacity generated wouldn’t be enough to fully offset daytime household energy usage. Consistent with the fact that a 1.5 kW system would not have a major impact on reducing a household’s electricity bill, and the drop in the cost of larger systems we have seen larger unit sizes being installed. A 3kW solar size, however, would be slightly too large if a house is not occupied during the day and might export nearly 50 per cent of the energy produced on average, according to Solar Choiceiv. Improvements in battery storage means it is increasingly something that householders may consider either to go off grid or to store solar energy for their own night-time usage. Declining battery costs and high power prices will help drive uptake of this technology. Battery costs are expected to fall by 40 to 60 per cent by 2020 and there is projected to be around 1.1 million homes connecting battery storage to their solar systems by 2035, according to the Australian Energy Market Operator’s forecastvvi.
9
9
Figure 7: Percentage decrease in median, high & lower prices for different residential solar system sizes
Source: Solar Choice, 2016vii
Australia is now beginning to see more large-scale solar PV installations developed Currently, there are four large-scale solar plants operating - Royalla (20MW, 2014), Nyngan (102MW, 2015), Broken Hill (53MW, 2015) and Moree (56MW,2016)viii. Last September, ARENA announced that 12 new solar plants with a total capacity of 480MW would receive support.

10
10
ESTIMATED RESIDENTIAL PV GENERATION
Figure 8 shows the estimated total output of solar systems in each jurisdiction since July 2012. The
PV output is obtained by multiplying the efficiency factor of systems with the estimated MW
capacity in each state (as described in Section 2 of this report).
Figure 8: Estimated residential PV generation (GWh)
Source: Australian Energy Council analysis, 2017
The efficiency factor is calculated from PVoutput where self-selecting solar systems enter data into
a database. Due to self-selection, the estimate may have an upward bias as self-selecting clients
are more likely to maintain solar systems and therefore have a higher efficiency factor. Sample sizes
for the Northern Territory and Tasmania are very small. The CER data may not accurately capture
the rooftop PV generating capacity due to systems that have failed, and are no longer generating,
or systems that have been upgraded but have not been notified to CER. All systems which are
reported to the CER are assumed to be residential.
Figure 8 shows an increasing seasonal pattern, where PV generation is low during May to July, while
generation reaches top during summer of each year. December is the month where has been
consistently the highest in terms of PV generation.
0
100
200
300
400
500
600
700
800
900
1,000
Au
g-1
2
No
v-1
2
Feb
-13
May
-13
Au
g-1
3
No
v-1
3
Feb
-14
May
-14
Au
g-1
4
No
v-1
4
Feb
-15
May
-15
Au
g-1
5
No
v-1
5
Feb
-16
May
-16
Au
g-1
6
No
v-1
6
Feb
-17
GW
h
NT
TAS
WA
VIC
SA
QLD
NSW & ACT

11
11
LEVELISED COST OF ENERGY The LCOE is the cost of energy per kWh produced. When this is equal to or below the cost
consumers pay directly to suppliers for electricity, this is called grid parity. We have calculated the
LCOE for solar in Australia’s major cities and below to indicative retail prices and current FiT rates.
The detailed methodology can be found in the Appendix.
The retail comparison rates are representative variable rates and do not include supply charges. For
all capital cities, excluding Perth and Hobart, retail prices are based on the implied usage charges
from St Vincent de Paul’s tracking of market offers, which is released on a bi-annual basis. Perth prices are
regulated and obtained from Synergy. Hobart prices were obtained from Aurora Energy’s Tariff 31,
while Darwin prices are obtained from Jacana Energy’s regulated residential usage charges. Tables
2, 3 and 4 show the LCOE at across major cities at different discount rates.
It is a great news for Victoria that householders will benefit a steep increase in solar FiT from around
5c/kWh to a minimum of 11.3c/kWh for their exports back to the grid.
Table 2: Central estimate: 6.78 per cent discount rate (ten-year average mortgage rate)
System Size Retail prices FIT
All figures in c/KWh 1.5 2 3 4 5 10
Adelaide $0.18 $0.15 $0.14 $0.13 $0.13 $0.12 $0.40 $0.05
Brisbane $0.16 $0.15 $0.13 $0.12 $0.12 $0.12 $0.31 $0.06
Canberra $0.22 $0.19 $0.16 $0.15 $0.14 $0.84 $0.18 $0.08
Darwin $0.30 $0.25 $0.21 $0.19 $0.19 $0.17 $0.26 $0.19
Hobart $0.23 $0.21 $0.19 $0.18 $0.16 $0.16 $0.25 $0.06
Melbourne $0.22 $0.19 $0.16 $0.15 $0.14 $0.14 $0.24 $0.11
Sydney $0.17 $0.16 $0.14 $0.13 $0.12 $0.13 $0.27 $0.06
Perth $0.13 $0.12 $0.11 $0.10 $0.10 $0.11 $0.26 $0.07
Source: Australian Energy Council analysis, 2017
12
12
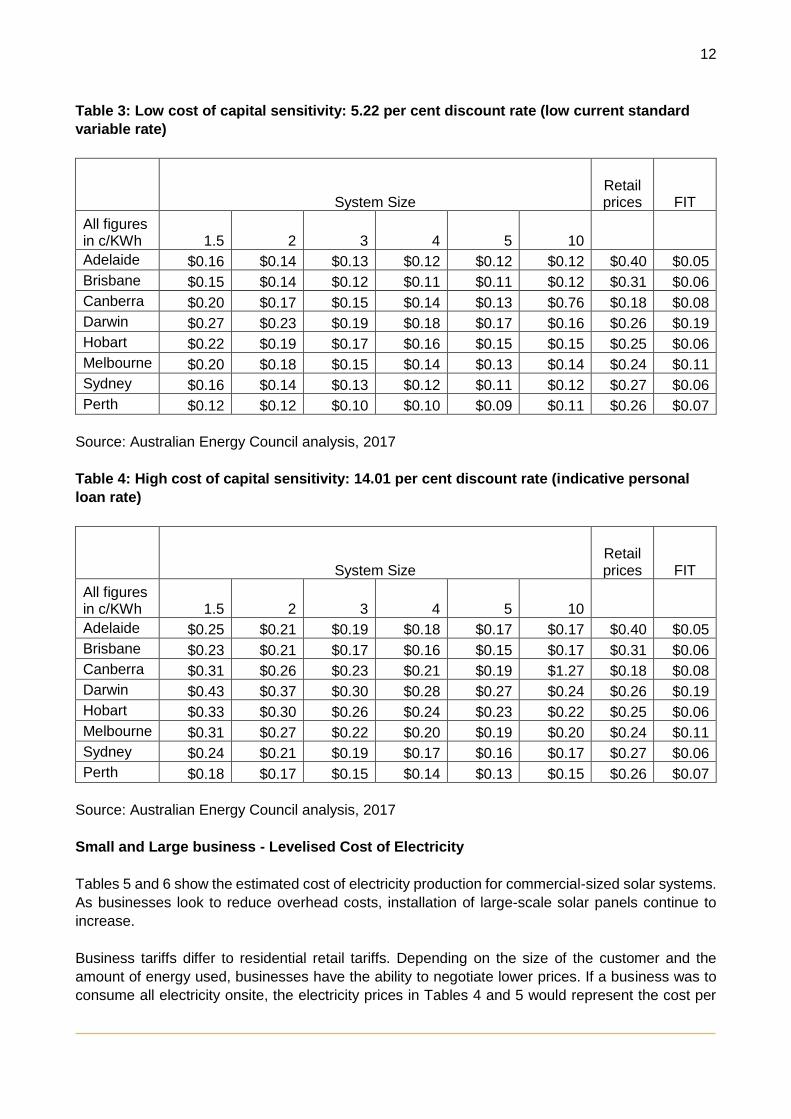
Table 3: Low cost of capital sensitivity: 5.22 per cent discount rate (low current standard
variable rate)
System Size Retail prices FIT
All figures in c/KWh 1.5 2 3 4 5 10
Adelaide $0.16 $0.14 $0.13 $0.12 $0.12 $0.12 $0.40 $0.05
Brisbane $0.15 $0.14 $0.12 $0.11 $0.11 $0.12 $0.31 $0.06
Canberra $0.20 $0.17 $0.15 $0.14 $0.13 $0.76 $0.18 $0.08
Darwin $0.27 $0.23 $0.19 $0.18 $0.17 $0.16 $0.26 $0.19
Hobart $0.22 $0.19 $0.17 $0.16 $0.15 $0.15 $0.25 $0.06
Melbourne $0.20 $0.18 $0.15 $0.14 $0.13 $0.14 $0.24 $0.11
Sydney $0.16 $0.14 $0.13 $0.12 $0.11 $0.12 $0.27 $0.06
Perth $0.12 $0.12 $0.10 $0.10 $0.09 $0.11 $0.26 $0.07
Source: Australian Energy Council analysis, 2017
Table 4: High cost of capital sensitivity: 14.01 per cent discount rate (indicative personal
loan rate)
System Size Retail prices FIT
All figures in c/KWh 1.5 2 3 4 5 10
Adelaide $0.25 $0.21 $0.19 $0.18 $0.17 $0.17 $0.40 $0.05
Brisbane $0.23 $0.21 $0.17 $0.16 $0.15 $0.17 $0.31 $0.06
Canberra $0.31 $0.26 $0.23 $0.21 $0.19 $1.27 $0.18 $0.08
Darwin $0.43 $0.37 $0.30 $0.28 $0.27 $0.24 $0.26 $0.19
Hobart $0.33 $0.30 $0.26 $0.24 $0.23 $0.22 $0.25 $0.06
Melbourne $0.31 $0.27 $0.22 $0.20 $0.19 $0.20 $0.24 $0.11
Sydney $0.24 $0.21 $0.19 $0.17 $0.16 $0.17 $0.27 $0.06
Perth $0.18 $0.17 $0.15 $0.14 $0.13 $0.15 $0.26 $0.07
Source: Australian Energy Council analysis, 2017
Small and Large business - Levelised Cost of Electricity
Tables 5 and 6 show the estimated cost of electricity production for commercial-sized solar systems.
As businesses look to reduce overhead costs, installation of large-scale solar panels continue to
increase.
Business tariffs differ to residential retail tariffs. Depending on the size of the customer and the
amount of energy used, businesses have the ability to negotiate lower prices. If a business was to
consume all electricity onsite, the electricity prices in Tables 4 and 5 would represent the cost per

13
13
kWh of consumption from the energy generated from the different system sizes listed. For
businesses, installation occurs if the benefits of installation outweigh the cost. The average electricity
bill for industrial businesses in 2014-15 was 10.72 c/kWhix.
The CER sets out guidelines for the redemption of small-scale certificates. There are two criteria
which can exclude a system from receiving STCs: systems cannot exceed 100 kW in capacity or
generate more than 250 MWh per yearx.
Table 5: Central estimate: 7.54 per cent discount rate, ten-year average small business
interest rate
System Size
All figures in c/KWh 10 30 50 100
Adelaide $0.13 $0.12 $0.19 $0.11
Brisbane $0.13 $0.12 $0.12 $0.12
Canberra $0.12 $0.12 $0.11 $0.11
Melbourne $0.15 $0.14 $0.14 $0.14
Sydney $0.13 $0.13 $0.13 $0.13
Perth $0.11 $0.11 $0.12 $0.11
Source: Australian Energy Council analysis, 2017
Table 6: Central estimate: 5.57 per cent discount rate, ten-year average large business
interest rate
System Size
All figures in c/KWh 10 30 50 100
Adelaide $0.12 $0.11 $0.17 $0.11
Brisbane $0.12 $0.11 $0.11 $0.11
Canberra $0.11 $0.11 $0.11 $0.10
Melbourne $0.14 $0.13 $0.13 $0.13
Sydney $0.12 $0.12 $0.12 $0.12
Perth $0.10 $0.10 $0.11 $0.11
Source: Australian Energy Council analysis, 2017
14
14
PAYBACK PERIOD, DETAILED MODEL
Using a similar methodology to that used to calculate the LCOE of solar PV in Australia (see Section
4), the Australian Energy Council has calculated the payback period for residential solar PV systems.
The payback period is defined as the year when the cumulative savings are greater than the
cumulative costs of a solar PV system. Savings represent the avoided cost of consumption and any
revenue received from FiTs. The cumulative cost incurred represents the initial investment and the
time value of money. A detailed methodology is contained at Appendix 2. Since Darwin has the
highest FiT in Australia (see tables 2, 3, 4), it leads to a quicker payback period for larger systems
due to assumed increases in exports to the grid.
Figure 9 highlights the payback period for different system sizes across Australia. Note that electricity
prices are increased at CPI levels and if these prices rise above or below CPI, this will change the
payback period.
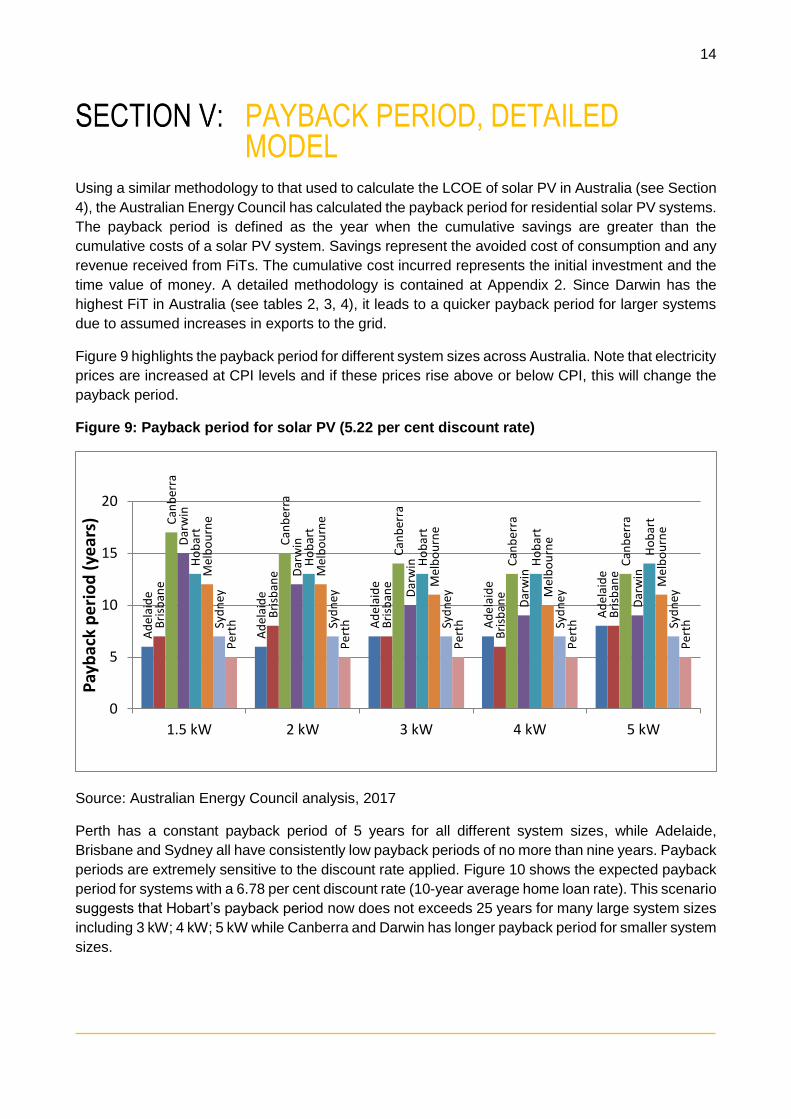
Figure 9: Payback period for solar PV (5.22 per cent discount rate)
Source: Australian Energy Council analysis, 2017
Perth has a constant payback period of 5 years for all different system sizes, while Adelaide,
Brisbane and Sydney all have consistently low payback periods of no more than nine years. Payback
periods are extremely sensitive to the discount rate applied. Figure 10 shows the expected payback
period for systems with a 6.78 per cent discount rate (10-year average home loan rate). This scenario
suggests that Hobart’s payback period now does not exceeds 25 years for many large system sizes
including 3 kW; 4 kW; 5 kW while Canberra and Darwin has longer payback period for smaller system
sizes.
Ad
elai
de
Ad
elai
de
Ad
elai
de
Ad
elai
de
Ad
elai
de
Bri
sban
e
Bri
sban
e
Bri
sban
e
Bri
sban
e
Bri
sban
e
Can
ber
ra
Can
ber
ra
Can
ber
ra
Can
ber
ra
Can
ber
ra
Dar
win
Dar
win
Dar
win
Dar
win
Dar
win
Ho
bar
t
Ho
bar
t
Ho
bar
t
Ho
bar
t
Ho
bar
t
Mel
bo
urn
e
Mel
bo
urn
e
Mel
bo
urn
e
Mel
bo
urn
e
Mel
bo
urn
e
Syd
ney
Syd
ney
Syd
ney
Syd
ney
Syd
ney
Per
th
Per
th
Per
th
Per
th
Per
th
0
5
10
15
20
1.5 kW 2 kW 3 kW 4 kW 5 kW
Pay
bac
k p
eri
od
(ye
ars)
15
15
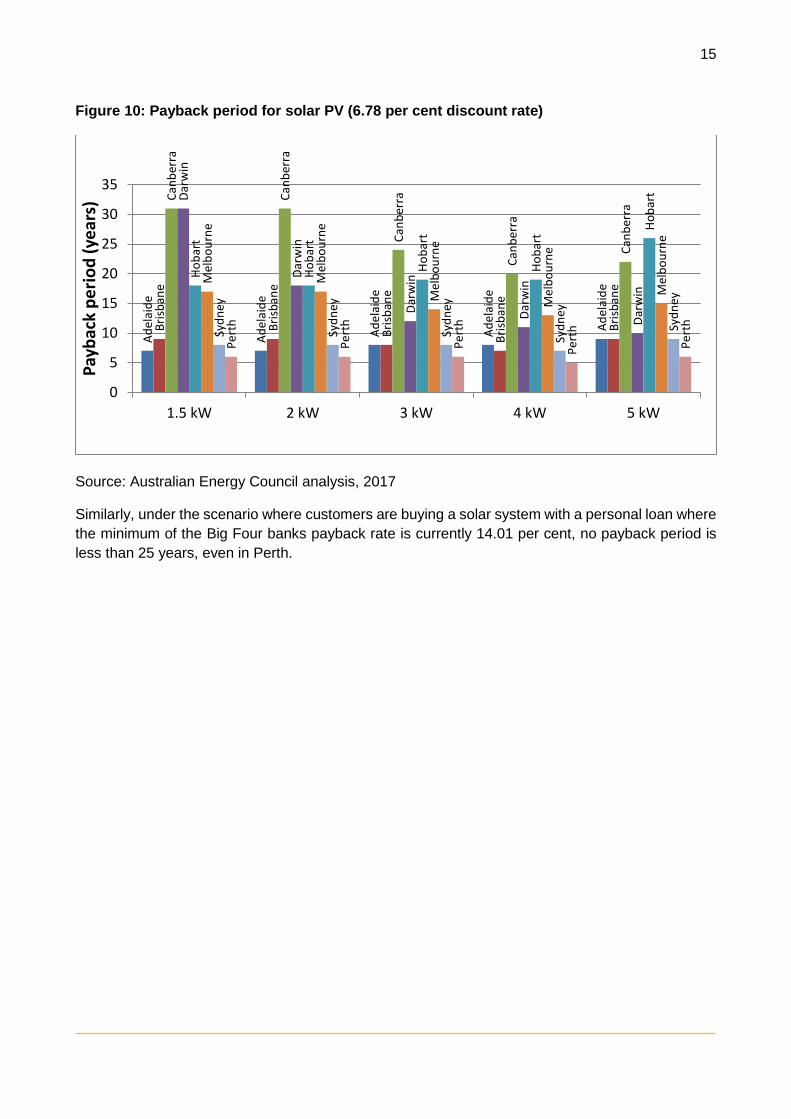
Figure 10: Payback period for solar PV (6.78 per cent discount rate)
Source: Australian Energy Council analysis, 2017
Similarly, under the scenario where customers are buying a solar system with a personal loan where
the minimum of the Big Four banks payback rate is currently 14.01 per cent, no payback period is
less than 25 years, even in Perth.
Ad
elai
de
Ad
elai
de
Ad
elai
de
Ad
elai
de
Ad
elai
de
Bri
sban
e
Bri
sban
e
Bri
sban
e
Bri
sban
e
Bri
sban
e
Can
ber
ra
Can
ber
ra
Can
ber
ra
Can
ber
ra
Can
ber
ra
Dar
win
Dar
win
Dar
win
Dar
win
Dar
win
Ho
bar
t
Ho
bar
t
Ho
bar
t
Ho
bar
t
Ho
bar
t
Mel
bo
urn
e
Mel
bo
urn
e
Mel
bo
urn
e
Mel
bo
urn
e
Mel
bo
urn
e
Syd
ney
Syd
ney
Syd
ney
Syd
ney
Syd
ney
Per
th
Per
th
Per
th
Per
th
Per
th
0
5
10
15
20
25
30
35
1.5 kW 2 kW 3 kW 4 kW 5 kW
Pay
bac
k p
eri
od
(ye
ars)

16
16
SOLAR NEWS ROUND UP
More than 50,000 solar storage systems are installed in Germany
Currently, there are approximately 52,000 operational storage systems, with around 20,000 installed
last year. The equivalent total output of those 52,000 systems is about 300 MWh. The German solar
association, Bundesverbands Solarwirtschaft, expects there number will double to 100,000 systems
installed in 2018.
Source: PV-magazine, March 2017
Solar monitoring awarded $2.1m from ARENA
The Solar Command App, which is described as smart solar monitoring technology, can track the
performance of residential solar systems, identify and report any faults and inefficiencies. This will
help ensure the performance of solar systems and has received grant funding support from the
Australian Renewable Energy Agency.
Source: PV-magazine, March 2017
Solar tariff increase more than double for Victorian households
Victorian solar households are set to receive a minimum feed-in tariff rate of 11.3 c/kWh for exporting
electricity to the grid. The rise, which takes effect from 1 July 2017, based on the increase in
wholesale electricity prices as well as payment for the environmental and social value of the power
produced.
Source: Premier of Victoria, February 2017

17
17
METHODOLOGY APPENDIX
1. Solar installations methodology
Analysis from the Clean Energy Regulator’s (CER) monthly released data allows us to estimate the
amount of solar PV installed in Australia. Since November 2015, the CER has consistently
released data dated as at the 1st of each month. The new consistent release date allows us to
provide a more accurate estimate of the capacity of recent installations. Due to the lag in reporting
of new installations, the CER data takes up to 12 months to be finalised.
2. Levelised Cost of Electricity Methodology
Introduction
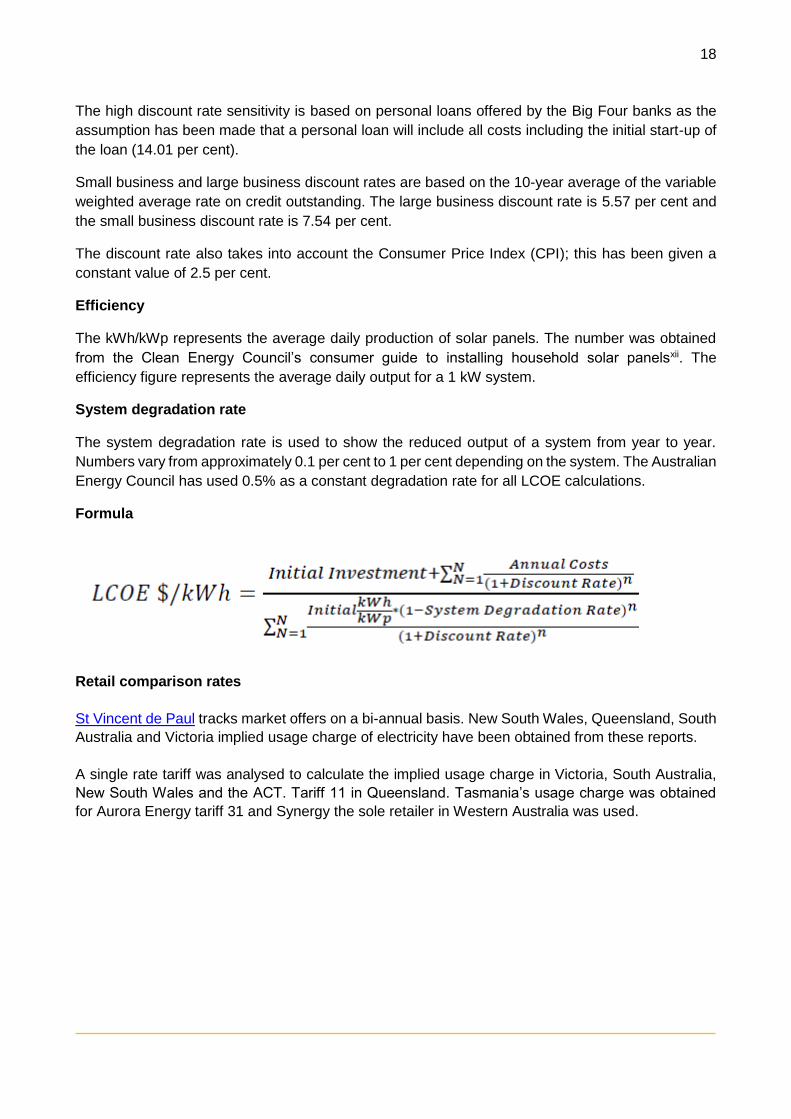
The methodology outlines our approach in calculating the Levelised Cost of Electricity (LCOE) for
solar panels installed across capital cities in Australia. Our analysis includes the following:
Initial investment
Annual costs
Discount rate
Efficiency
System degradation rate
Initial investment
The initial investment plays a major role in the LCOE calculations. The initial investment represents
the cost of buying and installing solar panels all values are inclusive of Federal small-scale
technology certificate (STC) discounts.
The initial investments in this report are obtained from the Solar Choice website. Solar Choice takes
prices from over 125 installers across Australia and updates pricing data monthly.
Annual costs
We have estimated the annual cost to clean a solar panel at $12.50xi, and the average sized solar
panel in our calculations to be 200W.
Discount rate
The discount rate represents the risk nature of the consumer. For this exercise, three different
discount rates have been used and will be updated each quarter. The central estimate is based on
the 10-year average home loan, as presented by the Reserve Bank of Australia (6.78 per cent).
The low discount rate sensitivity is based on the minimum variable home loan mortgage rate offered
by the Big Four banks (currently 5.22 per cent).
18
18
The high discount rate sensitivity is based on personal loans offered by the Big Four banks as the
assumption has been made that a personal loan will include all costs including the initial start-up of
the loan (14.01 per cent).
Small business and large business discount rates are based on the 10-year average of the variable
weighted average rate on credit outstanding. The large business discount rate is 5.57 per cent and
the small business discount rate is 7.54 per cent.
The discount rate also takes into account the Consumer Price Index (CPI); this has been given a
constant value of 2.5 per cent.
Efficiency
The kWh/kWp represents the average daily production of solar panels. The number was obtained
from the Clean Energy Council’s consumer guide to installing household solar panelsxii. The
efficiency figure represents the average daily output for a 1 kW system.
System degradation rate
The system degradation rate is used to show the reduced output of a system from year to year.
Numbers vary from approximately 0.1 per cent to 1 per cent depending on the system. The Australian
Energy Council has used 0.5% as a constant degradation rate for all LCOE calculations.
Formula
Retail comparison rates
St Vincent de Paul tracks market offers on a bi-annual basis. New South Wales, Queensland, South
Australia and Victoria implied usage charge of electricity have been obtained from these reports.
A single rate tariff was analysed to calculate the implied usage charge in Victoria, South Australia,
New South Wales and the ACT. Tariff 11 in Queensland. Tasmania’s usage charge was obtained
for Aurora Energy tariff 31 and Synergy the sole retailer in Western Australia was used.

19
19
3. Payback period methodology
This methodology outlines our approach in calculating the payback period for solar panels installed
across capital cities in Australia. Our analysis includes the following:
Initial investment
Discount rate
Efficiency
System degradation rate
Export rate
Avoided usage cost
FiT
Initial investment, discount rate, efficiency and system degradation rate are described in appendix
1. Key difference to LCOE calculation is the payback period assumes no annual maintenance cost.
Calculation
Payback period occurs when ∑ savings > ∑ cost
Where:
Savings = (usage cost x (1+ CPI)t x consumption / 100) + (Export x FiT)
Cost = investment x (1 + real discount rate)t
t = years
Avoided cost and FiT
The onsite consumption is multiplied by the retailer’s usage charges, CPI has been applied to the
usage charge to allow for growth in retail prices. The excess energy is exported to the grid and the
customer is expected to receive the mandatory FiT or a realistic market offer where mandatory
tariffs are not applicable.
Export rate
The percentage of onsite consumption and electricity which is exported to the grid is calculated
using the median value from Sunwiz’s analysisxiii. See Figure 6 below.

20
20
Figure 6: Export rate of residential solar PV at different system sizes
Source: Sunwiz analysis, 2015
i Green Energy Option, “Solar Rebates”, http://www.greenenergyoptions.com.au/solar-rebates1/
ii Office of Chief Economist, “2016 Electricity Price Trends Report”, https://industry.gov.au/Office-of-the-Chief-Economist/Publications/Documents/aes/2016-australian-energy-statistics.pdf
iii Australia Energy Market Commission, “2016 Residentual Electricity Price Trends Report”, http://www.aemc.gov.au/Markets-Reviews-Advice/2016-Residential-Electricity-Price-Trends/Final/AEMC-Documents/2016-Electricity-Price-Trends-Report, page xv iv Solar Choice, “What size solar power installation should you buy?”,https://www.solarchoice.net.au/blog/what-size-solar-power-installation-should-you-buy/
v Energy Storage Study, 2015, p.10
vi Finkel Independent Review into the Future Security of the National Electricity Market, 2016, p.14
vii Solar Choice, “Four years tracking residential solar system prices”, https://www.solarchoice.net.au/blog/news/four-years-tracking-residential-solar-system-prices-160816 viii Electricity Gas Australia 2016, 2016 ix BCA, “Impact of Green Energy Policies on Electricity Prices”, June 2014

21
21
x Clean Energy Regulator, “How to have STCs assigned to you as a Registered Agent”, http://ret.cleanenergyregulator.gov.au/For-Industry/Agents/Having-STCs-assigned-to-you/stcs-assigned-to-you xi estimate based on, RenewEconomy, 26 August 2013, http://reneweconomy.com.au/2013/hidden-cost-of-rooftop-solar-who-should-pay-for-maintenance-99200 xii Clean Energy Council, http://www.solaraccreditation.com.au/dam/cec-solar-accreditation-shared/guides/Guide-to-installing-solar-PV-for-households.pdf xiii Sunwiz, Solar Pays Its Way on Networks. Last accessed 17 June 2015.