Embed Size (px)
Citation preview

SOLAR SOLUTIONS FOR UNIVERSIT IES | WHITE PAPER
W H I T E PA P E R
S O L A R S O L U T I O N S F O R U N I V E R S I T I E S
The design decisions behind the Maharishi University of Management Solar Power Plant
By Eric Johnson, Amy Van Beek, and Aurelien Windenberger
Funding through Iowa Economic Development Authority & Fairfield Economic Development AssociationThe Fairfield Energy Storage and Demonstration Project | A Research and Technology Impact Study
D E C E M B E R 2 0 1 8

SOLAR SOLUTIONS FOR UNIVERSIT IES | WHITE PAPER 1
C O N T E N T S
Executive Summary....................................................................3
System Overview........................................................................3
Active Tracking..............................................................4
Battery Energy Storage.................................................4
Communications & Control............................................4
Specifications.................................................................5
Design and Construction..........................................................5
Characteristics of a University Load Profile...........................7
How Active Tracking Works.....................................................8
Weather Stations...........................................................9
Active Tracking vs Fixed-Tilt.................................................10
Managing Overproduction with Active Tracking................11
Interconnect.................................................................11
Curtailment..................................................................11
Avoiding Overproduction...........................................11
Battery Energy Storage System.............................................12
Vanadium Flow Batteries............................................12
Peak Shaving with Battery Energy Storage Systems...........13
Ratchet Period..............................................................14
Projections...............................................................................14
Lessons Learned......................................................................15
The Unique Challenges of Universities..........................15
Overproduction............................................................15
Active Tracking & Battery Energy Storage................15

SOLAR SOLUTIONS FOR UNIVERSIT IES | WHITE PAPER
E X E C U T I V E S U M M A RY
In this white paper we explore how Ideal Energy, Inc. and Maharishi University of Management implemented a solar and battery energy storage system – called the MUM Solar Power Plant – to maximize the renewable energy share that could be economically delivered to the University.
In particular, we discuss the decision-making process that led to the final design: a 1.1 megawatt (MW) solar field using active tracking technology paired with a 1.05 megawatt-hour (MWh) vanadium flow battery energy storage system. We also model the solar project’s output.
The University’s new solar + storage system, along with a two smaller preexisting solar arrays and a small wind turbine, bring the University’s renewable energy share to approximately 43% while reducing its electric utility costs by a projected 30%. We conclude with lessons learned that may be applicable to other universities seeking similar results.
S Y S T E M OV E RV I E W
Maharishi University of Management undertook this solar plus storage project with two objectives: to achieve the University’s renewable energy share goals, and to significantly lower the University’s overall electricity costs, via both energy usage reductions and peak demand shaving.
Achieving a high renewable energy share (RES) was particularly important to the University. MUM has a strong commitment to sustainability, expressed both by its academic mission and its campus sustainability goals. Sustainability goals include sourcing organic food, building LEED-certified structures, and procuring at least 40% of electricity production needs from renewable resources. In addition, the University developed the first Sustainable Living degree in the nation close to 15 years ago.
MUM previously installed two solar arrays – a 12.5 kilowatt (kW) array mounted on the roof of the Sustainable Living Center and a 42 kW ground-mounted array. The University also has a 10 kW Bergey XL 10 wind turbine on campus.
To meet its ambitious renewable energy goals the University needed a substantially larger array. The University purchased a tract of land west of the main campus with the intent of building a renewable energy generation facility.
Ideal Energy, Inc., one of the Midwest’s premier solar energy companies, designed and built the five acre array. Ideal Energy, which was founded by MUM alumnus Troy Van Beek, installed both of the University’s other solar arrays as well as the wind turbine. Ideal Energy brings extensive experience with solar plus battery energy storage installations.
The cutting edge design incorporates both single axis active tracking and battery energy storage. This is the first system of its kind in the Midwest and among the most technologically advanced solar installations in the United States.
3

SOLAR SOLUTIONS FOR UNIVERSIT IES | WHITE PAPER
MUM SOLAR POWER PLANTMACRO - S ITE AXON
SOLAR ARRAY
42kW INSTALLATION
ARGIRO CENTER
SUSTAINABLE L IVING CENTER12.5kW INSTALLATION
CAMPUS DORMITORIES
GENERATOR BUILDING[ SUBSTATION ]
Figure 1. The MUM Solar Power Plant in context with MUM campus.
AC T I V E T R AC K I N G
Active tracking can produce up to 15-20% more power than a fixed-tilt array of comparable size. NX Flow,™ the integrated solar plus storage system by NEXTracker used in the MUM Solar Power Plant, allows each row to operate independently. This allows the system to optimize solar production, and to continue functioning at close to full capacity even if one of the motors goes down.
BAT T E RY E N E R G Y S TO R AG E
Battery energy storage works in tandem with solar energy to reduce MUM’s energy costs by ‘peak shaving’ – drawing power from the solar panels or batteries instead of from the grid during peak times of day and year when energy costs are highest. The NX Flow vanadium flow
batteries used in the project are ideal for large scale peak shaving. The energy storage capacity and performance of vanadium flow batteries does not degrade over time. They can be fully discharged without damage. Because they are mostly filled with water, they are extremely safe.
C O M M U N I C AT I O N S & C O N T R O L
The MUM Solar Power Plant uses an intelligent tracker control system that links dozens of data collection sensors and four weather stations with central tracker and battery energy management systems. A predictive algorithm integrates data from multiple sources to optimize the performance of each row. This makes the MUM Solar Power Plant one of the most advanced solar arrays in the nation.
4

SOLAR SOLUTIONS FOR UNIVERSIT IES | WHITE PAPER
D E S I G N A N DC O N S T RU C T I O N
Construction of an active tracking solar array is more involved than construction of a fixed-tilt array. Site preparation has to be more precise and racking and mounting hardware have to be more durable to handle the stresses involved in an array that is in nearly constant motion.
Preparation included making a topographical map, conducting a site survey, and grading the site. A geotechnical test had to be performed prior to driving the foundation piers. Because of the topography of the site the solar field was constructed in two sections: a standard slope section and a high slope section. The standard slope section has a slope tolerance of up to 5%, and the high slope section has a slope tolerance of between 6% and 15%.
Most fixed-tilt, ground-mounted solar arrays are constructed using regular nuts and bolts. Unlike those systems, active tracking systems are subject to more stress because they are in motion most of the day. To prevent the array from shaking loose over time, NEXTracker specifies
the use of permanent rivets and swaged lockbolts. The foundation piers and the brackets that hold the solar PV modules were riveted to the central torque tubes with a pneumatic riveting gun. Swaged lockbolts were also used. After the fasteners were swaged or riveted into place, a cold galvanizing spray was applied. The result is a permanently constructed array that can tolerate the constant motion of an active tracking array and that does not need periodic retightening. Permanent fasteners also mitigate maintenance, which is an important concern with solar arrays of this size
The solar field has 35 rows. Each row is about 310 feet long. There are 90 REC 350 watt solar photovoltaic (PV) modules, one Ideal Power 30C3 inverter, and one NX Flow battery per row. Twelve foundation piers hold up the central torque tube. A thirteenth pier in the middle of each row holds a motor that rotates all of the panels on that row. Each motor is controlled by a self-powered controller (SPC) that communicates wirelessly with the other SPCs as well as with several network control units (NCUs).
S P E C I F I C AT I O N S
Array Size: 1.1 megawatt (MW) array covering 5 acresActive Tracking System: NEXTracker NX HorizonSolar Array Nameplate Rating: 1,102 kW
DC / 1,050 kW
AC
Photovoltaic Modules: 3,150 REC 350 photovoltaic panelsBatteries: 35 NX Flow vanadium flow batteries (DC coupled)Battery Storage Nameplate Rating: 350 kW
AC/1050 kWh
Inverters: 35 Ideal Power Stability Multiport Power Conversion Systems Communications: 35 self-powered controllers (SPCs), 4 network control units (NCUs), NX Data Hub and Geli Node Motors: 35 independent motors (1 per row)
5

SOLAR SOLUTIONS FOR UNIVERSIT IES | WHITE PAPER
MUM SOLAR POWER PLANTSITE AERIAL
SELF-TRACKING SOLAR ROWS
ELECTRICAL & COMMUNICATIONS HUB
BATTERIES & INVERTERS
STORM WEATHER STATION
STORM WEATHER STATIONWIND WEATHER STATION
WIND WEATHER STATION
SERVICE ROAD
Figure 2. Aerial view of MUM Solar Power Plant.
The batteries and inverters are positioned at the ends of the rows adjacent to an AC electrical service trench running along a service road. The batteries are DC coupled, meaning they can charge directly from the solar PV modules. DC power runs along each row from the modules to the inverter and then can either charge the battery without converting to AC, or be converted and sent out to the campus grid. The benefit of a DC coupled system is that the solar can charge the battery without the losses associated with converting to AC power, and it also reduces losses due to clipping.
The AC trench carries AC power running at 480 V to five 400 amp service panels. These service panels feed into one 1600 amp main panel. The main service panel is connected to a step-up transformer that increases the voltage to 4160 V. The transformer is in turn connected
to a transfer box connected to the 4.16 kV underground cable that runs 0.7 miles to the MUM campus switchgear adjacent to Alliant Energy’s existing 69/4.16 kV substation. This substation is where the grid interconnect is located.
The MUM Solar Power Plant uses inverters designed to protect the system in case of grid disturbances. In addition, an interconnection circuit breaker and interconnection relay were installed at the substation to provide anti-islanding protection. To prevent the MUM Solar Power Plant from back feeding power to the grid, Ideal Energy installed a reverse power relay that trips the interconnection breaker within two seconds if the substation breaker opens and power flows back to the utility. This relay will prevent all power flows back to the grid.
6

SOLAR SOLUTIONS FOR UNIVERSIT IES | WHITE PAPER
\\\\\\!l\11/J//IJ// ,,,,t'ot E.SS Iot,'11111
"q ······· '1 ',;, {t�..-�-icens��{� �§: 13692 :;;� t�·. John T. :!:/ft t ,l •• PCllMer : 'tl$ , •........... •·v
..,/t1,,11,,11l,�1t,,,,1,,,,,, ....
I hereby certify that this engineering document was
�
�"'" •ao•••ffi
�
�rl�" o, me nder y d;rect per
n
uperv; n and that I om a d IY, licens Pro�/ En n er er the laws of the Sta of lo . 7
�, 11/08/2018
j/'OHN T. PALMER, P.E. DATE License number 13692 My license renewal date is December 31, 2019
Pages or sheets covered by this seal: THIS SHEET
PV SYSTEM SUMMARY
As-Built Oneline Diagram Module Power 350wdc Total Number of Modules 3150 Total Number of Inverters 35 Total PV Power Rating 1.10 MWdc Total Inverter Capacity 1.05 MWac
Each of (35) inverters lands (5) strings of (18) modules in series. AC Isolation Switch
G·························· < IX 60A 480VI --+ I
1.
�
2.
9A 690V 10AWG PV Wire
3.
256A 480V 1278A 480V Line A,B,C 400kcmil
Line A B,C 600kcmil No Neutral 50AN 300kcmil EGC 3AWG � 4" PVC sch40 4" PVC sch40 50AI *x4 runs /phase I �
I 1 *same feeder to each 50A(\ I 350A
I 400A panelboard lugs � v-- 50A yI 350A I � (\
I v-- I 50A y 350A � (\ I v-- I 50A y ,,., IT\ I 350A I � ., I v-- 50A I
350A I � �� A 1600A v-- (\
I (\ � 15A V I y -<:t \ V -- � x5 400A feeder I
I ., \ ..,4. Main Breaker panels 6 I r, A Ground Fault I "" 1 I
I Protected I
I 4/0 Bare Ground Ring I 5. I
I 5/8"x8' rods I I Okogaurd URO-J Inverters 1-17 Inverters 18-28 Inverters 29-35
4/0 Bare Ground Ring 480V 36A 480V 36A 480V 36A 15kV Underground 5/8"x8' rods 6' spacing. Line A,B,C 6AWG Line A,B,C 2AWG AL Line A,B,C lAWG AL 4/0 AL w/concentric CU neutral 4kV 140A
� E]7kV TransformerEGC 8AWG EGC 4AWG AL EGC 4AWG AL 1 1/4" PVC sch 40 conduit 1 1/5" PVC sch 40 conduit 1 1/5" PVC sch 40 conduit
60A *expansion joint on inverter end only_� Comms Sheet 02
1. REC350TP2S72 Module 5. Eaton 1600A 480V Main Distribution Switchboard W/1600A Main Breaker Maharishi University of Management Ideal Energy DRAWN BY: 1000 N 4th St 602 N. 6th St. 2. Ideal Power 30kW Inverter 480V 36A Delta 6. Eaton 400A 480V Panelboard Main Luas Fairfield, IA Fairfield, IA 52556 Brian Robbins 3. Avalon Battery AFB2X 10.5kW 26.2kWh 600Vdc 52555 12/3/2018
4. Transformer 1.25MW WYE/WYE 4kV High 480V Low
MUM Drawing 01 SHEET 1 Figure 3. Wiring diagram.
C H A R AC T E R I S T I C S O F A U N I V E R S I T Y L OA D P RO F I L E
The University’s load profile is seasonal, with air conditioning dominating in the summer months.
Due to the high peak demand charges paid by the university, their facilities management office has managed their loads during the summer for many years to minimize peak demand. This managed summer peak demand is typically in the 1400 to 1600 kW range. Winter monthly peaks are significantly lower, usually in the 850 to 950 kW range, though they can be as low as 750 kW.
Ideal Energy gathered data on MUM campus load in 2016 and 2017. In 2016, the summer load peaked at approximately 1440 kW. The non-summer peak load was
approximately 1200 kW in late September. The minimum load, which occurred late at night during mild weather, was around 375 kW. The University’s annual energy requirements were about 5.8 million kWh in 2016.
7
Figure 4. 12.5 kW solar installation at MUM.

SOLAR SOLUTIONS FOR UNIVERSIT IES | WHITE PAPER
H O W AC T I V E T R AC K I N G W O R K S
The MUM Solar Power Plant uses an intelligent tracker control system. This cutting edge system, developed by NEXTracker, distinguishes this solar installation from other active tracking systems. The system is designed to allow each row to operate independently to optimize solar production and to continue to function in case of damage or routine maintenance.
In addition to following the sun, each row of solar panels acts as a data collection sensor. These sensors are linked to one another, as well as to network control units (NCUs), with a wireless mesh network.
0
200
400
600
800
1000
1200
1400
1600
12 AM 4 AM 8 AM 12 PM 4 PM 8 PM
Dem
and
(kW
)
MUM Hourly Electric Demand (kW)Average and Max
Jan Jun Jan Max June Max
Figure 4. Measured campus load data, January and June 2017.
Figure 5. Self-powered active tracking at MUM’s power plant.
8

SOLAR SOLUTIONS FOR UNIVERSIT IES | WHITE PAPER
MUM SOLAR POWER PLANTSELF-POWERED TRACKING SYSTEM
SELF-POWERED MOTOR DRIVE
WIRELESS CONTROLLER ANTENNAE
PIER
Figure 6. NEXTracker active tracking system.
Each row is rotated by a single motor and slew drive. Each motor is controlled by a self-powered controller (SPC) that communicates wirelessly with an NCU. The NCUs are connected to the network via fiber optic cable.
W E AT H E R S TAT I O N S
The solar field has four weather stations. Two are flood and snow sensors and two are wind sensors (anemometers). The flood and snow sensors instruct the solar panels to stow flat during flood conditions and to rotate 60° vertically to shed snow, if necessary. The anemometers direct the panels to stow westward at 60° during high wind conditions. These four weather stations
also provide instantaneous onsite weather data to the system.
A central energy management system integrates performance metrics from these sensors and weather stations. A predictive algorithm uses this data to optimize the performance of each row. Each individual row can move independently to compensate for shading, weather conditions, or the topography of the site in real time. This ability makes the MUM Solar Power Plant among the most sophisticated – and efficient – active tracking solar arrays in the nation.
9

SOLAR SOLUTIONS FOR UNIVERSIT IES | WHITE PAPER
MUM SOLAR POWER PLANTWEATHER STATIONS
STORM WEATHER STATION WIND WEATHER STATION
ANEMOMETER
SNOW SENSOR
FASTENS TO LEFT S IDE OF P IER
SOLAR PV MODULE
COMMUNICATION ANTENNA
Figure 7. Weather stations and wireless communication.
AC T I V E T R AC K I N G V S F I X E D - T I LT
Single axis active tracking solar arrays can produce 15 to 20% more energy than a fixed-tilt array of the same size. Active tracking arrays start producing earlier in the day, hit peak production earlier in the day, and continue producing later into the afternoon. On a graph, the peak production window of active tracking arrays appears wider than a fixed-tilt production profile. Therefore, in the solar industry, we say active tracking has “wide shoulders”.
These wide shoulders offer several benefits. First, they allow a smaller active tracking system to produce as
much energy as a larger fixed-tilt system. Second, they extend solar production into the late afternoon. This is important for customers with load profiles dominated by air conditioning.
In the summer, peak outdoor temperatures usually occur several hours after the sun reaches its zenith. In addition, buildings heat up due to solar gain throughout the sunny part of the day, and that stored heat continues to be released even after the sun has set. Together, these forces mean air conditioning loads continue to be high after the sun is low in the sky when traditional fixed-tilt arrays no longer produce much power. In other words, even without a battery energy storage system, active tracking arrays can continue producing longer into the afternoon when cyclical daily air conditioning loads are high.
10
SOLAR SOLUTIONS FOR UNIVERSIT IES | WHITE PAPER
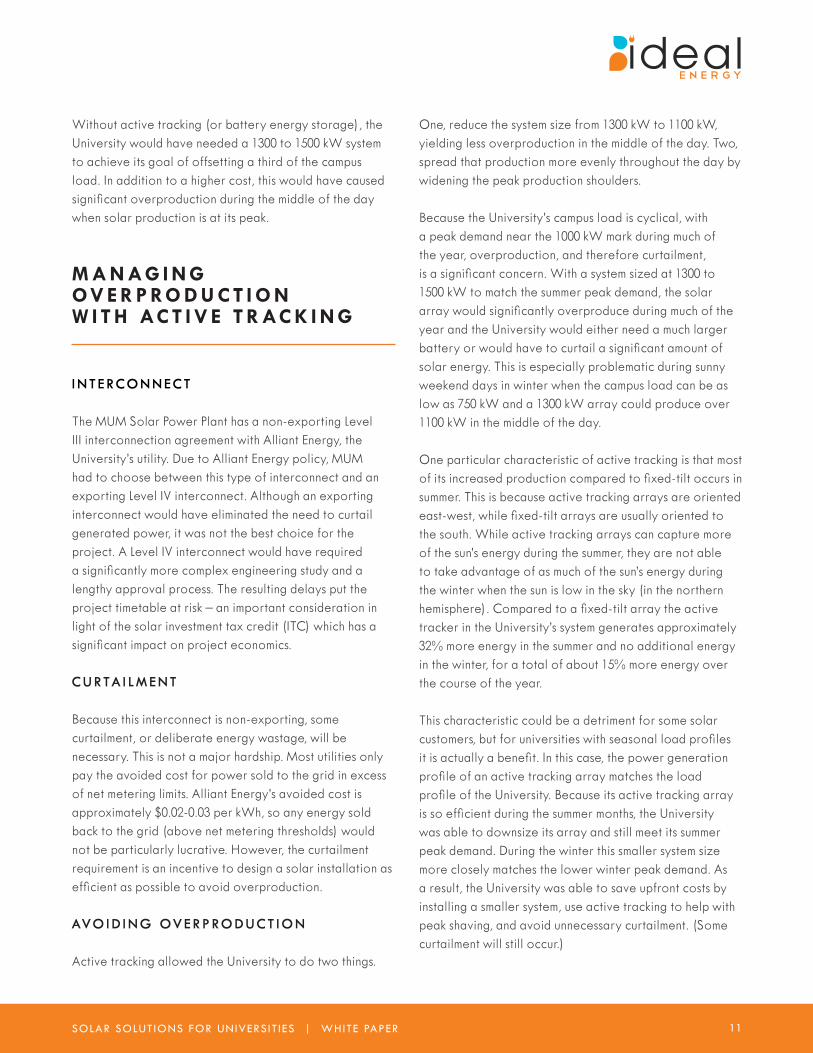
Without active tracking (or battery energy storage), the University would have needed a 1300 to 1500 kW system to achieve its goal of offsetting a third of the campus load. In addition to a higher cost, this would have caused significant overproduction during the middle of the day when solar production is at its peak.
M A N AG I N G OV E R P RO D U C T I O N W I T H AC T I V E T R AC K I N G
I N T E R C O N N E C T
The MUM Solar Power Plant has a non-exporting Level III interconnection agreement with Alliant Energy, the University’s utility. Due to Alliant Energy policy, MUM had to choose between this type of interconnect and an exporting Level IV interconnect. Although an exporting interconnect would have eliminated the need to curtail generated power, it was not the best choice for the project. A Level IV interconnect would have required a significantly more complex engineering study and a lengthy approval process. The resulting delays put the project timetable at risk – an important consideration in light of the solar investment tax credit (ITC) which has a significant impact on project economics.
C U R TA I L M E N T
Because this interconnect is non-exporting, some curtailment, or deliberate energy wastage, will be necessary. This is not a major hardship. Most utilities only pay the avoided cost for power sold to the grid in excess of net metering limits. Alliant Energy’s avoided cost is approximately $0.02-0.03 per kWh, so any energy sold back to the grid (above net metering thresholds) would not be particularly lucrative. However, the curtailment requirement is an incentive to design a solar installation as efficient as possible to avoid overproduction.
AVO I D I N G OV E R P R O D U C T I O N
Active tracking allowed the University to do two things.
One, reduce the system size from 1300 kW to 1100 kW, yielding less overproduction in the middle of the day. Two, spread that production more evenly throughout the day by widening the peak production shoulders.
Because the University’s campus load is cyclical, with a peak demand near the 1000 kW mark during much of the year, overproduction, and therefore curtailment, is a significant concern. With a system sized at 1300 to 1500 kW to match the summer peak demand, the solar array would significantly overproduce during much of the year and the University would either need a much larger battery or would have to curtail a significant amount of solar energy. This is especially problematic during sunny weekend days in winter when the campus load can be as low as 750 kW and a 1300 kW array could produce over 1100 kW in the middle of the day.
One particular characteristic of active tracking is that most of its increased production compared to fixed-tilt occurs in summer. This is because active tracking arrays are oriented east-west, while fixed-tilt arrays are usually oriented to the south. While active tracking arrays can capture more of the sun’s energy during the summer, they are not able to take advantage of as much of the sun’s energy during the winter when the sun is low in the sky (in the northern hemisphere). Compared to a fixed-tilt array the active tracker in the University’s system generates approximately 32% more energy in the summer and no additional energy in the winter, for a total of about 15% more energy over the course of the year.
This characteristic could be a detriment for some solar customers, but for universities with seasonal load profiles it is actually a benefit. In this case, the power generation profile of an active tracking array matches the load profile of the University. Because its active tracking array is so efficient during the summer months, the University was able to downsize its array and still meet its summer peak demand. During the winter this smaller system size more closely matches the lower winter peak demand. As a result, the University was able to save upfront costs by installing a smaller system, use active tracking to help with peak shaving, and avoid unnecessary curtailment. (Some curtailment will still occur.)
11

SOLAR SOLUTIONS FOR UNIVERSIT IES | WHITE PAPER
BAT T E RY E N E RG Y S T O R AG E S Y S T E M
The MUM Solar Power Plant features a 1.05 MWh battery energy storage system. This system is composed of 35 DC coupled Avalon vanadium flow batteries.
VA N A D I U M F LOW BAT T E R I E S
Vanadium flow batteries (VFBs) are a type of flow, or redox, battery. Redox is short for reduction-oxidation, a chemical process during which the oxidation state of atoms is changed as electrons transfer from one type of atom to
Figure 8. Battery energy storage system.
MUM SOLAR POWER PLANTBATTERIES & INVERTERS
BATTERY
INVERTER
SOLAR PV MODULES
COMMUNICATION ANTENNAE
another. When a chemical loses electrons, that chemical is oxidized. When another chemical gains those electrons, that chemical is reduced. A commonplace example of reduction-oxidation is the burning of wood; the wood is oxidized as electrons leave the carbon in the wood, and in turn the oxygen in the air is reduced as those electrons are gained by the oxygen.
A flow battery is composed of two tanks of chemicals dissolved in liquid separated by a membrane. Energy is harvested from the electrolyte at the carbon felt membrane. Energy is harvested in the membrane. In vanadium flow batteries, the chemical is vanadium and the liquid it is dissolved in is water.
12

SOLAR SOLUTIONS FOR UNIVERSIT IES | WHITE PAPER
Vanadium flow batteries exploit an unusual property of the metal vanadium. Vanadium, a transitional metal, has four possible oxidation states. A VFB does not require two different kinds of chemicals – just two tanks of dissolved vanadium in different oxidation states. If the vanadium tanks accidentally mix, there is no ill effect to the battery.
VFBs have other advantages, as well. They scale well because their energy capacity is limited only by tank size. Vanadium is also safe and non-flammable. Perhaps best of all, VFBs can be completely discharged without losing capacity. This gives VFBs a long service life and allows solar designers to use smaller batteries because these can discharge more of their capacity than can other battery types, like lithium-ion.
VFBs do have several downsides. These include lower energy density and heavier weight compared to other battery technologies. VFBs also require more maintenance than, for example, lithium-ion batteries. However, bulky and heavy batteries are not a problem in large-scale solar arrays. Regular maintenance is expected in commercial or utility scales. The primary disadvantage of VFBs is cost.
Vanadium flow batteries are more expensive per kWh than lithium ion batteries. As projects scale up in size, however, the benefits of VFBs outweigh the cost disadvantage.
P E A K S H AV I N G W I T H BAT T E RY E N E RG Y S T O R AG E S Y S T E M S
Peak shaving cuts expensive demand charges by reducing electricity consumption during peak usage times like summer afternoons. Not all utility customers have demand charges, but for those that are on demand charge tariffs these charges can be very expensive. According to the National Renewable Energy Laboratory (NREL), demand charges can account for 30% to 70% of a customer’s utility bill.
0
200
400
600
800
1000
1200
1400
1600
7/10/2017 0:00 7/11/2017 0:00 7/12/2017 0:00 7/13/2017 0:00
Usa
ge a
nd P
roduc
tion
Peak Demand Shaving Example
Sum of Solar Production (kW) Sum of University Load (kW)
Sum of Demand After Solar (kW) Sum of Demand After Solar and Battery (kW)
Figure 9. Solar + battery energy storage peak shaving simulation. The black line represents the shaved peak.
13

SOLAR SOLUTIONS FOR UNIVERSIT IES | WHITE PAPER
Even with active tracking technology the solar array alone would not have been able to address all of MUM’s renewable energy goals. Battery energy storage was required to provide peak shaving. While solar arrays alone can help alleviate demand charges, they are not as effective as battery energy storage. Battery energy storage systems can guarantee that no power above a predetermined threshold will be drawn from the grid during peak times. They can automatically detect when power usage exceeds a pre-determined threshold and switch from the grid or solar panels to batteries until the additional demand is over. When demand goes back down the batteries recharge.
R ATC H E T P E R I O D
The key to MUM’s utility savings is in Alliant Energy’s ratchet period clause. With this ratchet clause, a customer is charged at least 75% of its annual summer peak every month of the year. In MUM’s case, the peak summer load (usually in June or August) has typically been approximately 1500 kW. This means MUM will be
charged for 1125 kW (.75 x 1500) in every month of the year regardless of their actual monthly peak. In January, the University may peak at 750 kW or 850 kW, but will still be charged for 1125 kW. Thus, reducing summer peaks can save the university significantly more than the simple monthly demand charge.
MUM’s peak shaving goal was to reduce the summer peak to between 900 kW and 1000 kW. If the peak hits 1000 kW in the summer then the University will only be charged for 750 kW in the winter – which is near the University’s actual lowest monthly winter peak. This reduction in the ratchet period peak represents a significant part of the utility cost savings that MUM will see from this solar project.
P R O J E C T I O N S
Solar and battery energy storage simulations indicate that the MUM Power Plant will shave summer ratchet peaks from the 1400 to 1600 kW range down to the 900 to 1000 kW range. Solar generation will exceed campus demand and battery capacity on some days, so 4-8% curtailment of annual production is expected.
-
200
400
600
800
1,000
1,200
1,400
1,600
Jan Feb Mar Apr May Jun Jul Aug Sep Oct Nov Dec
Peak
Dem
and
(kW
)
Current Monthly Peak Demand
Actual Peak Demand Minimum Billing Demand (due to Ratchet)
0
200
400
600
800
1000
1200
1400
1600
Jan Feb Mar Apr May Jun Jul Aug Sep Oct Nov Dec
Pea
k D
ema
nd (
kW)
Projected Monthly Peak Demand
Actual Peak Demand Minimum Billing Demand (due to Ratchet)
Figure 10. Current and projected peak demand.
14
SOLAR SOLUTIONS FOR UNIVERSIT IES | WHITE PAPER
L E S S O N S L E A R N E D
T H E U N I Q U E C H A L L E N G E S O F U N I V E R S I T I E S
With a substantial swing in peak demand from summer to winter and high air conditioning loads in late afternoon, the university load profile presents unique challenges for the solar designer. If a designer sizes a fixed-tilt system to meet peak demand, overproduction is the result. If a system is sized to eliminate overproduction, customer expectations of energy generation and cost savings will likely not be met. Traditional fixed-tilt solar arrays are not up to the task.
OV E R P R O D U C T I O N
Overproduction is a concern for universities or any other electric user with a load profile dominated by air conditioning. There are several solutions to overproduction, but few of them are desirable. Significant curtailment (i.e. discarding excess electricity) is wasteful and indicative of an oversized solar array. Selling power back to the grid at the avoided cost is almost never
economical and may not be feasible at all depending on the interconnection requirements of the utility. On the other hand, creative solutions using a combination of active tracking and battery energy storage can mitigate overproduction while meeting energy generation and cost savings targets.
AC T I V E T R AC K I N G & BAT T E RY E N E R G Y S TO R AG E
Active tracking works synergistically with battery energy storage to peak shave. This combination is especially effective for cyclical load profiles driven by air conditioning demands. During the summer active tracking features a wider peak production window than fixed-tilt arrays, allowing a solar installation to continue generating power in late afternoon when the sun is low, but air conditioners are still running. Because of their east-west orientation, active tracking arrays do not overproduce too much in winter, when air conditioning loads are nonexistent. Battery energy storage systems take advantage of surplus solar energy by storing energy generated when air conditioning loads are low and releasing that energy when loads are high. This combination is an ideal fit for universities.
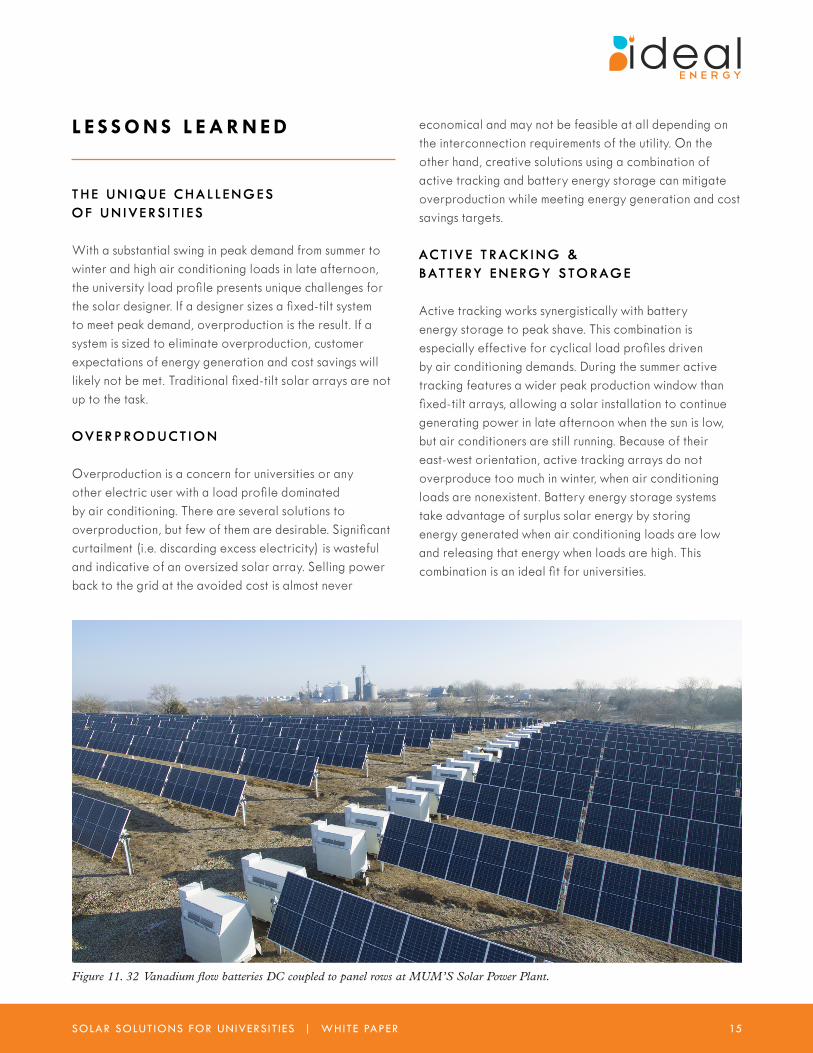
Figure 11. 32 Vanadium flow batteries DC coupled to panel rows at MUM’S Solar Power Plant.
15

SOLAR SOLUTIONS FOR UNIVERSIT IES | WHITE PAPER
602 North 6th Street Fairfield, IA 52556
800 634 4454888 507 5682
pf
© Ideal Energy Inc. 2018 All Rights Reserved.