Embed Size (px)
Citation preview
Journal of Colloid and Interface Science 388 (2012) 282–292
Contents lists available at SciVerse ScienceDirect
Journal of Colloid and Interface Science
www.elsevier .com/locate / jc is
Solid-state electron transport in Mn-, Co-, holo-, and Cu-ferritins:Force-induced modulation is inversely linked to the protein conductivity
Tatini Rakshit, Rupa Mukhopadhyay ⇑Department of Biological Chemistry, Indian Association for the Cultivation of Science, Jadavpur, Kolkata 700 032, India
a r t i c l e i n f o
Article history:Received 19 June 2012Accepted 14 August 2012Available online 28 August 2012
Keywords:FerritinSolid-state electron transportCompressional forceCurrent sensing atomic force spectroscopy
0021-9797/$ - see front matter � 2012 Elsevier Inc. Ahttp://dx.doi.org/10.1016/j.jcis.2012.08.028
⇑ Corresponding author. Fax: +91 33 2473 2805.E-mail address: [email protected] (R. Mukhopadhy
a b s t r a c t
In this work, solid-state electron transport through the three metal core reconstituted ferritins, namely,Mn(III)-ferritin, Co(III)-ferritin, and Cu(II)-ferritin, has been probed and compared to the electron trans-port via the naturally-occurring iron-containing holoferritin and the metal-free apoferritin using currentsensing atomic force spectroscopy (CSAFS), which allows direct contact to be established with the proteinmolecules. The CSAFS results reveal that by applying compressional force, in varying degrees (17–66 nN)and for varying durations (1 min, 2 min, and 3 min), the electronic conductivity of these proteins can beincreased (for greater amount of force applied or for prolonged application of force) or decreased (for les-ser amount of force applied or for shorter application time). The compressional modulation of the elec-tronic conductivities appears to be due to compression of the protein part. The observation of the order ofelectronic conductivities of Mn-, holo-, Co-, and Cu-ferritins at almost any specific force value being sim-ilar to that of the free metal conductivities indicates that the absolute conductivity values are directlyinfluenced by the metal core. Importantly, we found that more conductive the protein is, less modulatedit can be. These findings could be highly relevant in realizing metalloprotein-based bioelectronic devices,especially where the electrode–protein–electrode sandwich configurations are employed.
� 2012 Elsevier Inc. All rights reserved.
1. Introduction
Effective integration of biological molecules into nanoscale so-lid-state electronic devices requires thorough understanding ofelectron transport characteristics of the biomolecules immobilizedonto solid surfaces. For construction of stable tunnel junctions inthe solid-state devices, the redox metalloproteins are found to beattractive candidates over other biopolymers because of theirintrinsic capability of transferring single electrons over long dis-tances in a fast directional manner [1–3]. In this context, the ferritinprotein is expected to serve as effective bioelectronic componentdue to its unique structure. Ferritins are the main intracellular ironstorage proteins in both prokaryotes and eukaryotes. It is a globularprotein consisting of 24 protein subunits and is soluble andnon-toxic. Ferritin has the shape of a hollow sphere with an outerdiameter of �12 nm and a shell thickness of �2 nm [4,5]. The corecan contain few thousand iron atoms starting from about 2000 [6,7]up to 4500 iron atoms [4] in form of ferrihydrite phosphate [(FeO-OH)8(FeOPO3H2)]. Ferritin is robust when adsorbed onto a solidsupport and functions well up to 85 �C temperature in aqueousenvironments within a pH range 4.0–9.0 [8]. It contains threefoldand fourfold symmetric channels that are located at the junctionsof its subunits [9]. The structure of ferritin is extremely important
ll rights reserved.
ay).
for the protein’s ability to store and release iron in a controlled fash-ion. In fact, the �8 nm cavity of apoferritin has been successfullyused for preparation of various types of nanoparticles with negligi-ble change in the protein’s geometric disposition [10–18].
The current sensing atomic force spectroscopy (CSAFS) is one ofthe primary techniques for probing electronic conduction in indi-vidual biomolecules that are anchored onto a solid support. InCSAFS, the tip makes direct contact with the molecules under con-trolled force, allowing precise knowledge of vertical tip positioning.Moreover, samples of a wide range of conductivity can be studiedby CSAFS. In the present work, the electrical characteristics of threemetal core reconstituted ferritins, which are Mn(III)-ferritin, Co(III)-ferritin, and Cu(II)-ferritin, have been studied across a range of forceloads to understand the effect of molecular compression on conduc-tivity of these protein molecules. Second, the effects of temporalvariations during force application on protein conductivity werealso investigated. The electronic responses of these proteins havefurther been compared to those of the naturally-occurring iron stor-age protein holoferritin and the metal-free apo form. We found thatthe electronic conductivities of the Mn-, holo-, Co-, and Cu-ferritinsfollow an order, which is similar to the order of the free bulk metalconductivities. We also observed that force-induced alterations inthe electronic conductivity for all the proteins bear a direct relationto the applied force, that is, with increased amount of force or forceapplication time periods, the conductivity increases, and for thelesser force values or the shorter durations, the conductivity
T. Rakshit, R. Mukhopadhyay / Journal of Colloid and Interface Science 388 (2012) 282–292 283
decreases. This capacity of pressure-tuning of the electronic bandgaps of the ferritins, in general, could be useful in realization of fer-ritin-based bioelectronic devices of sandwich configuration wherecertain degrees of compressive force may need to be applied onthe intermediate protein layer for controlling the device function[19,20]. It is important to note here that by using metal core recon-stituted ferritins, junctions of high conductivity (‘‘on’’) and low con-ductivity (‘‘off’’) states with a variety of combinations may beenvisaged [21–24].
2. Experimental
2.1. Preparative methods
Equine spleen apo- and holoferritin were obtained from Sigma.Mn(III)-ferritin, Co(III)-ferritin, and Cu(II)-ferritin samples wereprepared and characterized as previously described [11,15,16,25].The Fe(III)-ferritin sample was prepared using a procedurereported by Snow et al. [7]. The resulting Fe(III)-ferritin was char-acterized by transmission electron microscopy (TEM) where car-bon-coated copper grid (300 mesh) was used (see Fig. 1 inSupporting information). The sample was negatively stained byuranyl acetate (1%). Images were taken using high-resolutionTEM (JEOL-TEM-2011) with an operating voltage of 160 keV. Fromthe EDX spectra, the presence of iron was confirmed. Optical spec-tra of Fe(III)-ferritin prepared in MOPS buffer was recorded on aVarian Cary 50 Bio UV–VIS spectrometer at 25 �C using a 1 cm cuv-ette (see Fig. 1 in Supporting information). All the ferritin solutionswere stored at 4 �C. The metal contents in the ferritins were deter-mined by inductively coupled plasma (ICP) measurements usingPerkin–Elmer Optima 2100 DV machine.
2.2. Preparation of ferritin film onto highly oriented pyrolytic graphite(HOPG) surface
For the CSAFS experiments, HOPG was chosen as the substratesince it is conductive, hard, and offers atomically flat surface. Also,ferritin molecules can be physisorbed onto HOPG surface becauseof hydrophobic surface patches present on the ferritin exterior[4,26]. The films of the five ferritin proteins were prepared byspin-coating using a spin-coater (Apex Instruments, model no.SCU2007A). The ferritin solutions of 1.9–2.5 lM concentrationwere spin-coated at 2800–3000 rpm for 25–30 s onto freshlycleaved HOPG substrate (Agar Scientific). For apoferritin, holoferr-itin and Cu(II)-ferritin, tris buffer (100 mM tris, 150 mM NaCl, pH8.0) was used. For Mn(III)-ferritin, the AMPSO buffer (50 mM AMP-SO, 50 mM NaCl, pH 8.9) and for Co(III)-ferritin, the MOPS buffer(25 mM MOPS, 50 mM NaCl, pH 8.5) were used. In case of Fe(III)-ferritin, 50 mM MOPS, 100 mM NaCl, pH 7.5 buffer was used inconformity with the previous reports [7,27]. To keep the ferritinsamples in their most stable forms, different buffers had to be ap-plied [15]. In order to ensure that application of the different buf-fers did not give rise to the differences in the electron transportcharacteristics of the five ferritin proteins, the I–V curves of apofer-ritin (that has the same exterior as the other four proteins) samplesprepared in different buffers were obtained earlier using scanningtunneling spectroscopy. No notable differences in the I–V curves ofthe differently buffered apoferritin samples could be identified[25]. Buffer solutions were always prepared using autoclavedMilli-Q water (resistivity 18.2 MX cm) and filtered using 0.22 lmfilter (Millex-GV, Millipore) prior to use. After spin-coating, thesample was washed with 0.5 mL (2 � 250 lL) of the respective buf-fer solutions followed by 1 mL (4 � 250 lL) of Milli-Q water anddried under a weak stream of nitrogen gas.
2.3. CSAFS experiments
Prior to starting the CSAFS measurements, each sample was im-aged by intermittent contact mode AFM using the acoustic AC(AAC) signal to check for the surface coverage of the ferritin pro-teins. The AFM probes (Micromasch, Estonia) were of tip radius<10 nm and resonant frequency 190–220 kHz. The AFM imagingand I–V experiments were performed using the PicoLE AFM micro-scope of Agilent Corp. (USA) with 10-lm scanner. The I–V mea-surements were performed using CSAFS in contact mode wherethe electrical characteristics were recorded independent of forcefeedback. In CSAFS experiments, Ti/Pt coated cantilevers (Microm-asch, Estonia) having spring constant 2 N/m, tip radius �35 nm,length 110 lm, and width 40 lm were used. The conductive probewas initially engaged to the sample at minimal force (in force feed-back). The I–V sweeps were made between ±1.5 V at 1 V/s (given astip bias with respect to the substrate), and the resulting current re-sponses were recorded. The I–V experiments were repeated for alarge number of molecules from different areas as well as from dif-ferent samples. Each single I–V spectrum acquired on a proteinmolecule was the average over five sweeps. During each measure-ment, the force set-point was calibrated and adjusted as required.To calculate the absolute force at a particular point, the force–dis-tance curves were recorded to relate the force set-point to the can-tilever deflection. All CSAFS measurements were performed inambient condition where temperature and humidity were main-tained at 24 ± 1 �C and 35–45%, respectively. The I–V curves for fivedifferent ferritin systems at different force loads were fitted withthe Fowler–Nordheim tunneling equation using Microcal Origin8.0 software.
3. Results
In the present work, the solid-state electron transport in threemetal core reconstituted ferritins, which are Mn(III)-ferritin,Co(III)-ferritin, and Cu(II)-ferritin, has been studied and comparedto the electron transport through the iron storage protein holoferr-itin, and its apo form, by current sensing atomic force spectroscopy(CSAFS). The effects of vertical compression on the molecular con-ductance of these proteins were studied across a range of contactforces (17–66 nN) and a range of force application time periods(1 min, 2 min, and 3 min). All the measurements were performedon freshly prepared films of the ferritin molecules onto HOPG sub-strate, using contact mode under ambient condition.
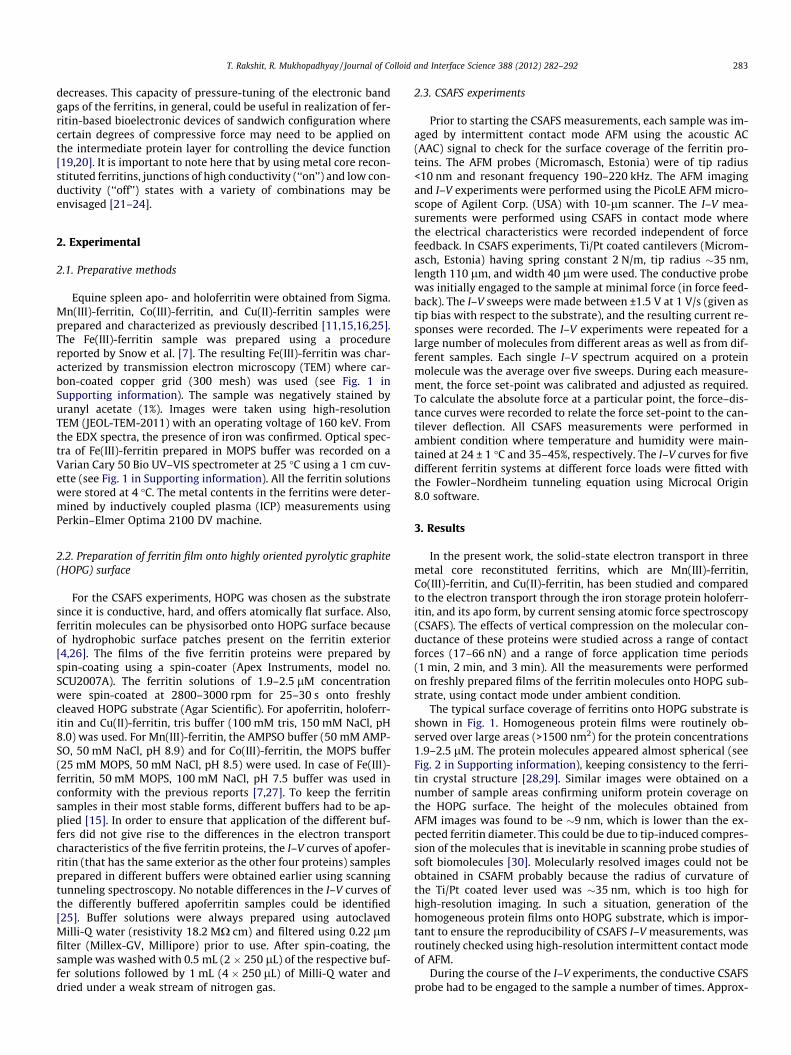
The typical surface coverage of ferritins onto HOPG substrate isshown in Fig. 1. Homogeneous protein films were routinely ob-served over large areas (>1500 nm2) for the protein concentrations1.9–2.5 lM. The protein molecules appeared almost spherical (seeFig. 2 in Supporting information), keeping consistency to the ferri-tin crystal structure [28,29]. Similar images were obtained on anumber of sample areas confirming uniform protein coverage onthe HOPG surface. The height of the molecules obtained fromAFM images was found to be �9 nm, which is lower than the ex-pected ferritin diameter. This could be due to tip-induced compres-sion of the molecules that is inevitable in scanning probe studies ofsoft biomolecules [30]. Molecularly resolved images could not beobtained in CSAFM probably because the radius of curvature ofthe Ti/Pt coated lever used was �35 nm, which is too high forhigh-resolution imaging. In such a situation, generation of thehomogeneous protein films onto HOPG substrate, which is impor-tant to ensure the reproducibility of CSAFS I–V measurements, wasroutinely checked using high-resolution intermittent contact modeof AFM.
During the course of the I–V experiments, the conductive CSAFSprobe had to be engaged to the sample a number of times. Approx-
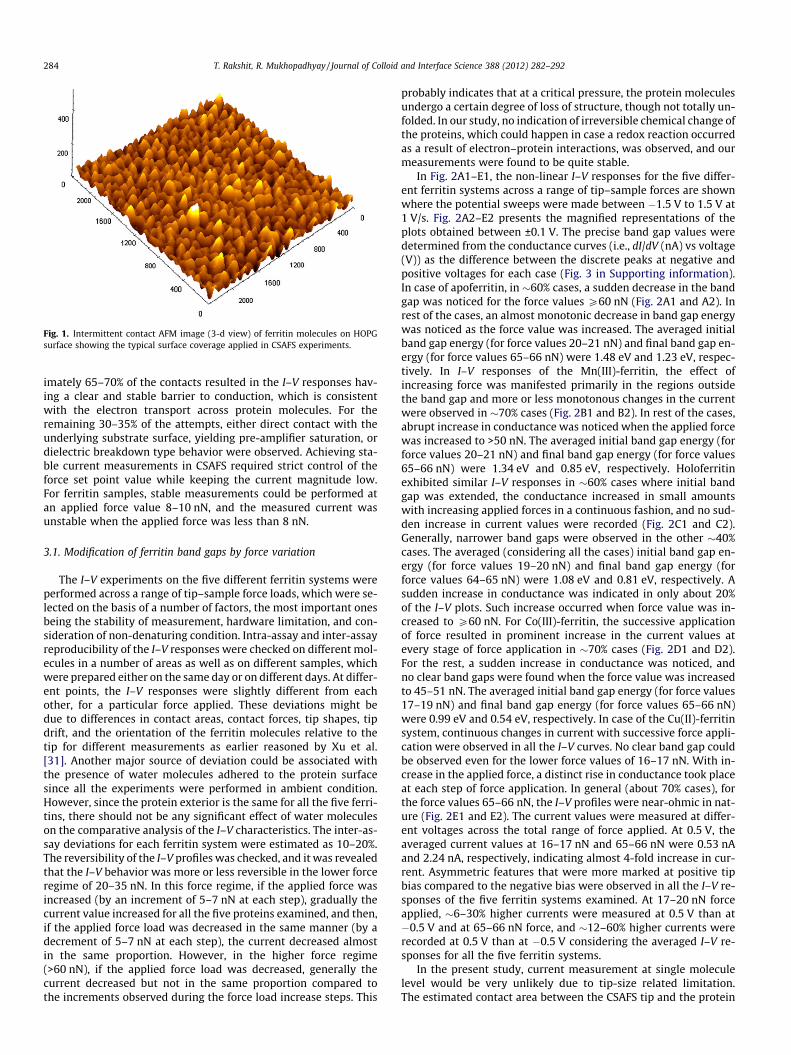
Fig. 1. Intermittent contact AFM image (3-d view) of ferritin molecules on HOPGsurface showing the typical surface coverage applied in CSAFS experiments.
284 T. Rakshit, R. Mukhopadhyay / Journal of Colloid and Interface Science 388 (2012) 282–292
imately 65–70% of the contacts resulted in the I–V responses hav-ing a clear and stable barrier to conduction, which is consistentwith the electron transport across protein molecules. For theremaining 30–35% of the attempts, either direct contact with theunderlying substrate surface, yielding pre-amplifier saturation, ordielectric breakdown type behavior were observed. Achieving sta-ble current measurements in CSAFS required strict control of theforce set point value while keeping the current magnitude low.For ferritin samples, stable measurements could be performed atan applied force value 8–10 nN, and the measured current wasunstable when the applied force was less than 8 nN.
3.1. Modification of ferritin band gaps by force variation
The I–V experiments on the five different ferritin systems wereperformed across a range of tip–sample force loads, which were se-lected on the basis of a number of factors, the most important onesbeing the stability of measurement, hardware limitation, and con-sideration of non-denaturing condition. Intra-assay and inter-assayreproducibility of the I–V responses were checked on different mol-ecules in a number of areas as well as on different samples, whichwere prepared either on the same day or on different days. At differ-ent points, the I–V responses were slightly different from eachother, for a particular force applied. These deviations might bedue to differences in contact areas, contact forces, tip shapes, tipdrift, and the orientation of the ferritin molecules relative to thetip for different measurements as earlier reasoned by Xu et al.[31]. Another major source of deviation could be associated withthe presence of water molecules adhered to the protein surfacesince all the experiments were performed in ambient condition.However, since the protein exterior is the same for all the five ferri-tins, there should not be any significant effect of water moleculeson the comparative analysis of the I–V characteristics. The inter-as-say deviations for each ferritin system were estimated as 10–20%.The reversibility of the I–V profiles was checked, and it was revealedthat the I–V behavior was more or less reversible in the lower forceregime of 20–35 nN. In this force regime, if the applied force wasincreased (by an increment of 5–7 nN at each step), gradually thecurrent value increased for all the five proteins examined, and then,if the applied force load was decreased in the same manner (by adecrement of 5–7 nN at each step), the current decreased almostin the same proportion. However, in the higher force regime(>60 nN), if the applied force load was decreased, generally thecurrent decreased but not in the same proportion compared tothe increments observed during the force load increase steps. This
probably indicates that at a critical pressure, the protein moleculesundergo a certain degree of loss of structure, though not totally un-folded. In our study, no indication of irreversible chemical change ofthe proteins, which could happen in case a redox reaction occurredas a result of electron–protein interactions, was observed, and ourmeasurements were found to be quite stable.
In Fig. 2A1–E1, the non-linear I–V responses for the five differ-ent ferritin systems across a range of tip–sample forces are shownwhere the potential sweeps were made between �1.5 V to 1.5 V at1 V/s. Fig. 2A2–E2 presents the magnified representations of theplots obtained between ±0.1 V. The precise band gap values weredetermined from the conductance curves (i.e., dI/dV (nA) vs voltage(V)) as the difference between the discrete peaks at negative andpositive voltages for each case (Fig. 3 in Supporting information).In case of apoferritin, in �60% cases, a sudden decrease in the bandgap was noticed for the force values P60 nN (Fig. 2A1 and A2). Inrest of the cases, an almost monotonic decrease in band gap energywas noticed as the force value was increased. The averaged initialband gap energy (for force values 20–21 nN) and final band gap en-ergy (for force values 65–66 nN) were 1.48 eV and 1.23 eV, respec-tively. In I–V responses of the Mn(III)-ferritin, the effect ofincreasing force was manifested primarily in the regions outsidethe band gap and more or less monotonous changes in the currentwere observed in �70% cases (Fig. 2B1 and B2). In rest of the cases,abrupt increase in conductance was noticed when the applied forcewas increased to >50 nN. The averaged initial band gap energy (forforce values 20–21 nN) and final band gap energy (for force values65–66 nN) were 1.34 eV and 0.85 eV, respectively. Holoferritinexhibited similar I–V responses in �60% cases where initial bandgap was extended, the conductance increased in small amountswith increasing applied forces in a continuous fashion, and no sud-den increase in current values were recorded (Fig. 2C1 and C2).Generally, narrower band gaps were observed in the other �40%cases. The averaged (considering all the cases) initial band gap en-ergy (for force values 19–20 nN) and final band gap energy (forforce values 64–65 nN) were 1.08 eV and 0.81 eV, respectively. Asudden increase in conductance was indicated in only about 20%of the I–V plots. Such increase occurred when force value was in-creased to P60 nN. For Co(III)-ferritin, the successive applicationof force resulted in prominent increase in the current values atevery stage of force application in �70% cases (Fig. 2D1 and D2).For the rest, a sudden increase in conductance was noticed, andno clear band gaps were found when the force value was increasedto 45–51 nN. The averaged initial band gap energy (for force values17–19 nN) and final band gap energy (for force values 65–66 nN)were 0.99 eV and 0.54 eV, respectively. In case of the Cu(II)-ferritinsystem, continuous changes in current with successive force appli-cation were observed in all the I–V curves. No clear band gap couldbe observed even for the lower force values of 16–17 nN. With in-crease in the applied force, a distinct rise in conductance took placeat each step of force application. In general (about 70% cases), forthe force values 65–66 nN, the I–V profiles were near-ohmic in nat-ure (Fig. 2E1 and E2). The current values were measured at differ-ent voltages across the total range of force applied. At 0.5 V, theaveraged current values at 16–17 nN and 65–66 nN were 0.53 nAand 2.24 nA, respectively, indicating almost 4-fold increase in cur-rent. Asymmetric features that were more marked at positive tipbias compared to the negative bias were observed in all the I–V re-sponses of the five ferritin systems examined. At 17–20 nN forceapplied, �6–30% higher currents were measured at 0.5 V than at�0.5 V and at 65–66 nN force, and �12–60% higher currents wererecorded at 0.5 V than at �0.5 V considering the averaged I–V re-sponses for all the five ferritin systems.
In the present study, current measurement at single moleculelevel would be very unlikely due to tip-size related limitation.The estimated contact area between the CSAFS tip and the protein
D1
C2 C1
B2 B1
A2 A1
D2
E2 E1
-3
-2
-1
0
1
2
3
I (nA
)
V (volt)
17 nN 24 nN 30 nN 36 nN 43 nN 48 nN 54 nN 60 nN 66 nN
-0.03
-0.02
-0.01
0.00
0.01
0.02
0.03
19 nN 25 nN 31 nN 36 nN 42 nN 48 nN 54 nN 60 nN 65 nN
I (nA
)
V (volt)
-0.03
-0.02
-0.01
0.00
0.01
0.02
0.03
16 nN 23 nN 29 nN 35 nN 42 nN 48 nN 54 nN 59 nN 65 nN
I (nA
)
V (volt)
-0.03
-0.02
-0.01
0.00
0.01
0.02
0.03
I (nA
)
V (volt)
17 nN 24 nN 30 nN 36 nN 43 nN 48 nN 54 nN 60 nN 66 nN
-0.03
-0.02
-0.01
0.00
0.01
0.02
0.03
20 nN 26 nN 31 nN 37 nN 42 nN 48 nN 53 nN 59 nN 65 nN
V (volt)
-3
-2
-1
0
1
2
3
19 nN 25 nN 31 nN 36 nN 42 nN 48 nN 54 nN 60 nN 65 nN
I (nA
)
V (volt)
-3
-2
-1
0
1
2
3
16 nN 23 nN 29 nN 35 nN 42 nN 48 nN 54 nN 59 nN 65 nN
I (nA
)
V (volt)
-1.5 -1.0 -0.5 0.0 0.5 1.0 1.5
-0.10 -0.05 0.00 0.05 0.10
-0.10 -0.05 0.00 0.05 0.10
-0.10 -0.05 0.00 0.05 0.10
-0.10 -0.05 0.00 0.05 0.10
-1.5 -1.0 -0.5 0.0 0.5 1.0 1.5
-1.5 -1.0 -0.5 0.0 0.5 1.0 1.5
-1.5 -1.0 -0.5 0.0 0.5 1.0 1.5-3
-2
-1
0
1
2
3
20 nN 26 nN 31 nN 37 nN 42 nN 48 nN 53 nN 59 nN 65 nN
V (volt)
I (nA
)-0.03
-0.02
-0.01
0.00
0.01
0.02
0.03
21 nN 27 nN 33 nN 38 nN 44 nN 51 nN 56 nN 61 nN 66 nN
I (nA
)
V (volt)
-0.10 -0.05 0.00 0.05 0.10-1.5 -1.0 -0.5 0.0 0.5 1.0 1.5-3
-2
-1
0
1
2
3
21 nN 27 nN 33 nN 38 nN 44 nN 51 nN 56 nN 61 nN 66 nN
I (nA
)
V (volt)
I (nA
)
Fig. 2. Characteristic I–V responses of (A1) apoferritin, (B1) Mn(III)-ferritin, (C1) holoferritin, (D1) Co(III)-ferritin, and (E1) Cu(II)-ferritin across a range of tip–sample forceswhere potential sweeps were made between ±1.5 V. Magnified view at low potentials (±0.1 V) of (A2) apoferritin, (B2) Mn(III)-ferritin, (C2) holoferritin, (D2) Co(III)-ferritin,and (E2) Cu(II)-ferritin. Each curve represents the mean of five I–V sweeps.
T. Rakshit, R. Mukhopadhyay / Journal of Colloid and Interface Science 388 (2012) 282–292 285
film was found to be 630 nm2 considering tip-induced deformationof the ferritin shell as 3 nm, since the average height for single fer-
ritin molecules considering apoferritin as well as the metal-loadedferritins was �9 nm, which is 3 nm less than ferritin’s crystallo-
286 T. Rakshit, R. Mukhopadhyay / Journal of Colloid and Interface Science 388 (2012) 282–292
graphic diameter of the molecule, that is, 12 nm [4]. This contactarea could contain a maximum of 5–6 molecules since the areathat each ferritin molecule would occupy is 113 nm2. Given theestimated contact area of 630 nm2 and the range of contact forcesof 17–66 nN, the vertical compression on the ferritin moleculescorresponded to 0.026–0.104 GPa pressure, with incrementalincrease of 9.52 � 10�3 GPa at each step of force increase by 5–7 nN. The number of molecules could however vary, since with achange in the compressive force load, the contact area wouldchange. Previously, in a molecular dynamics simulation study onazurin using CSAFM, Zhao et al. reported that it is impossible todeconvolute the contributions of increased contact area underincreasing force from the pressure-dependent protein electron-transfer characteristics, and that the effects of variable area haveminimal impact on the current in comparison with distance andbarrier height since current is linearly dependent on contact area,whereas it is exponentially dependent on distance and barrierheight [32]. It was also possible that significant portion of the mea-sured current resulted from electrons that tunnel between the tipand the substrate just outside the perimeter of the microcontact[33]. In addition, the calculated contact area might be underesti-mated since we obtained the protein deformation value from theintermittent contact mode AFM imaging, while the CSAFS mea-surements were performed in the contact mode and using probesof different diameters (�10 nm for the intermittent contact probeand �35 nm for the contact probe). A comparison between the cur-rent density (current/nm2) values for the five different ferritinscould be more realistic, and these values were obtained by dividingthe current values at 0.5 V and 1.0 V for minimum working forcevalues (17–21 nN) with the calculated contact area of 630 nm2.At 0.5 V, the current density values for apoferritin, Mn(III)-ferritin,holoferritin, Co(III)-ferritin, and Cu(II)-ferritin were found to be0.079, 0.081, 0.084, 0.095, and 1.05 pA/nm2, respectively. Similarly,at 1.0 V, the current density values were 0.22, 1.12, 1.55, 1.60, and4.73 pA/nm2, respectively. From these set of current density values,
A
-3
-2
-1
0
1
2
3
I (nA
)
V (volt)
Apoferritin Mn(III)-ferritin Holoferritin Co(III)-ferritin Cu(II)-ferritin
B
-3
-2
-1
0
1
2
3
I (nA
)
V (volt)
Apoferritin Mn(III)-ferritin Holoferritin Co(III)-ferritin Cu(II)-ferritin
-0.8 -0.4 0.0 0.4 0.8-0.4
-0.2
0.0
0.2
0.4
I (nA
)
V (volt)
C
-1.5 -1.0 -0.5 0.0 0.5 1.0 1.5
-1.5 -1.0 -0.5 0.0 0.5 1.0 1.5
D
Fig. 3. (A) Overlay of averaged I–V responses for the five ferritins obtained for the minapplied force at low potential (0.1 V), (C) overlay of averaged I–V curves for the five ferritis shown in the inset figure. The STS-derived information has earlier been reported in R
the current flowing through the single ferritin molecule of eachtype could be obtained by multiplying the current density valuewith 113 nm2, which is the area occupied by single ferritin mole-cule. The current values for the single apoferritin, Mn(III)-ferritin,holoferritin, Co(III)-ferritin, and Cu(II)-ferritin molecules couldthen be 8.93, 9.15, 9.49, 10.71, and 118.65 pA at 0.5 V, and 24.86,126.56, 175.15, 180.80, and 534.49 pA at 1.0 V, respectively.
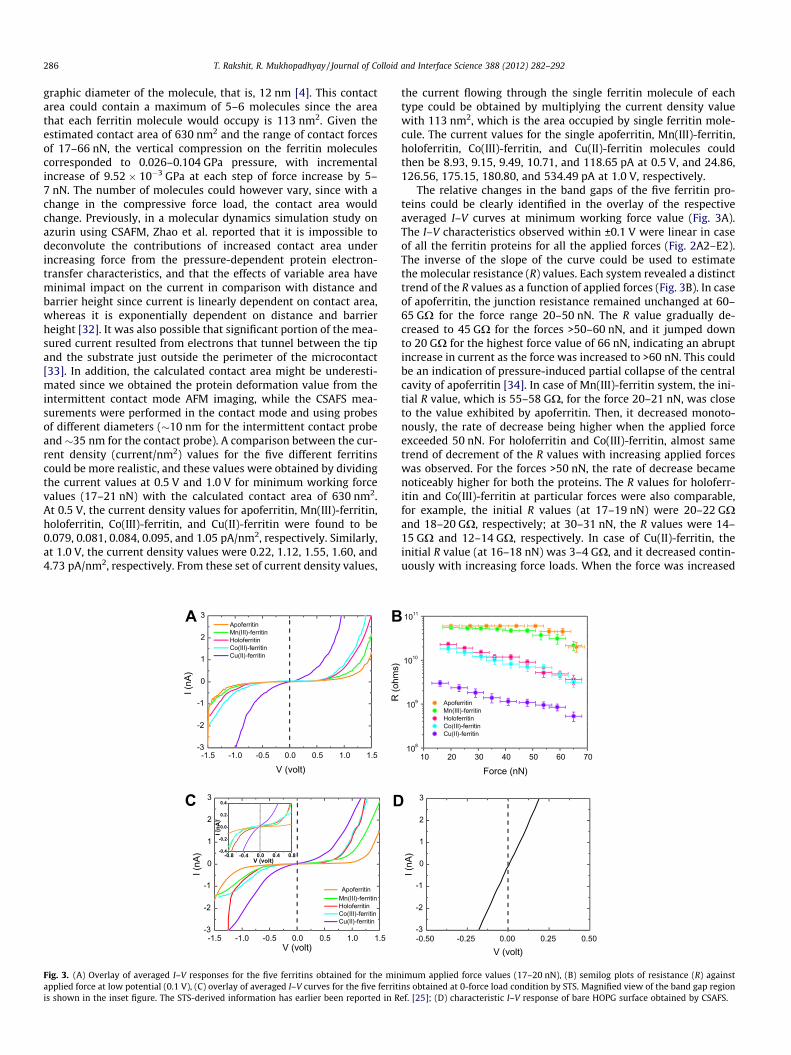
The relative changes in the band gaps of the five ferritin pro-teins could be clearly identified in the overlay of the respectiveaveraged I–V curves at minimum working force value (Fig. 3A).The I–V characteristics observed within ±0.1 V were linear in caseof all the ferritin proteins for all the applied forces (Fig. 2A2–E2).The inverse of the slope of the curve could be used to estimatethe molecular resistance (R) values. Each system revealed a distincttrend of the R values as a function of applied forces (Fig. 3B). In caseof apoferritin, the junction resistance remained unchanged at 60–65 GX for the force range 20–50 nN. The R value gradually de-creased to 45 GX for the forces >50–60 nN, and it jumped downto 20 GX for the highest force value of 66 nN, indicating an abruptincrease in current as the force was increased to >60 nN. This couldbe an indication of pressure-induced partial collapse of the centralcavity of apoferritin [34]. In case of Mn(III)-ferritin system, the ini-tial R value, which is 55–58 GX, for the force 20–21 nN, was closeto the value exhibited by apoferritin. Then, it decreased monoto-nously, the rate of decrease being higher when the applied forceexceeded 50 nN. For holoferritin and Co(III)-ferritin, almost sametrend of decrement of the R values with increasing applied forceswas observed. For the forces >50 nN, the rate of decrease becamenoticeably higher for both the proteins. The R values for holoferr-itin and Co(III)-ferritin at particular forces were also comparable,for example, the initial R values (at 17–19 nN) were 20–22 GXand 18–20 GX, respectively; at 30–31 nN, the R values were 14–15 GX and 12–14 GX, respectively. In case of Cu(II)-ferritin, theinitial R value (at 16–18 nN) was 3–4 GX, and it decreased contin-uously with increasing force loads. When the force was increased
108
109
1010
1011
R (o
hms)
Force (nN)
Apoferritin Mn(III)-ferritin Holoferritin Co(III)-ferritin Cu(II)-ferritin
10 20 30 40 50 60 70
-0.50 -0.25 0.00 0.25 0.50-3
-2
-1
0
1
2
3
I (nA
)
V (volt)
imum applied force values (17–20 nN), (B) semilog plots of resistance (R) againstins obtained at 0-force load condition by STS. Magnified view of the band gap regionef. [25]; (D) characteristic I–V response of bare HOPG surface obtained by CSAFS.
T. Rakshit, R. Mukhopadhyay / Journal of Colloid and Interface Science 388 (2012) 282–292 287
to the maximum of 65–66 nN, the R value became as low as 0.5–0.6 GX.
In Fig. 3C are shown the overlay of averaged I–V response of thefive ferritins as obtained from STS (0-force load condition) experi-ments. These curves appear quite similar to the curves obtained byCSAFS at the lowest force values (Fig. 3A). The same trend ofdecreasing band gaps, that is, a gradual decrease from apoferrtinto Mn(III)-ferritin to holoferritin to Co(III)-ferritin, and finally, noband gap for Cu(II)-ferritin was observed in both the cases. Impor-tantly, the electrical conductivities of the reconstituted ferritinsfollowed the same order as that relevant for the free metal conduc-tivities, as revealed from both the STS and CSAFS I–V responses.The I–V curves generated from bare substrate surfaces were gener-ally ‘‘Ohmic’’ in appearance, that is, the I–V behavior was symmet-ric and linear (Fig. 3D). With increasing applied load, no detectablechanges were observed. For most of the attempts, pre-amplifiersaturated due to direct contact between tip and the highly conduc-tive HOPG substrate.
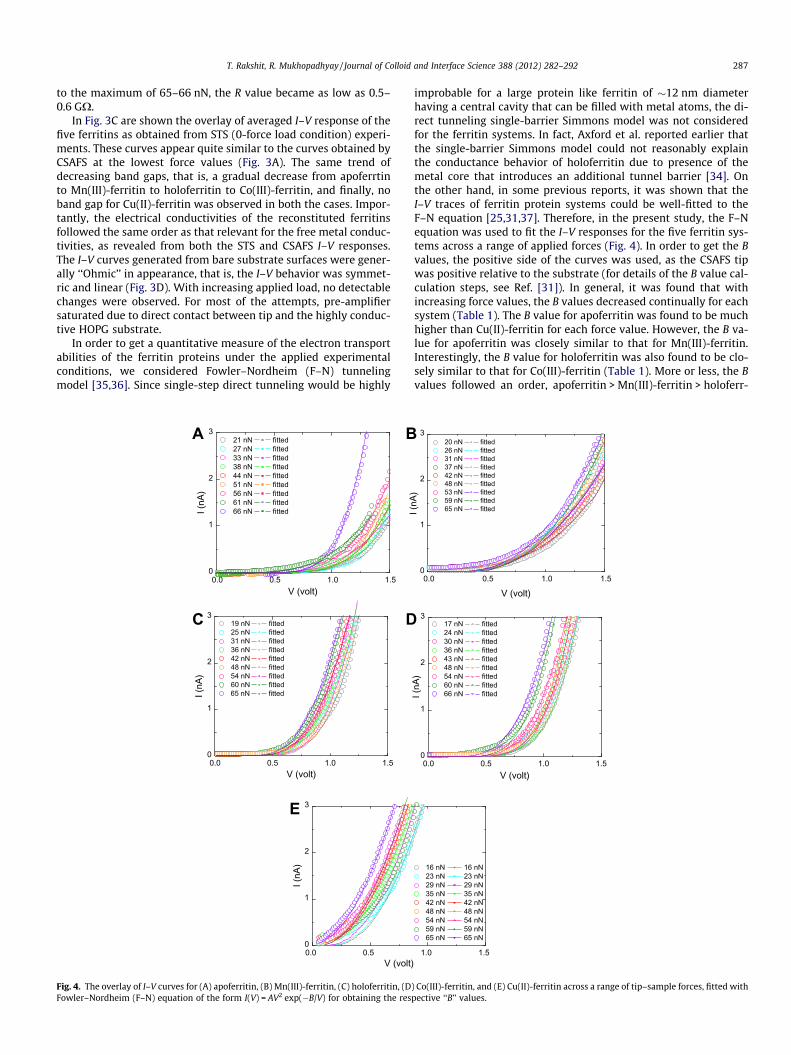
In order to get a quantitative measure of the electron transportabilities of the ferritin proteins under the applied experimentalconditions, we considered Fowler–Nordheim (F–N) tunnelingmodel [35,36]. Since single-step direct tunneling would be highly
D
E
B
C
A
0
1
2
3
I (nA
)
V (volt)
0
1
2
3
I (nA
)
V (volt)
21 nN fitted 27 nN fitted 33 nN fitted 38 nN fitted 44 nN fitted 51 nN fitted 56 nN fitted 61 nN fitted 66 nN fitted
0
1
2
3
I (nA
)
V (volt)
19 nN fitted 25 nN fitted 31 nN fitted 36 nN fitted 42 nN fitted 48 nN fitted 54 nN fitted 60 nN fitted65 nN fitted
0.0 0.5
0.0 0.5 1.0 1.5
0.0 0.5 1.0 1.5
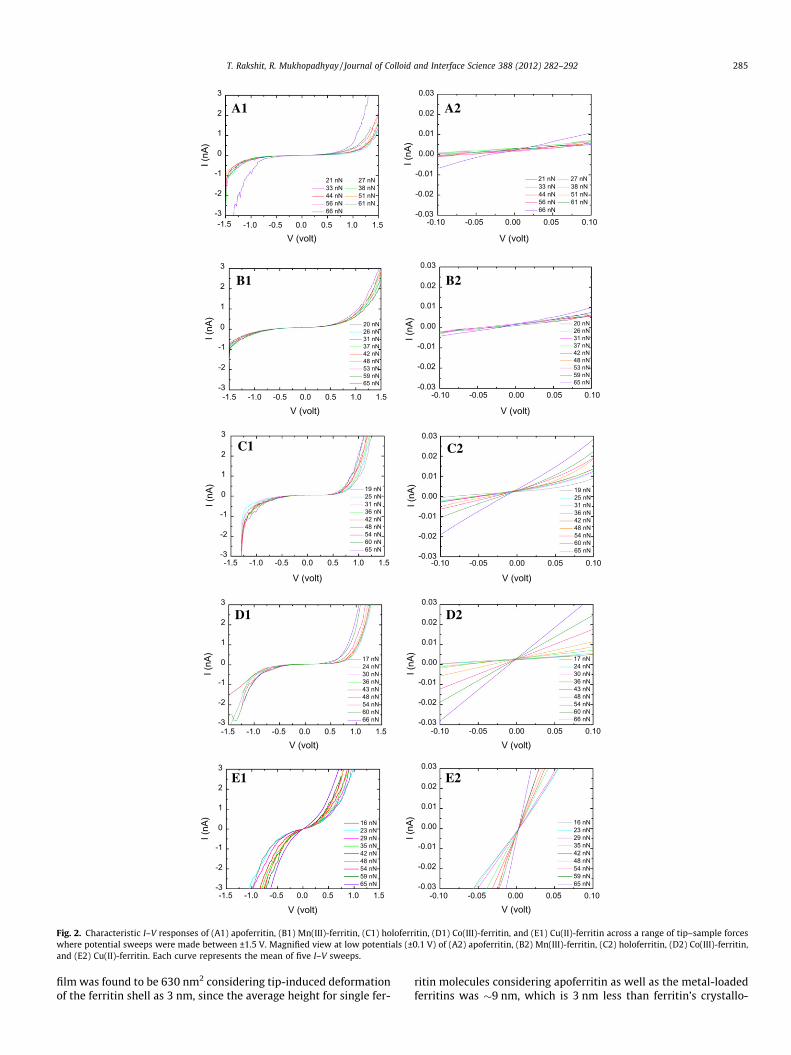
Fig. 4. The overlay of I–V curves for (A) apoferritin, (B) Mn(III)-ferritin, (C) holoferritin, (DFowler–Nordheim (F–N) equation of the form I(V) = AV2 exp(�B/V) for obtaining the res
improbable for a large protein like ferritin of �12 nm diameterhaving a central cavity that can be filled with metal atoms, the di-rect tunneling single-barrier Simmons model was not consideredfor the ferritin systems. In fact, Axford et al. reported earlier thatthe single-barrier Simmons model could not reasonably explainthe conductance behavior of holoferritin due to presence of themetal core that introduces an additional tunnel barrier [34]. Onthe other hand, in some previous reports, it was shown that theI–V traces of ferritin protein systems could be well-fitted to theF–N equation [25,31,37]. Therefore, in the present study, the F–Nequation was used to fit the I–V responses for the five ferritin sys-tems across a range of applied forces (Fig. 4). In order to get the Bvalues, the positive side of the curves was used, as the CSAFS tipwas positive relative to the substrate (for details of the B value cal-culation steps, see Ref. [31]). In general, it was found that withincreasing force values, the B values decreased continually for eachsystem (Table 1). The B value for apoferritin was found to be muchhigher than Cu(II)-ferritin for each force value. However, the B va-lue for apoferritin was closely similar to that for Mn(III)-ferritin.Interestingly, the B value for holoferritin was also found to be clo-sely similar to that for Co(III)-ferritin (Table 1). More or less, the Bvalues followed an order, apoferritin > Mn(III)-ferritin > holoferr-
16 nN 16 nN 23 nN 23 nN 29 nN 29 nN 35 nN 35 nN 42 nN 42 nN 48 nN 48 nN 54 nN 54 nN 59 nN 59 nN 65 nN 65 nN
0
1
2
3 20 nN fitted 26 nN fitted 31 nN fitted 37 nN fitted 42 nN fitted 48 nN fitted 53 nN fitted 59 nN fitted 65 nN fitted
V (volt)
I (nA
)
1.0 1.5
0.0 0.5 1.0 1.5
0.0 0.5 1.0 1.50
1
2
3
I (nA
)
V (volt)
17 nN fitted 24 nN fitted 30 nN fitted 36 nN fitted 43 nN fitted 48 nN fitted 54 nN fitted 60 nN fitted 66 nN fitted
) Co(III)-ferritin, and (E) Cu(II)-ferritin across a range of tip–sample forces, fitted withpective ‘‘B’’ values.
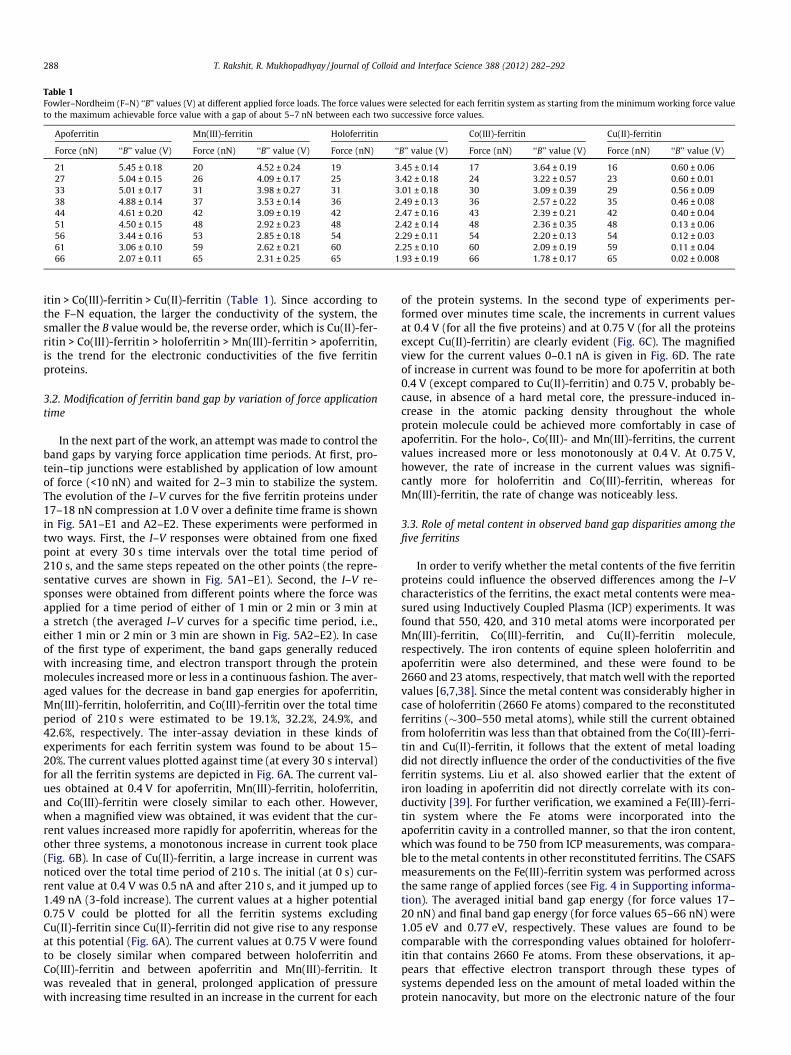
Table 1Fowler–Nordheim (F–N) ‘‘B’’ values (V) at different applied force loads. The force values were selected for each ferritin system as starting from the minimum working force valueto the maximum achievable force value with a gap of about 5–7 nN between each two successive force values.
Apoferritin Mn(III)-ferritin Holoferritin Co(III)-ferritin Cu(II)-ferritin
Force (nN) ‘‘B’’ value (V) Force (nN) ‘‘B’’ value (V) Force (nN) ‘‘B’’ value (V) Force (nN) ‘‘B’’ value (V) Force (nN) ‘‘B’’ value (V)
21 5.45 ± 0.18 20 4.52 ± 0.24 19 3.45 ± 0.14 17 3.64 ± 0.19 16 0.60 ± 0.0627 5.04 ± 0.15 26 4.09 ± 0.17 25 3.42 ± 0.18 24 3.22 ± 0.57 23 0.60 ± 0.0133 5.01 ± 0.17 31 3.98 ± 0.27 31 3.01 ± 0.18 30 3.09 ± 0.39 29 0.56 ± 0.0938 4.88 ± 0.14 37 3.53 ± 0.14 36 2.49 ± 0.13 36 2.57 ± 0.22 35 0.46 ± 0.0844 4.61 ± 0.20 42 3.09 ± 0.19 42 2.47 ± 0.16 43 2.39 ± 0.21 42 0.40 ± 0.0451 4.50 ± 0.15 48 2.92 ± 0.23 48 2.42 ± 0.14 48 2.36 ± 0.35 48 0.13 ± 0.0656 3.44 ± 0.16 53 2.85 ± 0.18 54 2.29 ± 0.11 54 2.20 ± 0.13 54 0.12 ± 0.0361 3.06 ± 0.10 59 2.62 ± 0.21 60 2.25 ± 0.10 60 2.09 ± 0.19 59 0.11 ± 0.0466 2.07 ± 0.11 65 2.31 ± 0.25 65 1.93 ± 0.19 66 1.78 ± 0.17 65 0.02 ± 0.008
288 T. Rakshit, R. Mukhopadhyay / Journal of Colloid and Interface Science 388 (2012) 282–292
itin > Co(III)-ferritin > Cu(II)-ferritin (Table 1). Since according tothe F–N equation, the larger the conductivity of the system, thesmaller the B value would be, the reverse order, which is Cu(II)-fer-ritin > Co(III)-ferritin > holoferritin > Mn(III)-ferritin > apoferritin,is the trend for the electronic conductivities of the five ferritinproteins.
3.2. Modification of ferritin band gap by variation of force applicationtime
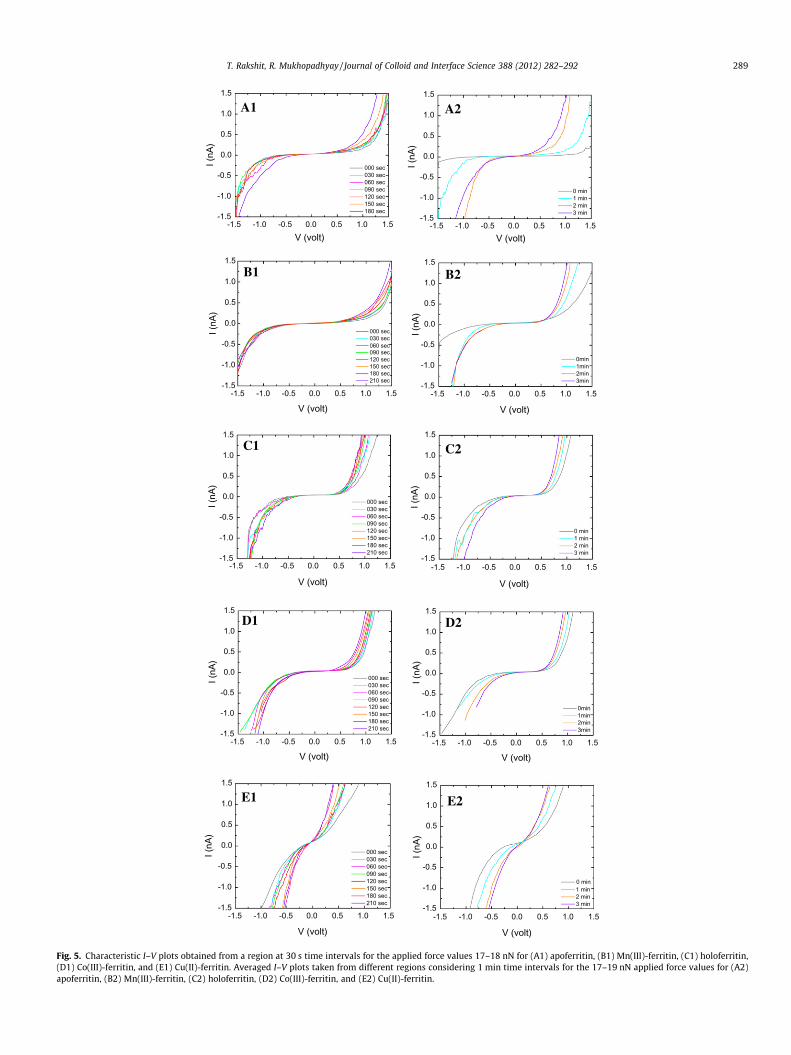
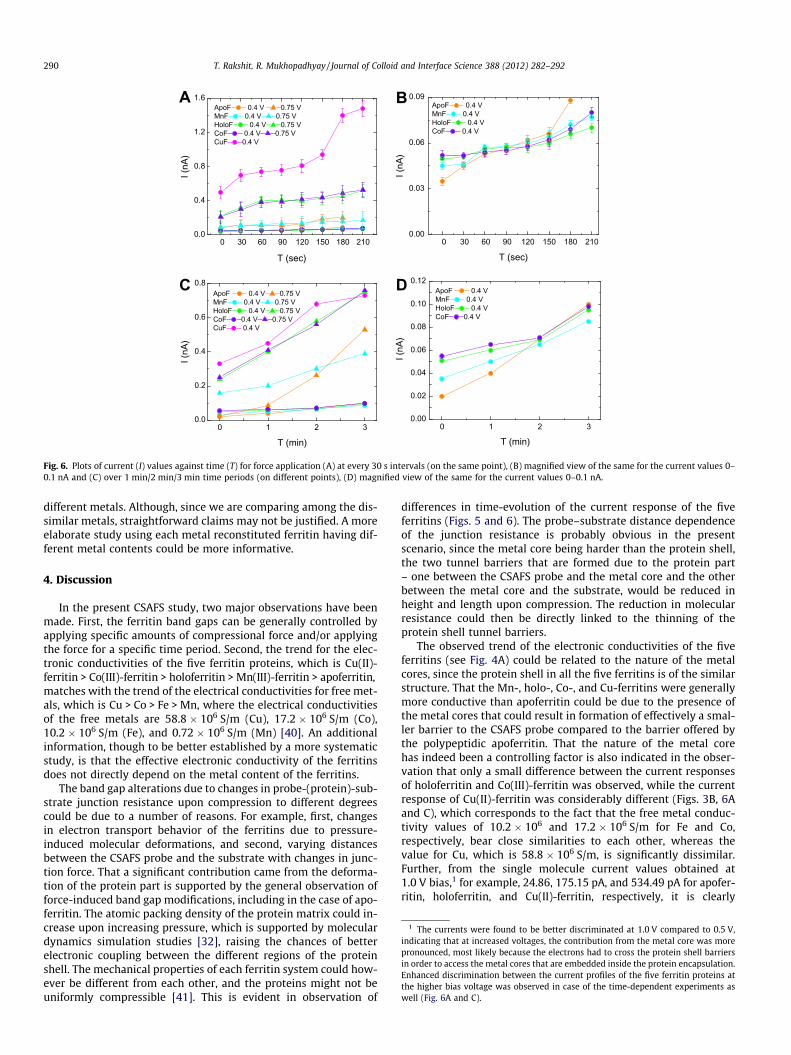
In the next part of the work, an attempt was made to control theband gaps by varying force application time periods. At first, pro-tein–tip junctions were established by application of low amountof force (<10 nN) and waited for 2–3 min to stabilize the system.The evolution of the I–V curves for the five ferritin proteins under17–18 nN compression at 1.0 V over a definite time frame is shownin Fig. 5A1–E1 and A2–E2. These experiments were performed intwo ways. First, the I–V responses were obtained from one fixedpoint at every 30 s time intervals over the total time period of210 s, and the same steps repeated on the other points (the repre-sentative curves are shown in Fig. 5A1–E1). Second, the I–V re-sponses were obtained from different points where the force wasapplied for a time period of either of 1 min or 2 min or 3 min ata stretch (the averaged I–V curves for a specific time period, i.e.,either 1 min or 2 min or 3 min are shown in Fig. 5A2–E2). In caseof the first type of experiment, the band gaps generally reducedwith increasing time, and electron transport through the proteinmolecules increased more or less in a continuous fashion. The aver-aged values for the decrease in band gap energies for apoferritin,Mn(III)-ferritin, holoferritin, and Co(III)-ferritin over the total timeperiod of 210 s were estimated to be 19.1%, 32.2%, 24.9%, and42.6%, respectively. The inter-assay deviation in these kinds ofexperiments for each ferritin system was found to be about 15–20%. The current values plotted against time (at every 30 s interval)for all the ferritin systems are depicted in Fig. 6A. The current val-ues obtained at 0.4 V for apoferritin, Mn(III)-ferritin, holoferritin,and Co(III)-ferritin were closely similar to each other. However,when a magnified view was obtained, it was evident that the cur-rent values increased more rapidly for apoferritin, whereas for theother three systems, a monotonous increase in current took place(Fig. 6B). In case of Cu(II)-ferritin, a large increase in current wasnoticed over the total time period of 210 s. The initial (at 0 s) cur-rent value at 0.4 V was 0.5 nA and after 210 s, and it jumped up to1.49 nA (3-fold increase). The current values at a higher potential0.75 V could be plotted for all the ferritin systems excludingCu(II)-ferritin since Cu(II)-ferritin did not give rise to any responseat this potential (Fig. 6A). The current values at 0.75 V were foundto be closely similar when compared between holoferritin andCo(III)-ferritin and between apoferritin and Mn(III)-ferritin. Itwas revealed that in general, prolonged application of pressurewith increasing time resulted in an increase in the current for each
of the protein systems. In the second type of experiments per-formed over minutes time scale, the increments in current valuesat 0.4 V (for all the five proteins) and at 0.75 V (for all the proteinsexcept Cu(II)-ferritin) are clearly evident (Fig. 6C). The magnifiedview for the current values 0–0.1 nA is given in Fig. 6D. The rateof increase in current was found to be more for apoferritin at both0.4 V (except compared to Cu(II)-ferritin) and 0.75 V, probably be-cause, in absence of a hard metal core, the pressure-induced in-crease in the atomic packing density throughout the wholeprotein molecule could be achieved more comfortably in case ofapoferritin. For the holo-, Co(III)- and Mn(III)-ferritins, the currentvalues increased more or less monotonously at 0.4 V. At 0.75 V,however, the rate of increase in the current values was signifi-cantly more for holoferritin and Co(III)-ferritin, whereas forMn(III)-ferritin, the rate of change was noticeably less.
3.3. Role of metal content in observed band gap disparities among thefive ferritins
In order to verify whether the metal contents of the five ferritinproteins could influence the observed differences among the I–Vcharacteristics of the ferritins, the exact metal contents were mea-sured using Inductively Coupled Plasma (ICP) experiments. It wasfound that 550, 420, and 310 metal atoms were incorporated perMn(III)-ferritin, Co(III)-ferritin, and Cu(II)-ferritin molecule,respectively. The iron contents of equine spleen holoferritin andapoferritin were also determined, and these were found to be2660 and 23 atoms, respectively, that match well with the reportedvalues [6,7,38]. Since the metal content was considerably higher incase of holoferritin (2660 Fe atoms) compared to the reconstitutedferritins (�300–550 metal atoms), while still the current obtainedfrom holoferritin was less than that obtained from the Co(III)-ferri-tin and Cu(II)-ferritin, it follows that the extent of metal loadingdid not directly influence the order of the conductivities of the fiveferritin systems. Liu et al. also showed earlier that the extent ofiron loading in apoferritin did not directly correlate with its con-ductivity [39]. For further verification, we examined a Fe(III)-ferri-tin system where the Fe atoms were incorporated into theapoferritin cavity in a controlled manner, so that the iron content,which was found to be 750 from ICP measurements, was compara-ble to the metal contents in other reconstituted ferritins. The CSAFSmeasurements on the Fe(III)-ferritin system was performed acrossthe same range of applied forces (see Fig. 4 in Supporting informa-tion). The averaged initial band gap energy (for force values 17–20 nN) and final band gap energy (for force values 65–66 nN) were1.05 eV and 0.77 eV, respectively. These values are found to becomparable with the corresponding values obtained for holoferr-itin that contains 2660 Fe atoms. From these observations, it ap-pears that effective electron transport through these types ofsystems depended less on the amount of metal loaded within theprotein nanocavity, but more on the electronic nature of the four
B1
E2 E1
D1
C1
A1
C2
D2
A2
B2
-1.5
-1.0
-0.5
0.0
0.5
1.0
1.5
I (nA
)
V (volt)
000 sec 030 sec 060 sec 090 sec 120 sec 150 sec 180 sec 210 sec
-1.5
-1.0
-0.5
0.0
0.5
1.0
1.5
I (nA
)
V (volt)
000 sec 030 sec 060 sec 090 sec 120 sec 150 sec 180 sec
-1.5
-1.0
-0.5
0.0
0.5
1.0
1.5
I (nA
)
V (volt)
000 sec 030 sec 060 sec 090 sec 120 sec 150 sec 180 sec 210 sec
-1.5
-1.0
-0.5
0.0
0.5
1.0
1.5
I (nA
)
V (volt)
0 min 1 min 2 min 3 min
-1.5
-1.0
-0.5
0.0
0.5
1.0
1.5
I (nA
)
V (volt)
0 min 1 min 2 min 3 min
-1.5
-1.0
-0.5
0.0
0.5
1.0
1.5
I (nA
)
V (volt)
0 min 1 min 2 min 3 min
-1.5
-1.0
-0.5
0.0
0.5
1.0
1.5
I (nA
)
V (volt)
000 sec 030 sec 060 sec 090 sec 120 sec 150 sec 180 sec 210 sec
-1.5
-1.0
-0.5
0.0
0.5
1.0
1.5
I (nA
)
V (volt)
0min 1min 2min 3min
-1.5
-1.0
-0.5
0.0
0.5
1.0
1.5
I (nA
)V (volt)
0min 1min 2min 3min
-1.5 -1.0 -0.5 0.0 0.5 1.0 1.5
-1.5
-1.0
-0.5
0.0
0.5
1.0
1.5
000 sec 030 sec 060 sec 090 sec 120 sec 150 sec 180 sec 210 sec
I (nA
)
V (volt)
-1.5 -1.0 -0.5 0.0 0.5 1.0 1.5
-1.5 -1.0 -0.5 0.0 0.5 1.0 1.5-1.5 -1.0 -0.5 0.0 0.5 1.0 1.5
-1.5 -1.0 -0.5 0.0 0.5 1.0 1.5 -1.5 -1.0 -0.5 0.0 0.5 1.0 1.5
-1.5 -1.0 -0.5 0.0 0.5 1.0 1.5-1.5 -1.0 -0.5 0.0 0.5 1.0 1.5
-1.5 -1.0 -0.5 0.0 0.5 1.0 1.5 -1.5 -1.0 -0.5 0.0 0.5 1.0 1.5
Fig. 5. Characteristic I–V plots obtained from a region at 30 s time intervals for the applied force values 17–18 nN for (A1) apoferritin, (B1) Mn(III)-ferritin, (C1) holoferritin,(D1) Co(III)-ferritin, and (E1) Cu(II)-ferritin. Averaged I–V plots taken from different regions considering 1 min time intervals for the 17–19 nN applied force values for (A2)apoferritin, (B2) Mn(III)-ferritin, (C2) holoferritin, (D2) Co(III)-ferritin, and (E2) Cu(II)-ferritin.
T. Rakshit, R. Mukhopadhyay / Journal of Colloid and Interface Science 388 (2012) 282–292 289
D C
0.0
0.2
0.4
0.6
0.8
I (nA
)
T (min)
ApoF 0.4 V 0.75 VMnF 0.4 V 0.75 VHoloF 0.4 V 0.75 VCoF 0.4 V 0.75 VCuF 0.4 V
0.00
0.02
0.04
0.06
0.08
0.10
0.12
I (n
A)
T (min)
ApoF 0.4 VMnF 0.4 VHoloF 0.4 VCoF 0.4 V
B A
0.00
0.03
0.06
0.09ApoF 0.4 V MnF 0.4 VHoloF 0.4 VCoF 0.4 V
I (nA
)
T (sec)
0 1 2 3 0 1 2 3
0 30 60 90 120 150 180 2100 30 60 90 120 150 180 2100.0
0.4
0.8
1.2
1.6ApoF 0.4 V 0.75 VMnF 0.4 V 0.75 VHoloF 0.4 V 0.75 VCoF 0.4 V 0.75 VCuF 0.4 V
I (nA
)
T (sec)
Fig. 6. Plots of current (I) values against time (T) for force application (A) at every 30 s intervals (on the same point), (B) magnified view of the same for the current values 0–0.1 nA and (C) over 1 min/2 min/3 min time periods (on different points), (D) magnified view of the same for the current values 0–0.1 nA.
1 The currents were found to be better discriminated at 1.0 V compared to 0.5 V,dicating that at increased voltages, the contribution from the metal core was more
ronounced, most likely because the electrons had to cross the protein shell barriersorder to access the metal cores that are embedded inside the protein encapsulation.
nhanced discrimination between the current profiles of the five ferritin proteins ate higher bias voltage was observed in case of the time-dependent experiments asell (Fig. 6A and C).
290 T. Rakshit, R. Mukhopadhyay / Journal of Colloid and Interface Science 388 (2012) 282–292
different metals. Although, since we are comparing among the dis-similar metals, straightforward claims may not be justified. A moreelaborate study using each metal reconstituted ferritin having dif-ferent metal contents could be more informative.
4. Discussion
In the present CSAFS study, two major observations have beenmade. First, the ferritin band gaps can be generally controlled byapplying specific amounts of compressional force and/or applyingthe force for a specific time period. Second, the trend for the elec-tronic conductivities of the five ferritin proteins, which is Cu(II)-ferritin > Co(III)-ferritin > holoferritin > Mn(III)-ferritin > apoferritin,matches with the trend of the electrical conductivities for free met-als, which is Cu > Co > Fe > Mn, where the electrical conductivitiesof the free metals are 58.8 � 106 S/m (Cu), 17.2 � 106 S/m (Co),10.2 � 106 S/m (Fe), and 0.72 � 106 S/m (Mn) [40]. An additionalinformation, though to be better established by a more systematicstudy, is that the effective electronic conductivity of the ferritinsdoes not directly depend on the metal content of the ferritins.
The band gap alterations due to changes in probe-(protein)-sub-strate junction resistance upon compression to different degreescould be due to a number of reasons. For example, first, changesin electron transport behavior of the ferritins due to pressure-induced molecular deformations, and second, varying distancesbetween the CSAFS probe and the substrate with changes in junc-tion force. That a significant contribution came from the deforma-tion of the protein part is supported by the general observation offorce-induced band gap modifications, including in the case of apo-ferritin. The atomic packing density of the protein matrix could in-crease upon increasing pressure, which is supported by moleculardynamics simulation studies [32], raising the chances of betterelectronic coupling between the different regions of the proteinshell. The mechanical properties of each ferritin system could how-ever be different from each other, and the proteins might not beuniformly compressible [41]. This is evident in observation of
differences in time-evolution of the current response of the fiveferritins (Figs. 5 and 6). The probe–substrate distance dependenceof the junction resistance is probably obvious in the presentscenario, since the metal core being harder than the protein shell,the two tunnel barriers that are formed due to the protein part– one between the CSAFS probe and the metal core and the otherbetween the metal core and the substrate, would be reduced inheight and length upon compression. The reduction in molecularresistance could then be directly linked to the thinning of theprotein shell tunnel barriers.
The observed trend of the electronic conductivities of the fiveferritins (see Fig. 4A) could be related to the nature of the metalcores, since the protein shell in all the five ferritins is of the similarstructure. That the Mn-, holo-, Co-, and Cu-ferritins were generallymore conductive than apoferritin could be due to the presence ofthe metal cores that could result in formation of effectively a smal-ler barrier to the CSAFS probe compared to the barrier offered bythe polypeptidic apoferritin. That the nature of the metal corehas indeed been a controlling factor is also indicated in the obser-vation that only a small difference between the current responsesof holoferritin and Co(III)-ferritin was observed, while the currentresponse of Cu(II)-ferritin was considerably different (Figs. 3B, 6Aand C), which corresponds to the fact that the free metal conduc-tivity values of 10.2 � 106 and 17.2 � 106 S/m for Fe and Co,respectively, bear close similarities to each other, whereas thevalue for Cu, which is 58.8 � 106 S/m, is significantly dissimilar.Further, from the single molecule current values obtained at1.0 V bias,1 for example, 24.86, 175.15 pA, and 534.49 pA for apofer-ritin, holoferritin, and Cu(II)-ferritin, respectively, it is clearly
inpinEthw
T. Rakshit, R. Mukhopadhyay / Journal of Colloid and Interface Science 388 (2012) 282–292 291
revealed that holoferritin is �7 times more conductive and Cu(II)-ferritin is �22 times more conductive than apoferritin, which moreor less correlate to the free metal conductivity values. At present,it is not clearly understood that why the free metal conductivityorder corresponds to the trend exhibited by the conductivities ofthe five ferritins. However, recently Kim et al. have shown in a studyon Co(III)-ferritin that the size of the cobalt nanoparticles could bereduced upon formation of metallic bonds [42], indicating that themetal atoms/ions could reside in closely interacting condition withinthe protein nanocavity, strengthening the chances of formation of anoverlapped zone between the valence band and the conduction bandas in case of bulk metals.
The mechanism of the observed compressional modulation ofelectronic conductivities of the ferritins could depend on the spe-cific core–shell structure of each of the proteins, since due toincreasing pressure application, the electronic behavior changeddifferently for each system (Figs. 3B and 6). The shell of the protein(which is identical for all) would be compressed first, but the com-pressibility of the metal core would depend on amount of metalatoms loaded into the protein cavity. Since apoferritin is devoidof any metal core, the extent of its compressibility would be thehighest, which is reflected in the most drastic nature of decreasein resistance as the force was increased beyond 60 nN (Fig. 3B),or in the highest rate of increase in the current values as the forceapplication time was increased (Fig. 6B–D). For the rests, the com-pressibility should follow the order holoferritin < Mn(III)-ferri-tin < Co(III)-ferritin < Cu(II)-ferritin depending on the amount ofmetal loading. Since no clear pattern that supports this order ofcompressibility could be detected (see Figs. 3B and 6), there mightnot be any straightforward relation existing between compressibil-ity and electronic responses for these four ferritin systems. Sincewe are comparing between different metals, the amount of metalspresent might not directly correlate to the compressibility of themetal core – the factors like geometry, crystallinity, or more pre-cisely how the metal atoms are bonded to each other inside thecore could be important. Interestingly, since the decrease in resis-tance values with increased force application was within one range(20–60 GX) for apo- and Mn-ferritin, another range (3–22 GX) forholo- and Co-ferritin, and a third another range (0.5–3 GX) for Cu-ferritin (Fig. 3B), and since the initial resistances at the minimumforce values can be grouped in a similar manner (see the resis-tances of apo- and Mn-ferritins, holo- and Co-ferritins, and Cu-fer-ritin for 15–20 nN force values in Fig. 3B), it follows that thecompression-induced reduction in the resistance values (withinthe force range applied in the present study) was primarily relatedto compression of the protein shell and not due to any drasticchange of the metal cores. The effects of compression of the proteinshell were most noticeable in case of the least conductive apo- andMn-ferritins, the least noticeable in case of the most conductiveCu-ferritin, and were intermediate in case of the holo- and Co-ferri-tins, since the magnitudes of the ranges for reduction of resistancevalues with increased force application were 40 (for apo- and Mn-ferritins), 19 (for holo- and Co-ferritins), and 2.5 (for Cu-ferritin).
5. Conclusion
Solid-state electron transport behavior of the metal core recon-stituted ferritins, where reconstitution has been carried out usingphysiological metals like Cu, Co, and Mn, has been studied usingCSAFS approach and compared to the behavior of iron-storage pro-tein holoferritin and the apo form, with an objective toward devel-opment of a series of protein-encapsulated metal assemblies withcontrollable electronic conductivities. The use of ferritin encapsu-lation has proved to be effective, probably because of the sur-
face-stable nature of the protein. It is evident from thecomparative (metal-to-metal) CSAFS results that the metal corehas direct contribution to conductivities at any particular force va-lue. The compressional modulation of the conductivities, however,appears to be primarily due to compression of the protein shell.Interestingly, more conductive the protein is, lesser its conductiv-ity can be modulated. We could obtain a quantitative idea on theelectronic behavior of the biocompatible metal–protein hybrid sys-tems like the ferritins in different pressure environments. Suchinformation could assist in tailoring the behavior of such systemsin relevant solid-state bioelectronic devices.
Acknowledgments
We gratefully acknowledge the financial support from DBT,Govt. of India (Grant No. BT/PR-11765/MED/32/107/2009), SERCFast Track scheme of DST, Govt. of India [Grant No. SR/FTP/CS-66/2006], the research fellowship of T.R. from IACS, Kolkata, andDr. S. Ray of Department of Material Science, IACS, Kolkata forICP measurements.
Appendix A. Supplementary material
Supplementary data associated with this article can be found, inthe online version, at http://dx.doi.org/10.1016/j.jcis.2012.08.028.
References
[1] I. Willner, Nat. Biotechnol. 19 (2001) 1023.[2] C.A. Rosi, C.A. Mirkin, Chem. Rev. 105 (2005) 1547.[3] I. Willner, B. Willner, Trends Biotechnol. 19 (2001) 222.[4] P.M. Harrison, P. Arosio, Biochim. Biophys. Acta 1275 (1996) 161.[5] P.M. Harrison, P. Arosio, Biochem. J. 288 (1992) 591.[6] L. Gutiérreza, F.J. Lázaroa, A.R. Abadíac, M.S. Romerod, C. Quintanae, M.
Moralesf, C. Patiñog, R. Arranzg, Inorg. Biochem. 100 (2006) 1790.[7] C.L. Snow, L.N. Martineau, R.J. Hilton, S. Brown, J. Farrer, J. Boerio-Goates, B.F.
Woodfield, R.K.J. Watt, Inorg. Biochem. 105 (2011) 972.[8] S.J. Granick, Biol. Chem. 146 (1942) 451.[9] T. Takahashi, S. Kuyucak, Biophys. J. 84 (2003) 2256.
[10] F.C. Meldrum, V.J. Wade, D.L. Nimmo, B.R. Hyewood, S. Mann, Nature 349(1991) 684.
[11] F.C. Meldrum, T. Douglas, S. Levi, P. Arosio, S. Mann, J. Inorg. Biochem. 58(1995) 59.
[12] T. Douglas, V.T. Stark, Inorg. Chem. 39 (2000) 1828.[13] H.A. Hosein, D.R. Strongin, M. Allen, T. Douglas, Langmuir 20 (2004) 10283.[14] T. Ueno, M. Suzuki, T. Goto, T. Matsumoto, K. Nagayama, Y. Watanabe, Angew.
Chem., Int. Ed. 43 (2004) 2527.[15] B. Zhang, J.N. Harb, R.C. Davis, J. Kim, S. Chu, S. Choi, T. Miller, G.D. Watt, Inorg.
Chem. 44 (2005) 3738.[16] N. Galvez, P. Sanchez, J.M. Domınguez-Vera, Dalton Trans. (2005) 2492.[17] O. Kasyutich, A. Ilari, A. Fiorillo, D. Tatchev, A. Hoell, P.J. Ceci, J. Am. Chem. Soc.
132 (2010) 3621.[18] R. Fan, S.W. Chew, V.V. Cheong, B.P. Orner, Small 6 (2010) 1483.[19] J. Jasinski, P. Petroff, Nanotechnology research directions: vision for
nanotechnology in the next decade, in: M.C. Roco, S. Williams, P. Alivisatos(Eds.), Applications: Nanodevices, Nanoelectronics, and Nanosensors, Springer,2000, p. 77 (Chapter 6).
[20] C.A. Martin, J.M. Ruitenbeek, H.S.J. Zant, Nanotechnology 21 (2010) 265201.[21] A.C. Cabe, S. Das, Nanotechnology 20 (2009) 165203.[22] A. Manekkathodi, M. Lu, C. Wang, L. Chen, Adv. Mater. 22 (2010) 4059.[23] M. Barua, Z. Abid, A nanoelectronic memory array design with improved
performance. IEEE (2008) 429. http://dx.doi.org/10.1109/CCECE.2008.4564570.
[24] Y. Ko, Y. Kim, H. Baek, J. Cho, ACS Nano 5 (2011) 9918.[25] T. Rakshit, R. Mukhopadhyay, Langmuir 27 (2011) 9681.[26] J. Yang, K. Takeyasu, A.P. Somlyo, Z. Shao, Ultramicroscopy 45 (1992) 199.[27] I.G. Macara, T.G. Hoy, P.M. Harrison, Biochem. J. 126 (1972) 151.[28] D.H. Lawson, P.M. Harrison, Nature 349 (1991) 541.[29] S.H. Banyard, D.K. Stammers, P.M. Harrison, Nature 271 (1978) 282.[30] C.Ta. Truong, M.T. Sykes, M.T. McDermott, Langmuir 14 (1998) 2435.[31] D. Xu, G.D. Watt, J.N. Harb, R.C. Davis, Nano Lett. 5 (2005) 571.[32] J. Zhao, J.J. Davis, N. Wang, M.S.P. Sansom, A. Hung, J. Am. Chem. Soc. 126
(2004) 5601.[33] D.J. Wold, C.D. Frisbie, J. Am. Chem. Soc. 123 (2001) 5549.[34] D.N. Axford, J.J. Davis, Nanotechnology 18 (2007) 145502.[35] R.H. Fowler, L. Nordheim, Proc. R. Soc. London, A 119 (1928) 173.

292 T. Rakshit, R. Mukhopadhyay / Journal of Colloid and Interface Science 388 (2012) 282–292
[36] R.H. Good Jr., E.W. Muller, Handbuch der Physik, vol. XXI, Springer-Verlag,Berlin, 1956, p. 176.
[37] T. Rakshit, S. Banerjee, R. Mukhopadhyay, Langmuir 26 (2010) 16005.[38] C.F.A. Bryce, R.R. Crichton, Biochem. J. 133 (1973) 301.[39] G. Liu, D.R. Strongin, Langmuir 22 (2006) 9313.
[40] C. Kittel, Introduction to Solid State Physics, fifth ed., Wiley Eastern, 1994, p.170.
[41] D.P. Kharakoz, Biophys. J. 79 (2000) 511.[42] J.W. Kim, S.H. Choi, P.T. Lillehei, S. Chu, G.C. King, G.D. Watt, Chem. Commun.
(2005) 4101.