Embed Size (px)
Citation preview

SOLUTION ADVANCED FINANCIAL REPORTING MAY 2013
Page 1 of 16
SOLUTION 1
a) i) Western Oil Company
Future costs associated with the acquisition/construction and use of non-current assets,
such as the environmental costs in this case, should be treated as a liability as soon as
they become unavoidable. For Western Oil, this would be at the same time as the
platform is acquired and brought into use. The provision is for the present value of the
expected costs and this same amount is treated as part of the cost of the asset. The
provision is ‘unwound’ by charging a finance cost to the statement of comprehensive
income each year and increasing the provision by the finance cost. Annual
depreciation of the asset effectively allocates the (discounted) environmental costs
over the life of the asset.
Statement of comprehensive income for the year ended 31 December 2012
GHc’000
Depreciation (see below) 36,900
Finance costs (GHc69 million x 8%) 5,520
Statement of financial position as at 31 December 2012
Non-current assets
Cost (GHC300 million + GHC69 million (GHC150 million x 0·46)) 369,000
Depreciation (over 10 years) (36,900)
332,100
Non-current liabilities
Environmental provision (GHC69 million x 1·08) 74,520
AMORTISED COST STATEMENT
Year
Beginning
E/R
25%
NUR
20%
ENB
Balance
Jan 2012 500,000 125,000
Income Stat
(100,000)
Cash flow
525,000
Stat. of Fin
Position
Income Stat. -- 2012 December
Int. Exp 125,000
Import loss 217,800
600,000 of
@ 75% for
3 years
Stat. of Fin. Position
Loan 307,200 307,200 PL
Import loss 217,800

SOLUTION ADVANCED FINANCIAL REPORTING MAY 2013
Page 2 of 16
ii) Asona Ltd
*In 2011
The Income statement for 2011 shows a depreciation of GHC100,000
(GHC2,000,000/20years)
The statement of financial position as at 31 December 2011 shows the following:
The asset at a carrying amount of GHC2,470,000 (under non-current assets)
A revaluation surplus of GHC570,000 (GHC2,470,000 – GHC1,900,000) is shown
under equity*
* Not required by the question
In 2012
Depreciation of GHC130,000 (GHC2,470,000/ 19 years(remaining useful life)) is
charged to income statement
A transfer should be made from revaluation surplus to retained earnings through the
statement of changes in equity of the excess depreciation of GHC30,000 (130,000
charged less 100,000 (1,900,000/19) based on the original cost) and thereby reducing
the revaluation surplus to GHC540,000
The carrying amount of the asset as at 31 December 2012 is now GHC2,340,000
(GHC2,470,000 – GHC130,000) but this should be reduced to the recoverable amount
of GHC1,600,000.
The impairment loss is GHC740,000, of which GHC540,000 should be recognized in
other comprehensive income (reducing the revaluation surplus to nil) and the
GHC200,000 remainder is recognized as an expense in the income statement
iii) Aboabo Ltd
The financial difficulty and granting of concession to Adom Ltd are both objective evidence
of impairment. The recoverable amount should be calculated as GHC307,200 by discounting
the GHC600,000 agreed repayment at the original effective interest rate of 25% over a
three year period (2012 -2015) (GHC600,000 X 1/1.253). An impairment loss of
GHC217,800 (525,000 -307,200) should be recognized at 31 December 2012.
Income Statement for 2012 (extracts)
Interest Income (25% of 500,000) 125,000
Impairment loss (217,800)

SOLUTION ADVANCED FINANCIAL REPORTING MAY 2013
Page 3 of 16
SOFP as at 31 December 2012
Non Current asset
Financial Asset 307,200
b) Demerits of Historical Cost Accounts
The net book values of non-current assets are often substantially below their current
value.
The Statement of Financial Position figure for inventory reflects prices ruling at the
date of purchase or manufacture rather than at the year- end.
Charges made in arriving at the profit do not reflect the current value of assets
consumed. The effect is to exaggerate the profit in real terms.
If the profit determined in this way were distributed in full, the level of operations
would have to be curtailed.
No account is taken of the effect of increasing prices on monetary items.
For example, the cash tied up in receivable increases even where the volume of
operation remains the same.
The overstatement of profits and the understatement of assets prevent a meaningful
calculation of return on capital employed.
Adherence to original historical costs leads inevitably to the misstatement of asset value
and profitability. Statement of Financial Position no longer represents a meaningful
representation of the economic state of affairs of a business.
As a result of the above, users of financial statements find it extremely difficult to
assess a company’s progress from year to year or to compare the results of different
operations.
The application of CCA
The basic concept underlying current cost accounting is that the firm is a going
concern which is continuously replacing its assets. Therefore the cost of consuming
such assets in the profit generation process should be equivalent to the cost of their
replacement. It focuses on the specific commodities and assets employed by the firm
taking into account changes in the price of such commodities and assets reflected in
specific price indices.
Current cost accounting is addressed to the concept of capital maintenance interpreted
as maintaining the operating capacity of the firm. It involves:

SOLUTION ADVANCED FINANCIAL REPORTING MAY 2013
Page 4 of 16
- Calculating current operating profit by matching current revenues with the current cost
of resources exhausted in earning those revenues.
- Calculating holding gains and losses
- Presenting the Statement of Financial Position in current value terms.
The current cost statement of comprehensive income is charged with the value to the
business of assets consumed during the period. In particular, the charges for consuming
inventory (cost of sales) and non-current assets (depreciation) are based on current
rather than historical values. This requires the following adjustments to be made to the
historic cost profit:
Cost of sale adjustments
Depreciation adjustment
Monetary Working Capital adjustment, and
Gearing adjustment
The current cost statement of financial position reflects the current value of inventory
and non-current assets. These are stated at current value to the business or deprival
values [the lower of replacement cost and recoverable amount
SOLUTION 2
(a) WORKINGS
Shareholdings
Tema Kumasi
Group Interest
160,000 x 100% 80 60
200,000
N C I 20 40
100 100
Reduction in NCI
80% x 20 16
Existing control 60 76%
SOLUTION ADVANCED FINANCIAL REPORTING MAY 2013
Page 5 of 16
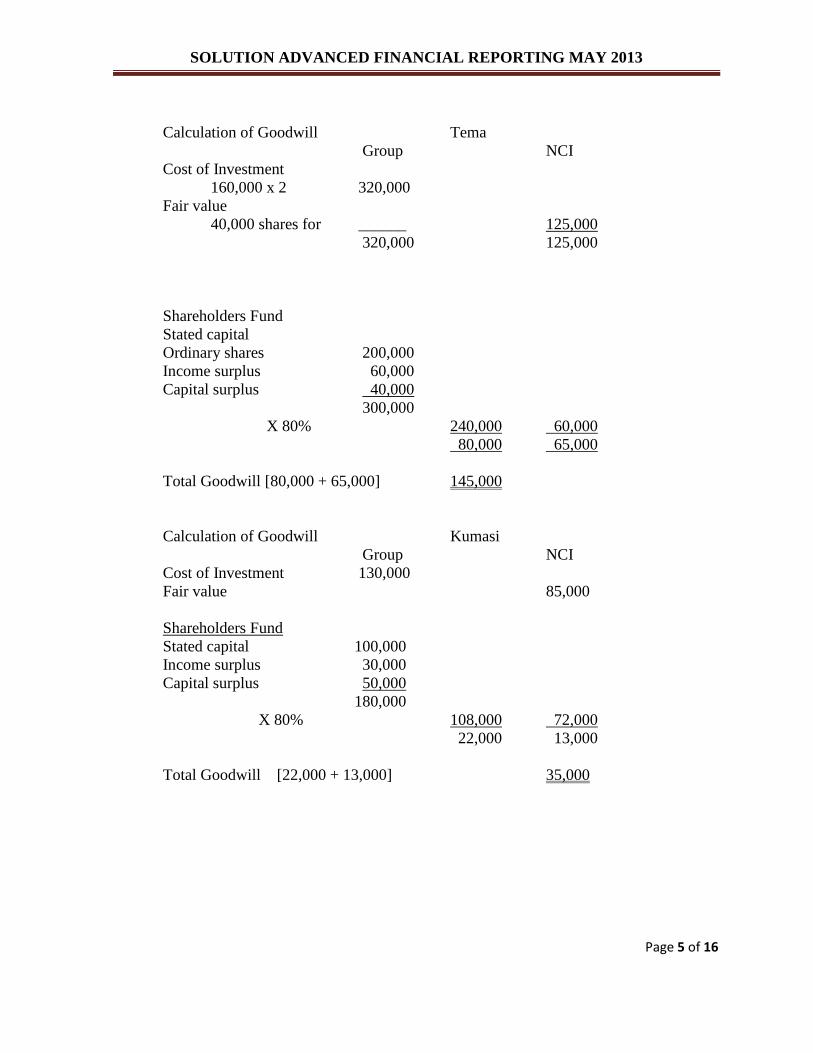
Calculation of Goodwill Tema
Group NCI
Cost of Investment
160,000 x 2 320,000
Fair value
40,000 shares for ______ 125,000
320,000 125,000
Shareholders Fund
Stated capital
Ordinary shares 200,000
Income surplus 60,000
Capital surplus 40,000
300,000
X 80% 240,000 60,000
80,000 65,000
Total Goodwill [80,000 + 65,000] 145,000
Calculation of Goodwill Kumasi
Group NCI
Cost of Investment 130,000
Fair value 85,000
Shareholders Fund
Stated capital 100,000
Income surplus 30,000
Capital surplus 50,000
180,000
X 80% 108,000 72,000
22,000 13,000
Total Goodwill [22,000 + 13,000] 35,000

SOLUTION ADVANCED FINANCIAL REPORTING MAY 2013
Page 6 of 16
Calculation of NCI
Tema Kumasi
Stated Capital
Ordinary shares
Income surplus
Capital surplus
NCI
Goodwill
NCI in Equity
Preference
200,000
100,000
80,000
380,000
20%
76,000
65,000
141,000
150,000
291,000
100,000
80,000
50,000
230,000
40%
92,000
13,000
105,000
20,000
125,000
[291,000 + 125,000] 416,000
Less Reduction of NCI (42,000)
374,000
Calculation of NCI Reduction
16 x 105,000 = 42,000
40
Other Equity
Cost of Investment 50,000
Reduction in NCI 42,000
- 8,000
Calculation of Income Surplus
GHC
Balance b/f 150,000
Post Acquisition
Tema (100,000 – 60,000) x 80% 32,000
Kumasi (80,000 – 30,000) x 60% 30,000
212,000
Less unrealised profit
25% x 20,000 (5,000)
20% x 5,000 1,000
Unrealised profit (15,000)
(19,000)
Balance c/d 193,000
SOLUTION ADVANCED FINANCIAL REPORTING MAY 2013
Page 7 of 16
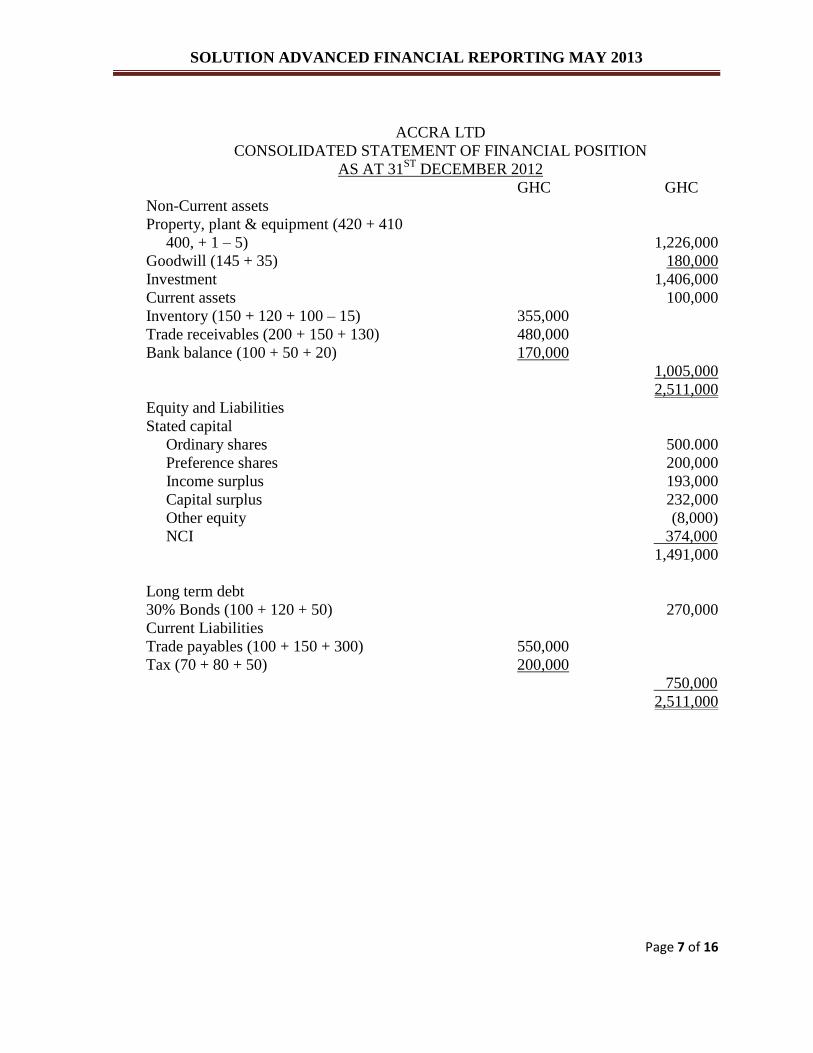
ACCRA LTD
CONSOLIDATED STATEMENT OF FINANCIAL POSITION
AS AT 31ST
DECEMBER 2012
GHC GHC
Non-Current assets
Property, plant & equipment (420 + 410
400, + 1 – 5)
Goodwill (145 + 35)
Investment
Current assets
Inventory (150 + 120 + 100 – 15)
Trade receivables (200 + 150 + 130)
Bank balance (100 + 50 + 20)
Equity and Liabilities
Stated capital
Ordinary shares
Preference shares
Income surplus
Capital surplus
Other equity
NCI
Long term debt
30% Bonds (100 + 120 + 50)
Current Liabilities
Trade payables (100 + 150 + 300)
Tax (70 + 80 + 50)
355,000
480,000
170,000
550,000
200,000
1,226,000
180,000
1,406,000
100,000
1,005,000
2,511,000
500.000
200,000
193,000
232,000
(8,000)
374,000
1,491,000
270,000
750,000
2,511,000

SOLUTION ADVANCED FINANCIAL REPORTING MAY 2013
Page 8 of 16
(b) Loan Gambia Subsidiary
January 2012 - Individual Account
Loan Amount GHC3m
Rate GHC1:15 D45m
31 December 2012
Loan Amount GHC3m
Rate GHC1:20 GHC60m
Exchange loss GHC15m
In Group Accounts
In Average Rate D15 m/17.5 = 857,143
Movement in Equity
In Gambia’s Book
15,000,000/20 750,000
Exchange loss 107,143
OR
In the separate financial statement of ABC Ltd, there is no exchange difference in the
entity’s financial statements, as the loan has been made in GHC.
In the foreign subsidiary’s financial statements, the loan is translated into its own
functional currency (D) at the rate of GHC1= D15, or D45 million as of January 1,
2012. At year-end, the closing rate will be used to translate this loan. This will result
in the loan being restated at D60 million (GHC3 million × 20), giving an exchange
loss of D15 million, which will be shown in the subsidiary’s income statement.
In the group financial statements, this exchange loss will be translated at the average
rate, as it is in the subsidiary’s income statement, giving a loss of (D15 million/17.5),
or approximately GHC857,000. This will be recognized in equity.
There will be a further exchange difference (gain) arising between the amount
included in the subsidiary’s income statement at the average rate and at the closing
rate: that is, GHC857,000 minus GHC750,000 (D15 million/20), or D107,000. Thus
the overall exchange difference is GHC750,000. This will be recognized in equity.

SOLUTION ADVANCED FINANCIAL REPORTING MAY 2013
Page 9 of 16
SOLUTION 3
(i) If the Company decides to windup
Break up values GHC GHC
Land & Buildings
Property, Plant & Equipment
Computers & Software
Investment
Inventories (46,700 – 6,200)
Trade receivables
- 60% - (38,400 x 60% x 0.15)
- 40% - (38,400 x 40% x 55%)
Less Liabilities
Bank overdraft
Trade payables
Liquidation expenses
Short term credit
Medium term facility
Interest on medium term (80,000 x 12% x 4 years)
Balance available
3,456
8,448
36,800
50,700
11,250
10,000
80,000
38,400
80,200
42,300
32,100
16,400
40,500
11,904
223,404
(227,150)
(3,746)
Preference shareholders 300,000
Preference share dividend (300,000 x 14% x 2 years) 84,000
Ordinary shareholders 100,000
(484,000)
Maximum Loss on Liquidation (487,746)
Analyzed as follows:
GHC
1) Ordinary Shareholders - 100,000 - 100%
2) Preference Shareholders - 374,000 - 100%
3) Medium term Creditors
[(80,000 + 38,400 – 104,654] ÷ 118,400) 13,746 11.6%
SOLUTION ADVANCED FINANCIAL REPORTING MAY 2013
Page 10 of 16
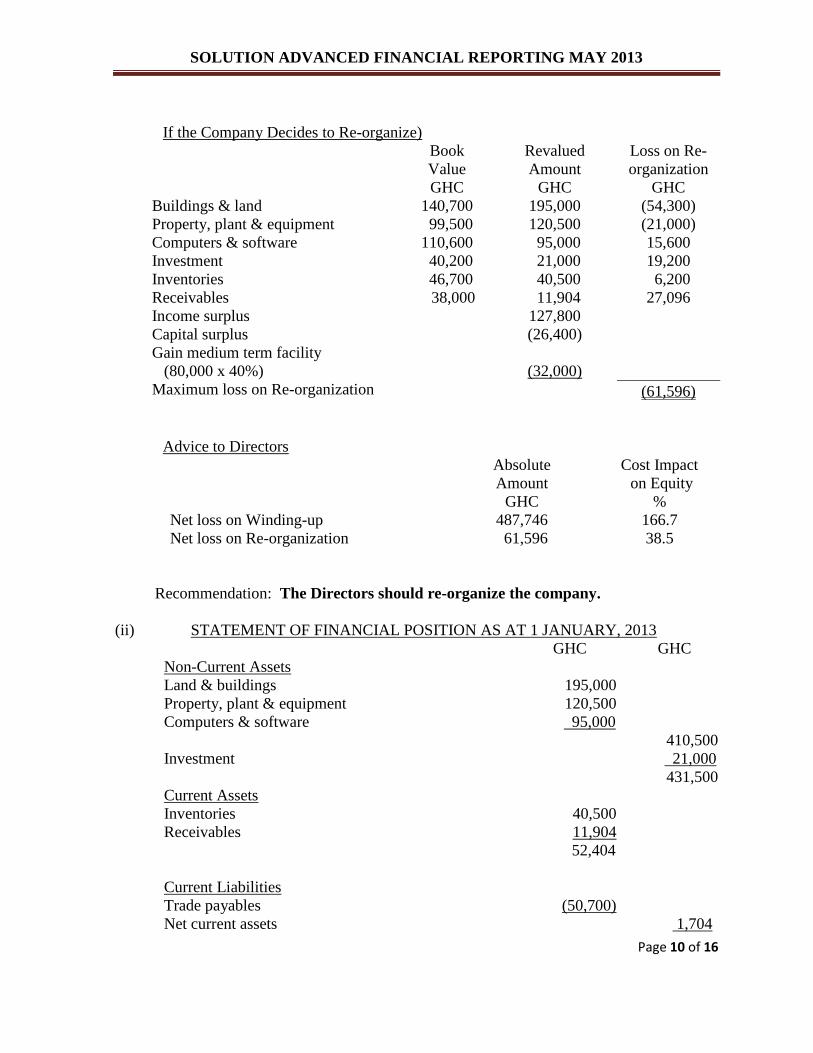
If the Company Decides to Re-organize)
Book
Value
GHC
Revalued
Amount
GHC
Loss on Re-
organization
GHC
Buildings & land
Property, plant & equipment
Computers & software
Investment
Inventories
Receivables
Income surplus
Capital surplus
Gain medium term facility
(80,000 x 40%)
Maximum loss on Re-organization
140,700
99,500
110,600
40,200
46,700
38,000
195,000
120,500
95,000
21,000
40,500
11,904
127,800
(26,400)
(32,000)
(54,300)
(21,000)
15,600
19,200
6,200
27,096
(61,596)
Advice to Directors
Absolute
Amount
GHC
Cost Impact
on Equity
%
Net loss on Winding-up
Net loss on Re-organization
487,746
61,596
166.7
38.5
Recommendation: The Directors should re-organize the company.
(ii) STATEMENT OF FINANCIAL POSITION AS AT 1 JANUARY, 2013
GHC GHC
Non-Current Assets
Land & buildings
Property, plant & equipment
Computers & software
Investment
Current Assets
Inventories
Receivables
Current Liabilities
Trade payables
Net current assets
195,000
120,500
95,000
40,500
11,904
52,404
(50,700)
410,500
21,000
431,500
1,704

SOLUTION ADVANCED FINANCIAL REPORTING MAY 2013
Page 11 of 16
Less 12% Medium Term Facility
Net Assets
Financed By:
Stated capital
385,204
433,204
(48,000)
385,204
Notes:
(i) Allocation of Loss on re-organization
Ordinary
Shares
GHC
Preference
Shares
GHC
Total
GHC
Balance b/f
Share of Loss
100,000
(61,596)
38,404
300,000
_______
300,000
400,000
(61,596)
338,404
(ii) Issue of Additional Shares
Bank Overdraft - 36,800
Short-Term Credit - 10,000
46,800
(iii) Stated Capital:
Ordinary shares - 38,404
Issues of shares - 46,800
Preference shares
85,204
300,000
385,204
SOLUTION ADVANCED FINANCIAL REPORTING MAY 2013
Page 12 of 16
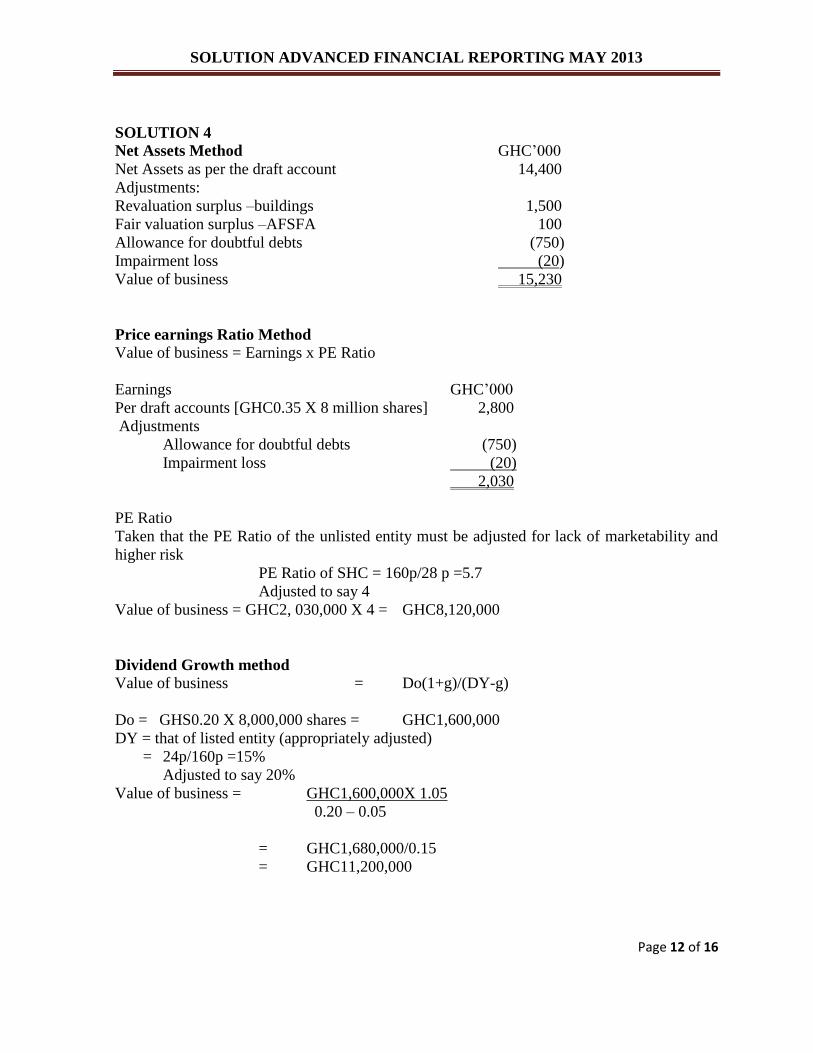
SOLUTION 4
Net Assets Method GHC’000
Net Assets as per the draft account 14,400
Adjustments:
Revaluation surplus –buildings 1,500
Fair valuation surplus –AFSFA 100
Allowance for doubtful debts (750)
Impairment loss (20)
Value of business 15,230
Price earnings Ratio Method
Value of business = Earnings x PE Ratio
Earnings GHC’000
Per draft accounts [GHC0.35 X 8 million shares] 2,800
Adjustments
Allowance for doubtful debts (750)
Impairment loss (20)
2,030
PE Ratio
Taken that the PE Ratio of the unlisted entity must be adjusted for lack of marketability and
higher risk
PE Ratio of SHC = 160p/28 p =5.7
Adjusted to say 4
Value of business = GHC2, 030,000 X 4 = GHC8,120,000
Dividend Growth method
Value of business = Do(1+g)/(DY-g)
Do = GHS0.20 X 8,000,000 shares = GHC1,600,000
DY = that of listed entity (appropriately adjusted)
= 24p/160p =15%
Adjusted to say 20%
Value of business = GHC1,600,000X 1.05
0.20 – 0.05
= GHC1,680,000/0.15
= GHC11,200,000
SOLUTION ADVANCED FINANCIAL REPORTING MAY 2013
Page 13 of 16
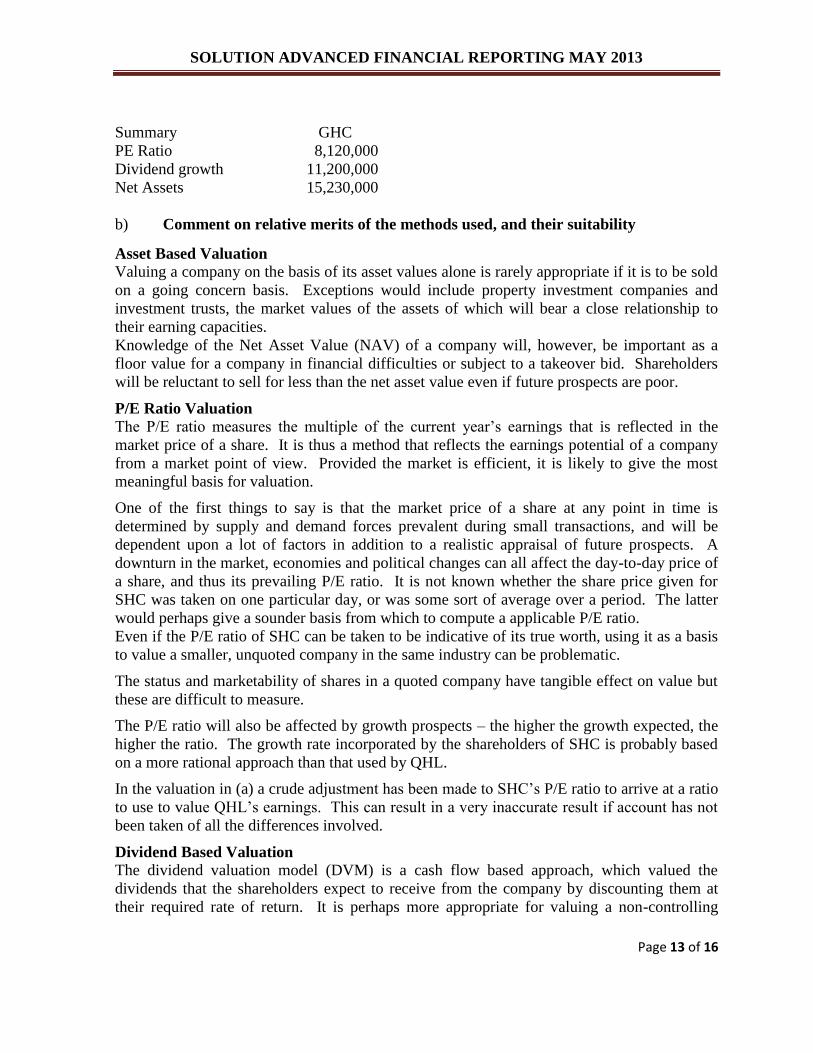
Summary GHC
PE Ratio 8,120,000
Dividend growth 11,200,000
Net Assets 15,230,000
b) Comment on relative merits of the methods used, and their suitability
Asset Based Valuation Valuing a company on the basis of its asset values alone is rarely appropriate if it is to be sold
on a going concern basis. Exceptions would include property investment companies and
investment trusts, the market values of the assets of which will bear a close relationship to
their earning capacities.
Knowledge of the Net Asset Value (NAV) of a company will, however, be important as a
floor value for a company in financial difficulties or subject to a takeover bid. Shareholders
will be reluctant to sell for less than the net asset value even if future prospects are poor.
P/E Ratio Valuation
The P/E ratio measures the multiple of the current year’s earnings that is reflected in the
market price of a share. It is thus a method that reflects the earnings potential of a company
from a market point of view. Provided the market is efficient, it is likely to give the most
meaningful basis for valuation.
One of the first things to say is that the market price of a share at any point in time is
determined by supply and demand forces prevalent during small transactions, and will be
dependent upon a lot of factors in addition to a realistic appraisal of future prospects. A
downturn in the market, economies and political changes can all affect the day-to-day price of
a share, and thus its prevailing P/E ratio. It is not known whether the share price given for
SHC was taken on one particular day, or was some sort of average over a period. The latter
would perhaps give a sounder basis from which to compute a applicable P/E ratio.
Even if the P/E ratio of SHC can be taken to be indicative of its true worth, using it as a basis
to value a smaller, unquoted company in the same industry can be problematic.
The status and marketability of shares in a quoted company have tangible effect on value but
these are difficult to measure.
The P/E ratio will also be affected by growth prospects – the higher the growth expected, the
higher the ratio. The growth rate incorporated by the shareholders of SHC is probably based
on a more rational approach than that used by QHL.
In the valuation in (a) a crude adjustment has been made to SHC’s P/E ratio to arrive at a ratio
to use to value QHL’s earnings. This can result in a very inaccurate result if account has not
been taken of all the differences involved.
Dividend Based Valuation The dividend valuation model (DVM) is a cash flow based approach, which valued the
dividends that the shareholders expect to receive from the company by discounting them at
their required rate of return. It is perhaps more appropriate for valuing a non-controlling
SOLUTION ADVANCED FINANCIAL REPORTING MAY 2013
Page 14 of 16
shareholding where the holder has no influence over the level of dividends to be paid than for
valuing a whole company, where the total cash flows will be of greater relevance.
The practical problems with the dividend valuation model lie mainly in its assumptions. Even
accepting that the required ‘perfect capital market’ assumptions may be satisfied to some
extent, in reality, the formula used in (a) assumes constant growth rates and constant required
rates of return in perpetuity.
Determination of an appropriate dividend yield/cost of equity is particularly difficult for an
unquoted company, and the use of an ‘equivalent’ quoted company’s data carries the same
drawbacks as discussed above. Similar problems arise in estimating future growth rates and
the results from the model are highly sensitive to changes in both these inputs.
It is also highly dependent upon the current year’s dividend being a representative base from
which to start.
The dividend valuation model valuation provided in (a) results in a higher valuation than that
under the P/E ratio approach. Reasons for this may be:
The share price of SHC may be currently depressed below its normal level, resulting
in an inappropriate low P/E ratio.
The adjustment to get to an appropriate P/E ratio for QHL may have been too harsh,
particularly in light of its apparently better growth prospects.
The dividend yield/cost of equity used in the dividend valuation model was that of
SHC. The validity of this will largely depend upon the relative levels of risk of the
two companies. Although they both operate the same type of business, the fact that
SHC sells its material externally means it is perhaps less reliant on a fixed customer
base.
Even if business risks and gearing risk may be thought to be comparable, a prospective
buyer of QHL may consider investment in a younger, unquoted company to carry
greater personal risk. His required return may thus be higher than that envisaged in
the dividend valuation model, reducing the valuation.
SOLUTION ADVANCED FINANCIAL REPORTING MAY 2013
Page 15 of 16
SOLUTION 5
Data Distribution Ltd
Assessment
Profitability
The company’s gross profit margin is strengthening due to the South Korean phone, which
can be purchased at very competitive prices and still be sold at half the price of competitive
products. This can be further illustrated by comparing the 207% increase in revenue with a
285% increase in gross profit.
Similarly, overheads have only increased by 199%, even including one-off relocation
expenses. Therefore, costs are being controlled despite the expansion, and the net margin is
also strengthening. However, the overheads do not include all charges for advertising (see
below). If these were included net profit would clearly fall. In addition, the company’s
warranty provisions do not appear to be calculated correctly and the expense is probably
understated.
Return on capital employed has improved on the previous year, as the company has turned
from a loss-making position to a profit. However, ROCE may be misleading as there is some
doubt as to the suitability of capitalizing advertising expenditure and/or the cost of
distribution rights. If these were charged as expenses, the company would continue to be in a
loss-making position.
The improving profitability of the company is very reliant on the continued success of the
South Korean phone, and in rapidly changing industry, this cannot be guaranteed.
Liquidity
Liquidity has deteriorated in the period, as evidence by both the current and quick ratios. The
company has insufficient current assets from which to meet its current liabilities as they fall
due.
This is coupled with very clear signs of overtrading, whereby the inventory turnover ratio has
increased dramatically on the previous year. The company is holding very low levels of
inventory compared to its increased levels of revenue, which may result in stock-outs and loss
of goodwill. This low level of inventory appears to be caused by insufficient funds to finance
the purchase of inventory. The company must raise further long-term finance if serious
liquidity problems are to be avoided.
Solvency The company is highly geared. Moreover, the gearing ratio in the appendix does not include
the excessive overdraft included in current liabilities. Hence, actual gearing is even higher.
Similarly, interest cover at 1.6 times is poor.
The company must raise more funds to survive, particularly if further expansion is to
continue. However, lenders will see Data Distributors ltd as a high risk investment and will
therefore expect a high return.
SOLUTION ADVANCED FINANCIAL REPORTING MAY 2013
Page 16 of 16
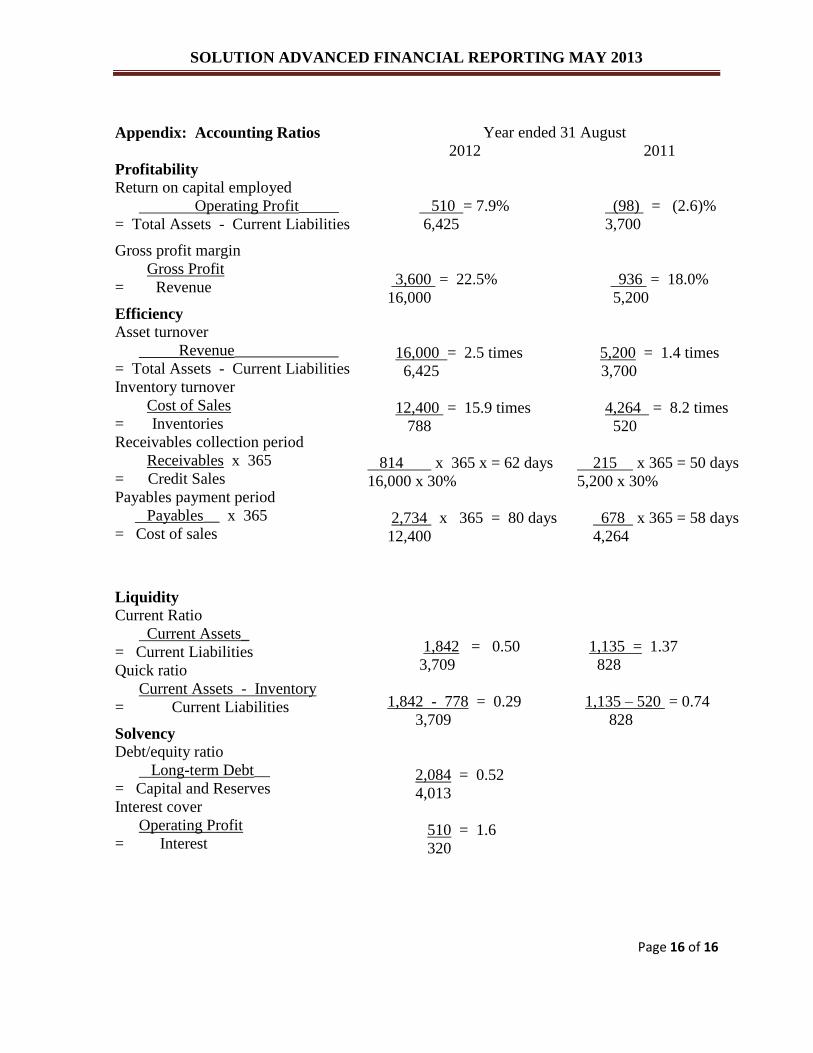
Appendix: Accounting Ratios Year ended 31 August
2012 2011
Profitability
Return on capital employed
Operating Profit_____
= Total Assets - Current Liabilities
Gross profit margin
Gross Profit
= Revenue
Efficiency
Asset turnover
Revenue_____________
= Total Assets - Current Liabilities
Inventory turnover
Cost of Sales
= Inventories
Receivables collection period
Receivables x 365
= Credit Sales
Payables payment period
Payables__ x 365
= Cost of sales
Liquidity
Current Ratio
Current Assets_
= Current Liabilities
Quick ratio
Current Assets - Inventory
= Current Liabilities
Solvency
Debt/equity ratio
Long-term Debt__
= Capital and Reserves
Interest cover
Operating Profit
= Interest
510 = 7.9%
6,425
3,600 = 22.5%
16,000
16,000 = 2.5 times
6,425
12,400 = 15.9 times
788
814 x 365 x = 62 days
16,000 x 30%
2,734 x 365 = 80 days
12,400
1,842 = 0.50
3,709
1,842 - 778 = 0.29
3,709
2,084 = 0.52
4,013
510 = 1.6
320
(98) = (2.6)%
3,700
936 = 18.0%
5,200
5,200 = 1.4 times
3,700
4,264 = 8.2 times
520
215 x 365 = 50 days
5,200 x 30%
678 x 365 = 58 days
4,264
1,135 = 1.37
828
1,135 – 520 = 0.74
828