Embed Size (px)
Citation preview
SOMCRelationships Dashboard – SOMCRelationships Dashboard – FY 12 FY 12 Patient-Centered Perfection is the Goal
Safety Quality Service Relationships Performance
Indicator Goal ? Jul Aug Sep Oct Nov Dec Jan FebMar
Apr May Jun YTD
Improve Employee Relationships
Overall Partnership * 100th ? 99 99
EOS – Systems and Leadership * 100th ? 99 99
EOS – Resources * 100th ? 98 98
EOS – Teamwork * 100th ? 98 98
EOS – Direct Management * 100th ? 99 99
EOS – Job Engagement * 100th ? 99 99
EOS – Work Engagement * 100th ? 98 98
EOS – Organizational Engagement * 100th ? 97 97
Employee Voluntary Retention Rate 100% ? 92.3 92.6 93 93 93.2 93.3 93.1 92.9 93.1 93.1 92.9 92.4 92.4
* EOS Reported Annually
Tasklist Goal = Perfection ? = Explanation/Calculation
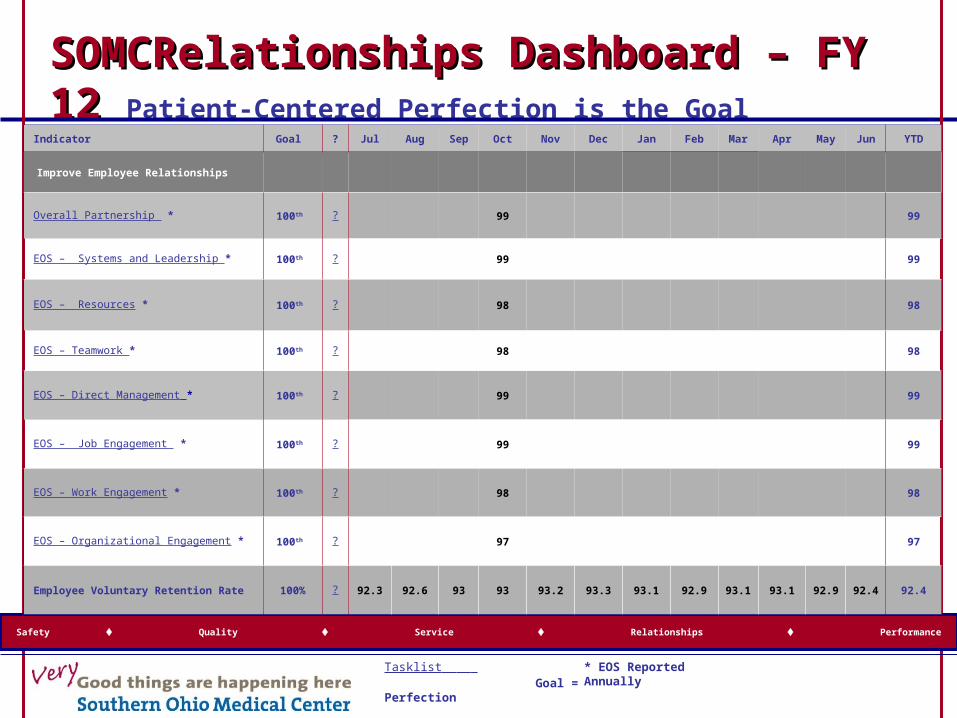
Safety Quality Service Relationships Performance
Indicator Goal ? Jul Aug Sep Oct Nov Dec Jan Feb Mar Apr May Jun YTD
Improve Physician Relationships
PRC – Physician Perception -Nursing Care * 100th ? 93.6 93.6 93.6 90.3 97.8 97.5 97.1 97.1 96 97 97
PRC – Physician Perception – Quality of Care * 100th ? 81.2 73 73 72 92.9 91.5 93.4 93.4 93.4 95 95
PRC – Physician Perception -Administration * 100th ? 74.7 79 79 76 85.2 83.3 86.5 86.5 86.5 89 89
Overall Physician Retention Rate * 100th ? 85.8 86.1 87.0 87.4 87.7 83.3 84.7 83.8 83.1 82.9 83.7 81.4 81.4
Improve Community Relationships
Percentage of Primary Market Share for Outpatients
100% ? 81.6 81.6
Percentage of Primary Market Share for Inpatient Admissions
100% ? 70.6 70.6
Percentage of Total Market Share Percentage of Outpatients
100% ? 44.2 44.2
Percentage of Total Market Share for Inpatient Admissions
100% ? 35.6 35.6
YTD Rate of Perfection 86.7%
* PRC- Reported Annually
Tasklist Goal = Perfection ? = Explanation/Calculation
SOMCRelationships Dashboard – SOMCRelationships Dashboard – FY 12 FY 12 Patient-Centered Perfection is the Goal

S a f e t y Q u a l I t y S e r v I c e R e l a t I o n s h I p s P e r f o r m a n c e
WhatWhat questionsquestions do you have?do you have?
www.somc.org