Embed Size (px)
Citation preview
S O N O C O 2 0 1 8 A N N U A L R E P O R T
120
Years
of
Sonoco
Strong
A B O U T T H E C O V E R
STRENGTH TAKES MANY FORMS. This year, Sonoco showed the strength to rise from a literal disaster: a hurricane that caused the worst flooding to impact our business in our company’s 120-year history. The damage was significant, but the recovery was remarkable. Through the hard work of hundreds of people, we were able to resume full operations several weeks earlier than scheduled.
Meanwhile, 2018 tested Sonoco through accelerating inflation, tariffs, the threat of escalating trade wars, and the impact of economic and social change around the world. Despite these considerable headwinds, our Company produced extremely strong results in 2018, including record top-line, bottom-line and cash flow results, while further strengthening our balance sheet. For the second consecutive year, Sonoco was selected for Fortune’s World’s Most
Admired Companies in the packaging/contain-ers sector, and named first in its industry.
This is what we mean when we say we’re Sonoco Strong. And as we reflect on how our Company has developed and strengthened over the past 120 years, we plan to build an even stronger company over the next 120.
Forward-looking StatementsStatements included in this Report that
are not historical in nature are intended to be
and are hereby identified as “forward-looking statements”
for purposes of the safe harbor provided by Section 21E of
the Securities Exchange Act of 1934, as amended. Additional
information about “forward-looking statements” is available
on page 3 of the enclosed Form 10-K.
Pursuant to the requirements of Regulation G, the Company
has provided definitions of non-GAAP measures discussed
in this report along with reconciliations of those measures to
the most closely related GAAP measure on page 19 of the
enclosed Form 10-K and on the Company’s website at
www.sonoco.com.
S O N O C O 2 0 1 8 A N N U A L R E P O R T
Table of ContentsTable of Contents
1 Financial Highlights
2 Sonoco at a Glance
4 Letter to Shareholders
9 Consumer Strategy
12 Industrial Strategy
13 Conitex Acquisition
14 Sonoco Strong
15 People, Culture and Values
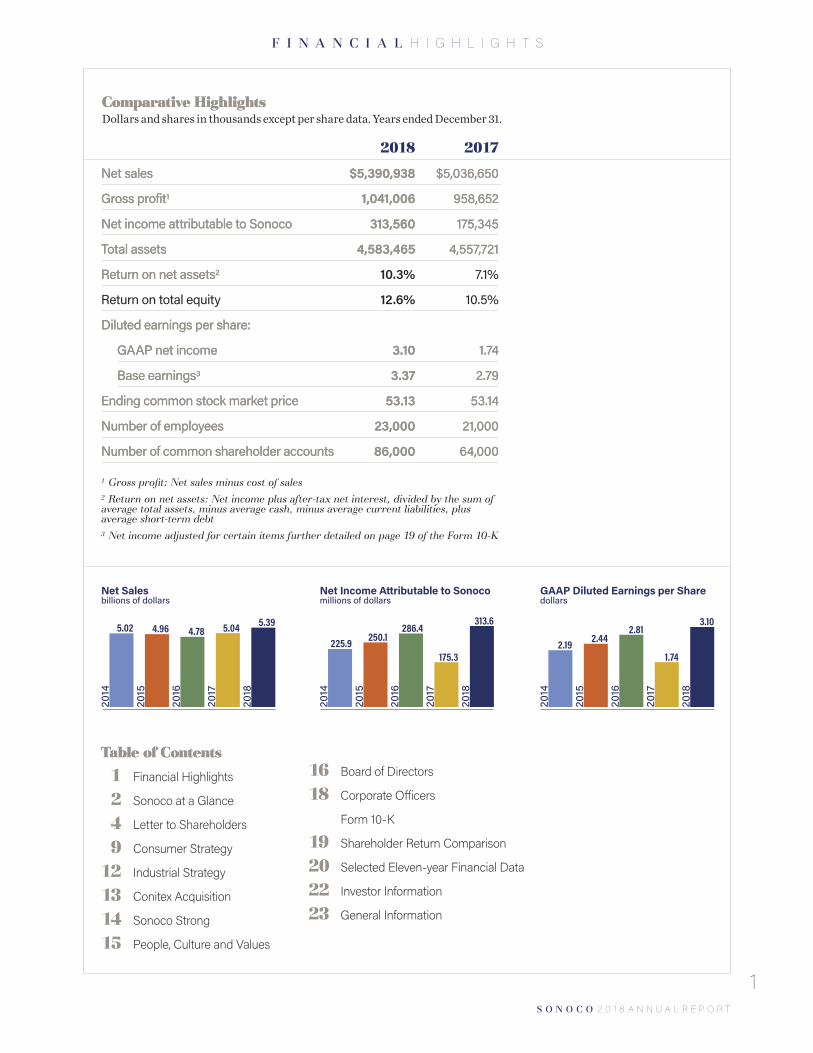
1 Gross profit: Net sales minus cost of sales2 Return on net assets: Net income plus after-tax net interest, divided by the sum of average total assets, minus average cash, minus average current liabilities, plus average short-term debt3 Net income adjusted for certain items further detailed on page 19 of the Form 10-K
Comparative HighlightsComparative Highlights Dollars and shares in thousands except per share data. Years ended December 31.
2018 2017
Net sales Net sales $5,390,938$5,390,938 $5,036,650$5,036,650
Gross profitGross profit11 1,041,0061,041,006 958,652958,652
Net income attributable to Sonoco Net income attributable to Sonoco 313,560313,560 175,345175,345
Total assets Total assets 4,583,4654,583,465 4,557,7214,557,721
Return on net assetsReturn on net assets22 10.3% 7.1%
Return on total equity 12.6% 10.5%
Diluted earnings per share: Diluted earnings per share:
GAAP net income GAAP net income 3.103.10 1.741.74
Base earningsBase earnings33 3.373.37 2.792.79
Ending common stock market price Ending common stock market price 53.1353.13 53.1453.14
Number of employees Number of employees 23,00023,000 21,00021,000
Number of common shareholder accountsNumber of common shareholder accounts 86,00086,000 64,00064,000
1
F I N A N C I A L H I G H L I G H T S
313.6
Net Income Attributable to Sonoco millions of dollars
175.3
286.4250.1225.9
2018
2017
2016
2015
2014
5.39
Net Sales billions of dollars
5.044.784.965.02
2018
2017
2016
2015
2014
3.10
GAAP Diluted Earnings per Share dollars
1.74
2.812.442.19
2018
2017
2016
2015
2014
16 Board of Directors
18 Corporate Officers
Form 10-K
19 Shareholder Return Comparison
20 Selected Eleven-year Financial Data
22 Investor Information
23 General Information
S O N O C O 2 0 1 8 A N N U A L R E P O R T
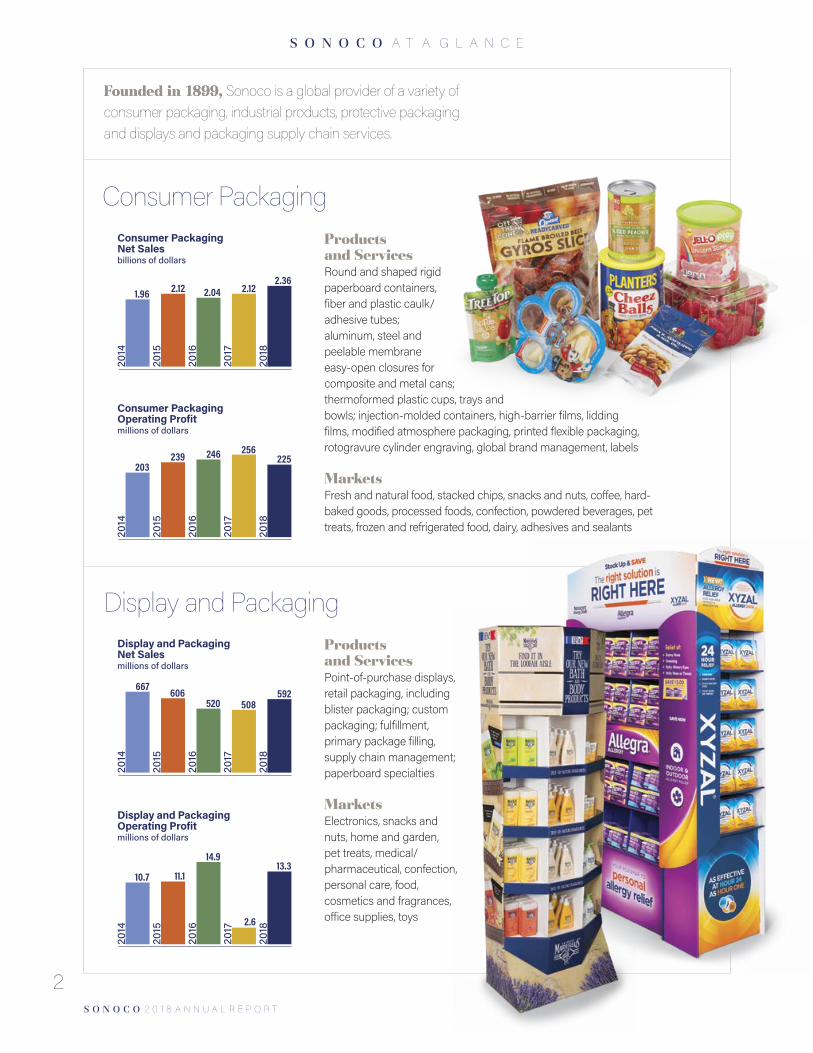
Consumer PackagingProducts and ServicesRound and shaped rigid paperboard containers, fiber and plastic caulk/adhesive tubes; aluminum, steel and peelable membrane easy-open closures for composite and metal cans; thermoformed plastic cups, trays and bowls; injection-molded containers, high-barrier films, lidding films, modified atmosphere packaging, printed flexible packaging, rotogravure cylinder engraving, global brand management, labels
MarketsFresh and natural food, stacked chips, snacks and nuts, coffee, hard-baked goods, processed foods, confection, powdered beverages, pet treats, frozen and refrigerated food, dairy, adhesives and sealants
2.36
Consumer Packaging Net Sales billions of dollars
2.122.042.121.96
2018
2017
2016
2015
2014
225
Consumer Packaging Operating Profit millions of dollars
256246239203
2018
2017
2016
2015
2014
Products and ServicesPoint-of-purchase displays, retail packaging, including blister packaging; custom packaging; fulfillment, primary package filling, supply chain management; paperboard specialties
MarketsElectronics, snacks and nuts, home and garden, pet treats, medical/ pharmaceutical, confection, personal care, food, cosmetics and fragrances, office supplies, toys
Display and Packaging
13.3
Display and Packaging Operating Profit millions of dollars
2.6
14.9
11.110.7
2018
2017
2016
2015
2014
592
Display and Packaging Net Sales millions of dollars
508520606667
2018
2017
2016
2015
2014
Founded in 1899,Founded in 1899, Sonoco is a global provider of a variety of consumer packaging, industrial products, protective packaging and displays and packaging supply chain services.
2
S O N O C O A T A G L A N C E
S O N O C O 2 0 1 8 A N N U A L R E P O R T
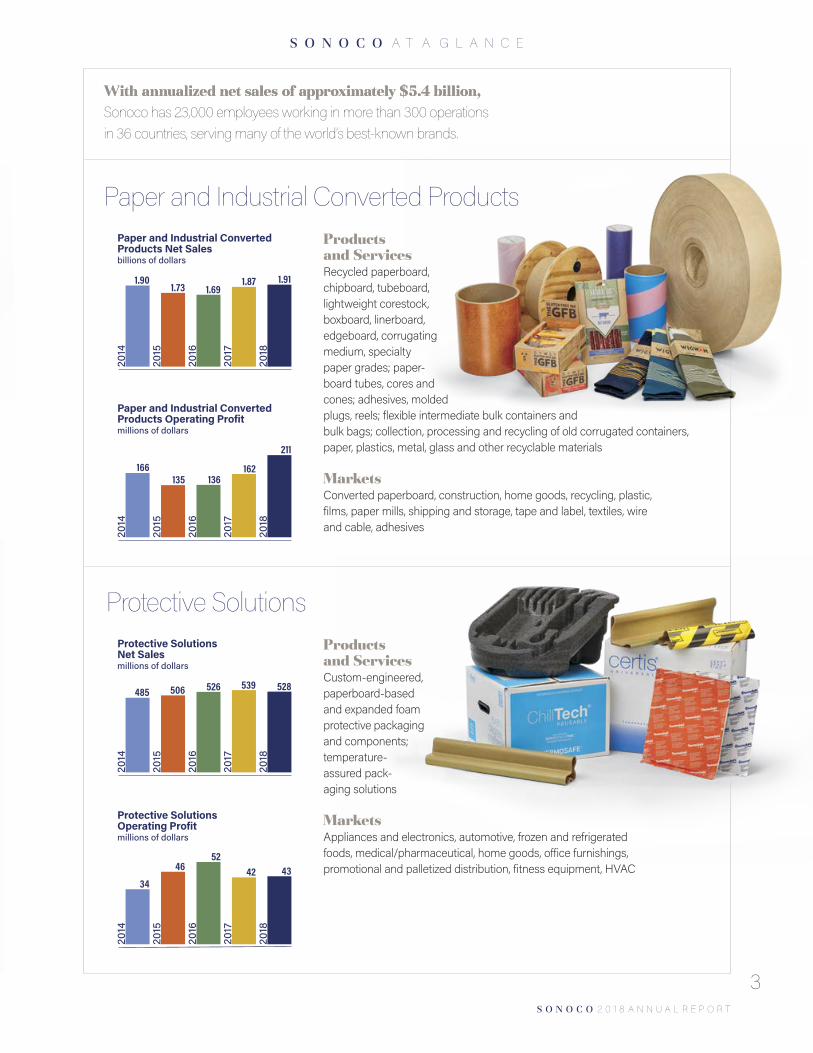
1.91
Paper and Industrial Converted Products Net Sales billions of dollars
1.871.691.73
1.90
2018
2017
2016
2015
2014
211
Paper and Industrial Converted Products Operating Profit millions of dollars
162136135
166
2018
2017
2016
2015
2014
Paper and Industrial Converted Products
Protective Solutions
43
Protective Solutions Operating Profit millions of dollars
4252
46
34
2018
2017
2016
2015
2014
528
Protective Solutions Net Sales millions of dollars
539526506485
2018
2017
2016
2015
2014
With annualized net sales of approximately $5.4 billion,With annualized net sales of approximately $5.4 billion, Sonoco has 23,000 employees working in more than 300 operations in 36 countries, serving many of the world’s best-known brands.
S O N O C O A T A G L A N C E
3
Products and ServicesRecycled paperboard, chipboard, tubeboard, lightweight corestock, boxboard, linerboard, edgeboard, corrugating medium, specialty paper grades; paper-board tubes, cores and cones; adhesives, molded plugs, reels; flexible intermediate bulk containers and bulk bags; collection, processing and recycling of old corrugated containers, paper, plastics, metal, glass and other recyclable materials
MarketsConverted paperboard, construction, home goods, recycling, plastic, films, paper mills, shipping and storage, tape and label, textiles, wire and cable, adhesives
Products and ServicesCustom-engineered, paperboard-based and expanded foam protective packaging and components; temperature-assured pack-aging solutions
MarketsAppliances and electronics, automotive, frozen and refrigerated foods, medical/pharmaceutical, home goods, office furnishings, promotional and palletized distribution, fitness equipment, HVAC
S O N O C O 2 0 1 8 A N N U A L R E P O R T
4
T O O U R S H A R E H O L D E R S
2018 WAS A YEAR
THAT TESTED THE
STRENGTH AND
RESOLVE OF OUR
COMPANY both
figuratively and literally.
We faced hurricanes,
accelerating inflation,
tariffs, the threat of
escalating trade wars,
and the impact of
economic and social change
in countries around the world.
Despite those considerable headwinds, our Company
produced extremely strong results in 2018, including
record top-line, bottom-line and cash flow results, while
further strengthening our balance sheet. We believe this
performance serves to demonstrate how Sonoco’s strong,
diversified portfolio has allowed us to weather storms on
multiple fronts, while continuing to produce consistent
earnings improvement and delivering value to our
shareholders over the past several years.
The shifting consumer and industrial landscape, driven
by various forms of disruption, both technological and
societal, sharpened our focus on better understanding
consumer trends, better understanding the needs of our
customers, and better leveraging data to drive decision
making. We also began rethinking how we realize and
capture value based on the products
and services we deliver to our
customers to help them succeed.
Altogether, this led to a very systematic
approach to Getting It Right: the right
products, the right markets, the right
processes, the right geographies, the
right technologies, and the right
structure. While not complete, we
are confident in the
foundational work we
have done in this area
and believe it will help
move us forward in new
and better ways.
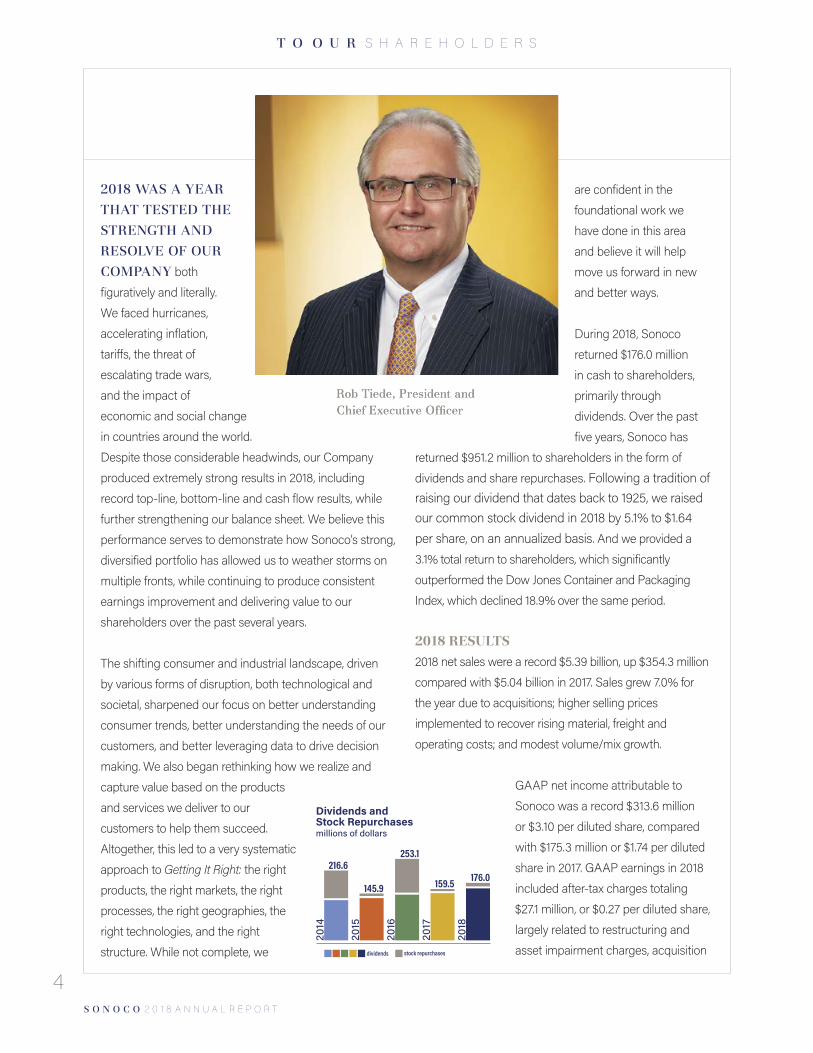
During 2018, Sonoco
returned $176.0 million
in cash to shareholders,
primarily through
dividends. Over the past
five years, Sonoco has
returned $951.2 million to shareholders in the form of
dividends and share repurchases. Following a tradition of raising our dividend that dates back to 1925, we raised our common stock dividend in 2018 by 5.1% to $1.64 per share, on an annualized basis. And we provided a
3.1% total return to shareholders, which significantly
outperformed the Dow Jones Container and Packaging
Index, which declined 18.9% over the same period.
2018 RESULTS2018 net sales were a record $5.39 billion, up $354.3 million
compared with $5.04 billion in 2017. Sales grew 7.0% for
the year due to acquisitions; higher selling prices
implemented to recover rising material, freight and
operating costs; and modest volume/mix growth.
GAAP net income attributable to
Sonoco was a record $313.6 million
or $3.10 per diluted share, compared
with $175.3 million or $1.74 per diluted
share in 2017. GAAP earnings in 2018
included after-tax charges totaling
$27.1 million, or $0.27 per diluted share,
largely related to restructuring and
asset impairment charges, acquisition
176.0
Dividends and Stock Repurchases millions of dollars
159.5
253.1
145.9
216.6
2018
2017
2016
2015
2014
dividends stock repurchases
Rob Tiede, President and Rob Tiede, President and Chief Executive OfficerChief Executive Officer
S O N O C O 2 0 1 8 A N N U A L R E P O R T
costs and the effect of income tax rate
changes on deferred tax items. GAAP
earnings in 2017 were impacted
$1.05 per diluted share, after tax, due
primarily to the impact of the U.S. Jobs
and Tax Cut Act, as well as restructuring expenses,
acquisition costs and other one-time items.
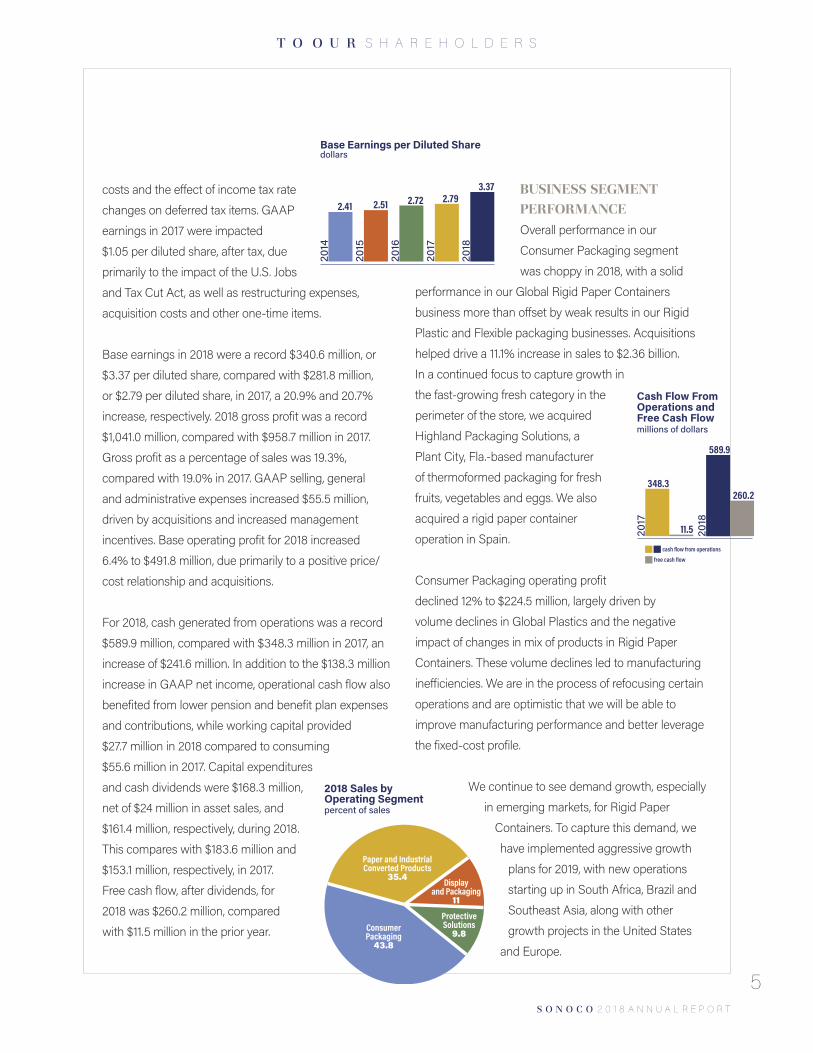
Base earnings in 2018 were a record $340.6 million, or
$3.37 per diluted share, compared with $281.8 million,
or $2.79 per diluted share, in 2017, a 20.9% and 20.7%
increase, respectively. 2018 gross profit was a record
$1,041.0 million, compared with $958.7 million in 2017.
Gross profit as a percentage of sales was 19.3%,
compared with 19.0% in 2017. GAAP selling, general
and administrative expenses increased $55.5 million,
driven by acquisitions and increased management
incentives. Base operating profit for 2018 increased
6.4% to $491.8 million, due primarily to a positive price/
cost relationship and acquisitions.
For 2018, cash generated from operations was a record
$589.9 million, compared with $348.3 million in 2017, an
increase of $241.6 million. In addition to the $138.3 million
increase in GAAP net income, operational cash flow also
benefited from lower pension and benefit plan expenses
and contributions, while working capital provided
$27.7 million in 2018 compared to consuming
$55.6 million in 2017. Capital expenditures
and cash dividends were $168.3 million,
net of $24 million in asset sales, and
$161.4 million, respectively, during 2018.
This compares with $183.6 million and
$153.1 million, respectively, in 2017.
Free cash flow, after dividends, for
2018 was $260.2 million, compared
with $11.5 million in the prior year.
5
T O O U R S H A R E H O L D E R S
3.37
Base Earnings per Diluted Share dollars
2.792.722.512.41
2018
2017
2016
2015
2014
589.9
Cash Flow From Operations and Free Cash Flow millions of dollars
11.5 2018
348.3
2017
cash flow from operations
free cash flow
260.2
Paper and Industrial Converted Products
35.4
Consumer Packaging
43.8
Display and Packaging
11
Protective Solutions
9.8
2018 Sales byOperating Segmentpercent of sales
BUSINESS SEGMENT PERFORMANCE Overall performance in our
Consumer Packaging segment
was choppy in 2018, with a solid
performance in our Global Rigid Paper Containers
business more than offset by weak results in our Rigid
Plastic and Flexible packaging businesses. Acquisitions
helped drive a 11.1% increase in sales to $2.36 billion.
In a continued focus to capture growth in
the fast-growing fresh category in the
perimeter of the store, we acquired
Highland Packaging Solutions, a
Plant City, Fla.-based manufacturer
of thermoformed packaging for fresh
fruits, vegetables and eggs. We also
acquired a rigid paper container
operation in Spain.
Consumer Packaging operating profit
declined 12% to $224.5 million, largely driven by
volume declines in Global Plastics and the negative
impact of changes in mix of products in Rigid Paper
Containers. These volume declines led to manufacturing
inefficiencies. We are in the process of refocusing certain
operations and are optimistic that we will be able to
improve manufacturing performance and better leverage
the fixed-cost profile.
We continue to see demand growth, especially
in emerging markets, for Rigid Paper
Containers. To capture this demand, we
have implemented aggressive growth
plans for 2019, with new operations
starting up in South Africa, Brazil and
Southeast Asia, along with other
growth projects in the United States
and Europe.
S O N O C O 2 0 1 8 A N N U A L R E P O R T
Our Paper and Industrial Converted Products segment
had a very strong performance, growing net sales by
2.4% to $1.91 billion, due primarily to acquisitions. In
October, we purchased the remaining 70% interest
in the Conitex Sonoco joint venture from Texpack, Inc.
Conitex is a vertically integrated manufacturer of
paper-based cones and tubes used in the textile
industry, with two-thirds of its sales in Asia. We continue
to see growth opportunities in our industrial products
segment, especially in Asia, as well as integration
opportunities to drive productivity and margin
improvement. Segment operating profit reached a
record $211.1 million, up 31% from 2017, due primarily to
a positive price/cost relationship as we benefited from
strong global paper markets and commercial excellence
initiatives. Higher operating costs only partially offset
these positive factors.
We are extremely pleased with the turnaround in our
Display and Packaging segment as sales grew 16.5%
and operating profit reached $13.3 million, up from
$2.6 million in 2017. The earnings improvement was
largely due to increased volumes, both domestically
and internationally, which were offset by continued
losses at a new retail packaging fulfillment center near
Atlanta, which we exited in the third quarter.
Protective Solutions sales declined 2% to $527.7 million,
while operating profit rose slightly to $42.9 million. Our
temperature-assured packaging business performed
very well due to volume growth; however, our consumer
and automotive molded foam business continues to be
challenged with sluggish volume, which impacted
manufacturing efficiency and productivity.
6
T O O U R S H A R E H O L D E R S
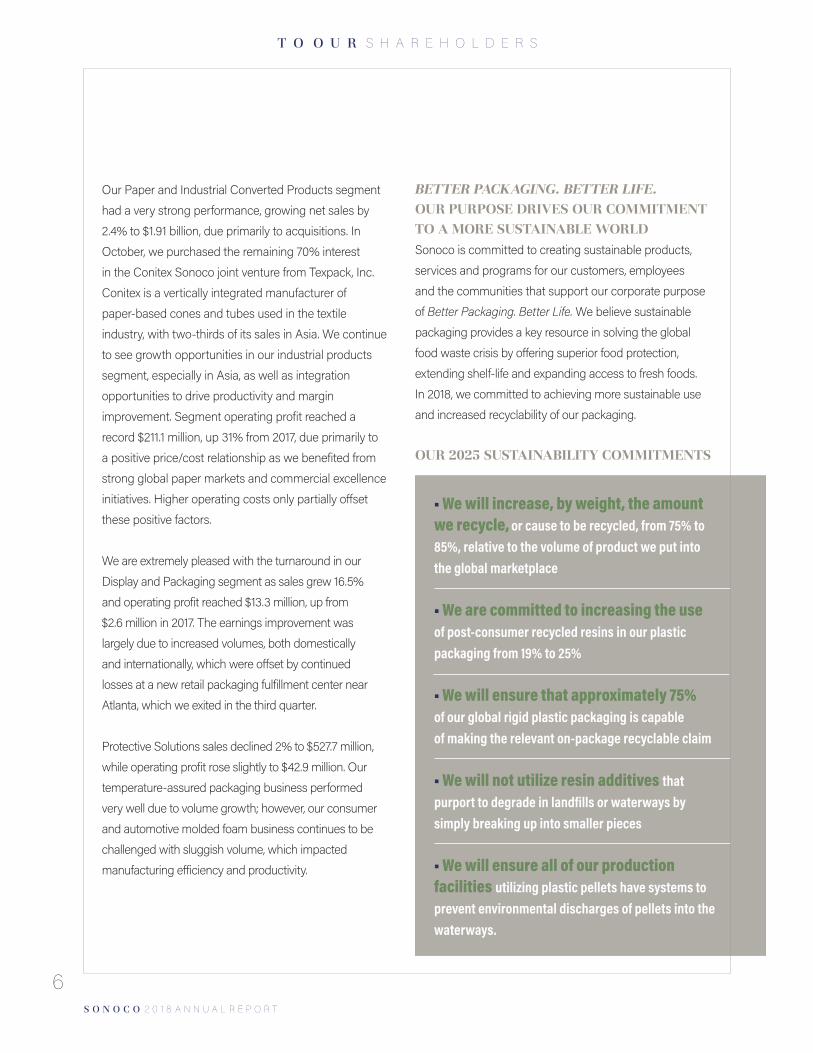
• We will increase, by weight, the amount we recycle, or cause to be recycled, from 75% to 85%, relative to the volume of product we put into the global marketplace
• We are committed to increasing the use of post-consumer recycled resins in our plastic packaging from 19% to 25%
• We will ensure that approximately 75% of our global rigid plastic packaging is capable of making the relevant on-package recyclable claim
• We will not utilize resin additives that purport to degrade in landfills or waterways by simply breaking up into smaller pieces
• We will ensure all of our production facilities utilizing plastic pellets have systems to prevent environmental discharges of pellets into the waterways.
BETTER PACKAGING. BETTER LIFE. OUR PURPOSE DRIVES OUR COMMITMENT TO A MORE SUSTAINABLE WORLDSonoco is committed to creating sustainable products,
services and programs for our customers, employees
and the communities that support our corporate purpose
of Better Packaging. Better Life. We believe sustainable
packaging provides a key resource in solving the global
food waste crisis by offering superior food protection,
extending shelf-life and expanding access to fresh foods.
In 2018, we committed to achieving more sustainable use
and increased recyclability of our packaging.
OUR 2025 SUSTAINABILITY COMMITMENTS
S O N O C O 2 0 1 8 A N N U A L R E P O R T
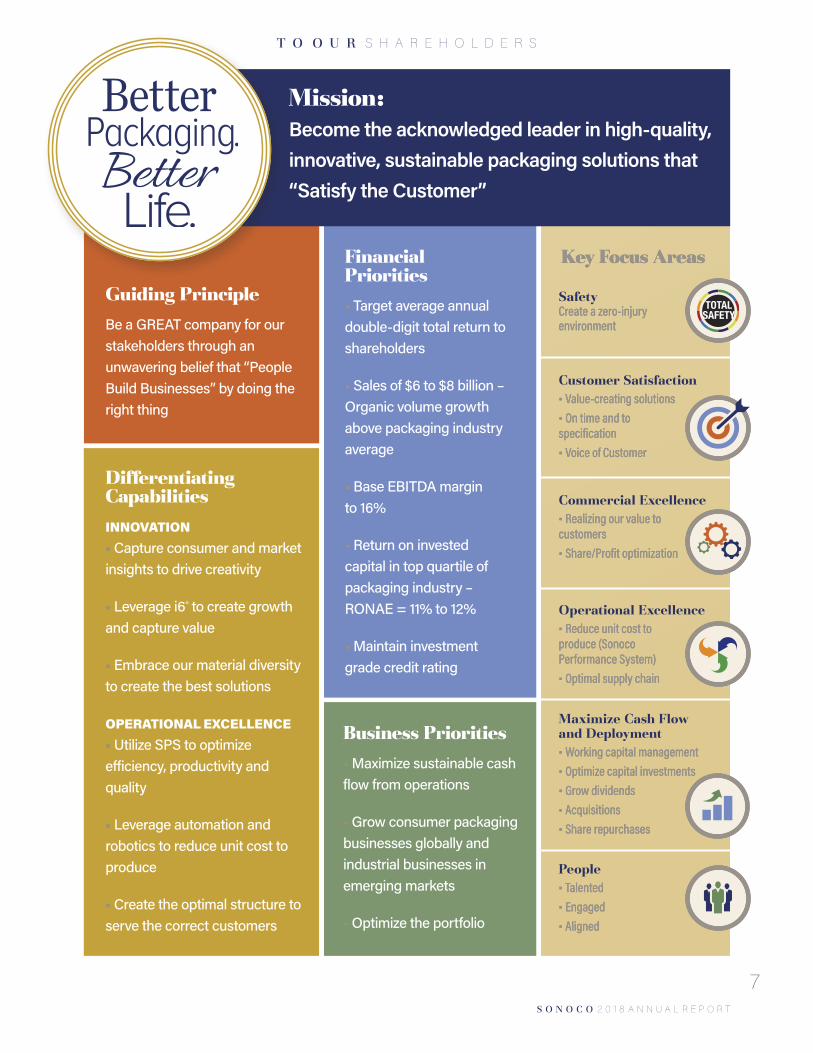
Financial Priorities• • Target average annual double-digit total return to shareholders
• • Sales of $6 to $8 billion – Organic volume growth above packaging industry average
• • Base EBITDA margin to 16%
• • Return on invested capital in top quartile of packaging industry – RONAE = 11% to 12%
• • Maintain investment grade credit rating
Business Priorities• • Maximize sustainable cash flow from operations
• • Grow consumer packaging businesses globally and industrial businesses in emerging markets
• • Optimize the portfolio
7
T O O U R S H A R E H O L D E R S
Mission: Become the acknowledged leader in high-quality, innovative, sustainable packaging solutions that “Satisfy the Customer”
People• • TalentedTalented• • EngagedEngaged• • AlignedAligned
SafetyCreate a zero-injury Create a zero-injury environmentenvironment
Customer Satisfaction• • Value-creating solutions Value-creating solutions • • On time and to On time and to specificationspecification• • Voice of CustomerVoice of Customer
Commercial Excellence• • Realizing our value to Realizing our value to customerscustomers• • Share/Profit optimizationShare/Profit optimization
Operational Excellence• • Reduce unit cost to Reduce unit cost to produce (Sonoco produce (Sonoco Performance System)Performance System)• • Optimal supply chainOptimal supply chain
Maximize Cash Flow and Deployment • • Working capital managementWorking capital management• • Optimize capital investmentsOptimize capital investments• • Grow dividendsGrow dividends• • AcquisitionsAcquisitions• • Share repurchasesShare repurchases
Guiding Principle Be a GREAT company for our stakeholders through an unwavering belief that “People Build Businesses” by doing the right thing
Differentiating CapabilitiesINNOVATION• • Capture consumer and market insights to drive creativity
• • Leverage i6® to create growth and capture value
• • Embrace our material diversity to create the best solutions
OPERATIONAL EXCELLENCE• • Utilize SPS to optimize efficiency, productivity and quality
• • Leverage automation and robotics to reduce unit cost to produce
• • Create the optimal structure to serve the correct customers
Key Focus AreasKey Focus Areas
S O N O C O 2 0 1 8 A N N U A L R E P O R T
8
T O O U R S H A R E H O L D E R S
BUILDING A FOUNDATION FOR THE NEXT 120 YEARSSonoco celebrates our 120th anni-
versary this year, and we remain
confident that our people, products
and portfolio have us well-positioned to compete in an
environment that is changing rapidly—one that is driven
by shifts in technology, commerce, consumer behavior,
demographics, public policy and emerging markets.
Our strategy moving forward is based on three areas of
focus: driving profitable growth, improving margins and
consistently growing cash flow from operations and free
cash flow. We will drive profitable growth by analyzing
macro-economic trends, while conducting a rigorous
review of our own capabilities and operations, then
aligning what we learn to help us develop new products,
new markets and new customers.
In addition, we are working to improve margins by
implementing new processes and systems, including
commercial excellence initiatives, which are allowing us
to better capture the value our products and services
deliver. New operational excellence systems are focused
on reducing the unit cost to produce in our plants; along
with driving procurement productivity and organizational
efficiency, which help reduce operating costs and offset
inflation. Finally, we are focused on driving consistent
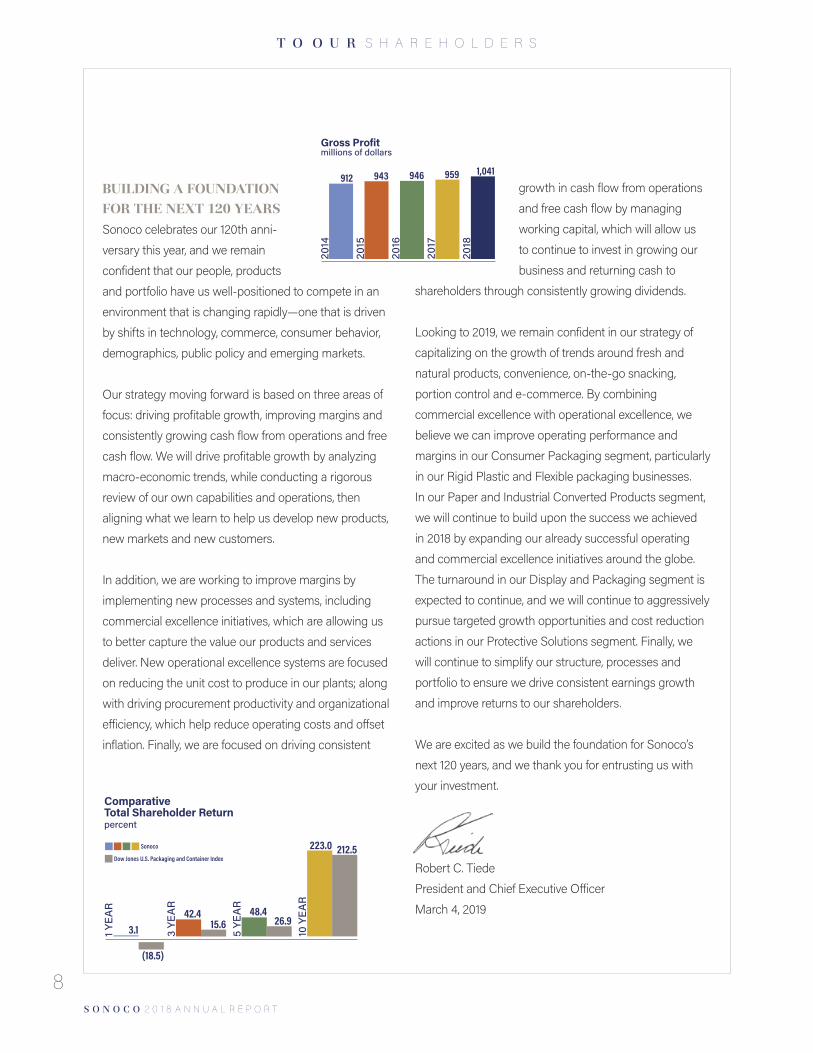
Comparative Total Shareholder Return percent
3.11 YEA
R
10 Y
EAR
223.0 212.5
48.4
5 YE
AR
26.942.4
3 YE
AR
15.6
(18.5)
Sonoco
Dow Jones U.S. Packaging and Container Index
1,041
Gross Profit millions of dollars
959946943912
2018
2017
2016
2015
2014
growth in cash flow from operations
and free cash flow by managing
working capital, which will allow us
to continue to invest in growing our
business and returning cash to
shareholders through consistently growing dividends.
Looking to 2019, we remain confident in our strategy of
capitalizing on the growth of trends around fresh and
natural products, convenience, on-the-go snacking,
portion control and e-commerce. By combining
commercial excellence with operational excellence, we
believe we can improve operating performance and
margins in our Consumer Packaging segment, particularly
in our Rigid Plastic and Flexible packaging businesses.
In our Paper and Industrial Converted Products segment,
we will continue to build upon the success we achieved
in 2018 by expanding our already successful operating
and commercial excellence initiatives around the globe.
The turnaround in our Display and Packaging segment is
expected to continue, and we will continue to aggressively
pursue targeted growth opportunities and cost reduction
actions in our Protective Solutions segment. Finally, we
will continue to simplify our structure, processes and
portfolio to ensure we drive consistent earnings growth
and improve returns to our shareholders.
We are excited as we build the foundation for Sonoco’s
next 120 years, and we thank you for entrusting us with
your investment.
Robert C. Tiede
President and Chief Executive Officer
March 4, 2019
S O N O C O 2 0 1 8 A N N U A L R E P O R T
9
C O N S U M E R S T R A T E G Y
The strength of Sonoco’s consumer growth strategyThe strength of Sonoco’s consumer growth strategy hinges on our responsiveness to key consumer macro-trends, such as shifting demographics, digital disruption, health and wellness and social consciousness.
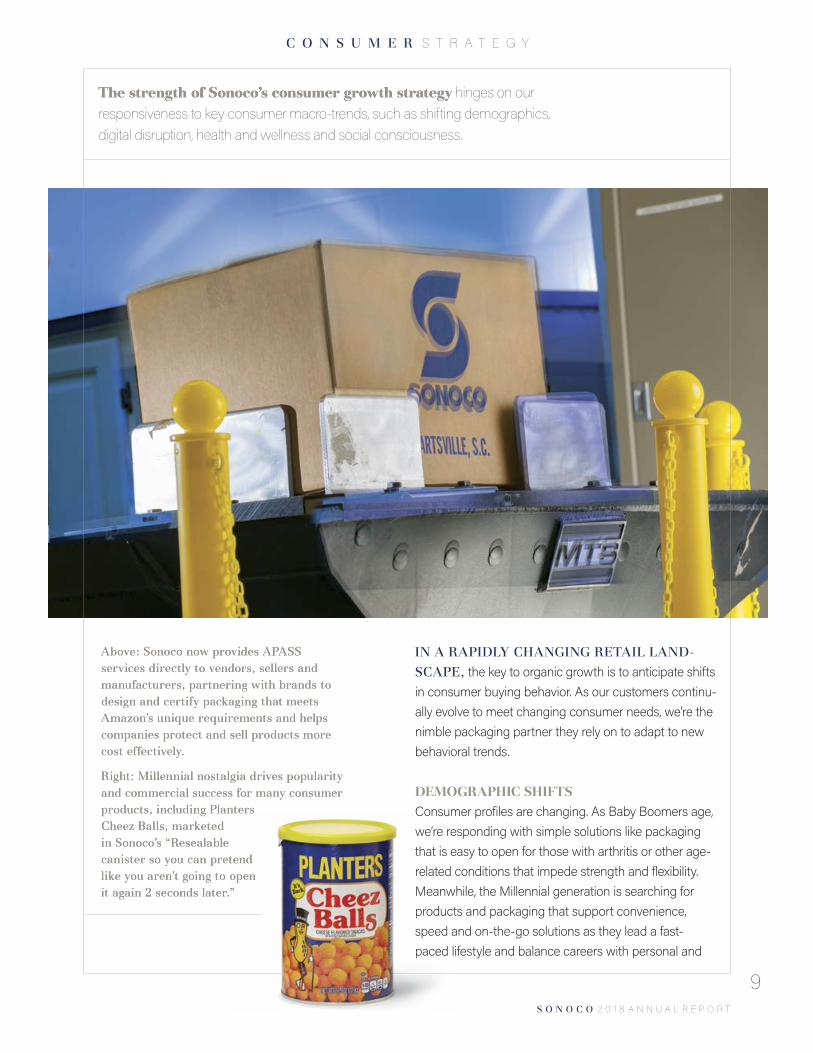
IN A RAPIDLY CHANGING RETAIL LAND-SCAPE, the key to organic growth is to anticipate shifts in consumer buying behavior. As our customers continu-ally evolve to meet changing consumer needs, we’re the nimble packaging partner they rely on to adapt to new behavioral trends.
DEMOGRAPHIC SHIFTSConsumer profiles are changing. As Baby Boomers age, we’re responding with simple solutions like packaging that is easy to open for those with arthritis or other age-related conditions that impede strength and flexibility. Meanwhile, the Millennial generation is searching for products and packaging that support convenience, speed and on-the-go solutions as they lead a fast- paced lifestyle and balance careers with personal and
Above: Sonoco now provides APASS Above: Sonoco now provides APASS services directly to vendors, sellers and services directly to vendors, sellers and manufacturers, partnering with brands to manufacturers, partnering with brands to design and certify packaging that meets design and certify packaging that meets Amazon’s unique requirements and helps Amazon’s unique requirements and helps companies protect and sell products more companies protect and sell products more cost effectively.cost effectively.
Right: Millennial nostalgia drives popularity Right: Millennial nostalgia drives popularity and commercial success for many consumer and commercial success for many consumer products, including Planters products, including Planters Cheez Balls, marketed Cheez Balls, marketed in Sonoco’s “Resealable in Sonoco’s “Resealable canister so you can pretend canister so you can pretend like you aren’t going to open like you aren’t going to open it again 2 seconds later.”it again 2 seconds later.”
S O N O C O 2 0 1 8 A N N U A L R E P O R T
10
C O N S U M E R S T R A T E G Y
family lives. We’ve responded with peel-and-reseal, cook-in-package, on-the-go and portion-control packaging that helps brands support their customers in navigating fast-paced lives.
DIGITAL DISRUPTIONThis fast-paced living has dramatically changed the modern shopping experience, with digital shopping providing the convenience of easy comparison shop-ping and having a product delivered to the doorstep. In the U.S. alone, e-commerce is a roughly $500 billion industry. This means that the consumer’s new “moment of truth” is opening a box, and the package inside, in their own home—and protecting a product during shipping protects a brand’s reputation.
Moving forward, global e-commerce sales are expected to increase 246% by 2021, to $4.5 trillion.
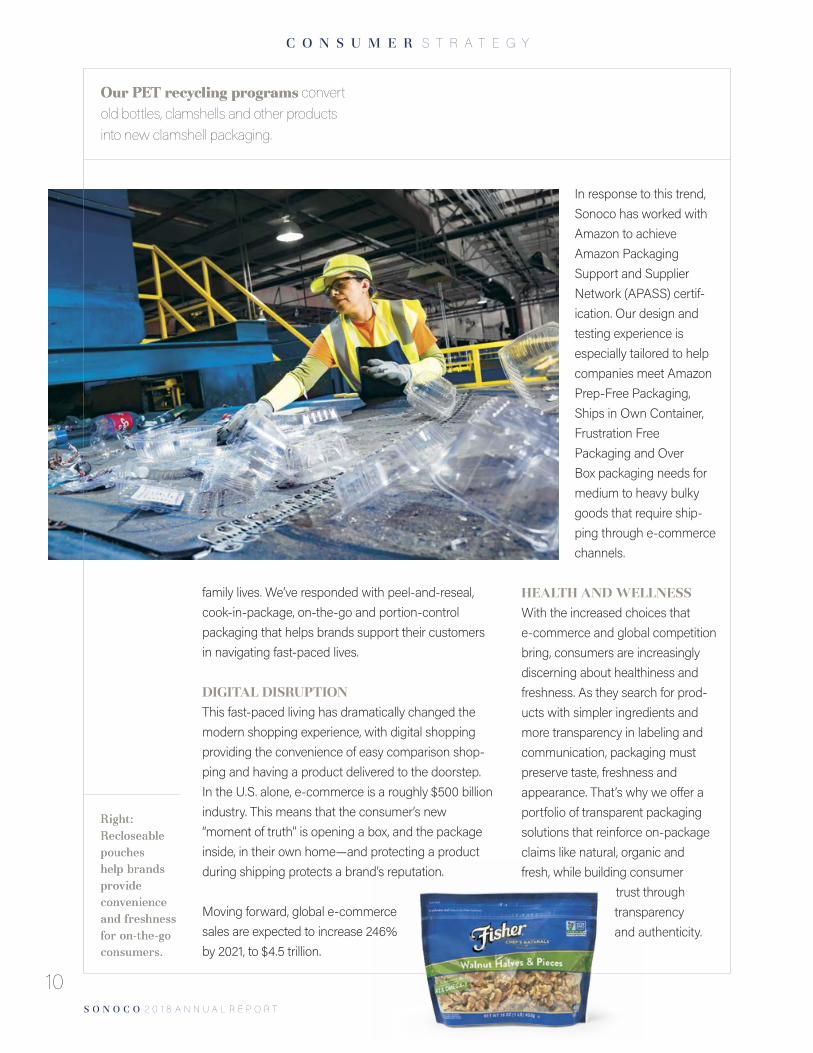
In response to this trend, Sonoco has worked with Amazon to achieve Amazon Packaging Support and Supplier Network (APASS) certif-ication. Our design and testing experience is especially tailored to help companies meet Amazon Prep-Free Packaging, Ships in Own Container, Frustration Free Packaging and Over Box packaging needs for medium to heavy bulky goods that require ship-ping through e-commerce channels.
HEALTH AND WELLNESSWith the increased choices that e-commerce and global competition bring, consumers are increasingly discerning about healthiness and freshness. As they search for prod-ucts with simpler ingredients and more transparency in labeling and communication, packaging must preserve taste, freshness and appearance. That’s why we offer a portfolio of transparent packaging solutions that reinforce on-package claims like natural, organic and fresh, while building consumer
trust through transparency and authenticity.
Our PET recycling programsOur PET recycling programs convert old bottles, clamshells and other products into new clamshell packaging.
Right: Right: Recloseable Recloseable pouches pouches help brands help brands provide provide convenience convenience and freshness and freshness for on-the-go for on-the-go consumers.consumers.
S O N O C O 2 0 1 8 A N N U A L R E P O R T
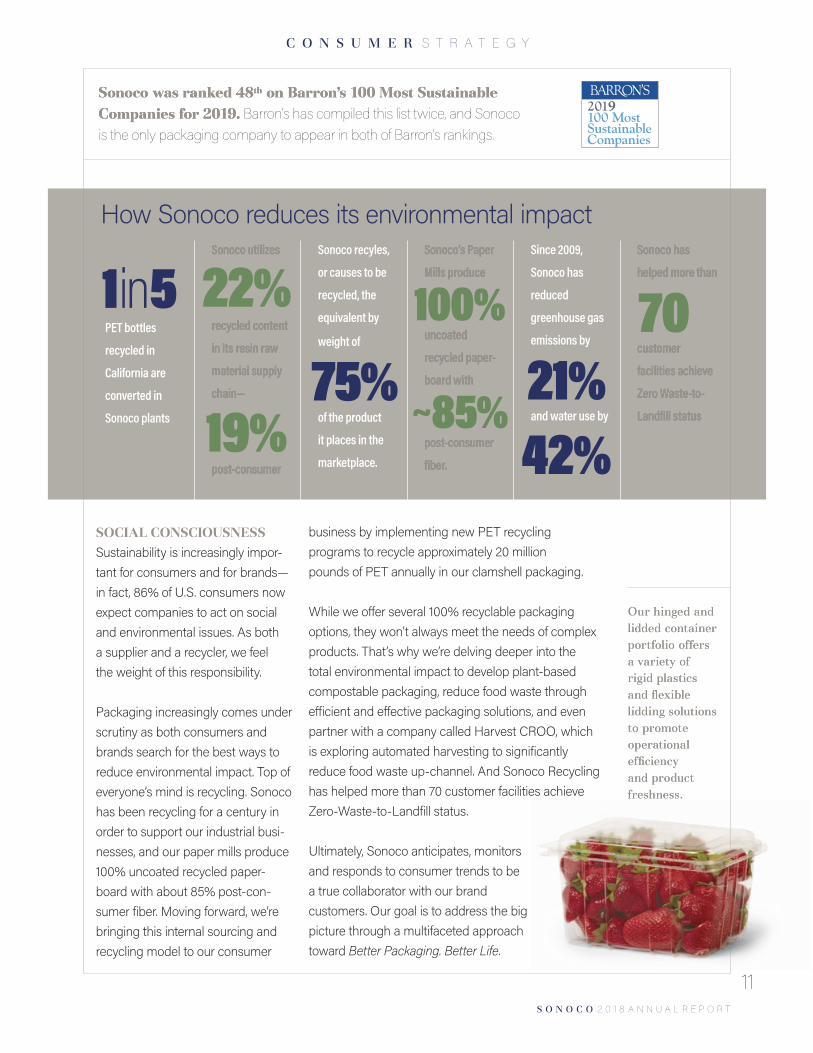
How Sonoco reduces its environmental impact
PET bottles
recycled in
California are
converted in
Sonoco plants
Sonoco recyles,
or causes to be
recycled, the
equivalent by
weight of
of the product
it places in the
marketplace.
1in5Sonoco utilizes Sonoco utilizes
recycled content recycled content
in its resin raw in its resin raw
material supply material supply
chain—chain—
post-consumerpost-consumer
22%
19%
Sonoco’s Paper Sonoco’s Paper
Mills produceMills produce
uncoated uncoated
recycled paper-recycled paper-
board withboard with
post-consumer post-consumer
fiber.fiber.
75%
Since 2009,
Sonoco has
reduced
greenhouse gas
emissions by
and water use by21%42%
Sonoco has Sonoco has
helped more thanhelped more than
customer customer
facilities achieve facilities achieve
Zero Waste-to-Zero Waste-to-
Landfill statusLandfill status
70100%
~85%
11
C O N S U M E R S T R A T E G Y
Sonoco was ranked 48Sonoco was ranked 48thth on Barron’s 100 Most Sustainable on Barron’s 100 Most Sustainable Companies for 2019.Companies for 2019. Barron’s has compiled this list twice, and Sonoco is the only packaging company to appear in both of Barron’s rankings.
Our hinged and Our hinged and lidded container lidded container portfolio offers portfolio offers a variety of a variety of rigid plastics rigid plastics and flexible and flexible lidding solutions lidding solutions to promote to promote operational operational efficiency efficiency and product and product freshness.freshness.
SOCIAL CONSCIOUSNESSSustainability is increasingly impor-tant for consumers and for brands—in fact, 86% of U.S. consumers now expect companies to act on social and environmental issues. As both a supplier and a recycler, we feel the weight of this responsibility.
Packaging increasingly comes under scrutiny as both consumers and brands search for the best ways to reduce environmental impact. Top of everyone’s mind is recycling. Sonoco has been recycling for a century in order to support our industrial busi-nesses, and our paper mills produce 100% uncoated recycled paper-board with about 85% post-con-sumer fiber. Moving forward, we’re bringing this internal sourcing and recycling model to our consumer
business by implementing new PET recycling programs to recycle approximately 20 million pounds of PET annually in our clamshell packaging.
While we offer several 100% recyclable packaging options, they won’t always meet the needs of complex products. That’s why we’re delving deeper into the total environmental impact to develop plant-based compostable packaging, reduce food waste through efficient and effective packaging solutions, and even partner with a company called Harvest CROO, which is exploring automated harvesting to significantly reduce food waste up-channel. And Sonoco Recycling has helped more than 70 customer facilities achieve Zero-Waste-to-Landfill status.
Ultimately, Sonoco anticipates, monitors and responds to consumer trends to be a true collaborator with our brand customers. Our goal is to address the big picture through a multifaceted approach toward Better Packaging. Better Life.
9
S O N O C O 2 0 1 8 A N N U A L R E P O R T
12
I N D U S T R I A L S T R A T E G Y
While our industrial businesses can certainly be While our industrial businesses can certainly be considered mature,considered mature, it doesn’t mean we don’t continue to evolve and bring new ideas and innovations to the industry and our customers.
In the world of Spandex yarns, time is money. In the world of Spandex yarns, time is money. Anything you can do to increase efficiency, through-Anything you can do to increase efficiency, through-put and productivity goes straight to our customer’s put and productivity goes straight to our customer’s bottom line. When you can improve sustainability, bottom line. When you can improve sustainability, it’s even better—and EcoSPAN™ cores do just that.it’s even better—and EcoSPAN™ cores do just that.
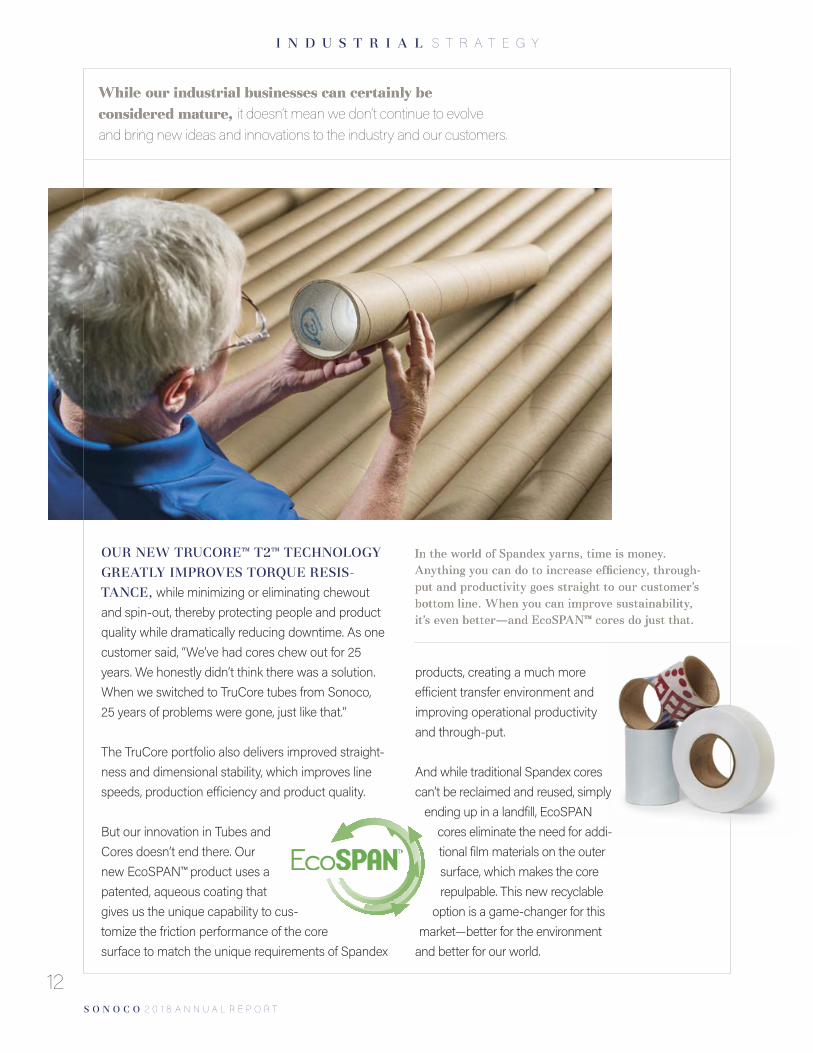
OUR NEW TRUCORE™ T2™ TECHNOLOGY GREATLY IMPROVES TORQUE RESIS-TANCE, while minimizing or eliminating chewout and spin-out, thereby protecting people and product quality while dramatically reducing downtime. As one customer said, “We’ve had cores chew out for 25 years. We honestly didn’t think there was a solution. When we switched to TruCore tubes from Sonoco, 25 years of problems were gone, just like that.”
The TruCore portfolio also delivers improved straight-ness and dimensional stability, which improves line speeds, production efficiency and product quality.
But our innovation in Tubes and Cores doesn’t end there. Our new EcoSPAN™ product uses a patented, aqueous coating that gives us the unique capability to cus-tomize the friction performance of the core surface to match the unique requirements of Spandex
products, creating a much more efficient transfer environment and improving operational productivity and through-put.
And while traditional Spandex cores can’t be reclaimed and reused, simply
ending up in a landfill, EcoSPAN cores eliminate the need for addi-tional film materials on the outer surface, which makes the core repulpable. This new recyclable
option is a game-changer for this market—better for the environment
and better for our world.
S O N O C O 2 0 1 8 A N N U A L R E P O R T
C O N I T E X A C Q U I S I T I O N
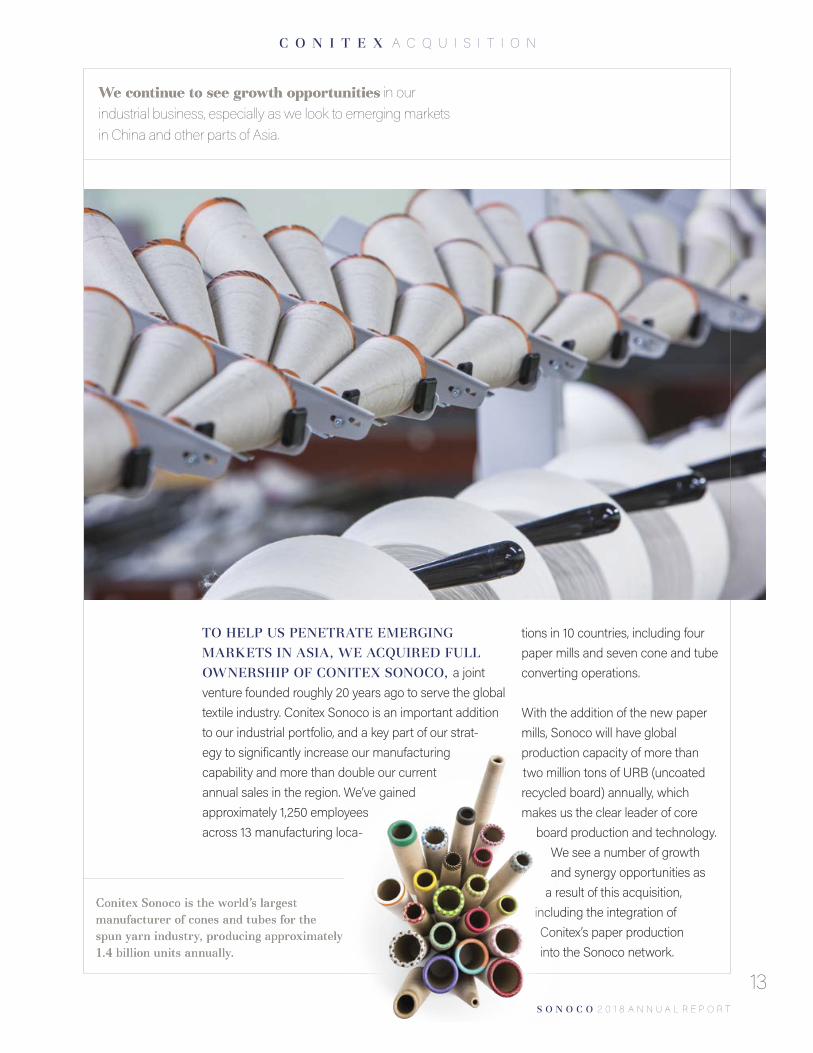
We continue to see growth opportunitiesWe continue to see growth opportunities in our industrial business, especially as we look to emerging markets in China and other parts of Asia.
Conitex Sonoco is the world’s largest Conitex Sonoco is the world’s largest manufacturer of cones and tubes for the manufacturer of cones and tubes for the spun yarn industry, producing approximately spun yarn industry, producing approximately 1.4 billion units annually. 1.4 billion units annually.
TO HELP US PENETRATE EMERGING MARKETS IN ASIA, WE ACQUIRED FULL OWNERSHIP OF CONITEX SONOCO, a joint venture founded roughly 20 years ago to serve the global textile industry. Conitex Sonoco is an important addition to our industrial portfolio, and a key part of our strat-egy to significantly increase our manufacturing capability and more than double our current annual sales in the region. We’ve gained approximately 1,250 employees across 13 manufacturing loca-
tions in 10 countries, including four paper mills and seven cone and tube converting operations. With the addition of the new paper mills, Sonoco will have global production capacity of more than two million tons of URB (uncoated recycled board) annually, which makes us the clear leader of core
board production and technology. We see a number of growth and synergy opportunities as
a result of this acquisition, including the integration of Conitex’s paper production into the Sonoco network.
13
S O N O C O 2 0 1 8 A N N U A L R E P O R T
S O N O C O S T R O N G
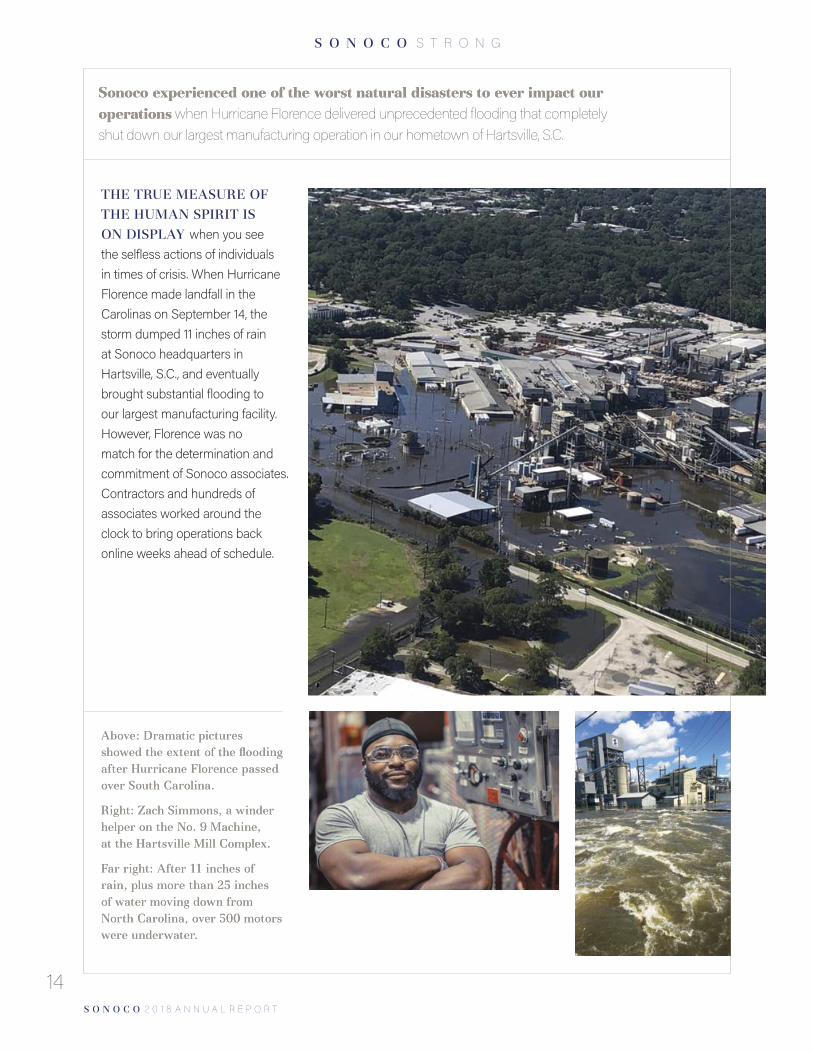
Sonoco experienced one of the worst natural disasters to ever impact our Sonoco experienced one of the worst natural disasters to ever impact our operationsoperations when Hurricane Florence delivered unprecedented flooding that completely shut down our largest manufacturing operation in our hometown of Hartsville, S.C.
THE TRUE MEASURE OF THE HUMAN SPIRIT IS ON DISPLAY when you see the selfless actions of individuals in times of crisis. When Hurricane Florence made landfall in the Carolinas on September 14, the storm dumped 11 inches of rain at Sonoco headquarters in Hartsville, S.C., and eventually brought substantial flooding to our largest manufacturing facility. However, Florence was no match for the determination and commitment of Sonoco associates. Contractors and hundreds of associates worked around the clock to bring operations back online weeks ahead of schedule.
Above: Dramatic pictures Above: Dramatic pictures showed the extent of the flooding showed the extent of the flooding after Hurricane Florence passed after Hurricane Florence passed over South Carolina.over South Carolina. Right: Zach Simmons, a winder Right: Zach Simmons, a winder helper on the No. 9 Machine, helper on the No. 9 Machine, at the Hartsville Mill Complex. at the Hartsville Mill Complex. Far right: After 11 inches of Far right: After 11 inches of rain, plus more than 25 inches rain, plus more than 25 inches of water moving down from of water moving down from North Carolina, over 500 motors North Carolina, over 500 motors were underwater. were underwater.
14
S O N O C O 2 0 1 8 A N N U A L R E P O R T
15
P E O P L E , C U L T U R E A N D V A L U E S
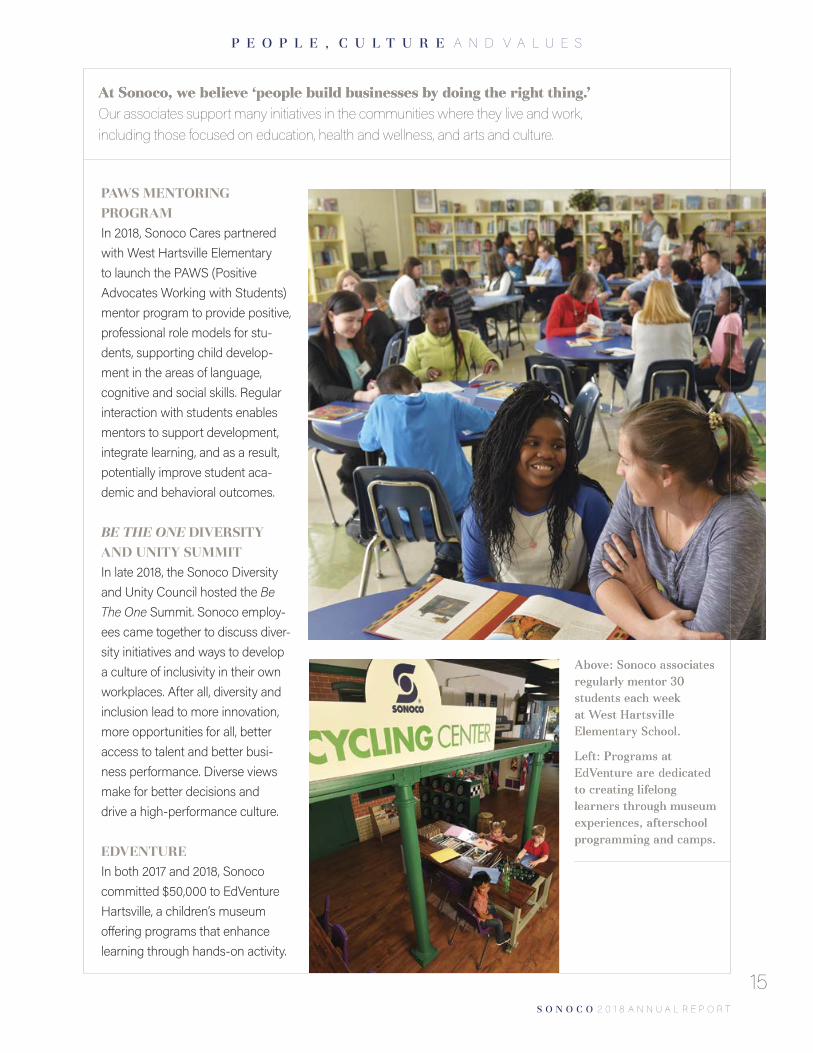
At Sonoco, we believe ‘people build businesses by doing the right thing.’At Sonoco, we believe ‘people build businesses by doing the right thing.’ Our associates support many initiatives in the communities where they live and work, including those focused on education, health and wellness, and arts and culture.
PAWS MENTORING PROGRAMIn 2018, Sonoco Cares partnered with West Hartsville Elementary to launch the PAWS (Positive Advocates Working with Students) mentor program to provide positive, professional role models for stu-dents, supporting child develop-ment in the areas of language, cognitive and social skills. Regular interaction with students enables mentors to support development, integrate learning, and as a result, potentially improve student aca-demic and behavioral outcomes. BE THE ONE DIVERSITY AND UNITY SUMMITIn late 2018, the Sonoco Diversity and Unity Council hosted the Be The One Summit. Sonoco employ-ees came together to discuss diver-sity initiatives and ways to develop a culture of inclusivity in their own workplaces. After all, diversity and inclusion lead to more innovation, more opportunities for all, better access to talent and better busi-ness performance. Diverse views make for better decisions and drive a high-performance culture.
EDVENTUREIn both 2017 and 2018, Sonoco committed $50,000 to EdVenture Hartsville, a children’s museum offering programs that enhance learning through hands-on activity.
Above: Sonoco associates Above: Sonoco associates regularly mentor 30 regularly mentor 30 students each week students each week at West Hartsville at West Hartsville Elementary School. Elementary School. Left: Programs at Left: Programs at EdVenture are dedicated EdVenture are dedicated to creating lifelong to creating lifelong learners through museum learners through museum experiences, afterschool experiences, afterschool programming and camps.programming and camps.
S O N O C O 2 0 1 8 A N N U A L R E P O R T
16
B O A R D O F D I R E C T O R S
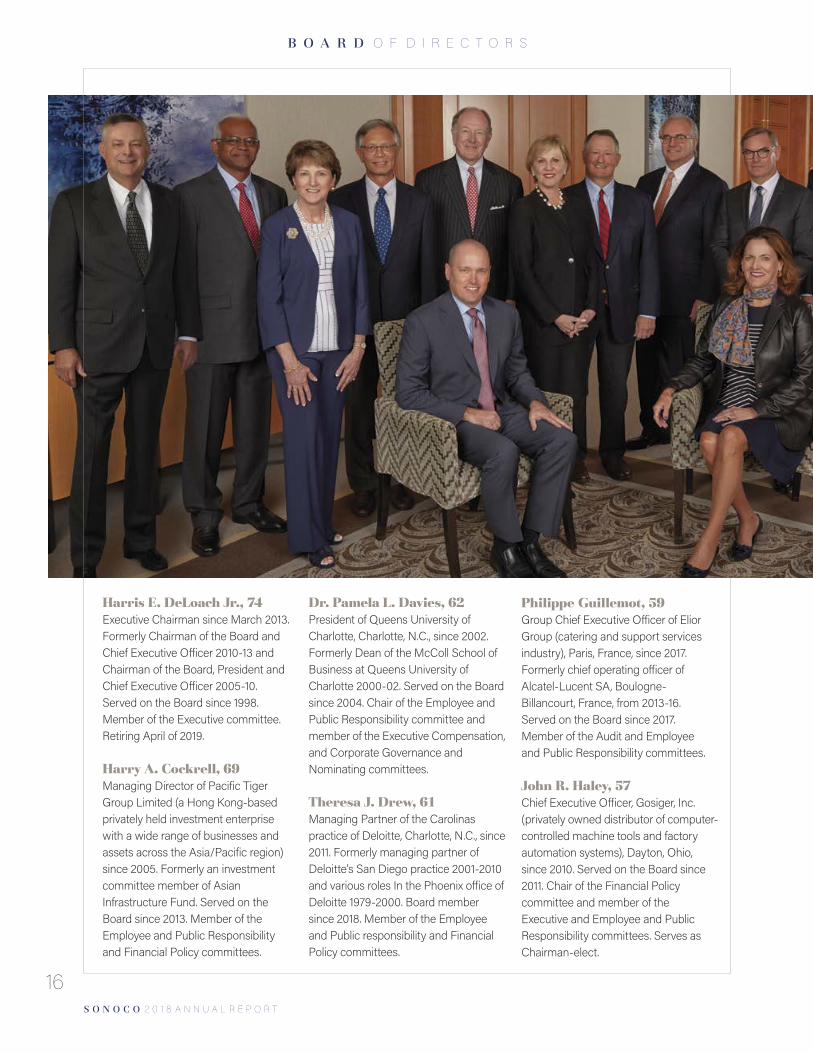
Harris E. DeLoach Jr., 74Executive Chairman since March 2013. Formerly Chairman of the Board and Chief Executive Officer 2010-13 and Chairman of the Board, President and Chief Executive Officer 2005-10. Served on the Board since 1998. Member of the Executive committee. Retiring April of 2019.
Harry A. Cockrell, 69Managing Director of Pacific Tiger Group Limited (a Hong Kong-based privately held investment enterprise with a wide range of businesses and assets across the Asia/Pacific region) since 2005. Formerly an investment committee member of Asian Infrastructure Fund. Served on the Board since 2013. Member of the Employee and Public Responsibility and Financial Policy committees.
Dr. Pamela L. Davies, 62President of Queens University of Charlotte, Charlotte, N.C., since 2002. Formerly Dean of the McColl School of Business at Queens University of Charlotte 2000-02. Served on the Board since 2004. Chair of the Employee and Public Responsibility committee and member of the Executive Compensation, and Corporate Governance and Nominating committees.
Theresa J. Drew, 61Managing Partner of the Carolinas practice of Deloitte, Charlotte, N.C., since 2011. Formerly managing partner of Deloitte’s San Diego practice 2001-2010 and various roles In the Phoenix office of Deloitte 1979-2000. Board member since 2018. Member of the Employee and Public responsibility and Financial Policy committees.
Philippe Guillemot, 59Group Chief Executive Officer of Elior Group (catering and support services industry), Paris, France, since 2017. Formerly chief operating officer of Alcatel-Lucent SA, Boulogne-Billancourt, France, from 2013-16. Served on the Board since 2017. Member of the Audit and Employee and Public Responsibility committees.
John R. Haley, 57Chief Executive Officer, Gosiger, Inc. (privately owned distributor of computer-controlled machine tools and factory automation systems), Dayton, Ohio, since 2010. Served on the Board since 2011. Chair of the Financial Policy committee and member of the Executive and Employee and Public Responsibility committees. Serves as Chairman-elect.
S O N O C O 2 0 1 8 A N N U A L R E P O R T
17
B O A R D O F D I R E C T O R S
Richard G. Kyle, 53President and Chief Executive Officer of The Timken Company (a manu- facturer of bearings, transmissions, gear-boxes, motors, lubrication systems and chain), North Canton, Ohio, since 2014. Formerly Chief Operating Officer of Bearings and Power Transmissions Group 2013-14. Elected to the Board in 2015. Member of the Audit, Executive Compensation, and Financial Policy committees.
Blythe J. McGarvie, 62Taught accounting at Harvard Business School in the full-time MBA program 2012-14. Served as Chief Executive Officer of Leadership for International Finance, LLC (an advisory firm offering tailor-made consulting services and leadership seminars) from 2003-12. Elected to the Board in 2014. Member of the Audit, Compensation, and Financial Policy committees.
James M. Micali, 71Member and limited partner of Azalea Fund III since 2008, and Azalea Fund IV since 2014, of Azalea Capital, LLC (private equity firm) in Greenville, S.C. Formerly “of Counsel” with Ogletree Deakins LLC (law firm) in Greenville, S.C., 2008-11; Chairman and President, Michelin North America, Inc. 1996-2008. Served on the Board since 2003. Lead Director since February 2012. Chair of the Corporate Governance and Nominating committee and member of the Executive, Executive Compensation, and Financial Policy committees.
Sundaram Nagarajan, 56Executive Vice President of Automotive OEM of Illinois Tool Works, Inc. (ITW) (a Fortune 200 global diversified industrial manufacturer of value-added consumables and specialty equipment with related service businesses) Glenview, Ill., since 2014. Formerly Executive Vice President of Welding 2010-14. Elected to the Board in 2015. Member of the Audit, Compensation, and Employee and Public Responsibility committees.
Marc D. Oken, 72Founder and partner of Falfurrias Capital Partners (private equity firm), Charlotte, N.C., since 2006. Formerly held executive officer positions at Bank of America Corporation 1989-2006, most recently as Chief Financial Officer; partner at Price Waterhouse 1976-89; a fellow with the Securities and Exchange Commission 1981-83. Served on the Board since 2006. Chair of the Executive Compensation committee and member of the Audit, Corporate Governance and Nominating, and Executive committees.
Robert C. Tiede, 60President and Chief Executive Officer since April 2018. Previously Executive Vice President and Chief Operating Officer from 2017 to 2018; Senior Vice President, Global Consumer Packaging and Services, Protective Solutions and Reels from 2015 to 2017; Senior Vice President, Global Consumer Packaging and Services from 2013 to 2015. Served on the board since 2018. Member of the Executive committee.
Thomas E. Whiddon, 66Retired. Former Advisory Director of Berkshire Partners, LLC (private equity firm), Boston, Mass., 2005-13. Executive Vice President, Logistics and Tech-nology of Lowe’s Companies, Inc. 2000-03; Executive Vice President and Chief Financial Officer of Lowe’s 1996-2000. Served on the Board since 2001. Chair of the Audit committee and member of the Corporate Governance and Nominating, Executive Compensation, and Financial Policy committees.
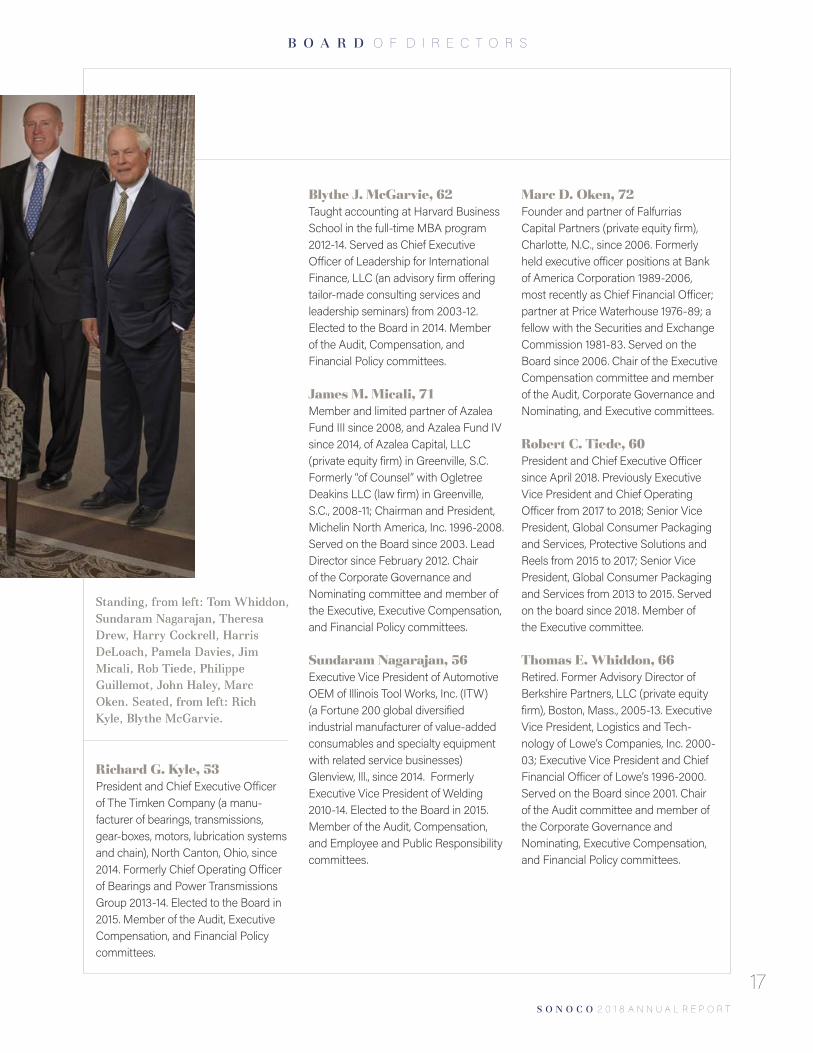
Standing, from left: Tom Whiddon, Standing, from left: Tom Whiddon, Sundaram Nagarajan, Theresa Sundaram Nagarajan, Theresa Drew, Harry Cockrell, Harris Drew, Harry Cockrell, Harris DeLoach, Pamela Davies, Jim DeLoach, Pamela Davies, Jim Micali, Rob Tiede, Philippe Micali, Rob Tiede, Philippe Guillemot, John Haley, Marc Guillemot, John Haley, Marc Oken. Seated, from left: Rich Oken. Seated, from left: Rich Kyle, Blythe McGarvie.Kyle, Blythe McGarvie.
S O N O C O 2 0 1 8 A N N U A L R E P O R T
EXECUTIVE COMMITTEERobert C. Tiede, 60 President and CEO since April 2018. Previously Executive Vice President and Chief Operating Officer 2017-18. Joined Sonoco in 2004.
Julie Albrecht, 51Vice President and Chief Financial Officer since March 2019. Previously Corporate Vice President, Treasurer/Assistant CFO 2017-19. Joined Sonoco in 2017.
R. Howard Coker, 56 Senior Vice President, Global Paper/Industrial Converted Products since January 2019. Previously Senior Vice President, Rigid Paper Containers and Paper/Engineered Carriers International 2017-18. Joined Sonoco in 1985.
John M. Florence, 40 Vice President, General Counsel and Secretary since 2016. Previously Corporate Attorney 2015-16. Joined Sonoco in 2015.
Rodger D. Fuller, 57 Senior Vice President, Global Consumer Packaging, Display and Packaging and Protective Solutions since January 2019. Previously Senior Vice President, Paper/Engineered Carriers U.S./Canada and Display and Packaging 2017-18. Joined Sonoco in 1985.
Kevin P. Mahoney, 63Senior Vice President, Corporate Planning since 2011. Previously Vice President, Corporate Planning 2000-11. Joined Sonoco in 1987.
Roger P. Schrum, 63Vice President, Investor Relations and Corporate Affairs since 2009. Previously Staff Vice President, Investor Relations and Corporate Affairs 2005-09. Joined Sonoco in 2005.
Marcy J. Thompson, 57Vice President, Marketing and Innovation since 2013. Previously Vice President, Rigid Paper N.A. 2011-13. Joined Sonoco in 2006.
OTHER CORPORATE OFFICERSJames A. Harrell III, 57Vice President, Tubes and Cores, U.S. and Canada since 2015. Previously Vice President, Global Tubes and Cores Operations 2015. Joined Sonoco in 1985.
Adam Wood, 50Vice President, Paper and Industrial Converted Products, EMEA, Asia, Australia and New Zealand since 2015. Previously Vice President, Global Tubes and Cores 2015. Joined Sonoco in 2003.
RETIRING APRIL 1, 2019 Allan H. McLeland Vice President, Human Resources
Barry L. SaundersSenior Vice President and former CFO
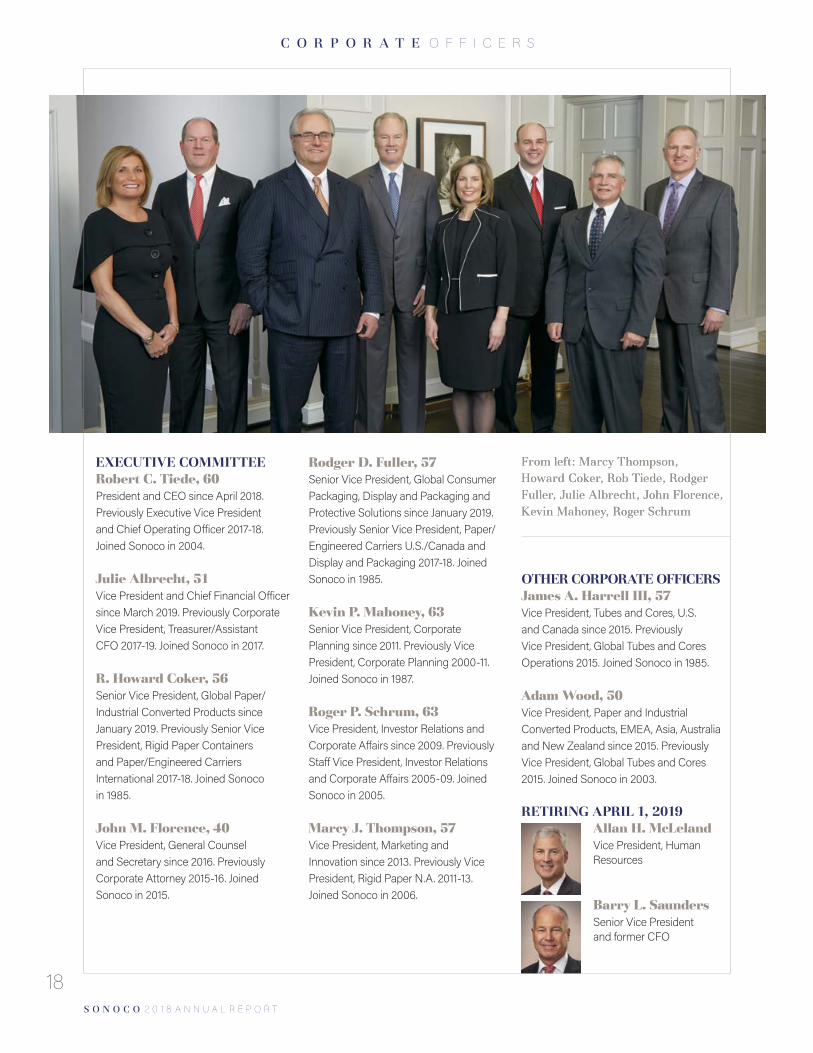
From left: Marcy Thompson, From left: Marcy Thompson, Howard Coker, Rob Tiede, Rodger Howard Coker, Rob Tiede, Rodger Fuller, Julie Albrecht, John Florence, Fuller, Julie Albrecht, John Florence, Kevin Mahoney, Roger Schrum Kevin Mahoney, Roger Schrum
18
C O R P O R A T E O F F I C E R S
UNITED STATESSECURITIES AND EXCHANGE COMMISSION
Washington, D.C. 20549
FORM 10-KÈ ANNUAL REPORT PURSUANT TO SECTION 13 OR 15(d) OF THE SECURITIES EXCHANGE ACT
OF 1934For the Fiscal Year Ended December 31, 2018
or
‘ TRANSITION REPORT PURSUANT TO SECTION 13 OR 15(d) OF THE SECURITIES EXCHANGEACT OF 1934For the transition period from to
Commission File No. 001-11261
SONOCO PRODUCTS COMPANYIncorporated under the laws
of South CarolinaI.R.S. Employer Identification
No. 57-0248420
1 N. Second St.Hartsville, SC 29550
Telephone: 843/383-7000
Securities registered pursuant to Section 12(b) of the Act:Title of each class Name of exchange on which registered
No par value common stock New York Stock Exchange, LLCSecurities registered pursuant to Section 12(g) of the Act: None
Indicate by check mark if the registrant is a well-known seasoned issuer, as defined in Rule 405 of the SecuritiesAct. Yes È No ‘
Indicate by check mark if the registrant is not required to file reports pursuant to Section 13 or Section 15(d) of theAct. Yes ‘ No È
Indicate by check mark whether the registrant (1) has filed all reports required to be filed by Section 13 or 15 (d) of the SecuritiesExchange Act of 1934 during the preceding 12 months (or for such shorter period that the registrant was required to file suchreports), and (2) has been subject to such filing requirements for the past 90 days. Yes È No ‘
Indicate by check mark whether the registrant has submitted electronically every Interactive Data File required to be submittedpursuant to Rule 405 of Regulation S-T (§232.405 of this chapter) during the preceding 12 months (or such shorter period that theregistrant was required to submit such files). Yes È No ‘
Indicate by check mark if disclosure of delinquent filers pursuant to Item 405 of Regulation S-K (§229.405 of this chapter) is notcontained herein, and will not be contained, to the best of registrant’s knowledge, in definitive proxy or information statementsincorporated by reference in Part III of this Form 10-K or any amendment to this Form 10-K. È
Indicate by check mark whether the registrant is a large accelerated filer, an accelerated filer, a non-accelerated filer, smallerreporting company, or an emerging growth company. See the definitions of “large accelerated filer,” “accelerated filer,” “smallerreporting company” and “emerging growth company” in Rule 12b-2 of the Exchange Act.
Large accelerated filer È Accelerated filer ‘ Non-accelerated filer ‘ Smaller reporting company ‘Emerging growth company ‘
If an emerging growth company, indicate by check mark if the registrant has elected not to use the extended transition period forcomplying with any new or revised financial accounting standards provided pursuant to Section 13(a) of the Exchange Act. ‘
Indicate by check mark whether the registrant is a shell company (as defined in Rule 12b-2 of the ExchangeAct). Yes ‘ No È
The aggregate market value of voting common stock held by nonaffiliates of the registrant (based on the New York StockExchange closing price) on June 29, 2018, which was the last business day of the registrant’s most recently completed second fiscalquarter, was $5,137,386,083. Registrant does not (and did not at June 29, 2018) have any non-voting common stock outstanding.
As of February 15, 2019, there were 99,911,654 shares of no par value common stock outstanding.
Documents Incorporated by ReferencePortions of the Proxy Statement for the annual meeting of shareholders to be held on April 17, 2019, which statement shall be
filed with the Securities and Exchange Commission within 120 days after the end of the fiscal year to which this Report relates, areincorporated by reference in Part III.
T A B L E O F C O N T E N T S
Page
Part IItem 1. Business .. . . . . . . . . . . . . . . . . . . . . . . . . . . . . . . . . . . . . . . . . . . . . . . . . . . . . . . . . . . . . . . . . . . . . . . . . . . . . . . . . . . . . . . . . . . . . . . . . . . . . . . . . . . . . . . . . . . . . . . . . . . . . . . . . . . . . . . . . . . . . . . . . . . . . . . . . . . . . . . . . . . . 5Item 1A. Risk Factors .. . . . . . . . . . . . . . . . . . . . . . . . . . . . . . . . . . . . . . . . . . . . . . . . . . . . . . . . . . . . . . . . . . . . . . . . . . . . . . . . . . . . . . . . . . . . . . . . . . . . . . . . . . . . . . . . . . . . . . . . . . . . . . . . . . . . . . . . . . . . . . . . . . . . . . . . . . . . . . 8Item 1B. Unresolved Staff Comments .. . . . . . . . . . . . . . . . . . . . . . . . . . . . . . . . . . . . . . . . . . . . . . . . . . . . . . . . . . . . . . . . . . . . . . . . . . . . . . . . . . . . . . . . . . . . . . . . . . . . . . . . . . . . . . . . . . . . . . . . . . . . . . . . . . 16Item 2. Properties .. . . . . . . . . . . . . . . . . . . . . . . . . . . . . . . . . . . . . . . . . . . . . . . . . . . . . . . . . . . . . . . . . . . . . . . . . . . . . . . . . . . . . . . . . . . . . . . . . . . . . . . . . . . . . . . . . . . . . . . . . . . . . . . . . . . . . . . . . . . . . . . . . . . . . . . . . . . . . . . . . . 16Item 3. Legal Proceedings .. . . . . . . . . . . . . . . . . . . . . . . . . . . . . . . . . . . . . . . . . . . . . . . . . . . . . . . . . . . . . . . . . . . . . . . . . . . . . . . . . . . . . . . . . . . . . . . . . . . . . . . . . . . . . . . . . . . . . . . . . . . . . . . . . . . . . . . . . . . . . . . . . . . 16Item 4. Mine Safety Disclosures .. . . . . . . . . . . . . . . . . . . . . . . . . . . . . . . . . . . . . . . . . . . . . . . . . . . . . . . . . . . . . . . . . . . . . . . . . . . . . . . . . . . . . . . . . . . . . . . . . . . . . . . . . . . . . . . . . . . . . . . . . . . . . . . . . . . . . . . . . . 16
Part IIItem 5. Market for Registrant’s Common Equity, Related Stockholder Matters and Issuer Purchases of Equity
Securities.. . . . . . . . . . . . . . . . . . . . . . . . . . . . . . . . . . . . . . . . . . . . . . . . . . . . . . . . . . . . . . . . . . . . . . . . . . . . . . . . . . . . . . . . . . . . . . . . . . . . . . . . . . . . . . . . . . . . . . . . . . . . . . . . . . . . . . . . . . . . . . . . . . . . . . . . . . . . . . . . . . . 17Item 6. Selected Financial Data .. . . . . . . . . . . . . . . . . . . . . . . . . . . . . . . . . . . . . . . . . . . . . . . . . . . . . . . . . . . . . . . . . . . . . . . . . . . . . . . . . . . . . . . . . . . . . . . . . . . . . . . . . . . . . . . . . . . . . . . . . . . . . . . . . . . . . . . . . . 18Item 7. Management’s Discussion and Analysis of Financial Condition and Results of Operations .. . . . . . . . . . . . . . . . . . . . . . . . 18Item 7A. Quantitative and Qualitative Disclosures about Market Risk.. . . . . . . . . . . . . . . . . . . . . . . . . . . . . . . . . . . . . . . . . . . . . . . . . . . . . . . . . . . . . . . . . . . . . . . . . . . . . 36Item 8. Financial Statements and Supplementary Data .. . . . . . . . . . . . . . . . . . . . . . . . . . . . . . . . . . . . . . . . . . . . . . . . . . . . . . . . . . . . . . . . . . . . . . . . . . . . . . . . . . . . . . . . . . . . . . . . . . 36Item 9. Changes in and Disagreements with Accountants on Accounting and Financial Disclosure .. . . . . . . . . . . . . . . . . . . . . . 37Item 9A. Controls and Procedures.. . . . . . . . . . . . . . . . . . . . . . . . . . . . . . . . . . . . . . . . . . . . . . . . . . . . . . . . . . . . . . . . . . . . . . . . . . . . . . . . . . . . . . . . . . . . . . . . . . . . . . . . . . . . . . . . . . . . . . . . . . . . . . . . . . . . . . . . 37Item 9B. Other Information .. . . . . . . . . . . . . . . . . . . . . . . . . . . . . . . . . . . . . . . . . . . . . . . . . . . . . . . . . . . . . . . . . . . . . . . . . . . . . . . . . . . . . . . . . . . . . . . . . . . . . . . . . . . . . . . . . . . . . . . . . . . . . . . . . . . . . . . . . . . . . . . . . . . . . 37
Part IIIItem 10. Directors, Executive Officers and Corporate Governance... . . . . . . . . . . . . . . . . . . . . . . . . . . . . . . . . . . . . . . . . . . . . . . . . . . . . . . . . . . . . . . . . . . . . . . . . . . . . . . . 38Item 11. Executive Compensation .. . . . . . . . . . . . . . . . . . . . . . . . . . . . . . . . . . . . . . . . . . . . . . . . . . . . . . . . . . . . . . . . . . . . . . . . . . . . . . . . . . . . . . . . . . . . . . . . . . . . . . . . . . . . . . . . . . . . . . . . . . . . . . . . . . . . . . . . 38Item 12. Security Ownership of Certain Beneficial Owners and Management and Related Stockholder Matters .. . . 38Item 13. Certain Relationships and Related Transactions, and Director Independence ... . . . . . . . . . . . . . . . . . . . . . . . . . . . . . . . . . . . . . . . . . . . . 39Item 14. Principal Accountant Fees and Services .. . . . . . . . . . . . . . . . . . . . . . . . . . . . . . . . . . . . . . . . . . . . . . . . . . . . . . . . . . . . . . . . . . . . . . . . . . . . . . . . . . . . . . . . . . . . . . . . . . . . . . . . . . . . . . 39
Part IVItem 15. Exhibits and Financial Statement Schedules .. . . . . . . . . . . . . . . . . . . . . . . . . . . . . . . . . . . . . . . . . . . . . . . . . . . . . . . . . . . . . . . . . . . . . . . . . . . . . . . . . . . . . . . . . . . . . . . . . . . . . . . 40Item 16. Form 10-K Summary .. . . . . . . . . . . . . . . . . . . . . . . . . . . . . . . . . . . . . . . . . . . . . . . . . . . . . . . . . . . . . . . . . . . . . . . . . . . . . . . . . . . . . . . . . . . . . . . . . . . . . . . . . . . . . . . . . . . . . . . . . . . . . . . . . . . . . . . . . . . . . . 40
2S O N O C O 2 0 1 8 A N N U A L R E P O R TS O N O C O 2 0 1 8 A N N U A L R E P O R T I F O R M 1 0 - K
S O N O C O P R O D U C T S C O M P A N Y
Forward-looking statementsStatements included in this Annual Report on Form 10-Kthat are not historical in nature, are intended to be, andare hereby identified as “forward-looking statements” forpurposes of the safe harbor provided by Section 21E ofthe Securities Exchange Act of 1934, as amended. Inaddition, the Company and its representatives may fromtime to time make other oral or written statements that arealso “forward-looking statements.” Words such as“estimate,” “project,” “intend,” “expect,” “believe,”“consider,” “plan,” “strategy,” “opportunity,”“commitment,” “target,” “anticipate,” “objective,” “goal,”“guidance,” “outlook,” “forecast,” “future,” “re-envision,”“assume,” “will,” “would,” “can,” “could,” “may,” “might,”“aspires,” “potential,” or the negative thereof, and similarexpressions identify forward-looking statements. Forward-looking statements include, but are not limited to, state-ments regarding:‰ availability and supply of raw materials, and offsettinghigh raw material costs, including the impact of potentialchanges in tariffs;‰ improved productivity and cost containment;‰ improving margins and leveraging strong cash flow andfinancial position;‰ effects of acquisitions and dispositions;‰ realization of synergies resulting from acquisitions;‰ costs, timing and effects of restructuring activities;‰ adequacy and anticipated amounts and uses of cashflows;‰ expected amounts of capital spending;‰ refinancing and repayment of debt;‰ financial strategies and the results expected of them;‰ financial results for future periods;‰ producing improvements in earnings;‰ profitable sales growth and rates of growth;‰ market leadership;‰ research and development spending;‰ expected impact and costs of resolution of legal proceed-ings;‰ extent of, and adequacy of provisions for, environmentalliabilities;‰ adequacy of income tax provisions, realization ofdeferred tax assets, outcomes of uncertain tax issues andtax rates;‰ goodwill impairment charges and fair values of reportingunits;‰ future asset impairment charges and fair values ofassets;‰ anticipated contributions to pension and postretirementbenefit plans, fair values of plan assets, long-term rates ofreturn on plan assets, and projected benefit obligationsand payments;‰ expected impact of implementation of new accountingpronouncements;‰ creation of long-term value and returns for shareholders;‰ continued payment of dividends; and‰ planned stock repurchases.
Such forward-looking statements are based on currentexpectations, estimates and projections about ourindustry, management’s beliefs and certain assumptionsmade by management. Such information includes, withoutlimitation, discussions as to guidance and other estimates,perceived opportunities, expectations, beliefs, plans,
strategies, goals and objectives concerning our futurefinancial and operating performance. These statementsare not guarantees of future performance and are subjectto certain risks, uncertainties and assumptions that aredifficult to predict. Therefore, actual results may differmaterially from those expressed or forecasted in suchforward-looking statements. The risks, uncertainties andassumptions include, without limitation:‰ availability and pricing of raw materials, energy andtransportation, including the impact of potential changes intariffs, and the Company’s ability to pass raw material,energy and transportation price increases and surchargesthrough to customers or otherwise manage these com-modity pricing risks;‰ costs of labor;‰ work stoppages due to labor disputes;‰ success of new product development, introduction andsales;‰ consumer demand for products and changing consumerpreferences;‰ ability to be the low-cost global leader in customer-preferred packaging solutions within targeted segments;‰ competitive pressures, including new product develop-ment, industry overcapacity, customer and supplier con-solidation, and changes in competitors’ pricing forproducts;‰ ability to maintain or increase productivity levels, containor reduce costs, and maintain positive price/cost relation-ships;‰ ability to negotiate or retain contracts with customers,including in segments with concentration of sales volume;‰ ability to improve margins and leverage cash flows andfinancial position;‰ continued strength of our paperboard-based tubes andcores and composite can operations;‰ ability to manage the mix of business to take advantageof growing markets while reducing cyclical effects of someof the Company’s existing businesses on operatingresults;‰ ability to maintain innovative technological market leader-ship and a reputation for quality;‰ ability to attract and retain talented and qualified employ-ees, managers and executives;‰ ability to profitably maintain and grow existing domesticand international business and market share;‰ ability to expand geographically and win profitable newbusiness;‰ ability to identify and successfully close suitable acquis-itions at the levels needed to meet growth targets, andsuccessfully integrate newly acquired businesses into theCompany’s operations;‰ the costs, timing and results of restructuring activities;‰ availability of credit to us, our customers and suppliers inneeded amounts and on reasonable terms;‰ effects of our indebtedness on our cash flow and busi-ness activities;‰ fluctuations in interest rates and our borrowing costs;‰ fluctuations in obligations and earnings of pension andpostretirement benefit plans;‰ accuracy of assumptions underlying projections of bene-fit plan obligations and payments, valuation of plan assets,and projections of long-term rates of return;‰ cost of employee and retiree medical, health and lifeinsurance benefits;
3S O N O C O 2 0 1 8 A N N U A L R E P O R TS O N O C O 2 0 1 8 A N N U A L R E P O R T I F O R M 1 0 - K
‰ resolution of income tax contingencies;‰ foreign currency exchange rate fluctuations, interest rateand commodity price risk and the effectiveness of relatedhedges;‰ changes in U.S. and foreign tariffs, tax rates, and taxlaws, regulations, interpretations and implementationthereof;‰ challenges and assessments from tax authorities result-ing from differences in interpretation of tax laws, includingincome, sales and use, property, value added, employ-ment, and other taxes;‰ accuracy in valuation of deferred tax assets;‰ accuracy of assumptions underlying projections relatedto goodwill impairment testing, and accuracy of manage-ment’s assessment of goodwill impairment;‰ accuracy of assumptions underlying fair value measure-ments, accuracy of management’s assessments of fairvalue and fluctuations in fair value;‰ ability to maintain effective internal controls over financialreporting;‰ liability for and anticipated costs of resolution of legalproceedings;‰ liability for and anticipated costs of environmentalremediation actions;‰ effects of environmental laws and regulations;‰ operational disruptions at our major facilities;‰ failure or disruptions in our information technologies;‰ failures of third party transportation providers to deliverour products to our customers or to deliver raw materialsto us;‰ substantially lower than normal crop yields;‰ loss of consumer or investor confidence;‰ ability to protect our intellectual property rights;‰ changes in laws and regulations relating to packaging forfood products and foods packaged therein, other actionsand public concerns about products packaged in ourcontainers, or chemicals or substances used in rawmaterials or in the manufacturing process;
‰ changing climate, climate change regulations and green-house gas effects;‰ actions of domestic or foreign government agencies andother changes in laws and regulations affecting theCompany and increased costs of compliance;‰ international, national and local economic and marketconditions and levels of unemployment; and‰ economic disruptions resulting from terrorist activitiesand natural disasters.
More information about the risks, uncertainties and assump-tions that may cause actual results to differ materially fromthose expressed or forecasted in forward-looking statements isprovided in this Annual Report on Form 10-K under Item 1A—“Risk Factors” and throughout other sections of this report andin other reports filed with the Securities and ExchangeCommission. In light of these various risks, uncertainties andassumptions, the forward-looking events discussed in thisAnnual Report on Form 10-K might not occur.
The Company undertakes no obligation to publicly update orrevise forward-looking statements, whether as a result of newinformation, future events or otherwise. You are, however,advised to review any further disclosures we make on relatedsubjects, and about new or additional risks, uncertainties andassumptions, in our future filings with the Securities andExchange Commission on Forms 10-K, 10-Q and 8-K.
References to our website addressReferences to our website address and domain namesthroughout this Annual Report on Form 10-K are forinformational purposes only, or to fulfill specific disclosurerequirements of the Securities and Exchange Commis-sion’s rules or the New York Stock Exchange ListingStandards. These references are not intended to, and donot, incorporate the contents of our websites by referenceinto this Annual Report on Form 10-K.
4S O N O C O 2 0 1 8 A N N U A L R E P O R TS O N O C O 2 0 1 8 A N N U A L R E P O R T I F O R M 1 0 - K
P A R T I
Item 1. Business(a) General development of business –
The Company is a South Carolina corporation foundedin Hartsville, South Carolina, in 1899 as the SouthernNovelty Company. The name was subsequently changedto Sonoco Products Company (“the Company” or“Sonoco”). Sonoco is a manufacturer of industrial andconsumer packaging products and a provider of pack-aging services, with 312 locations in 36 countries.
Information about the Company’s acquisitions, dis-positions, joint ventures and restructuring activities is pro-vided in Notes 4 and 5 to the Consolidated FinancialStatements included in Item 8 of this Annual Report onForm 10-K.
(b) Financial information about segments –The Company reports its financial results in four report-
able segments – Consumer Packaging, Paper andIndustrial Converted Products, Display and Packaging,and Protective Solutions. Information about the Compa-ny’s reportable segments is provided in Note 18 to theConsolidated Financial Statements included in Item 8 ofthis Annual Report on Form 10-K.
(c) Narrative description of business –Products and Services –The following discussion outlines the principal products
produced and services provided by the Company.
Consumer PackagingThe Consumer Packaging segment accounted for
approximately 44%, 42% and 43% of the Company’sconsolidated net sales in the years ended December 31,2018, 2017 and 2016, respectively. The operations in thissegment consist of 86 plants throughout the world. Theproducts, services and markets of the Consumer Pack-aging segment are as follow:
Products and Services MarketsRound composite cans,shaped rigid paperboardcontainers; fiber and plasticcaulk/adhesive tubes; alumi-num, steel and peelablemembrane easy-open clo-sures for composite andmetal cans; thermoformedrigid plastic trays, cups andbowls; injection moldedcontainers, spools and parts;high-barrier flexible and form-ing plastic packaging films,modified atmosphere pack-aging, lidding films, printedflexible packaging; roto-gravure cylinder engraving,global brand management
Stacked chips, snacks,nuts, cookies, crackers,other hard-baked goods,candy, gum, frozen con-centrate, powdered andliquid beverages, pow-dered infant formula, cof-fee, refrigerated dough,frozen foods and entrees,processed foods, freshfruits, vegetables,fresh-cut produce, salads,fresh-baked goods, eggs,seafood, poultry, soup,pasta, dairy, sauces, dips,condiments, pet food,meats, cheeses, labels
In 2018, Sonoco’s rigid packaging – paper-basedproducts – was the Company’s largest revenue-producinggroup of products and services, representing approx-
imately 21% of consolidated net sales in the year endedDecember 31, 2018. This group comprised 22% and 23%of consolidated net sales in 2017 and 2016, respectively.
Display and PackagingThe Display and Packaging segment accounted for
approximately 11%, 10% and 11% of the Company’sconsolidated net sales in the years ended December 31,2018, 2017 and 2016, respectively. The operations in thissegment consist of 23 plants around the world includingthe United States, Poland, Mexico and Brazil. The prod-ucts, services and markets of the Display and Packagingsegment are as follow:
Products and Services MarketsPoint-of-purchase displays;custom packaging; retailpackaging, including printedbacker cards, thermoformedblisters and heat sealingequipment; fulfillment; pri-mary package filling; supplychain management; paper-board specialties
Miscellaneous foods andbeverages, candy, elec-tronics, personal care,baby care, cosmetics,fragrances, hosiery, officesupplies, toys, home andgarden, medical,over-the-counter drugs,sporting goods, hospitalityindustry, advertising
Paper and Industrial Converted ProductsThe Paper and Industrial Converted Products segment
accounted for approximately 35%, 37% and 35% of theCompany’s consolidated net sales in the years endedDecember 31, 2018, 2017 and 2016, respectively. Thissegment serves its markets through 179 plants on fivecontinents. Sonoco’s paper operations provide the pri-mary raw material for the Company’s fiber-based pack-aging. Sonoco uses approximately 62% of the paper itmanufactures, and the remainder is sold to third parties.This vertical integration strategy is supported by 23 papermills with 33 paper machines and 23 recycling facilitiesthroughout the world. In 2018, Sonoco had the capacityto manufacture approximately 2.0 million tons of recycledpaperboard. The products, services and markets of thePaper and Industrial Converted Products segment are asfollow:
Products and Services MarketsRecycled paperboard, chip-board, tubeboard, light-weight corestock, boxboard,linerboard, corrugatingmedium, edgeboard, spe-cialty paper grades, adhe-sives; paperboard tubes andcores, molded plugs, reels;collection, processing andrecycling of old corrugatedcontainers, paper, plastics,metal, glass and otherrecyclable materials; flexibleintermediate bulk containersand bulk bags
Converted paperboardproducts, spiral winders,construction, plastic films,flowable products, metal,paper mills, shipping andstorage, tape and labels,textiles, wire and cable,adhesives, municipal,residential, customers’manufacturing and dis-tribution facilities
5S O N O C O 2 0 1 8 A N N U A L R E P O R TS O N O C O 2 0 1 8 A N N U A L R E P O R T I F O R M 1 0 - K
In 2018, Sonoco’s tubes and cores products were theCompany’s second largest revenue-producing group ofproducts, representing approximately 20% of consolidatednet sales in the year ended December 31, 2018. Thisgroup comprised 22% of consolidated net sales in both2017 and 2016, respectively.
Protective SolutionsThe Protective Solutions segment accounted for
approximately 10%, 11%, and 11% of the Company’sconsolidated net sales in the years ended December 31,2018, 2017 and 2016, respectively. The operations in thissegment consist of 30 plants throughout the world. Theproducts, services and markets of the Protective Solutionssegment are as follow:
Products and Services MarketsCustom-engineered,paperboard-based andexpanded foam protectivepackaging and components;temperature-assured pack-aging
Consumer electronics,automotive, appliances,medical devices,temperature-sensitivepharmaceuticals and food,heating and air condition-ing, office furnishings, fit-ness equipment,promotional and palletizeddistribution
Product distribution – Each of the Company’s operat-ing units has its own sales staff, and maintains direct salesrelationships with its customers. For those customers thatbuy from more than one business unit, the Company oftenassigns a single representative or team of specialists tohandle that customer’s needs. Some of the units haveservice staff at the manufacturing facility that interactdirectly with customers. The Paper and Industrial Con-verted Products segment and certain operations within theConsumer Packaging segment have customer servicecenters located in Hartsville, South Carolina, which are themain contact points between their North American busi-ness units and their customers. Divisional sales personnelalso provide sales management, marketing and productdevelopment assistance as needed. Typically, productdistribution is directly from the manufacturing plant to thecustomer, but in some cases, product is warehoused in amutually advantageous location to be shipped to the cus-tomer as needed.
Raw materials – The principal raw materials used bythe Company are recovered paper, paperboard, steel,aluminum and plastic resins. Raw materials are purchasedfrom a number of outside sources. The Company consid-ers the supply and availability of raw materials to beadequate to meet its needs.
Patents, trademarks and related contracts – Mostinventions and product and process innovations are gen-erated by Sonoco’s development, marketing and engineer-ing staffs, and are important to the Company’s internalgrowth. Patents have been granted on many inventionscreated by Sonoco staff in the United States and in manyother countries. Additionally, patents and trade secretswere acquired as part of several acquisitions over the pasttwo years, including the acquisitions of the remaining70 percent interest in Conitex Sonoco (BVI), Ltd., HighlandPackaging Solutions, Clear Lam Packaging, Inc. andPackaging Holdings, Inc. and subsidiaries, includ-
ing Peninsula Packaging LLC. These patents are managedglobally by a Sonoco intellectual capital management teamthrough the Company’s subsidiary, Sonoco Development,Inc. (SDI). SDI globally manages patents, trade secrets,confidentiality agreements and license agreements. Somepatents have been licensed to other manufacturers.Sonoco also licenses a few patents from outside compa-nies and universities. U.S. patents expire after about 20years, and patents on new innovations replace many ofthe abandoned or expired patents. A second intellectualcapital subsidiary of Sonoco, SPC Resources, Inc., glob-ally manages Sonoco’s trademarks, service marks, copy-rights and Internet domain names. Most of Sonoco’sproducts are marketed worldwide under trademarks suchas Sonoco®, SmartSeal®, Sonotube®, Sealclick®, Sono-post® and UltraSeal®. Sonoco’s registered web domainnames such as www.sonoco.com andwww.sonotube.com provide information about Sonoco, itspeople and its products. Trademarks and domain namesare licensed to outside companies where appropriate.
Seasonality – The Company’s operations are notseasonal to any significant degree, although the ConsumerPackaging and Display and Packaging segments normallyreport slightly higher sales and operating profits in thesecond half of the year, when compared with the first half.
Working capital practices – The Company is notrequired to carry any significant amounts of inventory tomeet customer requirements or to assure itself continuousallotment of goods.
Dependence on customers – On an aggregate basisduring 2018, the five largest customers in the Paper andIndustrial Converted Products segment, the ConsumerPackaging segment and the Protective Solutions segmentaccounted for approximately 7%, 23% and 28%,respectively, of each segment’s net sales. The depend-ence on a few customers in the Display and Packagingsegment is more significant, as the five largest customersin this segment accounted for approximately 64% of thatsegment’s sales.
Sales to the Company’s largest customer represented4.2% of consolidated revenues in 2018. This concen-tration of sales volume resulted in a correspondingconcentration of credit, representing approximately 4% ofthe Company’s consolidated trade accounts receivable atDecember 31, 2018. The Company’s next largestcustomer comprised 3.7% of consolidated revenues in2018.
Backlog – Most customer orders are manufacturedwith a lead time of three weeks or less. Therefore, theamount of backlog orders at December 31, 2018, was notmaterial. The Company expects all backlog orders atDecember 31, 2018, to be shipped during 2019.
Competition – The Company sells its products inhighly competitive markets, which include paper, textile,film, food, chemical, packaging, construction, and wireand cable. All of these markets are influenced by the over-all rate of economic activity and their behavior is principallydriven by supply and demand. Because we operate inhighly competitive markets, we regularly bid for new andcontinuing business. Losses and/or awards of businessfrom our largest customers, customer changes to alter-native forms of packaging, and the repricing of business,can have a significant effect on our operating results. TheCompany manufactures and sells many of its productsglobally. The Company, having operated internationally
6S O N O C O 2 0 1 8 A N N U A L R E P O R TS O N O C O 2 0 1 8 A N N U A L R E P O R T I F O R M 1 0 - K
since 1923, considers its ability to serve its customersworldwide in a timely and consistent manner a competitiveadvantage. The Company also believes that its techno-logical leadership, reputation for quality, and verticalintegration are competitive advantages. Expansion of theCompany’s product lines and global presence is driven bythe rapidly changing needs of its major customers, whodemand high-quality, state-of-the-art, environmentallycompatible packaging, wherever they choose to do busi-ness. It is important to be a low-cost producer in order tocompete effectively. The Company is constantly focusedon productivity improvements and other cost-reductioninitiatives utilizing the latest in technology.
Compliance with Environmental Laws – Informationregarding compliance with environmental laws is providedin Item 7 – Management’s Discussion and Analysis ofFinancial Condition and Results of Operations under thecaption “Risk Management,” and in Note 16 to the Con-solidated Financial Statements included in Item 8 of thisAnnual Report on Form 10-K.
Number of Employees – Sonoco had approximately23,000 employees worldwide as of December 31, 2018.
(d) Financial information about geographic areas –Financial information about geographic areas is pro-
vided in Note 18 to the Consolidated Financial Statementsincluded in Item 8 of this Annual Report on Form 10-K,and in the information about market risk in Item 7 – Man-agement’s Discussion and Analysis of Financial Conditionand Results of Operations under the caption “RiskManagement” of this Annual Report on Form 10-K.
(e) Available information –The Company electronically files with the Securities and
Exchange Commission (SEC) its annual reports on Form10-K, its quarterly reports on Form 10-Q, its periodicreports on Form 8-K, and amendments to those reportsfiled or furnished pursuant to Section 13(a) of the Secu-rities Exchange Act of 1934 (the “1934 Act”), and proxymaterials pursuant to Section 14 of the 1934 Act. TheSEC maintains a site on the Internet, www.sec.gov, thatcontains reports, proxy and information statements, andother information regarding issuers that file electronicallywith the SEC. Sonoco also makes its filings available, freeof charge, through its website, www.sonoco.com, as soonas reasonably practical after the electronic filing of suchmaterial with the SEC.
Executive Officers of the Registrant –
Name Age Position and business experience for the past five years
Executive CommitteeRobert C. Tiede 60 President and CEO since April 2018. Previously Vice President and Chief
Operating Officer 2017-2018; Senior Vice President, Global ConsumerPackaging & Services, Protective Solutions & Reels 2015-2017; SeniorVice President, Global Consumer Packaging and Services 2013-2015; VicePresident, Global Flexible & Packaging Services 2009-2013. JoinedSonoco in 2004.
Julie C. Albrecht 51 Vice President, Treasurer / CFO-Elect since December 2018. PreviouslyCorporate Vice President, Treasurer/Assistant CFO 2017-2018; VicePresident, Finance and Investor Relations & Treasurer for Esterline Tech-nologies Corporation, 2015-2017; Finance Director, Customer ServiceAircraft Systems for United Technologies, 2012-2015. Joined Sonoco in2017.
R. Howard Coker 56 Senior Vice President, Global Paper and Industrial Converted Productssince January 2019. Previously Senior Vice President, Rigid PaperContainers and Paper/Engineered Carriers International 2017-2018; GroupVice President, Global Rigid Paper & Closures and Paper & IndustrialConverted Products, EMEA, Asia, Australia and New Zealand 2015-2017;Vice President, Global Rigid Paper & Closures 2015; Group Vice President,Global Rigid Paper & Plastics 2013-2015; Vice President, Global RigidPaper & Closures 2011-2013. Joined Sonoco in 1985. Mr. Coker is thebrother-in-law of John R. Haley, one of Sonoco’s directors.
John M. Florence 40 Vice President, General Counsel and Secretary since November 2016.Previously Corporate Attorney 2015-2016. Joined Sonoco in 2015. Pre-viously an attorney at Haynsworth Sinkler Boyd, P.A. 2005-2015.Mr. Florence is the son-in-law of Harris E. DeLoach, Jr., our ExecutiveChairman.
Rodger D. Fuller 57 Senior Vice President, Global Consumer Packaging, Display and Pack-aging and Protective Solutions since January 2019. Previously Senior VicePresident, Paper/Engineered Carriers U.S./Canada and Display & Pack-aging 2017-2018; Group Vice President, Paper & Industrial ConvertedProducts, Americas 2015-2017; Vice President, Global Primary MaterialsGroup 2015; Group Vice President, Paper & Industrial Converting N.A.2013-2015; Vice President, Global Rigid Plastics & Corporate Customers2011-2013. Joined Sonoco in 1985.
7S O N O C O 2 0 1 8 A N N U A L R E P O R TS O N O C O 2 0 1 8 A N N U A L R E P O R T I F O R M 1 0 - K
Name Age Position and business experience for the past five years
Kevin P. Mahoney 63 Senior Vice President, Corporate Planning since February 2011. PreviouslyVice President, Corporate Planning 2000-2011. Joined Sonoco in 1987.
Allan H. McLeland 52 (Retiring effective April 1, 2019.) Vice President, Human Resources sinceJanuary 2011. Previously Staff Vice President, Human Resources,Industrial 2010-2011. Joined Sonoco in 1993.
Barry L. Saunders 59 (Retiring as Chief Financial Officer effective March 1, 2019.) Senior VicePresident and CFO since May 2015. Previously Vice President and ChiefFinancial Officer 2011-2015; Vice President, Corporate Controller andChief Accounting Officer 2008-2011. Joined Sonoco in 1989.
Roger P. Schrum 63 Vice President, Investor Relations & Corporate Affairs since February 2009.Previously Staff Vice President, Investor Relations & Corporate Affairs2005-2009. Joined Sonoco in 2005.
Marcy J. Thompson 57 Vice President, Marketing and Innovation since July 2013. Previously VicePresident, Rigid Paper N.A. 2011-2013; Division Vice President & GeneralManager, Sonoco Recycling 2009-2011. Joined Sonoco in 2006.
Other Corporate OfficersJames A. Harrell III 57 Vice President, Tubes & Cores, U.S. and Canada since December 2015.
Previously Vice President, Global Tubes & Cores Operations February-December 2015; Vice President, Tubes & Cores N.A. 2012-2015; VicePresident, Industrial Converting Division N.A. 2010-2012. Joined Sonoco in1985.
Adam Wood 50 Vice President, Paper & Industrial Converted Products, EMEA, Asia,Australia and New Zealand since December 2015. Previously Vice Presi-dent, Global Tubes & Cores February-December 2015; Vice President,Industrial Europe 2014-2015; Division VP/GM, Industrial Europe 2011-2014. Joined Sonoco in 2003.
Item 1A. Risk factorsWe are subject to risks and uncertainties that could
adversely affect our business, consolidated financial con-dition, results of operations and cash flows, and the trad-ing price of our securities. These factors could also causeour actual results to materially differ from the results con-templated by forward-looking statements we make in thisreport, in our other filings with the Securities andExchange Commission, and in our public announcements.You should consider the risk factors described below, aswell as other factors described elsewhere in this reportand in our other filings with the Securities and ExchangeCommission, in evaluating us, our business, and anyinvestment in our securities. Although these are the mostsignificant risk factors of which we are currently aware,they are not the only risk factors to which we are subject.Additional risk factors not currently known to us, or thatwe currently deem immaterial, could also adversely affectour business operations and financial results.
Changes in domestic and global economicconditions may have a negative impact on ourbusiness operations and financial results.
Although our business is diversified across variousmarkets and customers, because of the nature of ourproducts and services, general economic downturns in theUnited States and globally can adversely affect our busi-ness operations and financial results. Current global eco-nomic challenges, including the difficulties of the UnitedStates and other countries in dealing with their rising debtlevels, and currency fluctuations are likely to continue toput pressure on the economy, and on us. Following yearsof historic lows, interest rates have begun to rise as thegeneral economy improves, and there is a risk that interestrates could continue to rise and return to historic norms.Such an increase in rates would put additional pressure on
consumers and the economy in general. As evidenced inrecent years, tightening of credit availability and/or finan-cial difficulties, leading to declines in consumer and busi-ness confidence and spending, affect us, our customers,suppliers and distributors. When such conditions exist,customers may delay, decrease or cancel purchases fromus, and may also delay payment or fail to pay us alto-gether. Suppliers may have difficulty filling our orders anddistributors may have difficulty getting our products tomarket, which may affect our ability to meet customerdemands, and result in loss of business. Weakened globaleconomic conditions may also result in unfavorablechanges in our product price/mix and lower profit margins.All of these factors may have a material adverse effect onus.
Our international operations subject us to variousrisks that could adversely affect our businessoperations and financial results.
We have operations throughout North and South Amer-ica, Europe, Australia and Asia, with 312 facilities in 36countries. In 2018, approximately 35% of consolidatedsales came from operations and sales outside of theUnited States, and we expect to continue to expand ourinternational operations in the future. Management ofglobal operations is extremely complex, and operations inforeign countries are subject to local statutory and regu-latory requirements, differing legal environments and otheradditional risks that may not exist, or be as significant, inthe United States. These additional risks may adverselyaffect our business operations and financial results, andinclude, without limitation:‰ foreign currency exchange rate fluctuations and foreigncurrency exchange controls;‰ hyperinflation and currency devaluation;
8S O N O C O 2 0 1 8 A N N U A L R E P O R TS O N O C O 2 0 1 8 A N N U A L R E P O R T I F O R M 1 0 - K
‰ possible limitations on conversion of foreign currenciesinto dollars or payment of dividends and other paymentsby non-U.S. subsidiaries;‰ tariffs, non-tariff barriers, duties, taxes or governmentroyalties, including the imposition or increase of with-holding and other taxes on remittances and other pay-ments by non-U.S. subsidiaries;‰ our interpretation of our rights and responsibilities underlocal statutory and regulatory rules for sales taxes, VATand similar taxes, statutory accounting requirements,licenses and permits, etc. may prove to be incorrect orunsupportable resulting in fines, penalties, and/or otherliabilities related to non-compliance, damage to ourreputation, unanticipated operational restrictions and/orother consequences as a result of the Company’s actions,or inaction, taken to perform our responsibilities or protectour rights;‰ changes in tax laws, or the interpretation of such laws,affecting taxable income, tax deductions, or other attrib-utes relating to our non-U.S. earnings or operations;‰ inconsistent product regulation or policy changes byforeign agencies or governments;‰ difficulties in enforcement of contractual obligations andintellectual property rights;‰ high social benefit costs for labor, including moreexpansive rights of foreign unions and work councils, andcosts associated with restructuring activities;‰ national and regional labor strikes;‰ difficulties in staffing and managing international oper-ations;‰ geographic, language and cultural differences betweenpersonnel in different areas of the world;‰ differences in local business practices;‰ foreign governments’ restrictive trade policies, and cus-toms, import/export and other trade compliance regu-lations;‰ compliance with and changes in applicable foreign laws;‰ compliance with U.S. laws, including those affectingtrade and foreign investment and the Foreign CorruptPractices Act;‰ loss or non-renewal of treaties between foreign govern-ments and the U.S.;‰ product boycotts, including with respect to products ofour multi-national customers;‰ increased costs of maintaining international manufactur-ing facilities and undertaking international marketing pro-grams;‰ difficulty in collecting international accounts receivableand potentially longer payment cycles;‰ the potential for nationalization or expropriation of ourenterprises or facilities without appropriate compensation;and‰ political, social, legal and economic instability, civilunrest, war, catastrophic events, acts of terrorism, andwidespread outbreaks of infectious diseases.
Global economic conditions and/or disruptions in thecredit markets could adversely affect our business,financial condition or results of operations.
The Company has extensive international operations,and is dependent on customers and suppliers that operatein local economies around the world. In addition, theCompany accesses global credit markets as part of itscapital allocation strategy. Adverse global macroeconomicconditions could negatively impact our ability to access
credit, or the price at which funding could be obtained.Likewise, uncertainty about, or a decline in global orregional economic conditions, could have a significantimpact on the financial stability of our suppliers and cus-tomers, and could negatively impact demand for ourproducts. Potential effects include financial instability,inability to obtain credit to finance operations, andinsolvency.
The vote by the United Kingdom to leave theEuropean Union could adversely affect us.
In 2016, the U.K. voted to leave the European Union(E.U.) (referred to as Brexit), and in 2017, the U.K. gavethe notice that commences the formal Brexit process, andthe U.K. is currently scheduled to exit the E.U. at the endof March 2019. Brexit could cause disruptions to andcreate uncertainty surrounding our U.K. businesses,including affecting relationships with existing and futurecustomers, suppliers and employees. The effects of Brexitwill depend on any agreements the U.K. makes to retainaccess to E.U. markets either during a transitional periodor more permanently. The measures could potentially dis-rupt the markets we serve and the tax jurisdictions inwhich we operate and adversely change tax benefits orliabilities in these or other jurisdictions. In addition, Brexitcould lead to legal uncertainty and potentially divergentnational laws and regulations as the U.K. determineswhich E.U. laws to replace or replicate. Although theBrexit decision could have broad-reaching effects beyondjust in the U.K. itself, annual revenue in 2018 for our U.K.businesses alone totaled $120 million.
We are subject to governmental export and importcontrol laws and regulations in certain jurisdictionswhere we do business that could subject us toliability or impair our ability to compete in thesemarkets.
Certain of our products are subject to export controllaws and regulations and may be exported only with anexport license or through an applicable export licenseexception. If we fail to comply with export licensing, cus-toms regulations, economic sanctions or other laws, wecould be subject to substantial civil or criminal penalties,including economic sanctions against us, incarceration forresponsible employees and managers, and the possibleloss of export or import privileges. In addition, if ourdistributors fail to obtain appropriate import, export orre-export licenses or permits, we may also be materiallyadversely affected through reputational harm and penal-ties. Obtaining the necessary export license for a particularsale may be time consuming and expensive and couldresult in the delay or loss of sales opportunities.
Furthermore, export control laws and economic sanc-tions prohibit the shipment of certain products to embar-goed or sanctioned countries, governments and persons.While we train our employees to comply with these regu-lations, we cannot guarantee that a violation will not occur.A prohibited shipment could have negative consequences,including government investigations, penalties, fines, civiland criminal sanctions and reputational harm. Any changein export or import regulations, economic sanctions orrelated legislation, shift in the enforcement or scope ofexisting regulations, or change in the countries, govern-ments, persons or technologies targeted by such regu-lations, could decrease our ability to export or sell our
9S O N O C O 2 0 1 8 A N N U A L R E P O R TS O N O C O 2 0 1 8 A N N U A L R E P O R T I F O R M 1 0 - K
products internationally. Any limitation on our ability toexport or sell our products could materially adverselyaffect our business.
Raw materials, energy and other price increases orshortages may reduce our net income.
As a manufacturer, our sales and profitability aredependent on the availability and cost of raw materials,labor and other inputs. Most of the raw materials we useare purchased from third parties. Principal examples arerecovered paper, steel, aluminum and resin. Prices andavailability of these raw materials are subject to substantialfluctuations that are beyond our control due to factorssuch as changing economic conditions, currency andcommodity price fluctuations, resource availability, trans-portation costs, weather conditions and natural disasters,political unrest and instability, and other factors impactingsupply and demand pressures. Increases in costs canhave an adverse effect on our business and financialresults. Our performance depends, in part, on our ability topass on cost increases to our customers by raising sellingprices and/or offset the impact by improving productivity.Although many of our long-term contracts andnon-contractual pricing arrangements with customerspermit limited price adjustments to reflect increased rawmaterial costs, such adjustments may not occur quicklyenough, or be sufficient to prevent a materially adverseeffect on net income and cash flow. Furthermore, we maynot be able to improve productivity or realize sufficientsavings from our cost reduction initiatives to offset theimpact of increased costs.
Some of our manufacturing operations require the useof substantial amounts of electricity and natural gas, whichmay be subject to significant price increases as the resultof changes in overall supply and demand and the impactsof legislation and regulatory action. We forecast and mon-itor energy usage, and, from time to time, use commodityfutures or swaps in an attempt to reduce the impact ofenergy price increases. However, we cannot guaranteesuccess in these efforts, and we could suffer adverseeffects to net income and cash flow should we be unableto either offset or pass higher energy costs through to ourcustomers in a timely manner or at all.
Supply shortages or disruptions in our supply chainscould affect our ability to obtain timely delivery of materi-als, equipment and supplies from our suppliers, and, inturn, adversely affect our ability to supply products to ourcustomers. Such disruptions could have a materialadverse effect on our business and financial results.
We depend on third parties for transportationservices.
We rely primarily on third parties for transportation ofthe products we manufacture and/or distribute, as well asfor delivery of our raw materials. In particular, a significantportion of the goods we manufacture and raw materialswe use are transported by railroad or trucks, which arehighly regulated. If any of our third-party transportationproviders were to fail to deliver the goods that we manu-facture or distribute in a timely manner, we might beunable to sell those products at full value, or at all. Sim-ilarly, if any of these providers were to fail to deliver rawmaterials to us in a timely manner, we might be unable tomanufacture our products in response to customerdemand. In addition, if any of these third parties were to
cease operations or cease doing business with us, wemight be unable to replace them at reasonable cost. Anyfailure of a third-party transportation provider to deliverraw materials or finished products in a timely mannercould harm our reputation, negatively impact our customerrelationships and have a material adverse effect on ourfinancial condition and results of operations.
We may not be able to identify suitable acquisitioncandidates, which could limit our potential forgrowth.
We have made numerous acquisitions in recent years,and expect to actively seek new acquisitions thatmanagement believes will provide meaningful oppor-tunities for growth. However, we may not be able toidentify suitable acquisition candidates or complete acquis-itions on acceptable terms and conditions. Other compa-nies in our industries have similar investment andacquisition strategies to ours, and competition for acquis-itions may intensify. If we are unable to identify acquisitioncandidates that meet our criteria, our potential for growthmay be restricted.
We may encounter difficulties in integratingacquisitions, which could have an adverse impact onour financial condition and operating results.
As noted in the risk factors above, we have invested asubstantial amount of capital in acquisitions, joint venturesand strategic investments and we expect that we will con-tinue to do so in the foreseeable future. We are continuallyevaluating acquisitions and strategic investments that aresignificant to our business both in the United States andinternationally. Acquisitions, joint ventures and strategicinvestments involve numerous risks. Acquired businessesmay not achieve the expected levels of revenue, profit-ability or productivity, or otherwise perform as expected,and acquisitions may involve significant cashexpenditures, debt incurrence, operating losses, andexpenses that could have a material adverse effect on ourfinancial condition and operating results. Acquisitions alsoinvolve special risks, including, without limitation, thepotential assumption of unanticipated liabilities and con-tingencies, and the challenges of effectively integratingacquired businesses.
Other risks and challenges associated with acquisitionsinclude, without limitation:‰ demands on management related to increase in size ofour businesses and additional responsibilities of manage-ment;‰ diversion of management’s attention;‰ disruptions to our ongoing businesses;‰ inaccurate estimates of fair value in accounting foracquisitions and amortization of acquired intangibleassets, which could reduce future reported earnings;‰ difficulties in assimilation and retention of employees;‰ difficulties in integration of departments, systems, tech-nologies, books and records, controls (including internalfinancial and disclosure controls), procedures, and poli-cies;‰ potential loss of major customers and suppliers;‰ challenges associated with operating in new geographicregions;‰ difficulties in maintaining uniform standards, controls,procedures and policies;
10S O N O C O 2 0 1 8 A N N U A L R E P O R TS O N O C O 2 0 1 8 A N N U A L R E P O R T I F O R M 1 0 - K
‰ potential failure to identify material problems andliabilities during due diligence review of acquisition targets;and‰ potential failure to obtain sufficient indemnification rightsto fully offset possible liabilities associated with acquiredbusinesses.
While management believes that acquisitions willimprove our competitiveness and profitability, no assur-ance can be given that acquisitions will be successful oraccretive to earnings. If actual performance in an acquis-ition falls significantly short of the projected results, or theassessment of the relevant facts and circumstances wasinaccurate or changes, it is possible that a noncashimpairment charge of any related goodwill would berequired, and our results of operations and financial con-dition could be adversely affected.
In connection with acquisitions or divestitures, wemay become subject to liabilities and legal claims.
In connection with any acquisitions or divestitures, wemay become subject to liabilities or legal claims, includingbut not limited to third party liability and other tort claims;claims for breach of contract; employment-related claims;environmental, health and safety liabilities, conditions ordamage; permitting, regulatory or other legal complianceissues; or tax liabilities. If we become subject to any ofthese liabilities or claims, and they are not adequatelycovered by insurance or an enforceable indemnity or sim-ilar agreement from a creditworthy counterparty, we maybe responsible for significant out-of-pocket expenditures.These liabilities, if they materialize, could have a materialadverse effect on our business, financial condition andresults of operations.
We may encounter difficulties restructuringoperations or closing or disposing of facilities.
We are continuously seeking the most cost-effectivemeans and structure to serve our customers and torespond to changes in our markets. Accordingly, fromtime to time, we have, and are likely to again, close higher-cost facilities, sell non-core assets and otherwiserestructure operations in an effort to improve cost com-petitiveness and profitability. As a result, restructuring anddivestiture costs have been, and are expected to be, arecurring component of our operating costs, the magni-tude of which could vary significantly from year to yeardepending on the scope of such activities. Divestituresand restructuring may also result in significant financialcharges for the write-off or impairment of assets, includinggoodwill and other intangible assets. Furthermore, suchactivities may divert the attention of management, disruptour ordinary operations, or result in a reduction in thevolume of products produced and sold. There is no guar-antee that any such activities will achieve our goals, and ifwe cannot successfully manage the associated risks, ourfinancial position and results of operations could beadversely affected.
We face intense competition, and failure to competeeffectively can have an adverse effect on ouroperating results.
We sell our products in highly competitive markets. Weregularly bid for new and continuing business, and being a
responsive, high-quality, low-cost producer is a keycomponent of effective competition. The loss of businessfrom our larger customers, customer changes to alter-native forms of packaging, or renewal of business withless favorable terms can have a significant adverse effecton our operating results.
Continuing consolidation of our customer base andsuppliers may intensify pricing pressure.
Like us, many of our larger customers have acquiredcompanies with similar or complementary product lines,and many of our customers have been acquired. Addition-ally, many of our suppliers of raw materials are consolidat-ing. This consolidation of customers and suppliers hasincreased the concentration of our business with our larg-est customers, and in some cases, increased pricingpressures. Similarly, consolidation of our larger suppliershas resulted in increased pricing pressures from oursuppliers. Further consolidation of customers and suppli-ers could intensify pricing pressure and reduce our netsales and operating results.
The loss of a key customer, or a reduction in itsproduction requirements, could have a significantadverse impact on our sales and profitability.
Each of our segments has large customers, and theloss of any of these could have a significant adverse effecton the segment’s sales and, depending on the magnitudeof the loss, our results of operations and financial con-dition. Although a majority of our master customer con-tracts are long-term, they are terminable under certaincircumstances, such as our failure to meet quality, pricing,or volume requirements, and the contracts themselvesoften do not require a specific level of purchasing. There isno assurance that existing customer relationships will berenewed at the same level of production, or at all, at theend of the contract term. Furthermore, although no singlecustomer accounted for more than 10% of our net sales in2018 or 2017, the loss of any of our major customers, areduction in their purchasing levels or an adverse changein the terms of supply agreements with these customerscould reduce our net sales and net income. Continuedconsolidation of our customers could exacerbate any suchloss. For more information on concentration of sales vol-ume in our reportable segments, see Item1(c),“Dependence on Customers.”
We may not be able to develop new productsacceptable to the market.
For many of our businesses, organic growth dependson product innovation, new product development andtimely response to constantly changing consumerdemands and preferences. Sales of our products and serv-ices depend heavily on the volume of sales made by ourcustomers to consumers. Consumer preferences forproducts and packaging formats are constantly changingbased on, among other factors, cost, convenience, andhealth, environmental and social concerns and percep-tions. Our failure, or the failure of our customers, todevelop new or better products in response to changingconsumer preferences in a timely manner may hinder ourgrowth potential and affect our competitive position, andadversely affect our business and results of operations.
11S O N O C O 2 0 1 8 A N N U A L R E P O R TS O N O C O 2 0 1 8 A N N U A L R E P O R T I F O R M 1 0 - K
We are subject to costs and liabilities related toenvironmental, health and safety, and corporatesocial responsibility laws and regulations that couldadversely affect operating results.
We must comply with extensive laws, rules and regu-lations in the United States and in each of the countries inwhich we do business regarding the environment, healthand safety, and corporate social responsibility. Com-pliance with these laws and regulations can require sig-nificant expenditures of financial and employee resources.
Federal, state, provincial, foreign and local environ-mental requirements, including the Comprehensive Envi-ronmental Response, Compensation and Liability Act(CERCLA), and particularly those relating to air, soil andwater quality, handling, discharge, storage and disposal ofa variety of substances, and climate change are significantfactors in our business and generally increase our costs ofoperations. We may be found to have environmentalliability for the costs of remediating soil or water that is, orwas, contaminated by us or a third party at various sitesthat we now own, use or operate, or previously, owned,used or operated. Legal proceedings may result in theimposition of fines or penalties, as well as mandatedremediation programs, that require substantial, and insome instances, unplanned capital expenditures.
We have incurred in the past, and may incur in thefuture, fines, penalties and legal costs relating to environ-mental matters, and costs relating to the damage of natu-ral resources, lost property values and toxic tort claims.We have made expenditures to comply with environmentalregulations and expect to make additional expenditures inthe future. As of December 31, 2018, approximately$20.1 million was reserved for environmental liabilities.Such reserves are established when it is considered prob-able that we have some liability. However, because theextent of potential environmental damage, and the extentof our liability for the damage, is usually difficult to assessand may only be ascertained over a long period of time,our actual liability in such cases may end up being sub-stantially higher than the currently reserved amount.Accordingly, additional charges could be incurred thatwould have a material adverse effect on our operatingresults and financial position.
Many of our products come into contact with the foodand beverages packaged within, and therefore we aresubject to risks and liabilities related to health and safetymatters in connection with those products. Accordingly,our products must comply with various laws and regu-lations for food and beverages applicable to our custom-ers. Changes in such laws and regulations couldnegatively impact customers’ demand for our products asthey comply with such changes and/or require us to makechanges to our products. Such changes to our productscould include modifications to the coatings and com-pounds we use, possibly resulting in the incurrence ofadditional costs. Additionally, because many of our prod-ucts are used to package consumer goods, we are sub-ject to a variety of risks that could influence consumerbehavior and negatively impact demand for our products,including changes in consumer preferences driven by vari-ous health-related concerns and perceptions.
Disclosure regulations relating to the use of “conflictminerals” sourced from the Democratic Republic of theCongo and adjoining countries could affect the sourcing,availability and cost of materials used in the manufacture
of some of our products. We also incur costs associatedwith supply chain due diligence, and, if applicable, poten-tial changes to products, processes or sources of supplyas a result of such due diligence. Because our supplychain is complex, we may also face reputation risk withour customers and other stakeholders if we are unablesufficiently to verify the origins of all such minerals used inour products.
Changes to laws and regulations dealing with environ-mental, health and safety, and corporate social responsi-bility issues are made or proposed with some frequency,and some of the proposals, if adopted, might, directly orindirectly, result in a material reduction in the operatingresults of one or more of our operating units. However,any such changes are uncertain, and we cannot predictthe amount of additional capital expenditures or operatingexpenses that could be necessary for compliance.
Product liability claims and other legal proceedingscould adversely affect our operations and financialperformance.
We produce products and provide services related toother parties’ products. While we have built extensiveoperational processes intended to ensure that the designand manufacture of our products meet rigorous qualitystandards, there can be no assurance that we or ourcustomers will not experience operational process failuresthat could result in potential product, safety, regulatory orenvironmental claims and associated litigation. We arealso subject to a variety of legal proceedings and legalcompliance risks in our areas of operation around theglobe. Any such claims, whether with or without merit,could be time consuming and expensive to defend andcould divert management’s attention and resources. Inaccordance with customary practice, we maintaininsurance against some, but not all, of these potentialclaims; however, in the future, we may not be able tomaintain such insurance at acceptable premium cost lev-els. In addition, the levels of insurance we maintain maynot be adequate to fully cover any and all losses orliabilities. If any significant judgment or claim is not fullyinsured or indemnified against, it could have a materialadverse impact on our business, financial condition andresults of operations.
We and the industries in which we operate are at timesbeing reviewed or investigated by regulators and othergovernmental authorities, which could lead to enforcementactions, fines and penalties or the assertion of private liti-gation claims and damages. Simply responding to actualor threatened litigation or government investigations of ourcompliance with regulatory standards may require sig-nificant expenditures of time and other resources. Whilewe believe that we have adopted appropriate riskmanagement and compliance programs, the global anddiverse nature of our operations means that legal andcompliance risks will continue to exist and legal proceed-ings and other contingencies, the outcome of which can-not be predicted with certainty, will arise from time to timethat could adversely affect our business, results of oper-ations and financial condition.
Changes in pension plan assets or liabilities mayreduce operating results and shareholders’ equity.
We sponsor various defined benefit plans worldwide,and have an aggregate projected benefit obligation for
12S O N O C O 2 0 1 8 A N N U A L R E P O R TS O N O C O 2 0 1 8 A N N U A L R E P O R T I F O R M 1 0 - K
these plans of approximately $1.7 billion as ofDecember 31, 2018. The difference between definedbenefit plan obligations and assets (the funded status ofthe plans) significantly affects the net periodic benefitcosts and the ongoing funding requirements of the plans.Among other factors, changes in discount rates andlower-than-expected investment returns could sub-stantially increase our future plan funding requirementsand have a negative impact on our results of operationsand cash flows. As of December 31, 2018, these planshold a total of approximately $1.3 billion in assets fundinga portion of the projected benefit obligations of the plans,which consist primarily of common collective trusts,mutual funds, common stocks and debt securities andalso include alternative investments such as interests inreal estate funds and hedge funds. If the performance ofthese assets does not meet our assumptions, or discountrates decline, the underfunding of the plans may increaseand we may have to contribute additional funds to theseplans, and our pension expense may increase, whichcould adversely affect operating results and shareholders’equity.
We, or our customers, may not be able to obtainnecessary credit or, if so, on reasonable terms.
We have $1.0 billion of fixed-rate debt outstanding. Wealso operate a $350 million commercial paper program,supported by a $500 million credit facility committed by asyndicate of eight banks until July 2022. If we were pre-vented from issuing commercial paper, we have the con-tractual right to draw funds directly on the underlying bankcredit facility. We believe that the lenders have the abilityto meet their obligations under the facility. However, ifthese obligations were not met, we may be forced to seekmore costly or cumbersome forms of credit. Should suchcredit be unavailable for an extended time, it would sig-nificantly affect our ability to operate our business andexecute our plans. In addition, our customers may experi-ence liquidity problems as a result of a negative change inthe economic environment, including the ability to obtaincredit, that could limit their ability to purchase our prod-ucts and services or satisfy their existing obligations.
Our credit ratings are important to our ability to issuecommercial paper at favorable rates of interest. A down-grade in our credit rating could increase our cost of bor-rowing.
Certain of our debt agreements impose restrictions withrespect to the maintenance of financial ratios and thedisposition of assets. The most restrictive covenants cur-rently require us to maintain a minimum level of interestcoverage, and a minimum level of net worth. Although wewere substantially above these minimum levels atDecember 31, 2018, these restrictive covenants couldadversely affect our ability to engage in certain businessactivities that would otherwise be in our best long-terminterests.
Our indebtedness could adversely affect our cashflow, increase our vulnerability to economicconditions, and limit or restrict our businessactivities.
In addition to interest payments, from time to time asignificant portion of our cash flow may need to be used toservice our indebtedness, and, therefore, may not beavailable for use in our business. Our ability to generate
cash flow is subject to general economic, financial, com-petitive, legislative, regulatory, and other factors that maybe beyond our control. Our indebtedness could have asignificant impact on us, including, but not limited to:‰ increasing our vulnerability to general adverse economicand industry conditions;‰ requiring us to dedicate a significant portion of our cashflow from operations to payments on our indebtedness,thereby reducing the amount of our cash flow available tofund working capital, acquisitions and capitalexpenditures, and for other general corporate purposes;‰ limiting our flexibility in planning for, or reacting to,changes in our business and our industry;‰ restricting us from making strategic acquisitions orexploiting business opportunities; and‰ limiting our ability to borrow additional funds.
We may incur additional debt in the future, whichcould increase the risks associated with our leverage.
We are continually evaluating and pursuing acquisitionopportunities and may incur additional indebtedness tofinance any such acquisitions and to fund any resultingincreased operating needs. As new debt is added to ourcurrent debt levels, the related risks we face couldincrease. While we will have to effect any new financing incompliance with the agreements governing our then exist-ing indebtedness, changes in our debt levels and or debtstructure may impact our credit rating and costs to bor-row, as well as constrain our future financial flexibility in theevent of a deterioration in our financial operating perform-ance or financial condition.
Currency exchange rate fluctuations may reduceoperating results and shareholders’ equity.
Fluctuations in currency exchange rates can causetranslation, transaction and other losses that canunpredictably and adversely affect our consolidatedoperating results. Our reporting currency is the U.S. dollar.However, as a result of operating globally, a portion of ourconsolidated net sales, costs, assets and liabilities, aredenominated in currencies other than the U.S. dollar. Inour consolidated financial statements, we translate thelocal currency financial results of our foreign operationsinto U.S. dollars based on their respective exchange rates.Depending on the direction, changes in those rates willeither increase or decrease operating results and balancesas reported in U.S. dollars. Although we monitor ourexposures and, from time to time, may use forward cur-rency contracts to hedge certain forecasted currencytransactions or foreign currency denominated assets andliabilities, this does not insulate us completely from foreigncurrency fluctuations and exposes us to counterparty riskof nonperformance.
Adverse weather and climate changes may result inlower sales.
We manufacture packaging products for foods as wellas products used in construction and industrial manu-facturing. Varying weather conditions can impact cropgrowing seasons and related farming conditions that canthen impact the timing or amount of demand for foodpackaged in our containers. In addition, poor or extremeweather conditions can temporarily impact the level ofconstruction and industrial activity and also impact theefficiency of our manufacturing operations. Such dis-
13S O N O C O 2 0 1 8 A N N U A L R E P O R TS O N O C O 2 0 1 8 A N N U A L R E P O R T I F O R M 1 0 - K
ruptions could have a material adverse effect on ourresults of operations.
We rely on our information technology and its failureor disruption could disrupt our operations,compromise customer, employee, vendor and otherdata, and adversely affect our results of operations.
We rely on the successful and uninterrupted functioningof our information technologies to securely manage oper-ations and various business functions, and we rely onvarious technologies to process, store and reportinformation about our business, and to interact with cus-tomers, vendors and employees around the world. As withall large systems, our information technology systems maybe susceptible to damage, disruption or shutdown due topower outages, failures during the process of upgrading orreplacing software, hardware failures, computer viruses,cyber attacks, catastrophic events, telecommunicationsfailures, user errors, unauthorized access, and maliciousor accidental destruction of information or functionality.We also maintain and have access to sensitive, con-fidential or personal data or information that is subject toprivacy and security laws, regulations and customer con-trols. Despite our efforts to protect such sensitive, con-fidential or personal data or information, our facilities andsystems and those of our customers and third-party serv-ice providers may be vulnerable to security breaches,misplaced or lost data, and programming and/or usererrors that could lead to the compromising of sensitive,confidential or personal data or information.
Information system damages, disruptions, shutdownsor compromises could result in production downtimes andoperational disruptions, transaction errors, loss ofcustomers and business opportunities, legal liability, regu-latory fines, penalties or intervention, reputational damage,reimbursement or compensatory payments, and othercosts, any of which could have a material adverse effecton our business, financial position and results of oper-ations. Although we attempt to mitigate these risks byemploying a number of measures, our systems, networks,products, and services remain potentially vulnerable toadvanced and persistent threats.
We have a significant amount of goodwill and otherintangible assets and a write down would negativelyimpact operating results and shareholders’ equity.
At December 31, 2018, the carrying value of ourgoodwill and intangible assets was approximately$1.7 billion. We are required to evaluate our goodwillamounts annually, or more frequently when evidence ofpotential impairment exists. The impairment test requiresus to analyze a number of factors and make estimates thatrequire judgment. As a result of this testing, we have in thepast recognized goodwill impairment charges, and wehave identified one reporting unit that currently is at risk ofa significant future impairment charge if actual results fallshort of expectations. Future changes in the cost of capi-tal, expected cash flows, changes in our business strat-egy, and external market conditions, among other factors,could require us to record an impairment charge forgoodwill, which could lead to decreased assets andreduced net income. If a significant write down wererequired, the charge could have a material adverse effecton our operating results and shareholders’ equity.
Our ability to attract, develop and retain talentedexecutives, managers and employees is critical toour success.
Our ability to attract, develop and retain talentedemployees, including executives and other key managers,is important to our business. The experience and industrycontacts of our management team and other key person-nel significantly benefit us, and we need expertise liketheirs to carry out our business strategies and plans. Wealso rely on the specialized knowledge and experience ofcertain key technical employees. The loss of these keyofficers and employees, or the failure to attract anddevelop talented new executives, managers and employ-ees, could have a materially adverse effect on our busi-ness. Effective succession planning is also important toour long-term success, and failure to ensure effectivetransfer of knowledge and smooth transitions involving keyofficers and employees could hinder our strategic planningand execution.
Full realization of our deferred tax assets may beaffected by a number of factors.
We have deferred tax assets, including U.S. and foreignoperating loss carryforwards, capital loss carryforwards,employee and retiree benefit items, and other accruals notyet deductible for tax purposes. We have establishedvaluation allowances to reduce those deferred tax assetsto an amount that we believe is more likely than not to berealized prior to expiration of such deferred tax assets. Ourability to use these deferred tax assets depends in partupon our having future taxable income during the periodsin which these temporary differences reverse or our abilityto carry back any losses created by the deduction of thesetemporary differences. We expect to realize these assetsover an extended period. However, if we were unable togenerate sufficient future taxable income in the U.S. andcertain foreign jurisdictions, or if there were a significantchange in the time period within which the underlyingtemporary differences became taxable or deductible, wecould be required to increase our valuation allowancesagainst our deferred tax assets, which would increase oureffective tax rate which could have a material adverseeffect on our reported results of operations.
Our annual effective tax rate and the amount of taxeswe pay can change materially as a result of changesin U.S. and foreign tax laws, changes in the mix ofour U.S. and foreign earnings, adjustments to ourestimates for the potential outcome of any uncertaintax issues, and audits by federal, state and foreigntax authorities.
As a large multinational corporation, we are subject toU.S. federal, state and local, and many foreign tax lawsand regulations, all of which are complex and subject tovarying interpretations. Changes in these laws or regu-lations, or any change in the position of taxing authoritiesregarding their application, administration or interpretation,could have a material adverse effect on our business,consolidated financial condition or results of our oper-ations.
Due to widely varying tax rates in the taxing juris-dictions applicable to our business, a change in incomegeneration to higher taxing jurisdictions or away fromlower taxing jurisdictions may also have an adverse effecton our financial condition and results of operations.
14S O N O C O 2 0 1 8 A N N U A L R E P O R TS O N O C O 2 0 1 8 A N N U A L R E P O R T I F O R M 1 0 - K
We make estimates of the potential outcome ofuncertain tax issues based on our assessment of relevantrisks and facts and circumstances existing at the time, andwe use these assessments to determine the adequacy ofour provision for income taxes and other tax-relatedaccounts. These estimates are highly judgmental.Although we believe we adequately provide for anyreasonably foreseeable outcome related to these matters,future results may include favorable or unfavorableadjustments to estimated tax liabilities, which may causeour effective tax rate to fluctuate significantly.
In addition, our income tax returns are subject to regu-lar examination by domestic and foreign tax authorities.These taxing authorities may disagree with the positionswe have taken or intend to take regarding the tax treat-ment or characterization of any of our transactions. If anytax authorities were to successfully challenge the taxtreatment or characterization of any of our transactions, itcould have a material adverse effect on our business,consolidated financial condition or results of our oper-ations. Furthermore, regardless of whether any such chal-lenge is resolved in our favor, the final resolution of suchmatter could be expensive and time consuming to defendand/or settle. Future changes in tax law could significantlyimpact our provision for income taxes, the amount oftaxes payable, and our deferred tax asset and liabilitybalances.
As further discussed in Note 14 to our December 31,2018 financial statements included in Item 8 of this Form10-K, the IRS has previously notified us that it disagreeswith our characterization of a distribution, and subsequentrepayment, of an intercompany note in 2012 and 2013. Ifthe IRS were to prevail, we could be required to make anadjustment to income for the affected years and pay asignificant amount of additional taxes, which could have amaterial adverse effect on our results of operations andfinancial condition.
Challenges to, or the loss of, our intellectual propertyrights could have an adverse impact on our ability tocompete effectively.
Our ability to compete effectively depends, in part, onour ability to protect and maintain the proprietary nature ofour owned and licensed intellectual property. We own alarge number of patents on our products, aspects of ourproducts, methods of use and/or methods of manufactur-ing, and we own, or have licenses to use, all of thematerial trademark and trade name rights used in con-nection with the packaging, marketing and distribution ofour major products. We also rely on trade secrets,know-how and other unpatented proprietary technology.We attempt to protect and restrict access to ourintellectual property and proprietary information by relyingon the patent, trademark, copyright and trade secret lawsof the U.S. and other countries, as well as non-disclosureagreements. However, it may be possible for a third partyto obtain our information without our authorization,independently develop similar technologies, or breach anon-disclosure agreement entered into with us. Fur-thermore, many of the countries in which we operate donot have intellectual property laws that protect proprietaryrights as fully as do laws in the U.S. The use of ourintellectual property by someone else without our author-ization could reduce or eliminate certain of our competitiveadvantages, cause us to lose sales or otherwise harm our
business. The costs associated with protecting ourintellectual property rights could also adversely impact ourbusiness.
In addition, we are from time to time subject to claimsfrom third parties suggesting that we may be infringing ontheir intellectual property rights. If we were held liable forinfringement, we could be required to pay damages,obtain licenses or cease making or selling certain prod-ucts.
Intellectual property litigation, which could result insubstantial cost to us and divert the attention of manage-ment, may be necessary to protect our trade secrets orproprietary technology or for us to defend against claimedinfringement of the rights of others and to determine thescope and validity of others’ proprietary rights. We maynot prevail in any such litigation, and if we areunsuccessful, we may not be able to obtain any necessarylicenses on reasonable terms or at all. Failure to protectour patents, trademarks and other intellectual propertyrights may have a material adverse effect on our business,consolidated financial condition or results of operations.
If we fail to continue to maintain effective internalcontrol over financial reporting at a reasonableassurance level, we may not be able to accuratelyreport our financial results, and may be required torestate previously published financial information,which could have a material adverse effect on ouroperations, investor confidence in our business andthe trading prices of our securities.
Effective internal controls are necessary to provide reli-able financial reports and to assist in the effective pre-vention of fraud. Any inability to provide reliable financialreports or prevent fraud could harm our business. We arerequired to assess the effectiveness of our internal controlover financial reporting annually, as required by Sec-tion 404 of the Sarbanes-Oxley Act. We need to maintainour processes and systems and adapt them as our busi-ness grows and changes. This continuous process ofmaintaining and adapting our internal controls and comply-ing with Section 404 is expensive, time-consuming andrequires significant management attention. As we growour businesses and acquire other businesses, our internalcontrols will become increasingly complex and we mayrequire significantly more resources. The integration ofacquired businesses into our internal control over financialreporting has required, and will continue to require, sig-nificant time and resources from our management andother personnel and will increase our compliancecosts. Additionally, maintaining effectiveness of ourinternal control over financial reporting is made more chal-lenging by the fact that we have over 190 subsidiaries andjoint ventures in 36 countries around the world. Asdescribed in Item 9A of this Form 10-K, management hasconcluded that our internal controls over financial report-ing were effective as of December 31, 2018. There is noassurance that, in the future, material weaknesses will notbe identified that would cause management to change itscurrent conclusion as to the effectiveness of our internalcontrols. If we fail to maintain the adequacy of our internalcontrols, as such standards are modified, supplementedor amended from time to time, we could be subject toregulatory scrutiny, civil or criminal penalties or litigation. Inaddition, failure to maintain adequate internal controlscould result in financial statements that do not accurately
15S O N O C O 2 0 1 8 A N N U A L R E P O R TS O N O C O 2 0 1 8 A N N U A L R E P O R T I F O R M 1 0 - K
reflect our financial condition, and we may be required torestate previously published financial information, whichcould have a material adverse effect on our operations,investor confidence in our business and the trading pricesof our securities.
Several of our operations are conducted by jointventures that we cannot operate solely for ourbenefit.
Several of our operations are conducted through jointventures. In joint ventures, we share ownership and, insome instances, management of a company with one ormore parties who may or may not have the same goals,strategies, priorities or resources as we do. In general,joint ventures are intended to be operated for the benefitof all co-owners, rather than for our exclusive benefit.Operating a business as a joint venture often requiresadditional organizational formalities as well as time-consuming procedures for sharing information, accountingand making decisions. In certain cases, our joint venturepartners must agree in order for the applicable joint ven-ture to take certain actions, including acquisitions, the saleof assets, budget approvals, borrowing money and grant-ing liens on joint venture property. Our inability to takeunilateral action that we believe is in our best interests mayhave an adverse effect on the financial performance of thejoint venture and the return on our investment. In jointventures, we believe our relationship with our co-owners isan important factor to the success of the joint venture, andif a co-owner changes, our relationship may be adverselyaffected. In addition, the benefits from a successful jointventure are shared among the co-owners, so that we donot receive all the benefits from our successful joint ven-tures. Finally, we may be required on a legal or practicalbasis or both, to accept liability for obligations of a jointventure beyond our economic interest, including in caseswhere our co-owner becomes bankrupt or is otherwiseunable to meet its commitments.
Material disruptions in our business operations couldnegatively affect our financial results.
Although we take measures to minimize the risks ofdisruption at our facilities, we may nonetheless from timeto time encounter an unforeseen material operational dis-ruption in one of our major facilities, which could neg-atively impact production and our financial results. Such adisruption could occur as a result of any number of eventsincluding but not limited to a major equipment failure, laborstoppages, transportation failures affecting the supply andshipment of materials, disruptions at our suppliers, fire,severe weather conditions, natural disasters and dis-ruptions in utility services. These types of disruptionscould materially adversely affect our earnings to varyingdegrees depending upon the facility, the duration of thedisruption, our ability to shift business to another facility orfind alternative sources of materials or energy. Any lossesdue to these events may not be covered by our existinginsurance policies or may be subject to certain deduc-tibles.
Item 1B. Unresolved staff commentsThere are no unresolved written comments from the
SEC staff regarding the Company’s periodic or current1934 Act reports.
Item 2. PropertiesThe Company’s corporate offices are owned and oper-
ated in Hartsville, South Carolina. There are 103 ownedand 62 leased facilities used by operations in the Paperand Industrial Converted Products segment, 34 ownedand 52 leased facilities used by operations in theConsumer Packaging segment, 7 owned and 16 leasedfacilities used by operations in the Display and Packagingsegment, and 9 owned and 21 leased facilities used by theProtective Solutions segment. Europe, the most significantforeign geographic region in which the Company operates,has 62 manufacturing locations.
Item 3. Legal proceedingsThe Company has been named as a potentially respon-
sible party (PRP) at several environmentally contaminatedsites not owned by the Company. All of the sites are alsothe responsibility of other parties. The Company’s liability,if any, is shared with such other parties, but the Compa-ny’s share has not been finally determined in most cases.In some cases, the Company has cost-sharing agree-ments with other PRPs relating to the sharing of legaldefense costs and cleanup costs for a particular site. TheCompany has assumed, for accrual purposes, that theother parties to these cost-sharing agreements will per-form as agreed. Final resolution of some of the sites isyears away, and actual costs to be incurred for thesematters in future periods is likely to vary from current esti-mates because of the inherent uncertainties in evaluatingenvironmental exposures. Accordingly, the ultimate cost tothe Company with respect to such sites, beyond what hasbeen accrued as of December 31, 2018, cannot bedetermined.
As of December 31, 2018 and 2017, the Company hadaccrued $20.1 million and $20.3 million, respectively,related to environmental contingencies. The Companyperiodically reevaluates the assumptions used in determin-ing the appropriate reserves for environmental matters asadditional information becomes available and makesappropriate adjustments when warranted.
For further information about legal proceedings, seeNote 16 to the Company’s Consolidated Financial State-ments under Item 8 of this Annual Report on Form 10-K.
Other legal mattersAdditional information regarding legal proceedings is
provided in Note 16 to the Consolidated Financial State-ments of this Annual Report on Form 10-K.
Item 4. Mine safety disclosuresNot applicable.
16S O N O C O 2 0 1 8 A N N U A L R E P O R TS O N O C O 2 0 1 8 A N N U A L R E P O R T I F O R M 1 0 - K
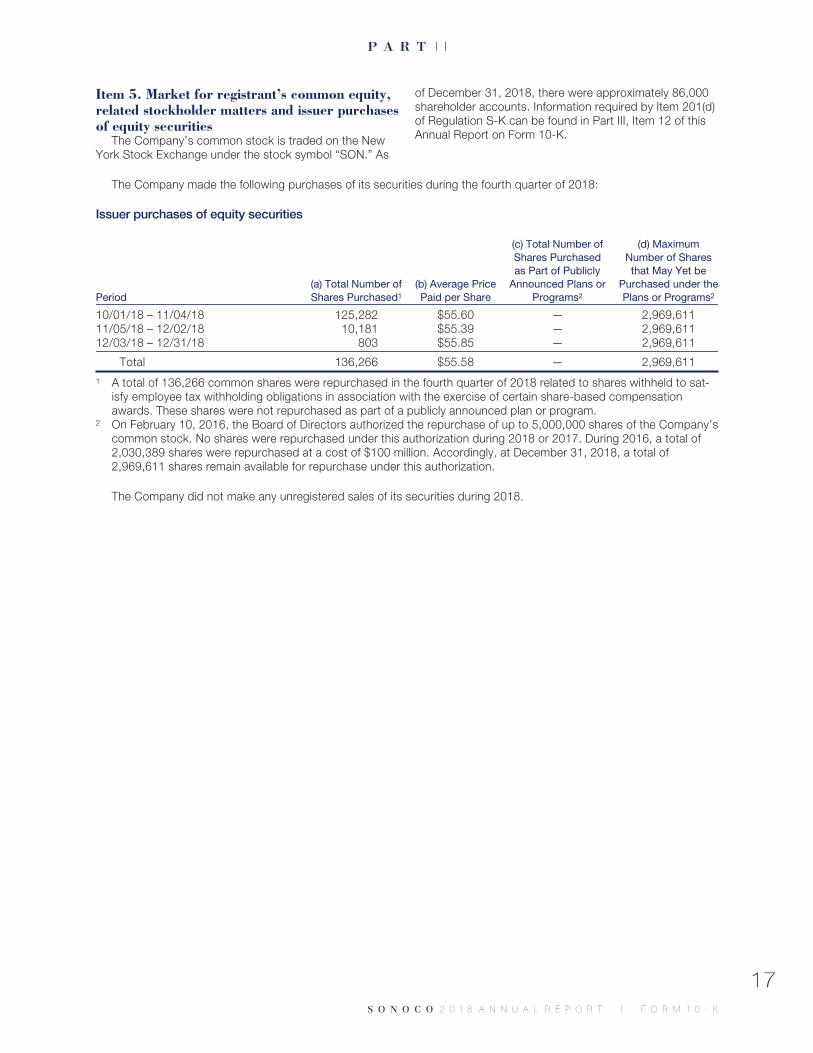
P A R T I I
Item 5. Market for registrant’s common equity,related stockholder matters and issuer purchasesof equity securities
The Company’s common stock is traded on the NewYork Stock Exchange under the stock symbol “SON.” As
of December 31, 2018, there were approximately 86,000shareholder accounts. Information required by Item 201(d)of Regulation S-K can be found in Part III, Item 12 of thisAnnual Report on Form 10-K.
The Company made the following purchases of its securities during the fourth quarter of 2018:
Issuer purchases of equity securities
Period(a) Total Number ofShares Purchased1
(b) Average PricePaid per Share
(c) Total Number ofShares Purchasedas Part of Publicly
Announced Plans orPrograms2
(d) MaximumNumber of Sharesthat May Yet be
Purchased under thePlans or Programs2
10/01/18 – 11/04/18 125,282 $55.60 — 2,969,61111/05/18 – 12/02/18 10,181 $55.39 — 2,969,61112/03/18 – 12/31/18 803 $55.85 — 2,969,611
Total 136,266 $55.58 — 2,969,6111 A total of 136,266 common shares were repurchased in the fourth quarter of 2018 related to shares withheld to sat-
isfy employee tax withholding obligations in association with the exercise of certain share-based compensationawards. These shares were not repurchased as part of a publicly announced plan or program.
2 On February 10, 2016, the Board of Directors authorized the repurchase of up to 5,000,000 shares of the Company’scommon stock. No shares were repurchased under this authorization during 2018 or 2017. During 2016, a total of2,030,389 shares were repurchased at a cost of $100 million. Accordingly, at December 31, 2018, a total of2,969,611 shares remain available for repurchase under this authorization.
The Company did not make any unregistered sales of its securities during 2018.
17S O N O C O 2 0 1 8 A N N U A L R E P O R TS O N O C O 2 0 1 8 A N N U A L R E P O R T I F O R M 1 0 - K
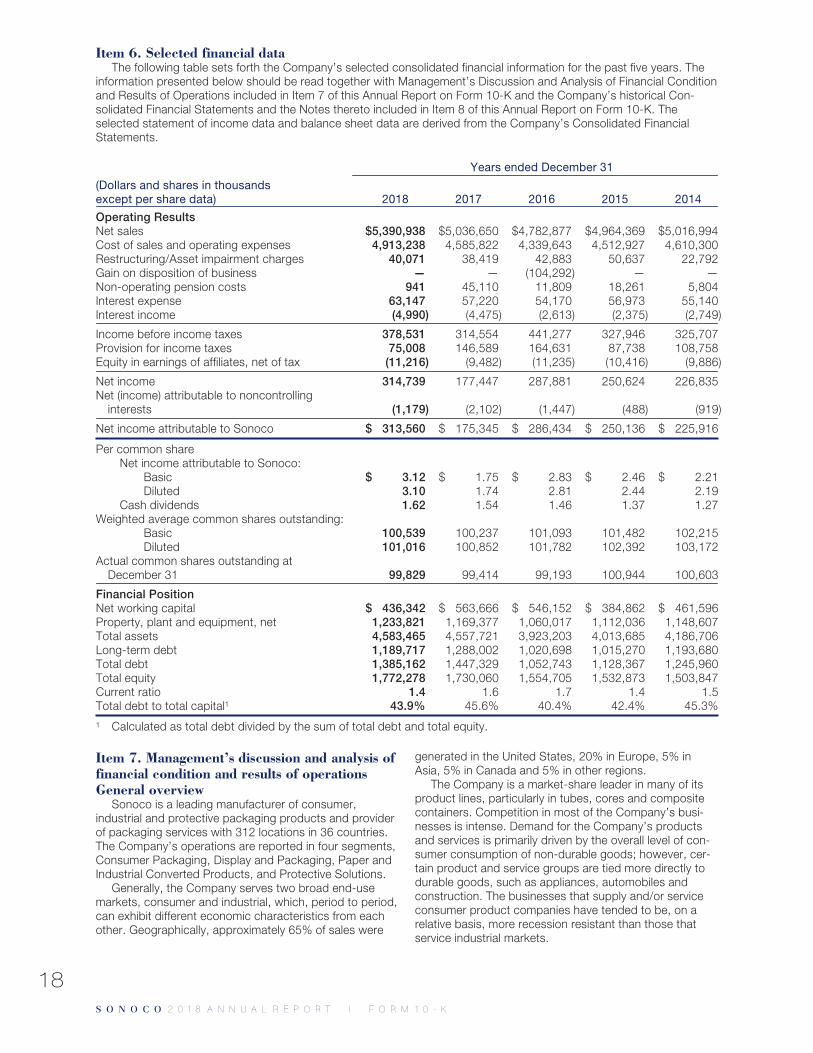
Item 6. Selected financial dataThe following table sets forth the Company’s selected consolidated financial information for the past five years. The
information presented below should be read together with Management’s Discussion and Analysis of Financial Conditionand Results of Operations included in Item 7 of this Annual Report on Form 10-K and the Company’s historical Con-solidated Financial Statements and the Notes thereto included in Item 8 of this Annual Report on Form 10-K. Theselected statement of income data and balance sheet data are derived from the Company’s Consolidated FinancialStatements.
Years ended December 31
(Dollars and shares in thousandsexcept per share data) 2018 2017 2016 2015 2014
Operating ResultsNet sales $5,390,938 $5,036,650 $4,782,877 $4,964,369 $5,016,994Cost of sales and operating expenses 4,913,238 4,585,822 4,339,643 4,512,927 4,610,300Restructuring/Asset impairment charges 40,071 38,419 42,883 50,637 22,792Gain on disposition of business — — (104,292) — —Non-operating pension costs 941 45,110 11,809 18,261 5,804Interest expense 63,147 57,220 54,170 56,973 55,140Interest income (4,990) (4,475) (2,613) (2,375) (2,749)
Income before income taxes 378,531 314,554 441,277 327,946 325,707Provision for income taxes 75,008 146,589 164,631 87,738 108,758Equity in earnings of affiliates, net of tax (11,216) (9,482) (11,235) (10,416) (9,886)
Net income 314,739 177,447 287,881 250,624 226,835Net (income) attributable to noncontrolling
interests (1,179) (2,102) (1,447) (488) (919)
Net income attributable to Sonoco $ 313,560 $ 175,345 $ 286,434 $ 250,136 $ 225,916
Per common shareNet income attributable to Sonoco:
Basic $ 3.12 $ 1.75 $ 2.83 $ 2.46 $ 2.21Diluted 3.10 1.74 2.81 2.44 2.19
Cash dividends 1.62 1.54 1.46 1.37 1.27Weighted average common shares outstanding:
Basic 100,539 100,237 101,093 101,482 102,215Diluted 101,016 100,852 101,782 102,392 103,172
Actual common shares outstanding atDecember 31 99,829 99,414 99,193 100,944 100,603
Financial PositionNet working capital $ 436,342 $ 563,666 $ 546,152 $ 384,862 $ 461,596Property, plant and equipment, net 1,233,821 1,169,377 1,060,017 1,112,036 1,148,607Total assets 4,583,465 4,557,721 3,923,203 4,013,685 4,186,706Long-term debt 1,189,717 1,288,002 1,020,698 1,015,270 1,193,680Total debt 1,385,162 1,447,329 1,052,743 1,128,367 1,245,960Total equity 1,772,278 1,730,060 1,554,705 1,532,873 1,503,847Current ratio 1.4 1.6 1.7 1.4 1.5Total debt to total capital1 43.9% 45.6% 40.4% 42.4% 45.3%1 Calculated as total debt divided by the sum of total debt and total equity.
Item 7. Management’s discussion and analysis offinancial condition and results of operationsGeneral overview
Sonoco is a leading manufacturer of consumer,industrial and protective packaging products and providerof packaging services with 312 locations in 36 countries.The Company’s operations are reported in four segments,Consumer Packaging, Display and Packaging, Paper andIndustrial Converted Products, and Protective Solutions.
Generally, the Company serves two broad end-usemarkets, consumer and industrial, which, period to period,can exhibit different economic characteristics from eachother. Geographically, approximately 65% of sales were
generated in the United States, 20% in Europe, 5% inAsia, 5% in Canada and 5% in other regions.
The Company is a market-share leader in many of itsproduct lines, particularly in tubes, cores and compositecontainers. Competition in most of the Company’s busi-nesses is intense. Demand for the Company’s productsand services is primarily driven by the overall level of con-sumer consumption of non-durable goods; however, cer-tain product and service groups are tied more directly todurable goods, such as appliances, automobiles andconstruction. The businesses that supply and/or serviceconsumer product companies have tended to be, on arelative basis, more recession resistant than those thatservice industrial markets.
18S O N O C O 2 0 1 8 A N N U A L R E P O R TS O N O C O 2 0 1 8 A N N U A L R E P O R T I F O R M 1 0 - K
Financially, the Company’s objective is to deliver aver-age annual double-digit total returns to shareholders overtime. To meet that target, the Company focuses on threemajor areas: driving profitable sales growth, improvingmargins and leveraging the Company’s strong cash flowand financial position. Operationally, the Company’s goalis to be the acknowledged leader in high-quality,innovative, value-creating packaging solutions within tar-geted customer market segments.
Over the next two to three years, the Company aspiresto achieve operating profit before depreciation and amor-tization (OPBDA) margins of 16% per year and annualsales of approximately $6 billion. (See “Use of Non-GAAPfinancial measures” below). The Company believes it willachieve these goals by focusing on the following: organicsales growth, including new product development andexpansion in emerging international markets; strategicportfolio optimization; and margin enhancement throughmore effective customer relationship management, organ-izational design, indirect spend management, andimproved manufacturing productivity, supply chain andback office support processes.
Use of non-GAAP financial measuresTo assess and communicate the financial performance
of the Company, Sonoco management uses, bothinternally and externally, certain financial performancemeasures that are not in conformity with generallyaccepted accounting principles (“non-GAAP” financialmeasures). These non-GAAP financial measures reflectthe Company’s GAAP operating results adjusted toremove amounts, including the associated tax effects,relating to restructuring initiatives, asset impairmentcharges, environmental charges, acquisition-related costs,gains or losses from the disposition of businesses, excessproperty insurance recoveries, pension settlementcharges, certain income tax events and other items, if any,including other income tax-related adjustments and/orevents, the exclusion of which management believesimproves the period-to-period comparability and analysisof the underlying financial performance of the business.The adjusted non-GAAP results are identified using theterm “base,” for example, “base earnings.”
The Company’s base financial performance measuresare not in accordance with, nor an alternative for, meas-ures conforming to generally accepted accounting princi-ples and may be different from non-GAAP measures usedby other companies. In addition, these non-GAAP meas-ures are not based on any comprehensive set of account-ing rules or principles. Sonoco continues to provide allinformation required by GAAP, but it believes that evaluat-ing its ongoing operating results may not be as useful if aninvestor or other user is limited to reviewing only GAAPfinancial measures. The Company uses the non-GAAP“base” performance measures presented herein forinternal planning and forecasting purposes, to evaluate itsongoing operations, and to evaluate the ultimate perform-ance of management and each business unit against plan/forecast all the way up through the evaluation of the ChiefExecutive Officer’s performance by the Board of Directors.In addition, these same non-GAAP measures are used indetermining incentive compensation for the entiremanagement team and in providing earnings guidance tothe investing community.
Sonoco management does not, nor does it suggestthat investors should, consider these non-GAAP financialmeasures in isolation from, or as a substitute for, financialinformation prepared in accordance with GAAP. Sonocopresents these non-GAAP financial measures to provideusers information to evaluate Sonoco’s operating results ina manner similar to how management evaluates businessperformance. Material limitations associated with the useof such measures are that they do not reflect all periodcosts included in operating expenses and may not reflectfinancial results that are comparable to financial results ofother companies that present similar costs differently.Furthermore, the calculations of these non-GAAP meas-ures are based on subjective determinations of manage-ment regarding the nature and classification of events andcircumstances that the investor may find material and viewdifferently. To compensate for these limitations, manage-ment believes that it is useful in understanding and analyz-ing the results of the business to review both GAAPinformation which includes all of the items impacting finan-cial results and the non-GAAP measures that excludecertain elements, as described above.
Restructuring and restructuring-related asset impair-ment charges are a recurring item as Sonoco’s restructur-ing programs usually require several years to fullyimplement and the Company is continually seeking to takeactions that could enhance its efficiency. Although recur-ring, these charges are subject to significant fluctuationsfrom period to period due to the varying levels ofrestructuring activity and the inherent imprecision in theestimates used to recognize the impairment of assets andthe wide variety of costs and taxes associated with sev-erance and termination benefits in the countries in whichthe restructuring actions occur. Similarly, non-operatingpension expense is a recurring item. However, thisexpense is subject to significant fluctuations from period toperiod due to changes in actuarial assumptions, globalfinancial markets (including stock market returns andinterest rate changes), plan changes, settlements, curtail-ments, and other changes in facts and circumstances.
Reconciliations of GAAP to base results are presentedon pages 23 and 24 in conjunction with management’sdiscussion and analysis of the Company’s results of oper-ations. Whenever reviewing a non-GAAP financial meas-ure, readers are encouraged to review the relatedreconciliation to fully understand how it differs from therelated GAAP measure. Reconciliations are not providedfor non-GAAP measures related to future years due to thelikely occurrence of one or more of the following, the tim-ing and magnitude of which management is unable to reli-ably forecast: possible gains or losses on the sale ofbusinesses or other assets, restructuring costs andrestructuring-related impairment charges, acquisition-related costs, and the tax effect of these items and/orother income tax-related events. These items could have asignificant impact on the Company’s future GAAP financialresults.
2018 overview and 2019 outlookThe Company produced strong top-line, bottom-line
and cash flow results in 2018 despite low growth rates inmany of the Company’s served markets, acceleratinginflation, tariffs and disappointing performances in ourplastics and flexible packaging businesses. Year-over-yeargrowth in consolidated operating profit of 6.1% was
19S O N O C O 2 0 1 8 A N N U A L R E P O R TS O N O C O 2 0 1 8 A N N U A L R E P O R T I F O R M 1 0 - K
largely driven by a $49.5 million, or 30.7%, increase in theoperating profit of Paper and Industrial Converted Prod-ucts and was also aided by a strong turnaround in ourDisplay and Packaging segment. These gains were parti-ally offset by a $31.3 million, or 12.2%, decline in operat-ing profits for our Consumer Packaging segment.Operating profit for our Protective Solutions segment wasrelatively flat year over year. On a company-wide basis,gains from a positive overall price/cost relationship (therelationship of the change in sales prices to the change incosts of materials, energy and freight) and the addedoperating profit from acquisitions were only partially offsetby higher labor, maintenance and other operating costs.As a result, consolidated gross profit margin for 2018improved modestly to 19.3% compared to 19.0% in 2017.
Net Income Attributable to Sonoco (GAAP earnings) for2018 increased $138.2 million, or 78.8%, year over year.This increase is largely due to prior-year pension settle-ment charges totaling $20.2 million, after-tax, a prior-year$51.3 million net tax charge related to the enactment ofthe U.S. Tax Cuts and Jobs Act (“Tax Act”), and a 2018valuation allowance release triggered by certain provisionsof the Tax Act. The remainder is largely due to higher 2018operating income together with the lower US statutory taxrate established by the Tax Act. Base earnings, whichexclude the previously mentioned prior-year charges, thevaluation allowance release, as well as certain other itemsof income and expense, as more fully described within thisItem under “Use of Non-GAAP financial measures” andreconciled within this Item under “Reconciliations of GAAPto Non-GAAP financial measures,” improved $58.8 million,or 20.9%, year over year.
Management’s focus in 2018 was on driving synergieswith acquired businesses, accelerating organic growth,improving manufacturing productivity, using the Compa-ny’s strong financial position to make strategic acquis-itions and improving operating efficiency and financialperformance of the Company’s contract packaging serv-ices center near Atlanta, Georgia. Management expectedoverall volume in 2018 to increase approximately 2%,overall price/cost to be positive and that manufacturingproductivity would more than offset increases in labor andother costs. Actual 2018 volume increased slightly morethan one percent as gains in Display and Packaging werepartially offset by declines in Consumer Products andPaper and Industrial Converted Products. The 2018 per-formance of businesses acquired in 2017 fell short ofexpectations due to a combination of volume shortfalls,production inefficiencies and negative price / cost. Thevolume shortfalls and production inefficiencies in thesebusinesses were significant drivers leading to an overallflat year for manufacturing productivity. However, price/cost was positive in almost all of the Company’s otherbusinesses, and was extremely positive in the Paper andIndustrial Converted Products segment and the Companyas a whole. Despite continued improvements at itsAtlanta-area packaging center, the Company determinedthat it could not achieve acceptable margins under theassociated single-customer contract and negotiated anearly termination of that contract and exited the facility latein the third quarter of 2018. In October, the Companyacquired both the remaining 70 percent interest in itsConitex-Sonoco tube and core/paper joint venture and acomposite can operation from Texpack, Inc. This trans-action brings the joint venture operations under the sole
control of the Company and expands its exposure to theAsia paper and industrial products market. In April, theCompany acquired Highland Packaging Solutions, amanufacturer of thermoformed plastic packaging for freshproduce and dairy products. Highland expands theCompany’s footprint in its targeted “perimeter of the store”market. These transactions are described in greater detailbelow.
Pension and postretirement benefit expenses for theyear were approximately $44 million lower in 2018 than2017, due primarily to settlement charges related to lumpsum payments and purchases of annuities for certain planparticipants in 2017. Excluding these charges, total benefitplan expense was approximately $12 million lower in 2018than in 2017. This decrease was primarily due to higherexpected returns on plan assets due to a higher assetbase as of December 31, 2017. Total net contributions in2018 to the Company’s domestic and international pen-sion and postretirement plans were approximately$25 million. The aggregate net unfunded position of theCompany’s various defined benefit plans increased from$332 million at the end of 2017, to $369 million at the endof 2018. This increase was driven by normal service andinterest cost and a negative actual return on plan assetsduring 2018, partially offset by the impact of contributionsand slightly higher discount rates on plan liabilities atDecember 31, 2018.
The effective tax rate on GAAP earnings was 19.8%,compared with 46.6% in 2017, and the effective tax rateon base earnings was 23.7%, compared with 31.1% in2017. The year-over-year decrease in both GAAP andbase effective tax rates was driven primarily by the TaxAct, including the decrease in the U.S. Federal income taxrate from 35% to 21%. The year-over-year variance in theGAAP tax rate is also driven by Tax Act changes, includingthe 2018 benefit from the release of a valuation allowanceon foreign tax credits of $16.1 million and the exceptionallyhigh 2017 rate, which included approximately$51.2 million of one-time tax charges related to the TaxAct.
The Company generated $589.9 million in cash fromoperations during 2018, compared with $348.3 million in2017. The majority of the year-over-year increase is attrib-utable to higher net income, lower pension and post-retirement contributions and a beneficial difference in thechanges in working capital, partially offset by anunfavorable difference in the change in income taxaccruals. Cash flow from operations is expected to beapproximately $600 million in 2019.
OutlookIn 2019, management’s focus will be on generating
profitable growth, improving margins, driving free cashflow, and portfolio optimization, including the potential forboth targeted acquisitions and divestitures, which, in turn,are expected to impact margins and prospects for profit-able growth. Key to management’s objectives for the yearwill be further development of the Company’s previouslyimplemented commercial and operational excellence ini-tiatives aimed at improving margins by more-fully realizingthe value of our products and services, reducing our unitcosts and better leveraging our fixed support costs.
Management is targeting an overall organic volumeincrease in 2019 of approximately 1.0%. Although theCompany has projected that overall price/cost will be pos-
20S O N O C O 2 0 1 8 A N N U A L R E P O R TS O N O C O 2 0 1 8 A N N U A L R E P O R T I F O R M 1 0 - K
itive in 2019, duplicating the degree of price/costimprovement seen in 2018 is considered unlikely. Con-tinued volatility in key raw material prices would make fullrecovery of any related cost increases more challenging.And, although manufacturing productivity is expected tooffset a significant portion of the projected increases inlabor and other costs, not realizing the targeted organicvolume gains would make fully achieving management’sproductivity objectives more difficult. Operating results in2019 will include a full year of revenue and operating profitfrom Highland and Conitex.
The Company projects the non-operating componentof pension and post-retirement benefits expense to beapproximately $19 million higher, while the operatingcomponent is projected to be $3 million lower. The netanticipated increase of $16 million is primarily due to lowerexpected returns on plan assets due to a lower asset baseand a 25 basis point decrease in the 2019 expected rateof return assumption. Total contributions in 2019 to theCompany’s domestic and international pension and post-retirement plans are expected to be approximately$31.0 million.
In consideration of the above factors, management isprojecting that reported net sales will increase nearly 5%and overall margins for gross profit, base operating profitand base operating profit before depreciation and amor-tization will improve modestly over 2018 levels.
Absent additional borrowings in 2019 from any acquis-ition activity, net interest expense is expected to decreaseapproximately $3 million due to lower average annual debtbalances as the Company would expect to use a portionof its free cash flow to pay down existing debt. The con-solidated effective tax rate on base earnings is expectedto be between 25.5% and 26.5% in 2019 compared with23.7% in 2018. The anticipated year-over-year increase isdue to discrete items that benefited the 2018 rate that arenot expected to recur in 2019.
The Company does not provide projected GAAP earn-ings results due to the likely occurrence of one or more ofthe following, the timing and magnitude of which we areunable to reliably forecast: possible gains or losses on thesale of businesses or other assets, restructuring costs andrestructuring-related impairment charges, acquisition-related costs, and the income tax effects of these itemsand/or other income tax-related events. These items couldhave a significant impact on the Company’s future GAAPfinancial results.
Acquisitions and dispositionsAcquisitions
The Company completed three acquisitions during2018 at a cost of $278.8 million, net of cash acquired. OnOctober 1, 2018, the Company completed the acquisitionof the remaining 70 percent interest in Conitex Sonoco(BVI), Ltd. (“Conitex Sonoco”) from Texpack Investments,Inc. (“Texpack”) for total consideration of $134.8 million,including net cash payments of $127.8 million and debtassumed of $7.1 million. Final consideration was subjectto a post-closing adjustment for the change in workingcapital to the date of closing. This adjustment was settledin February 2019 and required an additional cash paymentof approximately $0.1 million. The Conitex Sonoco jointventure was formed in 1998 with Texpack, a Spanish-based global provider of paperboard and paper-basedpackaging products. Conitex Sonoco produces uncoated
recycled paperboard and tubes and cones for the globalspun yarn industry, as well as adhesives, flexible inter-mediate bulk containers and corrugated pallets. ConitexSonoco has approximately 1,250 employees across 13manufacturing locations in 10 countries, including fourpaper mills and seven cone and tube converting oper-ations and two other production facilities. The acquisitionof Conitex Sonoco is expected to add approximately$260 million of annual sales in the Company’s Paper andIndustrial Converted Products segment. Also onOctober 1, 2018, the Company acquired from TexpackGroup Holdings B.V. a rigid paper facility in Spain(“Compositub”) for $10.0 million in cash. Final consid-eration was subject to a post-closing adjustment for thechange in working capital to the date of closing. Thisadjustment was settled in February 2019 for an additionalcash payment to the seller of $0.4 million. Both the Con-itex Sonoco and Compositub acquisitions were fundedwith existing cash on hand. On April 12, 2018, the Com-pany completed the acquisition of Highland PackagingSolutions (“Highland”). Total consideration for this acquis-ition was $148.5 million, including net cash paid at closingof $141.0, along with a contingent purchase liability of$7.5 million. The contingent purchase liability is basedupon a sales metric which the Company expects to meetand is payable in two installments. The first installment of$5.0 million is to be paid one year after the closing dateand the second installment of $2.5 million is to be paidtwo years after the closing date. The liability for these twopayments has been recognized in full on the Company’sConsolidated Balance Sheet at December 31, 2018, withthe first installment included in “Accrued expenses andother” and the second in “Other Liabilities.” Highlandmanufactures thermoformed plastic packaging for freshproduce and dairy products from a single productionfacility in Plant City, Florida, providing total packaging sol-utions for customers that include sophisticated engineeredcontainers, flexographic printed labels, and inventorymanagement through distribution warehouses in theSoutheast and West Coast of the United States. TheCompany financed the acquisition with proceeds from anew $100.0 million term loan, along with proceeds fromexisting credit facilities. This loan was repaid in full beforethe end of 2018. The acquisition of Highland is expectedto add approximately $110 million of annual sales in theCompany’s Consumer Packaging segment.
The Company completed two acquisitions during 2017at a cost of $383.7 million, net of cash acquired. OnMarch 14, 2017, the Company completed the acquisitionof Packaging Holdings, Inc. and subsidiaries, includingPeninsula Packaging LLC (“Packaging Holdings”), for$218.8 million, net of cash acquired. Packaging Holdingsmanufactures thermoformed packaging for a wide rangeof whole fresh fruits, pre-cut fruits and produce, preparedsalad mixes, as well as baked goods in retail supermarketsfrom five manufacturing facilities, including four in theUnited States and one in Mexico. The Company financedthe transaction with a combination of cash and borrow-ings, including a $150.0 million three-year term loan. OnJuly 24, 2017, the Company completed the acquisition ofClear Lam Packaging, Inc. (“Clear Lam”) for $165.0 million,net of cash acquired. Final consideration was subject toan adjustment for working capital, which was completed in2018 resulting in $1.6 million of cash being returned to theCompany. Clear Lam manufactures high barrier flexible
21S O N O C O 2 0 1 8 A N N U A L R E P O R TS O N O C O 2 0 1 8 A N N U A L R E P O R T I F O R M 1 0 - K
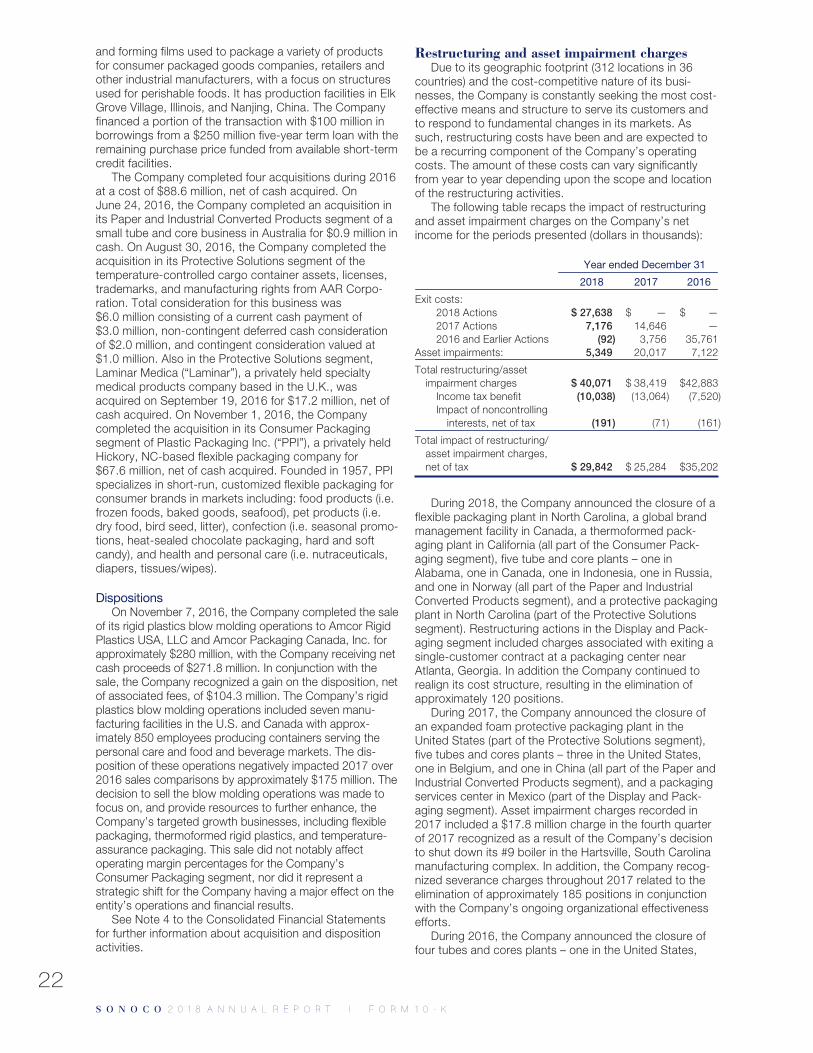
and forming films used to package a variety of productsfor consumer packaged goods companies, retailers andother industrial manufacturers, with a focus on structuresused for perishable foods. It has production facilities in ElkGrove Village, Illinois, and Nanjing, China. The Companyfinanced a portion of the transaction with $100 million inborrowings from a $250 million five-year term loan with theremaining purchase price funded from available short-termcredit facilities.
The Company completed four acquisitions during 2016at a cost of $88.6 million, net of cash acquired. OnJune 24, 2016, the Company completed an acquisition inits Paper and Industrial Converted Products segment of asmall tube and core business in Australia for $0.9 million incash. On August 30, 2016, the Company completed theacquisition in its Protective Solutions segment of thetemperature-controlled cargo container assets, licenses,trademarks, and manufacturing rights from AAR Corpo-ration. Total consideration for this business was$6.0 million consisting of a current cash payment of$3.0 million, non-contingent deferred cash considerationof $2.0 million, and contingent consideration valued at$1.0 million. Also in the Protective Solutions segment,Laminar Medica (“Laminar”), a privately held specialtymedical products company based in the U.K., wasacquired on September 19, 2016 for $17.2 million, net ofcash acquired. On November 1, 2016, the Companycompleted the acquisition in its Consumer Packagingsegment of Plastic Packaging Inc. (“PPI”), a privately heldHickory, NC-based flexible packaging company for$67.6 million, net of cash acquired. Founded in 1957, PPIspecializes in short-run, customized flexible packaging forconsumer brands in markets including: food products (i.e.frozen foods, baked goods, seafood), pet products (i.e.dry food, bird seed, litter), confection (i.e. seasonal promo-tions, heat-sealed chocolate packaging, hard and softcandy), and health and personal care (i.e. nutraceuticals,diapers, tissues/wipes).
DispositionsOn November 7, 2016, the Company completed the sale
of its rigid plastics blow molding operations to Amcor RigidPlastics USA, LLC and Amcor Packaging Canada, Inc. forapproximately $280 million, with the Company receiving netcash proceeds of $271.8 million. In conjunction with thesale, the Company recognized a gain on the disposition, netof associated fees, of $104.3 million. The Company’s rigidplastics blow molding operations included seven manu-facturing facilities in the U.S. and Canada with approx-imately 850 employees producing containers serving thepersonal care and food and beverage markets. The dis-position of these operations negatively impacted 2017 over2016 sales comparisons by approximately $175 million. Thedecision to sell the blow molding operations was made tofocus on, and provide resources to further enhance, theCompany’s targeted growth businesses, including flexiblepackaging, thermoformed rigid plastics, and temperature-assurance packaging. This sale did not notably affectoperating margin percentages for the Company’sConsumer Packaging segment, nor did it represent astrategic shift for the Company having a major effect on theentity’s operations and financial results.
See Note 4 to the Consolidated Financial Statementsfor further information about acquisition and dispositionactivities.
Restructuring and asset impairment chargesDue to its geographic footprint (312 locations in 36
countries) and the cost-competitive nature of its busi-nesses, the Company is constantly seeking the most cost-effective means and structure to serve its customers andto respond to fundamental changes in its markets. Assuch, restructuring costs have been and are expected tobe a recurring component of the Company’s operatingcosts. The amount of these costs can vary significantlyfrom year to year depending upon the scope and locationof the restructuring activities.
The following table recaps the impact of restructuringand asset impairment charges on the Company’s netincome for the periods presented (dollars in thousands):
Year ended December 31
2018 2017 2016
Exit costs:2018 Actions $ 27,638 $ — $ —2017 Actions 7,176 14,646 —2016 and Earlier Actions (92) 3,756 35,761
Asset impairments: 5,349 20,017 7,122
Total restructuring/assetimpairment charges $ 40,071 $ 38,419 $42,883
Income tax benefit (10,038) (13,064) (7,520)Impact of noncontrolling
interests, net of tax (191) (71) (161)
Total impact of restructuring/asset impairment charges,net of tax $ 29,842 $ 25,284 $35,202
During 2018, the Company announced the closure of aflexible packaging plant in North Carolina, a global brandmanagement facility in Canada, a thermoformed pack-aging plant in California (all part of the Consumer Pack-aging segment), five tube and core plants – one inAlabama, one in Canada, one in Indonesia, one in Russia,and one in Norway (all part of the Paper and IndustrialConverted Products segment), and a protective packagingplant in North Carolina (part of the Protective Solutionssegment). Restructuring actions in the Display and Pack-aging segment included charges associated with exiting asingle-customer contract at a packaging center nearAtlanta, Georgia. In addition the Company continued torealign its cost structure, resulting in the elimination ofapproximately 120 positions.
During 2017, the Company announced the closure ofan expanded foam protective packaging plant in theUnited States (part of the Protective Solutions segment),five tubes and cores plants – three in the United States,one in Belgium, and one in China (all part of the Paper andIndustrial Converted Products segment), and a packagingservices center in Mexico (part of the Display and Pack-aging segment). Asset impairment charges recorded in2017 included a $17.8 million charge in the fourth quarterof 2017 recognized as a result of the Company’s decisionto shut down its #9 boiler in the Hartsville, South Carolinamanufacturing complex. In addition, the Company recog-nized severance charges throughout 2017 related to theelimination of approximately 185 positions in conjunctionwith the Company’s ongoing organizational effectivenessefforts.
During 2016, the Company announced the closure offour tubes and cores plants – one in the United States,
22S O N O C O 2 0 1 8 A N N U A L R E P O R TS O N O C O 2 0 1 8 A N N U A L R E P O R T I F O R M 1 0 - K
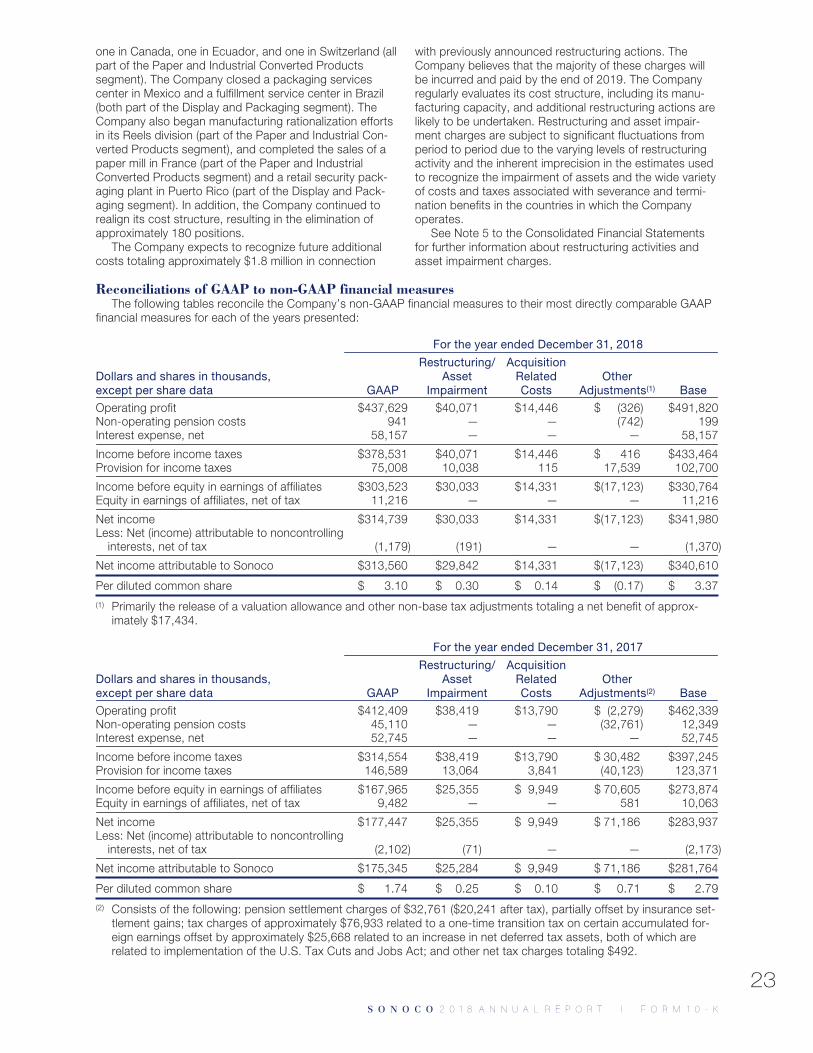
one in Canada, one in Ecuador, and one in Switzerland (allpart of the Paper and Industrial Converted Productssegment). The Company closed a packaging servicescenter in Mexico and a fulfillment service center in Brazil(both part of the Display and Packaging segment). TheCompany also began manufacturing rationalization effortsin its Reels division (part of the Paper and Industrial Con-verted Products segment), and completed the sales of apaper mill in France (part of the Paper and IndustrialConverted Products segment) and a retail security pack-aging plant in Puerto Rico (part of the Display and Pack-aging segment). In addition, the Company continued torealign its cost structure, resulting in the elimination ofapproximately 180 positions.
The Company expects to recognize future additionalcosts totaling approximately $1.8 million in connection
with previously announced restructuring actions. TheCompany believes that the majority of these charges willbe incurred and paid by the end of 2019. The Companyregularly evaluates its cost structure, including its manu-facturing capacity, and additional restructuring actions arelikely to be undertaken. Restructuring and asset impair-ment charges are subject to significant fluctuations fromperiod to period due to the varying levels of restructuringactivity and the inherent imprecision in the estimates usedto recognize the impairment of assets and the wide varietyof costs and taxes associated with severance and termi-nation benefits in the countries in which the Companyoperates.
See Note 5 to the Consolidated Financial Statementsfor further information about restructuring activities andasset impairment charges.
Reconciliations of GAAP to non-GAAP financial measuresThe following tables reconcile the Company’s non-GAAP financial measures to their most directly comparable GAAP
financial measures for each of the years presented:
For the year ended December 31, 2018
Dollars and shares in thousands,except per share data GAAP
Restructuring/Asset
Impairment
AcquisitionRelatedCosts
OtherAdjustments(1) Base
Operating profit $437,629 $40,071 $14,446 $ (326) $491,820Non-operating pension costs 941 — — (742) 199Interest expense, net 58,157 — — — 58,157
Income before income taxes $378,531 $40,071 $14,446 $ 416 $433,464Provision for income taxes 75,008 10,038 115 17,539 102,700
Income before equity in earnings of affiliates $303,523 $30,033 $14,331 $(17,123) $330,764Equity in earnings of affiliates, net of tax 11,216 — — — 11,216
Net income $314,739 $30,033 $14,331 $(17,123) $341,980Less: Net (income) attributable to noncontrolling
interests, net of tax (1,179) (191) — — (1,370)
Net income attributable to Sonoco $313,560 $29,842 $14,331 $(17,123) $340,610
Per diluted common share $ 3.10 $ 0.30 $ 0.14 $ (0.17) $ 3.37(1) Primarily the release of a valuation allowance and other non-base tax adjustments totaling a net benefit of approx-
imately $17,434.
For the year ended December 31, 2017
Dollars and shares in thousands,except per share data GAAP
Restructuring/Asset
Impairment
AcquisitionRelatedCosts
OtherAdjustments(2) Base
Operating profit $412,409 $38,419 $13,790 $ (2,279) $462,339Non-operating pension costs 45,110 — — (32,761) 12,349Interest expense, net 52,745 — — — 52,745
Income before income taxes $314,554 $38,419 $13,790 $ 30,482 $397,245Provision for income taxes 146,589 13,064 3,841 (40,123) 123,371
Income before equity in earnings of affiliates $167,965 $25,355 $ 9,949 $ 70,605 $273,874Equity in earnings of affiliates, net of tax 9,482 — — 581 10,063
Net income $177,447 $25,355 $ 9,949 $ 71,186 $283,937Less: Net (income) attributable to noncontrolling
interests, net of tax (2,102) (71) — — (2,173)
Net income attributable to Sonoco $175,345 $25,284 $ 9,949 $ 71,186 $281,764
Per diluted common share $ 1.74 $ 0.25 $ 0.10 $ 0.71 $ 2.79(2) Consists of the following: pension settlement charges of $32,761 ($20,241 after tax), partially offset by insurance set-
tlement gains; tax charges of approximately $76,933 related to a one-time transition tax on certain accumulated for-eign earnings offset by approximately $25,668 related to an increase in net deferred tax assets, both of which arerelated to implementation of the U.S. Tax Cuts and Jobs Act; and other net tax charges totaling $492.
23S O N O C O 2 0 1 8 A N N U A L R E P O R TS O N O C O 2 0 1 8 A N N U A L R E P O R T I F O R M 1 0 - K
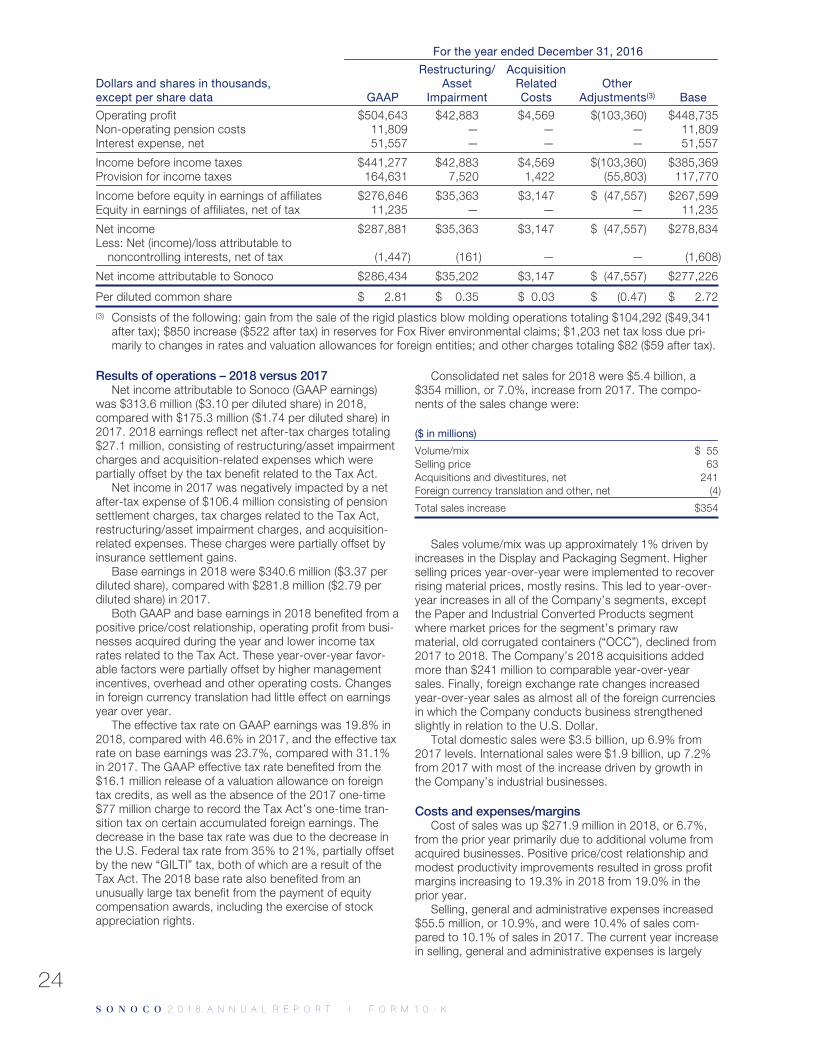
For the year ended December 31, 2016
Dollars and shares in thousands,except per share data GAAP
Restructuring/Asset
Impairment
AcquisitionRelatedCosts
OtherAdjustments(3) Base
Operating profit $504,643 $42,883 $4,569 $(103,360) $448,735Non-operating pension costs 11,809 — — — 11,809Interest expense, net 51,557 — — — 51,557
Income before income taxes $441,277 $42,883 $4,569 $(103,360) $385,369Provision for income taxes 164,631 7,520 1,422 (55,803) 117,770
Income before equity in earnings of affiliates $276,646 $35,363 $3,147 $ (47,557) $267,599Equity in earnings of affiliates, net of tax 11,235 — — — 11,235
Net income $287,881 $35,363 $3,147 $ (47,557) $278,834Less: Net (income)/loss attributable to
noncontrolling interests, net of tax (1,447) (161) — — (1,608)
Net income attributable to Sonoco $286,434 $35,202 $3,147 $ (47,557) $277,226
Per diluted common share $ 2.81 $ 0.35 $ 0.03 $ (0.47) $ 2.72(3) Consists of the following: gain from the sale of the rigid plastics blow molding operations totaling $104,292 ($49,341
after tax); $850 increase ($522 after tax) in reserves for Fox River environmental claims; $1,203 net tax loss due pri-marily to changes in rates and valuation allowances for foreign entities; and other charges totaling $82 ($59 after tax).
Results of operations – 2018 versus 2017Net income attributable to Sonoco (GAAP earnings)
was $313.6 million ($3.10 per diluted share) in 2018,compared with $175.3 million ($1.74 per diluted share) in2017. 2018 earnings reflect net after-tax charges totaling$27.1 million, consisting of restructuring/asset impairmentcharges and acquisition-related expenses which werepartially offset by the tax benefit related to the Tax Act.
Net income in 2017 was negatively impacted by a netafter-tax expense of $106.4 million consisting of pensionsettlement charges, tax charges related to the Tax Act,restructuring/asset impairment charges, and acquisition-related expenses. These charges were partially offset byinsurance settlement gains.
Base earnings in 2018 were $340.6 million ($3.37 perdiluted share), compared with $281.8 million ($2.79 perdiluted share) in 2017.
Both GAAP and base earnings in 2018 benefited from apositive price/cost relationship, operating profit from busi-nesses acquired during the year and lower income taxrates related to the Tax Act. These year-over-year favor-able factors were partially offset by higher managementincentives, overhead and other operating costs. Changesin foreign currency translation had little effect on earningsyear over year.
The effective tax rate on GAAP earnings was 19.8% in2018, compared with 46.6% in 2017, and the effective taxrate on base earnings was 23.7%, compared with 31.1%in 2017. The GAAP effective tax rate benefited from the$16.1 million release of a valuation allowance on foreigntax credits, as well as the absence of the 2017 one-time$77 million charge to record the Tax Act’s one-time tran-sition tax on certain accumulated foreign earnings. Thedecrease in the base tax rate was due to the decrease inthe U.S. Federal tax rate from 35% to 21%, partially offsetby the new “GILTI” tax, both of which are a result of theTax Act. The 2018 base rate also benefited from anunusually large tax benefit from the payment of equitycompensation awards, including the exercise of stockappreciation rights.
Consolidated net sales for 2018 were $5.4 billion, a$354 million, or 7.0%, increase from 2017. The compo-nents of the sales change were:
($ in millions)
Volume/mix $ 55Selling price 63Acquisitions and divestitures, net 241Foreign currency translation and other, net (4)
Total sales increase $354
Sales volume/mix was up approximately 1% driven byincreases in the Display and Packaging Segment. Higherselling prices year-over-year were implemented to recoverrising material prices, mostly resins. This led to year-over-year increases in all of the Company’s segments, exceptthe Paper and Industrial Converted Products segmentwhere market prices for the segment’s primary rawmaterial, old corrugated containers (“OCC”), declined from2017 to 2018. The Company’s 2018 acquisitions addedmore than $241 million to comparable year-over-yearsales. Finally, foreign exchange rate changes increasedyear-over-year sales as almost all of the foreign currenciesin which the Company conducts business strengthenedslightly in relation to the U.S. Dollar.
Total domestic sales were $3.5 billion, up 6.9% from2017 levels. International sales were $1.9 billion, up 7.2%from 2017 with most of the increase driven by growth inthe Company’s industrial businesses.
Costs and expenses/marginsCost of sales was up $271.9 million in 2018, or 6.7%,
from the prior year primarily due to additional volume fromacquired businesses. Positive price/cost relationship andmodest productivity improvements resulted in gross profitmargins increasing to 19.3% in 2018 from 19.0% in theprior year.
Selling, general and administrative expenses increased$55.5 million, or 10.9%, and were 10.4% of sales com-pared to 10.1% of sales in 2017. The current year increasein selling, general and administrative expenses is largely
24S O N O C O 2 0 1 8 A N N U A L R E P O R TS O N O C O 2 0 1 8 A N N U A L R E P O R T I F O R M 1 0 - K
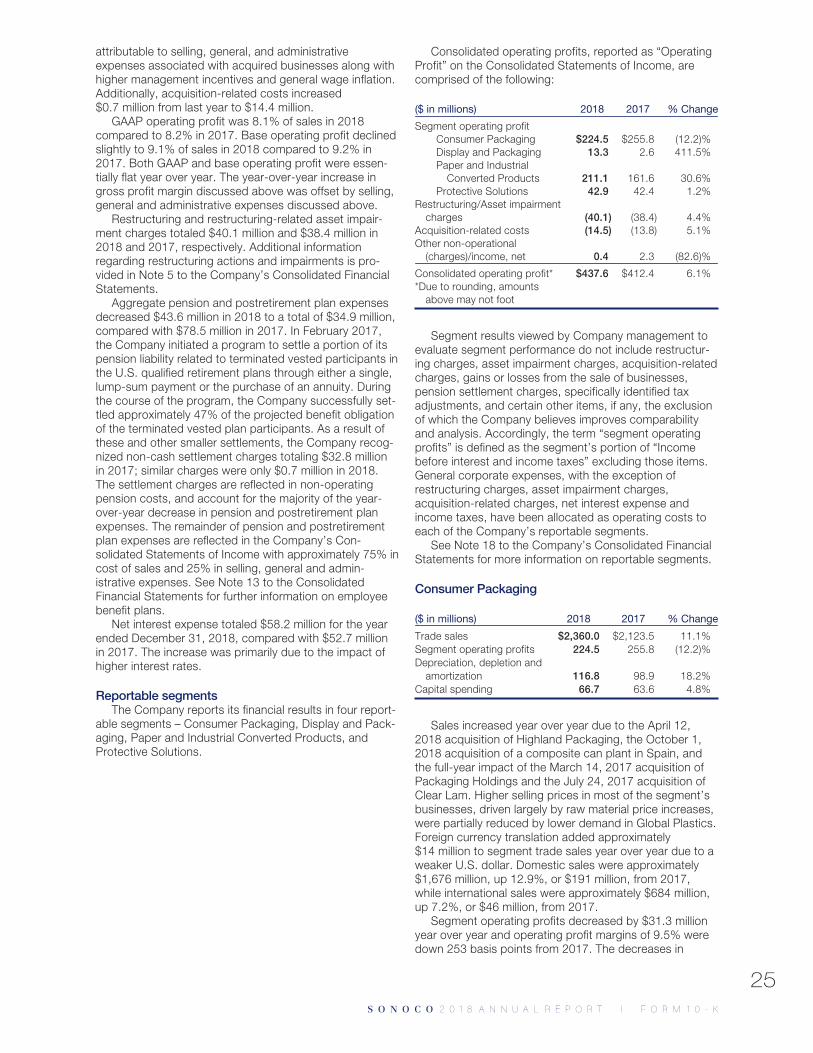
attributable to selling, general, and administrativeexpenses associated with acquired businesses along withhigher management incentives and general wage inflation.Additionally, acquisition-related costs increased$0.7 million from last year to $14.4 million.
GAAP operating profit was 8.1% of sales in 2018compared to 8.2% in 2017. Base operating profit declinedslightly to 9.1% of sales in 2018 compared to 9.2% in2017. Both GAAP and base operating profit were essen-tially flat year over year. The year-over-year increase ingross profit margin discussed above was offset by selling,general and administrative expenses discussed above.
Restructuring and restructuring-related asset impair-ment charges totaled $40.1 million and $38.4 million in2018 and 2017, respectively. Additional informationregarding restructuring actions and impairments is pro-vided in Note 5 to the Company’s Consolidated FinancialStatements.
Aggregate pension and postretirement plan expensesdecreased $43.6 million in 2018 to a total of $34.9 million,compared with $78.5 million in 2017. In February 2017,the Company initiated a program to settle a portion of itspension liability related to terminated vested participants inthe U.S. qualified retirement plans through either a single,lump-sum payment or the purchase of an annuity. Duringthe course of the program, the Company successfully set-tled approximately 47% of the projected benefit obligationof the terminated vested plan participants. As a result ofthese and other smaller settlements, the Company recog-nized non-cash settlement charges totaling $32.8 millionin 2017; similar charges were only $0.7 million in 2018.The settlement charges are reflected in non-operatingpension costs, and account for the majority of the year-over-year decrease in pension and postretirement planexpenses. The remainder of pension and postretirementplan expenses are reflected in the Company’s Con-solidated Statements of Income with approximately 75% incost of sales and 25% in selling, general and admin-istrative expenses. See Note 13 to the ConsolidatedFinancial Statements for further information on employeebenefit plans.
Net interest expense totaled $58.2 million for the yearended December 31, 2018, compared with $52.7 millionin 2017. The increase was primarily due to the impact ofhigher interest rates.
Reportable segmentsThe Company reports its financial results in four report-
able segments – Consumer Packaging, Display and Pack-aging, Paper and Industrial Converted Products, andProtective Solutions.
Consolidated operating profits, reported as “OperatingProfit” on the Consolidated Statements of Income, arecomprised of the following:
($ in millions) 2018 2017 % Change
Segment operating profitConsumer Packaging $224.5 $255.8 (12.2)%Display and Packaging 13.3 2.6 411.5%Paper and Industrial
Converted Products 211.1 161.6 30.6%Protective Solutions 42.9 42.4 1.2%
Restructuring/Asset impairmentcharges (40.1) (38.4) 4.4%
Acquisition-related costs (14.5) (13.8) 5.1%Other non-operational
(charges)/income, net 0.4 2.3 (82.6)%
Consolidated operating profit* $437.6 $412.4 6.1%*Due to rounding, amounts
above may not foot
Segment results viewed by Company management toevaluate segment performance do not include restructur-ing charges, asset impairment charges, acquisition-relatedcharges, gains or losses from the sale of businesses,pension settlement charges, specifically identified taxadjustments, and certain other items, if any, the exclusionof which the Company believes improves comparabilityand analysis. Accordingly, the term “segment operatingprofits” is defined as the segment’s portion of “Incomebefore interest and income taxes” excluding those items.General corporate expenses, with the exception ofrestructuring charges, asset impairment charges,acquisition-related charges, net interest expense andincome taxes, have been allocated as operating costs toeach of the Company’s reportable segments.
See Note 18 to the Company’s Consolidated FinancialStatements for more information on reportable segments.
Consumer Packaging
($ in millions) 2018 2017 % Change
Trade sales $2,360.0 $2,123.5 11.1%Segment operating profits 224.5 255.8 (12.2)%Depreciation, depletion and
amortization 116.8 98.9 18.2%Capital spending 66.7 63.6 4.8%
Sales increased year over year due to the April 12,2018 acquisition of Highland Packaging, the October 1,2018 acquisition of a composite can plant in Spain, andthe full-year impact of the March 14, 2017 acquisition ofPackaging Holdings and the July 24, 2017 acquisition ofClear Lam. Higher selling prices in most of the segment’sbusinesses, driven largely by raw material price increases,were partially reduced by lower demand in Global Plastics.Foreign currency translation added approximately$14 million to segment trade sales year over year due to aweaker U.S. dollar. Domestic sales were approximately$1,676 million, up 12.9%, or $191 million, from 2017,while international sales were approximately $684 million,up 7.2%, or $46 million, from 2017.
Segment operating profits decreased by $31.3 millionyear over year and operating profit margins of 9.5% weredown 253 basis points from 2017. The decreases in
25S O N O C O 2 0 1 8 A N N U A L R E P O R TS O N O C O 2 0 1 8 A N N U A L R E P O R T I F O R M 1 0 - K
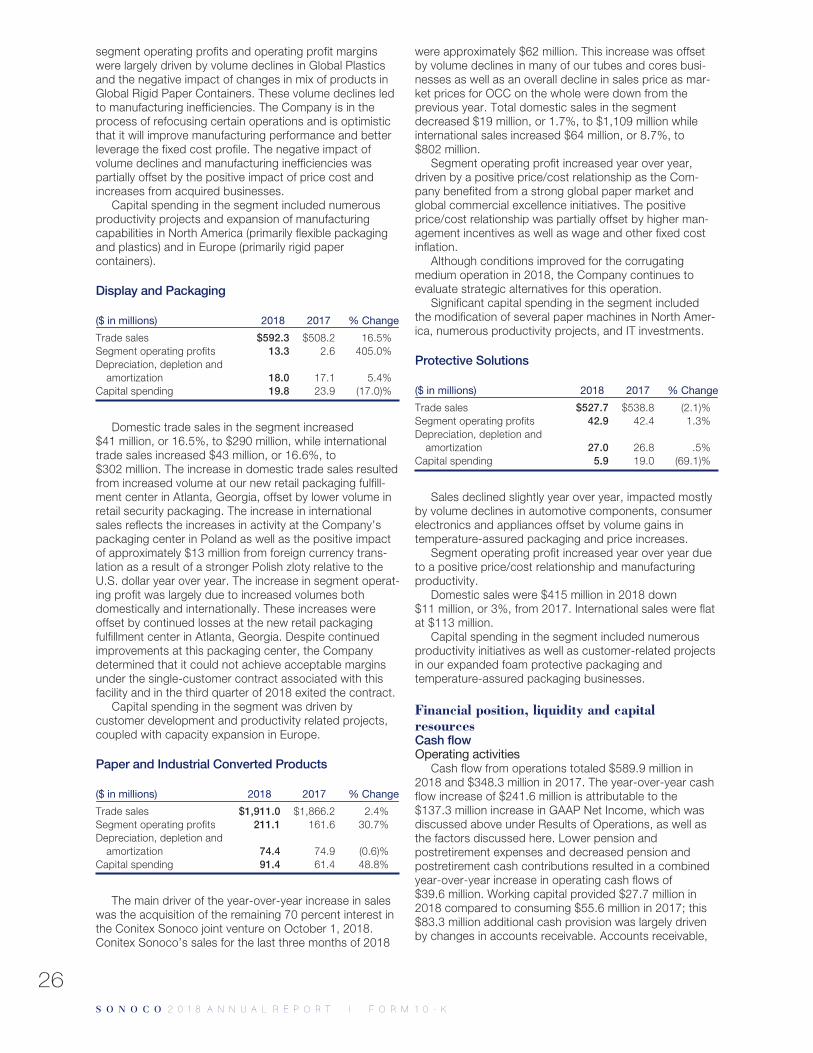
segment operating profits and operating profit marginswere largely driven by volume declines in Global Plasticsand the negative impact of changes in mix of products inGlobal Rigid Paper Containers. These volume declines ledto manufacturing inefficiencies. The Company is in theprocess of refocusing certain operations and is optimisticthat it will improve manufacturing performance and betterleverage the fixed cost profile. The negative impact ofvolume declines and manufacturing inefficiencies waspartially offset by the positive impact of price cost andincreases from acquired businesses.
Capital spending in the segment included numerousproductivity projects and expansion of manufacturingcapabilities in North America (primarily flexible packagingand plastics) and in Europe (primarily rigid papercontainers).
Display and Packaging
($ in millions) 2018 2017 % Change
Trade sales $592.3 $508.2 16.5%Segment operating profits 13.3 2.6 405.0%Depreciation, depletion and
amortization 18.0 17.1 5.4%Capital spending 19.8 23.9 (17.0)%
Domestic trade sales in the segment increased$41 million, or 16.5%, to $290 million, while internationaltrade sales increased $43 million, or 16.6%, to$302 million. The increase in domestic trade sales resultedfrom increased volume at our new retail packaging fulfill-ment center in Atlanta, Georgia, offset by lower volume inretail security packaging. The increase in internationalsales reflects the increases in activity at the Company’spackaging center in Poland as well as the positive impactof approximately $13 million from foreign currency trans-lation as a result of a stronger Polish zloty relative to theU.S. dollar year over year. The increase in segment operat-ing profit was largely due to increased volumes bothdomestically and internationally. These increases wereoffset by continued losses at the new retail packagingfulfillment center in Atlanta, Georgia. Despite continuedimprovements at this packaging center, the Companydetermined that it could not achieve acceptable marginsunder the single-customer contract associated with thisfacility and in the third quarter of 2018 exited the contract.
Capital spending in the segment was driven bycustomer development and productivity related projects,coupled with capacity expansion in Europe.
Paper and Industrial Converted Products
($ in millions) 2018 2017 % Change
Trade sales $1,911.0 $1,866.2 2.4%Segment operating profits 211.1 161.6 30.7%Depreciation, depletion and
amortization 74.4 74.9 (0.6)%Capital spending 91.4 61.4 48.8%
The main driver of the year-over-year increase in saleswas the acquisition of the remaining 70 percent interest inthe Conitex Sonoco joint venture on October 1, 2018.Conitex Sonoco’s sales for the last three months of 2018
were approximately $62 million. This increase was offsetby volume declines in many of our tubes and cores busi-nesses as well as an overall decline in sales price as mar-ket prices for OCC on the whole were down from theprevious year. Total domestic sales in the segmentdecreased $19 million, or 1.7%, to $1,109 million whileinternational sales increased $64 million, or 8.7%, to$802 million.
Segment operating profit increased year over year,driven by a positive price/cost relationship as the Com-pany benefited from a strong global paper market andglobal commercial excellence initiatives. The positiveprice/cost relationship was partially offset by higher man-agement incentives as well as wage and other fixed costinflation.
Although conditions improved for the corrugatingmedium operation in 2018, the Company continues toevaluate strategic alternatives for this operation.
Significant capital spending in the segment includedthe modification of several paper machines in North Amer-ica, numerous productivity projects, and IT investments.
Protective Solutions
($ in millions) 2018 2017 % Change
Trade sales $527.7 $538.8 (2.1)%Segment operating profits 42.9 42.4 1.3%Depreciation, depletion and
amortization 27.0 26.8 .5%Capital spending 5.9 19.0 (69.1)%
Sales declined slightly year over year, impacted mostlyby volume declines in automotive components, consumerelectronics and appliances offset by volume gains intemperature-assured packaging and price increases.
Segment operating profit increased year over year dueto a positive price/cost relationship and manufacturingproductivity.
Domestic sales were $415 million in 2018 down$11 million, or 3%, from 2017. International sales were flatat $113 million.
Capital spending in the segment included numerousproductivity initiatives as well as customer-related projectsin our expanded foam protective packaging andtemperature-assured packaging businesses.
Financial position, liquidity and capitalresourcesCash flowOperating activities
Cash flow from operations totaled $589.9 million in2018 and $348.3 million in 2017. The year-over-year cashflow increase of $241.6 million is attributable to the$137.3 million increase in GAAP Net Income, which wasdiscussed above under Results of Operations, as well asthe factors discussed here. Lower pension andpostretirement expenses and decreased pension andpostretirement cash contributions resulted in a combinedyear-over-year increase in operating cash flows of$39.6 million. Working capital provided $27.7 million in2018 compared to consuming $55.6 million in 2017; this$83.3 million additional cash provision was largely drivenby changes in accounts receivable. Accounts receivable,
26S O N O C O 2 0 1 8 A N N U A L R E P O R TS O N O C O 2 0 1 8 A N N U A L R E P O R T I F O R M 1 0 - K
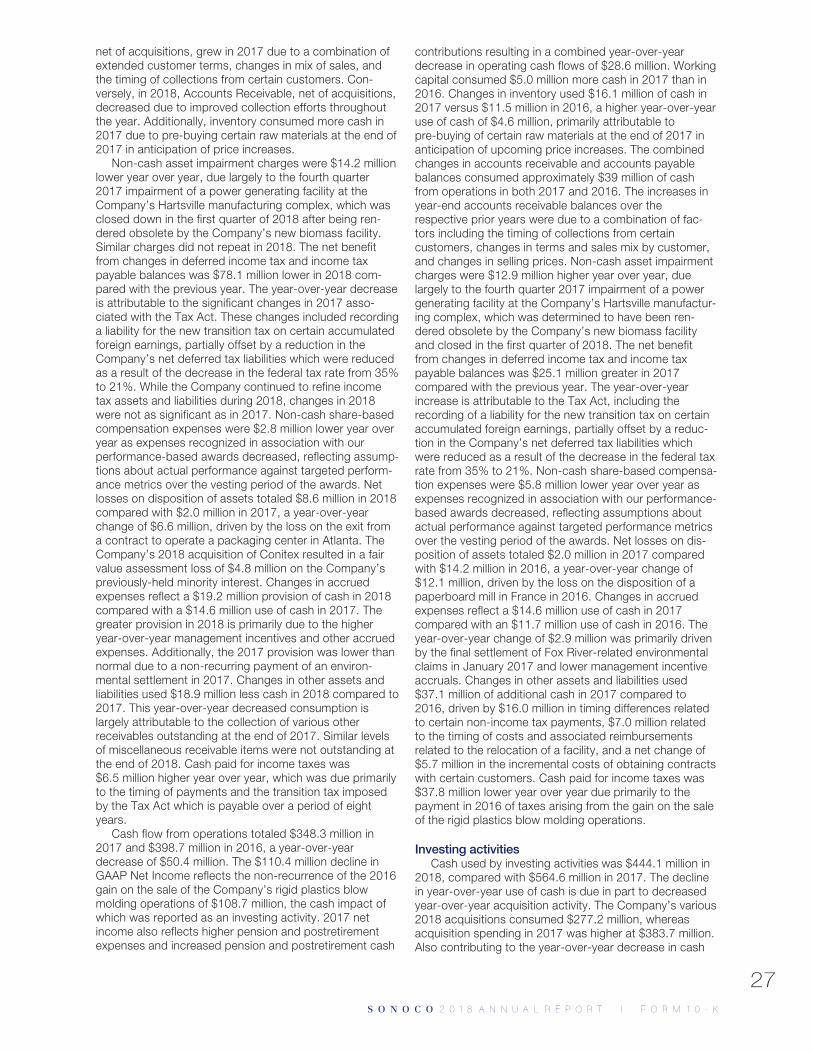
net of acquisitions, grew in 2017 due to a combination ofextended customer terms, changes in mix of sales, andthe timing of collections from certain customers. Con-versely, in 2018, Accounts Receivable, net of acquisitions,decreased due to improved collection efforts throughoutthe year. Additionally, inventory consumed more cash in2017 due to pre-buying certain raw materials at the end of2017 in anticipation of price increases.
Non-cash asset impairment charges were $14.2 millionlower year over year, due largely to the fourth quarter2017 impairment of a power generating facility at theCompany’s Hartsville manufacturing complex, which wasclosed down in the first quarter of 2018 after being ren-dered obsolete by the Company’s new biomass facility.Similar charges did not repeat in 2018. The net benefitfrom changes in deferred income tax and income taxpayable balances was $78.1 million lower in 2018 com-pared with the previous year. The year-over-year decreaseis attributable to the significant changes in 2017 asso-ciated with the Tax Act. These changes included recordinga liability for the new transition tax on certain accumulatedforeign earnings, partially offset by a reduction in theCompany’s net deferred tax liabilities which were reducedas a result of the decrease in the federal tax rate from 35%to 21%. While the Company continued to refine incometax assets and liabilities during 2018, changes in 2018were not as significant as in 2017. Non-cash share-basedcompensation expenses were $2.8 million lower year overyear as expenses recognized in association with ourperformance-based awards decreased, reflecting assump-tions about actual performance against targeted perform-ance metrics over the vesting period of the awards. Netlosses on disposition of assets totaled $8.6 million in 2018compared with $2.0 million in 2017, a year-over-yearchange of $6.6 million, driven by the loss on the exit froma contract to operate a packaging center in Atlanta. TheCompany’s 2018 acquisition of Conitex resulted in a fairvalue assessment loss of $4.8 million on the Company’spreviously-held minority interest. Changes in accruedexpenses reflect a $19.2 million provision of cash in 2018compared with a $14.6 million use of cash in 2017. Thegreater provision in 2018 is primarily due to the higheryear-over-year management incentives and other accruedexpenses. Additionally, the 2017 provision was lower thannormal due to a non-recurring payment of an environ-mental settlement in 2017. Changes in other assets andliabilities used $18.9 million less cash in 2018 compared to2017. This year-over-year decreased consumption islargely attributable to the collection of various otherreceivables outstanding at the end of 2017. Similar levelsof miscellaneous receivable items were not outstanding atthe end of 2018. Cash paid for income taxes was$6.5 million higher year over year, which was due primarilyto the timing of payments and the transition tax imposedby the Tax Act which is payable over a period of eightyears.
Cash flow from operations totaled $348.3 million in2017 and $398.7 million in 2016, a year-over-yeardecrease of $50.4 million. The $110.4 million decline inGAAP Net Income reflects the non-recurrence of the 2016gain on the sale of the Company’s rigid plastics blowmolding operations of $108.7 million, the cash impact ofwhich was reported as an investing activity. 2017 netincome also reflects higher pension and postretirementexpenses and increased pension and postretirement cash
contributions resulting in a combined year-over-yeardecrease in operating cash flows of $28.6 million. Workingcapital consumed $5.0 million more cash in 2017 than in2016. Changes in inventory used $16.1 million of cash in2017 versus $11.5 million in 2016, a higher year-over-yearuse of cash of $4.6 million, primarily attributable topre-buying of certain raw materials at the end of 2017 inanticipation of upcoming price increases. The combinedchanges in accounts receivable and accounts payablebalances consumed approximately $39 million of cashfrom operations in both 2017 and 2016. The increases inyear-end accounts receivable balances over therespective prior years were due to a combination of fac-tors including the timing of collections from certaincustomers, changes in terms and sales mix by customer,and changes in selling prices. Non-cash asset impairmentcharges were $12.9 million higher year over year, duelargely to the fourth quarter 2017 impairment of a powergenerating facility at the Company’s Hartsville manufactur-ing complex, which was determined to have been ren-dered obsolete by the Company’s new biomass facilityand closed in the first quarter of 2018. The net benefitfrom changes in deferred income tax and income taxpayable balances was $25.1 million greater in 2017compared with the previous year. The year-over-yearincrease is attributable to the Tax Act, including therecording of a liability for the new transition tax on certainaccumulated foreign earnings, partially offset by a reduc-tion in the Company’s net deferred tax liabilities whichwere reduced as a result of the decrease in the federal taxrate from 35% to 21%. Non-cash share-based compensa-tion expenses were $5.8 million lower year over year asexpenses recognized in association with our performance-based awards decreased, reflecting assumptions aboutactual performance against targeted performance metricsover the vesting period of the awards. Net losses on dis-position of assets totaled $2.0 million in 2017 comparedwith $14.2 million in 2016, a year-over-year change of$12.1 million, driven by the loss on the disposition of apaperboard mill in France in 2016. Changes in accruedexpenses reflect a $14.6 million use of cash in 2017compared with an $11.7 million use of cash in 2016. Theyear-over-year change of $2.9 million was primarily drivenby the final settlement of Fox River-related environmentalclaims in January 2017 and lower management incentiveaccruals. Changes in other assets and liabilities used$37.1 million of additional cash in 2017 compared to2016, driven by $16.0 million in timing differences relatedto certain non-income tax payments, $7.0 million relatedto the timing of costs and associated reimbursementsrelated to the relocation of a facility, and a net change of$5.7 million in the incremental costs of obtaining contractswith certain customers. Cash paid for income taxes was$37.8 million lower year over year due primarily to thepayment in 2016 of taxes arising from the gain on the saleof the rigid plastics blow molding operations.
Investing activitiesCash used by investing activities was $444.1 million in
2018, compared with $564.6 million in 2017. The declinein year-over-year use of cash is due in part to decreasedyear-over-year acquisition activity. The Company’s various2018 acquisitions consumed $277.2 million, whereasacquisition spending in 2017 was higher at $383.7 million.Also contributing to the year-over-year decrease in cash
27S O N O C O 2 0 1 8 A N N U A L R E P O R TS O N O C O 2 0 1 8 A N N U A L R E P O R T I F O R M 1 0 - K
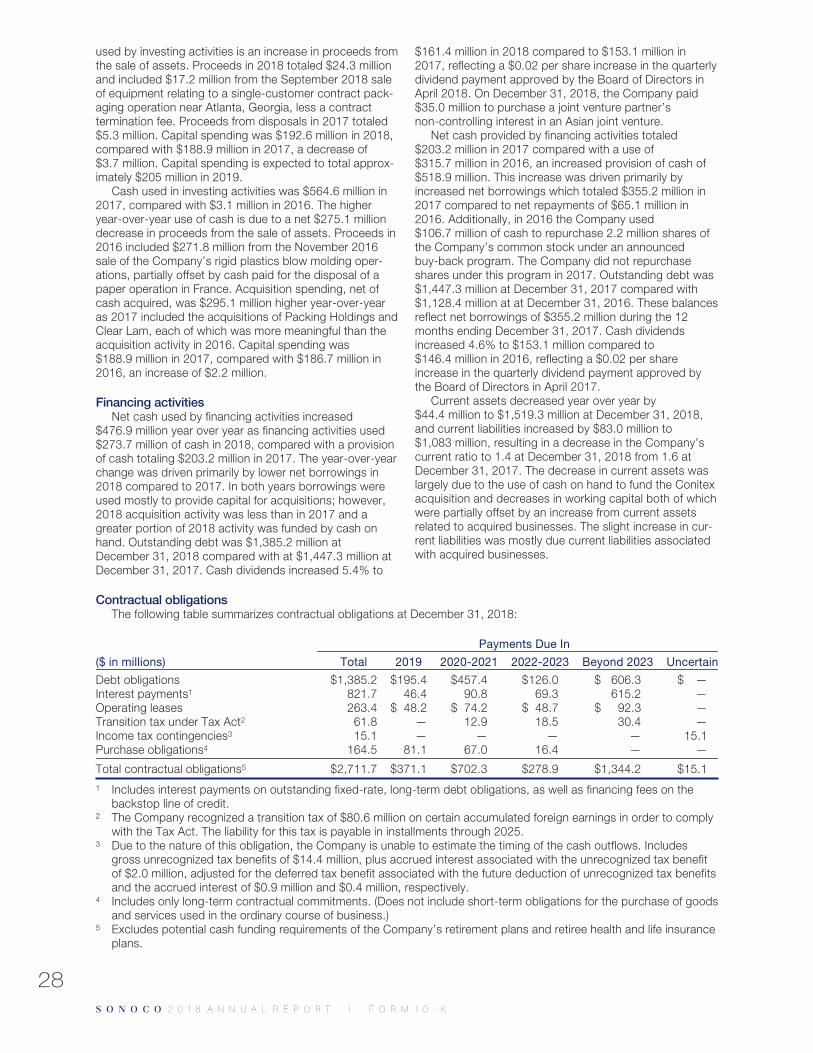
used by investing activities is an increase in proceeds fromthe sale of assets. Proceeds in 2018 totaled $24.3 millionand included $17.2 million from the September 2018 saleof equipment relating to a single-customer contract pack-aging operation near Atlanta, Georgia, less a contracttermination fee. Proceeds from disposals in 2017 totaled$5.3 million. Capital spending was $192.6 million in 2018,compared with $188.9 million in 2017, a decrease of$3.7 million. Capital spending is expected to total approx-imately $205 million in 2019.
Cash used in investing activities was $564.6 million in2017, compared with $3.1 million in 2016. The higheryear-over-year use of cash is due to a net $275.1 milliondecrease in proceeds from the sale of assets. Proceeds in2016 included $271.8 million from the November 2016sale of the Company’s rigid plastics blow molding oper-ations, partially offset by cash paid for the disposal of apaper operation in France. Acquisition spending, net ofcash acquired, was $295.1 million higher year-over-yearas 2017 included the acquisitions of Packing Holdings andClear Lam, each of which was more meaningful than theacquisition activity in 2016. Capital spending was$188.9 million in 2017, compared with $186.7 million in2016, an increase of $2.2 million.
Financing activitiesNet cash used by financing activities increased
$476.9 million year over year as financing activities used$273.7 million of cash in 2018, compared with a provisionof cash totaling $203.2 million in 2017. The year-over-yearchange was driven primarily by lower net borrowings in2018 compared to 2017. In both years borrowings wereused mostly to provide capital for acquisitions; however,2018 acquisition activity was less than in 2017 and agreater portion of 2018 activity was funded by cash onhand. Outstanding debt was $1,385.2 million atDecember 31, 2018 compared with at $1,447.3 million atDecember 31, 2017. Cash dividends increased 5.4% to
$161.4 million in 2018 compared to $153.1 million in2017, reflecting a $0.02 per share increase in the quarterlydividend payment approved by the Board of Directors inApril 2018. On December 31, 2018, the Company paid$35.0 million to purchase a joint venture partner’snon-controlling interest in an Asian joint venture.
Net cash provided by financing activities totaled$203.2 million in 2017 compared with a use of$315.7 million in 2016, an increased provision of cash of$518.9 million. This increase was driven primarily byincreased net borrowings which totaled $355.2 million in2017 compared to net repayments of $65.1 million in2016. Additionally, in 2016 the Company used$106.7 million of cash to repurchase 2.2 million shares ofthe Company’s common stock under an announcedbuy-back program. The Company did not repurchaseshares under this program in 2017. Outstanding debt was$1,447.3 million at December 31, 2017 compared with$1,128.4 million at at December 31, 2016. These balancesreflect net borrowings of $355.2 million during the 12months ending December 31, 2017. Cash dividendsincreased 4.6% to $153.1 million compared to$146.4 million in 2016, reflecting a $0.02 per shareincrease in the quarterly dividend payment approved bythe Board of Directors in April 2017.
Current assets decreased year over year by$44.4 million to $1,519.3 million at December 31, 2018,and current liabilities increased by $83.0 million to$1,083 million, resulting in a decrease in the Company’scurrent ratio to 1.4 at December 31, 2018 from 1.6 atDecember 31, 2017. The decrease in current assets waslargely due to the use of cash on hand to fund the Conitexacquisition and decreases in working capital both of whichwere partially offset by an increase from current assetsrelated to acquired businesses. The slight increase in cur-rent liabilities was mostly due current liabilities associatedwith acquired businesses.
Contractual obligationsThe following table summarizes contractual obligations at December 31, 2018:
Payments Due In
($ in millions) Total 2019 2020-2021 2022-2023 Beyond 2023 Uncertain
Debt obligations $1,385.2 $195.4 $457.4 $126.0 $ 606.3 $ —Interest payments1 821.7 46.4 90.8 69.3 615.2 —Operating leases 263.4 $ 48.2 $ 74.2 $ 48.7 $ 92.3 —Transition tax under Tax Act2 61.8 — 12.9 18.5 30.4 —Income tax contingencies3 15.1 — — — — 15.1Purchase obligations4 164.5 81.1 67.0 16.4 — —
Total contractual obligations5 $2,711.7 $371.1 $702.3 $278.9 $1,344.2 $15.11 Includes interest payments on outstanding fixed-rate, long-term debt obligations, as well as financing fees on the
backstop line of credit.2 The Company recognized a transition tax of $80.6 million on certain accumulated foreign earnings in order to comply
with the Tax Act. The liability for this tax is payable in installments through 2025.3 Due to the nature of this obligation, the Company is unable to estimate the timing of the cash outflows. Includes
gross unrecognized tax benefits of $14.4 million, plus accrued interest associated with the unrecognized tax benefitof $2.0 million, adjusted for the deferred tax benefit associated with the future deduction of unrecognized tax benefitsand the accrued interest of $0.9 million and $0.4 million, respectively.
4 Includes only long-term contractual commitments. (Does not include short-term obligations for the purchase of goodsand services used in the ordinary course of business.)
5 Excludes potential cash funding requirements of the Company’s retirement plans and retiree health and life insuranceplans.
28S O N O C O 2 0 1 8 A N N U A L R E P O R TS O N O C O 2 0 1 8 A N N U A L R E P O R T I F O R M 1 0 - K
Capital resourcesThe Company’s cash balances are held in numerous
locations throughout the world. At December 31, 2018and 2017, approximately $102.3 million and$238.4 million, respectively, of the Company’s reportedcash and cash equivalents balances of $120.4 million and$254.9 million, respectively, were held outside of theUnited States by its foreign subsidiaries. Cash held outsideof the United States is available to meet local liquidityneeds, or for capital expenditures, acquisitions, and otheroffshore growth opportunities. As the Company enjoysample domestic liquidity through a combination of operat-ing cash flow generation and access to bank and capitalmarkets borrowings, we have generally considered ourforeign unremitted earnings to be indefinitely invested out-side the United States and currently have no plans torepatriate such earnings, other than excess cash balancesthat can be repatriated at minimal tax cost. Accordingly,as of December 31, 2018, the Company is not providingfor taxes on these amounts for financial reporting pur-poses. Computation of the potential deferred tax liabilityassociated with unremitted earnings deemed to be indef-initely reinvested is not practicable.
The Company’s total debt at December 31, 2018, was$1,385 million, a year-over-year decrease of $62 milliondriven primarily by the $88 million repayment of the$250 million term loan used to finance the Clear Lam andPackaging Holdings acquisitions which was partially offsetby an increase in foreign debt. The Company had$120 million of commercial paper outstanding atDecember 31, 2018 and $124 million at December 31,2017.
The Company operates a $350 million commercialpaper program, supported by a $500 million five-yearrevolving credit facility. In July 2017, the Company enteredinto a new credit agreement with a syndicate of eightbanks for that revolving facility, together with a$250 million five-year term loan. The revolving bank creditfacility is committed through July 2022. If circumstanceswere to prevent the Company from issuing commercialpaper, it has the contractual right to draw funds directly onthe underlying revolving bank credit facility. Borrowingsunder the credit agreement may be prepaid at any time atthe discretion of the Company and the term loan hasamortization payments totaling $12.5 million per year.During 2018, the Company prepaid an additional$75 million of the term loan. On April 12, 2018, the Com-pany entered into a new $100 million, 364-day term loanfacility in conjunction with the purchase of Highland Pack-aging. The Company subsequently repaid this loan in itsentirety over the second and third quarters of 2018 usingcash generated from operations.
The Company uses a notional pooling arrangementwith an international bank to help manage global liquidityrequirements. Under this pooling arrangement, the Com-pany and its participating subsidiaries may maintain eithera cash deposit or borrowing position through local cur-rency accounts with the bank, so long as the aggregateposition of the global pool is a notionally calculated netcash deposit. Because it maintains a security interest inthe cash deposits, and has the right to offset the cashdeposits against the borrowings, the bank provides theCompany and its participating subsidiaries favorable inter-est terms on both.
Acquisitions and internal investments are key elementsof the Company’s growth strategy. The Company believesthat cash on hand, cash generated from operations andborrowing capacity will enable it to support this strategy.Although the Company believes that it has excess borrow-ing capacity beyond its current lines, there can be noassurance that such financing would be available or, if so,at terms that are acceptable to the Company.
The net underfunded position of the Company’s variousU.S and international defined benefit pension and post-retirement plans was approximately $369 million at theend of 2018. During 2018, the Company contributedapproximately $25 million to its benefit plans. The Com-pany anticipates that benefit plan contributions in 2019 willtotal approximately $31 million. Future funding require-ments will depend largely on actual investment returns andfuture actuarial assumptions. Participation in the U.S.qualified defined benefit pension plan is frozen for salariedand non-union hourly U.S. employees hired on or afterJanuary 1, 2004. In February 2009, the plan was furtheramended to freeze service credit earned effectiveDecember 31, 2018. This change is expected to moder-ately reduce the volatility of long-term funding exposureand expenses.
Total equity increased $42 million during 2018 as netincome of $315 million was partially offset by an othercomprehensive loss of $77 million, dividends of$163 million, purchase of a noncontrolling interest of$35 million, stock-based compensation of $11 million andshare repurchases of $15 million. The primary compo-nents of other comprehensive loss were a $55 milliontranslation loss from the impact of a stronger U.S. dollaron the Company’s foreign investments and additionalactuarial losses totaling $20 million, net of tax, in theCompany’s various defined benefit plans resulting primarilyfrom lower than expected market performance of planassets in 2018. Total equity increased $175 million during2017 as net income of $177 million and other compre-hensive income totaling $146 million were partially offsetby dividends of $155 million, stock-based compensationof $13 million and share repurchases of $6 million. Theprimary components of other comprehensive gain were an$89 million translation gain from the impact of a weakerU.S. dollar on the Company’s foreign investments andadditional actuarial gains totaling $60 million, net of tax, inthe Company’s various defined benefit plans resultingprimarily from higher than expected market performanceof plan assets in 2017.
On February 10, 2016, the Company’s Board of Direc-tors authorized the repurchase of up to 5 million shares ofthe Company’s common stock. During 2016, a total of2.03 million shares were repurchased under this author-ization at a cost of $100 million. No shares wererepurchased under this authorization during 2017 or 2018.Accordingly, at December 31, 2018 a total of 2.97 millionshares remain available for repurchase under this author-ization.
Although the ultimate determination of whether to paydividends is within the sole discretion of the Board ofDirectors, the Company plans to increase dividends asearnings grow. Dividends per common share were $1.62in 2018, $1.54 in 2017 and $1.46 in 2016. On Febru-ary 13, 2019, the Company declared a regular quarterlydividend of $0.41 per common share payable on March 8,2019, to shareholders of record on February 27, 2019.
29S O N O C O 2 0 1 8 A N N U A L R E P O R TS O N O C O 2 0 1 8 A N N U A L R E P O R T I F O R M 1 0 - K
Off-balance sheet arrangementsThe Company had no material off-balance sheet
arrangements at December 31, 2018.
Risk managementAs a result of operating globally, the Company is
exposed to changes in foreign exchange rates. Theexposure is well diversified, as the Company’s facilities arespread throughout the world, and the Company generallysells in the same countries where it produces. The Com-pany monitors these exposures and may use traditionalcurrency swaps and forward exchange contracts to hedgea portion of forecasted transactions that are denominatedin foreign currencies, foreign currency assets and liabilitiesor net investment in foreign subsidiaries. The Company’sforeign operations are exposed to political and culturalrisks, but the risks are mitigated by diversification and therelative stability of the countries in which the Company hassignificant operations.
Prior to July 1, 2015, the Company used Venezuela’sofficial exchange rate to report the results of its operationsin Venezuela. As a result of significant inflationaryincreases, and to avoid distortion of its consolidatedresults from translation of its Venezuelan operations, effec-tive July 1, 2015, the Company began translating itsVenezuelan operating results and all monetary assets andliabilities in Venezuela using an alternative rate (currentlyknown as the DICOM rate). At December 31, 2018, thecarrying value of the Company’s net investment in itsVenezuelan operations was approximately $2.0 million. Inaddition, at December 31, 2018, the Company’s Accumu-lated Other Comprehensive Loss included a cumulativetranslation loss of $3.8 million related to its Venezuelaoperations which would need to be reclassified to netincome in the event of a complete exit of the business or adeconsolidation of these operations.
The Company is a purchaser of various raw materialinputs such as recovered paper, energy, steel, aluminumand plastic resin. The Company generally does not engagein significant hedging activities for these purchases, otherthan for energy and, from time to time, aluminum, becausethere is usually a high correlation between the primaryinput costs and the ultimate selling price of its products.Inputs are generally purchased at market or at fixed pricesthat are established with individual suppliers as part of thepurchase process for quantities expected to be consumedin the ordinary course of business. On occasion, wherethe correlation between selling price and input price is lessdirect, the Company may enter into derivative contractssuch as futures or swaps to manage the effect of pricefluctuations.
In addition, the Company may, from time to time, usetraditional, unleveraged interest-rate swaps to manage itsmix of fixed and variable rate debt and to control itsexposure to interest rate movements within select ranges.
At December 31, 2018, the Company had derivativecontracts outstanding to hedge the price on a portion ofanticipated commodity and energy purchases as well as tohedge certain foreign exchange risks for various periodsthrough December 2019. These contracts included swapsto hedge the purchase price of approximately 7.0 mil-lion MMBTUs of natural gas in the U.S. and Canada repre-senting approximately 71% and 31% of anticipated naturalgas usage for 2019 and 2020. Additionally, the Companyhad swap contracts covering 4,082 metric tons of alumi-
num representing approximately 51% of anticipated usagefor 2019. The aluminum hedges relate to fixed-price cus-tomer contracts. At December 31, 2018, the Companyhad a number of foreign currency contracts in place forboth designated and undesignated hedges of eitheranticipated foreign currency denominated transactions orexisting financial assets and liabilities. At December 31,2018, the total notional amount of these contracts, in U.S.dollar terms, was $147 million, of which $65 million relatedto the Canadian dollar, $40 million to the Mexican peso,$19 million to the Polish Zloty and $23 million to all othercurrencies.
The total fair market value of the Company’s derivativeswas a net unfavorable position of $3.1 million and$1.3 million at at December 31, 2018, and December 31,2017, respectively. Derivatives are marked to fair valueusing published market prices, if available, or using esti-mated values based on current price quotes and a dis-counted cash flow model. See Note 10 to theConsolidated Financial Statements for more information onfinancial instruments.
The Company is subject to various federal, state andlocal environmental laws and regulations concerning,among other matters, solid waste disposal, wastewatereffluent and air emissions. Although the costs of com-pliance have not been significant due to the nature of thematerials and processes used in manufacturing oper-ations, such laws also make generators of hazardouswastes and their legal successors financially responsiblefor the cleanup of sites contaminated by those wastes.The Company has been named a potentially responsibleparty at several environmentally contaminated sites. Theseregulatory actions and a small number of private partylawsuits are believed to represent the Company’s largestpotential environmental liabilities. The Company hasaccrued $20.1 million at December 31, 2018, comparedwith $20.3 million at December 31, 2017, with respect tothese sites. See “Environmental Charges,” Item 3 – LegalProceedings and Note 16 to the Consolidated FinancialStatements for more information on environmental mat-ters.
Results of operations – 2017 versus 2016Consolidated net sales for 2017 were $5.0 billion, a
$254 million, or 5.3%, increase from 2016. The compo-nents of the sales change were:
($ in millions)
Volume/mix $ (19)Selling price 182Acquisitions and divestitures, net 69Foreign currency translation and other, net 22
Total sales increase $254
Sales volume/mix was essentially flat as organic volumegrowth and a favorable change in product mix in a numberof our businesses mostly offset volume declines in rigidpaper containers and automotive components. For themost part, price changes for the Company’s productswere driven by changes in the underlying raw materialscosts. In 2017, many of the Company’s primary rawmaterials saw increases in their market prices; especiallyOCC which saw an average increase of more than 50%year over year. This increase most directly affected the
30S O N O C O 2 0 1 8 A N N U A L R E P O R TS O N O C O 2 0 1 8 A N N U A L R E P O R T I F O R M 1 0 - K
Paper and Industrial Converted Products segment whilethe increase in other raw materials, mainly resins, mostdirectly affected the Consumer Packaging segment. Whilethe full-year average OCC price was up year over year,prices during the year were volatile with periods of sharpincreases and decreases resulting in significant marginswings. However, the Company was able to achieve anoverall positive price cost relationship. While the Compa-ny’s 2017 and 2016 acquisitions added more than$259 million to comparable year-over-year sales, theimpact was mostly offset by sales decreases of$191 million related to dispositions, the most significant ofwhich was the 2016 sale of the Company’s rigid plasticsblow molding operations. Finally, foreign exchange ratechanges increased year-over-year sales as almost all ofthe foreign currencies in which the Company conductsbusiness strengthened slightly in relation to the U.S. dollar.
Total domestic sales were $3.3 billion, up 4.9% from2016 levels. International sales were $1.8 billion, up 6.1%from 2016 with most of the increase driven by growth inthe Company’s industrial businesses and the impact offoreign currency translation.
Costs and expenses/marginsCost of sales was up $241.4 million in 2017, or 6.3%,
from the prior year primarily due to raw material priceincreases and additional volume from acquired busi-nesses, net of disposed businesses. Despite the positiveprice/cost relationship and modest productivity improve-ments, an unfavorable mix of sales and higher labor andother costs resulted in gross profit margins declining to19.0% in 2017 from 19.8% in the prior year.
Selling, general and administrative expenses increased$4.8 million, or 0.9%, and were 10.1% of sales comparedto 10.5% of sales in 2016. Acquisition-related costsincreased $9.2 million from 2016 to $13.8 million. Absentthis item, selling, general and administrative expenseswere essentially flat year over year.
Restructuring and restructuring-related asset impair-ment charges totaled $38.4 million and $42.9 million in2017 and 2016, respectively. Additional informationregarding restructuring actions and impairments is pro-vided in Note 5 to the Company’s Consolidated FinancialStatements.
GAAP operating profit was 8.2% of sales in 2017compared to 10.6% in 2016. The largest contributor tothis decline was the 2016 gain on the sale of the Compa-ny’s rigid plastics blow molding business. Base operatingprofit declined to 9.2% of sales in 2017 compared to 9.4%in 2016. The year-over-year decrease in gross profit mar-gin discussed above contributed to the declines in bothGAAP operating profit and Base operating profit.
Non-operating pension costs increased $33.3 million in2017 to a total of $45.1 million, compared with$11.8 million in 2016. In February 2017, the Company ini-tiated a program to settle a portion of its pension liabilityrelated to terminated vested participants in the U.S. quali-fied retirement plans through either a single, lump-sumpayment or the purchase of an annuity. During the courseof the program, the Company successfully settled approx-imately 47% of the projected benefit obligation of theterminated vested plan participants. As a result of theseand other smaller settlements, the Company recognizednon-cash settlement charges totaling $32.8 million in2017.
Research and development costs, all of which werecharged to expense, were $21 million in 2017 and$22.5 million in 2016.
Net interest expense totaled $52.7 million for the yearended December 31, 2017, compared with $51.6 millionin 2016. The increase was due primarily to higher averagedebt levels as the Company used debt to fund acquis-itions.
Reportable segmentsThe Company reports its financial results in four report-
able segments – Consumer Packaging, Display and Pack-aging, Paper and Industrial Converted Products, andProtective Solutions.
Consolidated operating profits, reported as “Operatingprofit” on the Consolidated Statements of Income, arecomprised of the following:
($ in millions) 2017 2016 % Change
Segment operating profitConsumer Packaging $255.8 $245.6 4.2%Display and Packaging 2.6 14.9 (82.6)%Paper and Industrial
Converted Products 161.6 136.5 18.4%Protective Solutions 42.4 51.8 (18.1)%
Restructuring/Asset impairmentcharges (38.4) (42.9) (10.5)%
Acquisition-related costs (13.8) (4.6) 200.0%Other non-operational gains,
net 2.3 103.4 (97.8)%
Consolidated operating profits $412.5 $504.7 (18.3)%
Consumer Packaging
($ in millions) 2017 2016 % Change
Trade sales $2,123.5 $2,043.1 3.9%Segment operating profits 255.8 245.6 4.1%Depreciation, depletion and
amortization 98.9 88.9 11.3%Capital spending 63.6 86.4 (26.3)%
Sales increased year over year due to the March 14,2017 acquisition of Packaging Holdings, the July 24, 2017acquisition of Clear Lam and the full year impact of theNovember 1, 2016 acquisition of PPI. These increaseswere substantially offset by the reduction in year-over-yearsales due to the November 2016 disposition of theCompany’s rigid plastic blow molding operations. Higherselling prices in most of the segment’s businesses, drivenlargely by raw material price increases, were mostly offsetby volume declines in Rigid Paper Containers North Amer-ica and Europe as well as Flexible Packaging. Foreigncurrency translation added approximately $5 million tosegment trade sales year over year due to a weaker U.S.dollar. Domestic sales were approximately $1,461 million,up 6.8%, or $93 million, from 2016, while internationalsales were approximately $663 million, down 1.9%, or$13 million, from 2016.
Segment operating profits increased by $10.0 millionyear over year and operating profit margins of 12.0% wereunchanged from 2016. The increase in segment operatingprofits was largely driven by solid gains in manufacturingproductivity and the positive impact of the relationshipbetween selling prices and costs. These benefits were
31S O N O C O 2 0 1 8 A N N U A L R E P O R TS O N O C O 2 0 1 8 A N N U A L R E P O R T I F O R M 1 0 - K
partially offset by volume declines in global compositecans and flexible packaging as well as inflation. Materialpurchasing and logistics savings were key drivers of thepositive price/cost relationship. At an operating profit level,the negative impact of divestitures somewhat exceededthe benefit of acquisitions largely due to timing.
Capital spending in the segment included numerousproductivity projects and expansion of manufacturingcapabilities in North America primarily in flexible packagingand plastics, and expansion of manufacturing capabilitiesin Europe in rigid paper containers.
Display and Packaging
($ in millions) 2017 2016 % Change
Trade sales $508.2 $520.4 (2.3)%Segment operating profits 2.6 14.9 (82.4)%Depreciation, depletion and
amortization 17.1 16.7 2.2%Capital spending 23.9 11.5 107.1%
Domestic trade sales in the segment increased$3.2 million, or 1.3%, to $249 million, while internationaltrade sales decreased $15 million, or 5.6%, to$259 million. The increase in domestic trade sales resultedfrom increased volume at our new retail packaging fulfill-ment center in Atlanta, Georgia, offset by lower volume inretail security packaging and the impact of the July 2016sale of our retail security packaging facility in Juncos,Puerto Rico. The decrease in international sales reflectsthe Company’s exit from a packaging center fulfillmentcontract with a customer resulting in the transition of theoperation of certain facilities in Mexico and Brazil back tothe customer during the first half of 2016. This decline insales was somewhat offset by the positive impact ofapproximately $10 million from foreign currency translationas a result of a stronger Polish zloty relative to the U.S.dollar year over year.
The decrease in segment operating profit was largelydue to inefficiencies and higher than expected operatingcosts associated with the ramp up of production at thenew pack center in Atlanta. Higher than anticipated pro-duction requirements, primarily in response to multiplehurricanes, exceeded the new facility’s capability to oper-ate efficiently with the installed equipment and a relativelyinexperienced workforce that has also incurred a higherthan expected turnover rate.
Capital spending in the segment was driven by a sig-nificant customer development project in North Americacoupled with expansion of manufacturing capabilities inEurope.
Paper and Industrial Converted Products
($ in millions) 2017 2016 % Change
Trade sales $1,866.2 $1,693.5 10.2%Segment operating profits 161.6 136.5 18.4%Depreciation, depletion and
amortization 74.9 74.7 0.1%Capital spending 61.4 60.6 1.4%
On average, market costs for recovered paper in theU.S. were higher year over year resulting in higher averageselling prices in all of the segment’s domestic businesses.Selling prices were also higher in Brazil and the Andeanregion, primarily due to overall inflation, and were up inEurope due to the pass through of higher material costs inthat market. Total volume/mix gains were modest in thesegment as gains in Europe, which were due to acombination of market share gains and regionalexpansion, and volume increases in US and CanadianPaper were mostly offset by volume declines in other busi-nesses, particularly US and Canadian Tubes and Coresand Recycling. Changes in foreign exchange rates had lit-tle impact on reported sales in the segment. Total domes-tic sales in the segment increased $103 million, or 10.1%,to $1,128 million while international sales increased$70 million, or 10.4%, to $739 million.
Segment operating profit increased year over year,driven by a positive price/cost relationship as the Com-pany was able to favorably navigate dramatic movementsin Old Corrugated Containers (OCC) market prices.Improved market conditions resulted in a strong turn-around in the Company’s corrugating medium operation in2017. Operating profit was also benefited by increases involume and positive changes in the mix of products sold,mostly in Europe and Sonoco Reels, and modest pro-ductivity gains. These favorable factors were partially off-set by wage and other fixed cost inflation.
Although conditions improved for the corrugatingmedium operation in 2017, and the Company’s outlook forthe operation is for continued improvement in 2018, theCompany continues to evaluate strategic alternatives forthis operation.
Significant capital spending in the segment includedthe modification of several paper machines in North Amer-ica, numerous productivity projects, and IT investments.
Protective Solutions
($ in millions) 2017 2016 % Change
Trade sales $538.8 $525.9 2.4%Segment operating profits 42.4 51.8 (18.2)%Depreciation, depletion and
amortization 26.8 24.8 7.9%Capital spending 19.0 12.9 48.0%
Sales increased year over year due to the acquisitionsof Laminar Medica and AAR Corporation, each of whichwas acquired in the second half of 2016. Higher salesprices were offset by volume declines, mostly in automo-tive components.
Segment operating profit decreased year over year dueto volume declines and associated productivity losses. Anegative price/cost relationship and increases in labor,overhead and other costs also negatively impacted profitsyear over year.
Domestic sales were $426 million in 2017 down$10 million, or 2%, from 2016. International salesincreased to $113 million up $23 million, or 26%. Theincrease in international sales was driven by prior-yearacquisitions.
Capital spending in the segment included significantcustomer development projects to support ourtemperature-assured packaging business.
32S O N O C O 2 0 1 8 A N N U A L R E P O R TS O N O C O 2 0 1 8 A N N U A L R E P O R T I F O R M 1 0 - K
Critical accounting policies and estimatesManagement’s discussion and analysis of the Compa-
ny’s financial condition and results of operations are basedupon the Company’s Consolidated Financial Statements,which have been prepared in accordance with accountingprinciples generally accepted in the United States (U.S.GAAP). The preparation of financial statements in con-formity with U.S. GAAP requires management to makeestimates and assumptions that affect the reportedamounts of assets and liabilities at the date of the financialstatements and the reported amounts of revenues andexpenses during the reporting period. The Company eval-uates these estimates and assumptions on an ongoingbasis, including but not limited to those related toinventories, bad debts, derivatives, income taxes, share-based compensation, goodwill, intangible assets,restructuring, pension and other postretirement benefits,environmental liabilities, and contingencies and litigation.Estimates and assumptions are based on historical andother factors believed to be reasonable under the circum-stances. The results of these estimates may form the basisof the carrying value of certain assets and liabilities andmay not be readily apparent from other sources. Actualresults could differ from those estimates. The impact ofand any associated risks related to estimates, assump-tions and accounting policies are discussed in Manage-ment’s Discussion and Analysis of Financial Condition andResults of Operations, as well as in the Notes to theConsolidated Financial Statements, if applicable, wheresuch estimates, assumptions and accounting policiesaffect the Company’s reported and expected financialresults.
The Company believes the accounting policies dis-cussed in the Notes to the Consolidated Financial State-ments included in Item 8 of this Annual Report on Form10-K are critical to understanding the results of its oper-ations. The following discussion represents those policiesthat involve the more significant judgments and estimatesused in the preparation of the Company’s ConsolidatedFinancial Statements.
Business combinationsThe Company’s acquisitions of businesses are
accounted for in accordance with ASC 805, “BusinessCombinations.” The Company recognizes the identifiableassets acquired, the liabilities assumed, and any non-controlling interests in an acquired business at their fairvalues as of the date of acquisition. Goodwill is measuredas the excess of consideration transferred, also measuredat fair value, over the net of the acquisition date fair valuesof the identifiable assets acquired and liabilities assumed.The acquisition method of accounting requires us to makesignificant estimates and assumptions regarding the fairvalues of the elements of a business combination as of thedate of acquisition, including the fair values of identifiableintangible assets, deferred tax asset valuation allowances,liabilities including those related to debt, pensions andother postretirement plans, uncertain tax positions, con-tingent consideration and contingencies. This method alsorequires us to refine these estimates over a measurementperiod not to exceed one year to reflect new informationobtained about facts and circumstances that existed as ofthe acquisition date that, if known, would have affectedthe measurement of the amounts recognized as of thatdate. If we are required to adjust provisional amounts that
we have recorded for the fair values of assets and liabilitiesin connection with acquisitions, these adjustments couldhave a material impact on our financial condition andresults of operations.
Significant estimates and assumptions in estimating thefair value of acquired customer relationships, technology,and other identifiable intangible assets include future cashflows that we expect to generate from the acquiredassets. If the subsequent actual results and updated pro-jections of the underlying business activity change com-pared with the assumptions and projections used todevelop these values, we could record impairmentcharges. In addition, we have estimated the economiclives of certain acquired assets and these lives are used tocalculate depreciation and amortization expense. If ourestimates of the economic lives change, depreciation oramortization expenses could be increased or decreased,or the acquired asset could be impaired.
Impairment of long-lived, intangible and other assetsAssumptions and estimates used in the evaluation of
potential impairment can result in adjustments affectingthe carrying values of long-lived, intangible and otherassets and the recognition of impairment expense in theCompany’s Consolidated Financial Statements. TheCompany evaluates its long-lived assets (property, plantand equipment), definite-lived intangible assets and otherassets (including notes receivable and equity investments)for impairment whenever indicators of impairment exist, orwhen it commits to sell the asset. If the sum of the undis-counted expected future cash flows from a long-livedasset or definite-lived intangible asset group is less thanthe carrying value of that asset group, an asset impairmentcharge is recognized. Key assumptions and estimatesused in the cash flow model generally include price levels,sales growth, profit margins and asset life. The amount ofan impairment charge, if any, is calculated as the excessof the asset’s carrying value over its fair value, generallyrepresented by the discounted future cash flows from thatasset or, in the case of assets the Company evaluates forsale, as estimated proceeds less costs to sell. The Com-pany takes into consideration historical data and experi-ence together with all other relevant information availablewhen estimating the fair values of its assets. However, fairvalues that could be realized in actual transactions maydiffer from the estimates used to evaluate impairment. Inaddition, changes in the assumptions and estimates mayresult in a different conclusion regarding impairment.
Impairment of goodwillThe Company assesses its goodwill for impairment
annually and from time to time when warranted by thefacts and circumstances surrounding individual reportingunits or the Company as a whole. If the carrying value of areporting unit exceeds the implied fair value of that report-ing unit, an impairment charge to goodwill is recognizedfor the excess. The Company’s reporting units are thesame as, or one level below, its operating segments, asdetermined in accordance with ASC 350.
The Company completed its most recent annual good-will impairment testing during the third quarter of 2018.For testing purposes, the Company’s assessment of eachreporting unit’s estimated fair value and likelihood ofimpairment included both a quantitative and qualitativeevaluation. The quantitative tests, described further below,
33S O N O C O 2 0 1 8 A N N U A L R E P O R TS O N O C O 2 0 1 8 A N N U A L R E P O R T I F O R M 1 0 - K
considered factors such as current year operating perform-ance as compared to prior projections and implied fairvalues from comparable trading and transaction multiples.The qualitative evaluations considered factors such as themacroeconomic environment, Company stock price andmarket capitalization movement, business strategychanges, and significant customer wins and losses.
When performing a quantitative analysis, the Companyestimates the fair value of its reporting units using a dis-counted cash flow model based on projections of futureyears’ operating results and associated cash flows, vali-dated by observed comparable trading and transactionmultiples. The Company’s model discounts projectedfuture cash flows, forecasted over a ten-year period, withan estimated residual growth rate. The Company’s projec-tions incorporate management’s estimates of the most-likely expected future results, including significantassumptions and estimates related to, among otherthings: sales volumes and prices, new business, profitmargins, income taxes, capital expenditures, changes inworking capital requirements and operating margins andapplication of a discount rate. Projected future cash flowsare discounted to present value using an assumed dis-count rate that management believes is appropriate for thereporting unit.
The Company’s assessments, whether qualitative orquantitative, incorporate management’s expectations forthe future, including forecasted growth rates and/or mar-gin improvements. Therefore, should there be changes inthe relevant facts and circumstances and/or expectations,management’s conclusion regarding goodwill impairmentmay change as well. Management’s projections related torevenue growth and/or margin improvements are basedon a combination of factors, including expectations forvolume growth with existing customers and customerretention, product expansion, changes in price/cost rela-tionships, productivity gains, fixed cost leverage, and sta-bility or improvement in general economic conditions.
In considering the level of uncertainty regarding thepotential for goodwill impairment, management has con-cluded that any such impairment would, in most cases,likely be the result of adverse changes in more than oneassumption. Management considers the assumptionsused to be its best estimates across a range of possibleoutcomes based on available evidence at the time of theassessment. Other than in Display and Packaging, whichis discussed below, there is no specific singular event orsingle change in circumstances management has identi-fied that it believes could reasonably result in a change toexpected future results in any of its reporting units suffi-cient to result in goodwill impairment. In management’sopinion, a change of such magnitude would more likely bethe result of changes to some combination of the factorsidentified above, a general deterioration in competitiveposition, introduction of a superior technology, significantunexpected changes in customer preferences, an inabilityto pass through significant raw material cost increases,and other such items as identified in “Item 1A. Risk Fac-tors” on pages 8-16 of the Company’s 2018 AnnualReport on Form 10-K.
Although no reporting units failed the annual impair-ment test noted above, in management’s opinion, thegoodwill of the Display and Packaging reporting unit is atrisk of impairment in the near term if operating perform-ance does not improve in line with management’s expect-
ations, or if there is a negative change in the long-termoutlook for the business or in other factors such as thediscount rate. The Display and Packaging reporting unitdesigns, manufactures, assembles, packs and distributestemporary, semi-permanent and permanentpoint-of-purchase displays; provides supply chainmanagement services, including contract packing, fulfill-ment and scalable service centers; and manufacturesretail packaging, including printed backer cards, thermo-formed blisters and heat sealing equipment. The currentgoodwill impairment analysis incorporates management’sexpectations for moderate sales growth and mildimprovements to profit margin percentages which reflectsthe estimated benefits of future productivity initiatives. Alarge portion of expected sales in this reporting unit isconcentrated in several major customers and if the busi-ness with any of these customers is lost or significantlydeclines, or other projected synergies and productivitygains are not realized, a goodwill impairment charge couldbe incurred. Total goodwill associated with this reportingunit was approximately $203 million at December 31,2018. Based on the latest annual impairment test, theestimated fair value of the Display and Packaging reportingunit is approximately equal to its carrying value.
In its 2018 annual goodwill impairment analysis, pro-jected future cash flows for Display and Packaging werediscounted at 10.2%. Based on the discounted cash flowmodel and holding other valuation assumptions constant,if Display and Packaging projected operating profitsacross all future periods are reduced approximately 10%,or the discount rate is increased by one hundred basispoints, the Company estimates a pre-tax goodwill impair-ment charge of approximately $25 million would beincurred.
During the time subsequent to the annual evaluation,and at December 31, 2018, the Company consideredwhether any events and/or changes in circumstances hadresulted in the likelihood that the goodwill of any of itsreporting units may have been impaired. It is manage-ment’s opinion that no such events have occurred.
Income taxesThe Company follows ASC 740, Accounting for Income
Taxes, which requires a reduction of the carrying amountsof deferred tax assets by recording a valuation allowanceif, based on the available evidence, it is more likely thannot such assets will not be realized. Deferred tax assetsgenerally represent expenses that have been recognizedfor financial reporting purposes, but for which the corre-sponding tax deductions will occur in future periods. Thevaluation of deferred tax assets requires judgment inassessing the likely future tax consequences of events thathave been recognized in our financial statements or taxreturns and future profitability. Our accounting for deferredtax consequences represents our best estimate of thosefuture events. Changes in our current estimates, due tounanticipated events or otherwise, could have a materialimpact on our financial condition and results of operations.
For those tax positions where it is more likely than notthat a tax benefit will be sustained, the Company hasrecorded the largest amount of tax benefit with a greaterthan 50% likelihood of being realized upon ultimatesettlement with a taxing authority having full knowledge ofall relevant information. For those positions not meetingthe more-likely-than-not standard, no tax benefit has been
34S O N O C O 2 0 1 8 A N N U A L R E P O R TS O N O C O 2 0 1 8 A N N U A L R E P O R T I F O R M 1 0 - K
recognized in the financial statements. Associated interesthas also been recognized, where applicable.
As previously disclosed, the Company received a draftNotice of Proposed Adjustment (“NOPA”) from the InternalRevenue Service (IRS) in February 2017 proposing anadjustment to income for the 2013 tax year based on theIRS’s recharacterization of a distribution of an inter-company note made in 2012, and the subsequent repay-ment of the note over the course of 2013, as if it were acash distribution made in 2013. In March 2017, theCompany received a draft NOPA proposing penalties of$18 million associated with the IRS’s recharacterization,as well as an Information Document Request (“IDR”)requesting the Company’s analysis of why such penaltiesshould not apply. The Company responded to this IDR inApril 2017. On October 5, 2017, the Company receivedtwo revised draft NOPAs proposing the same adjustmentsand penalties as in the prior NOPAs. On November 14,2017, the Company received two final NOPAs proposingthe same adjustments and penalties as in the priorNOPAs. On November 20, 2017, the Company received aRevenue Agents Report (“RAR”) that included the sameadjustments and penalties as in the prior NOPAs. At thetime of the distribution in 2012, it was characterized as adividend to the extent of earnings and profits, with theremainder as a tax free return of basis and taxable capitalgain. As the IRS proposes to recharacterize the dis-tribution, the entire distribution would be characterized asa dividend. The incremental tax liability associated with theincome adjustment proposed in the RAR would be approx-imately $89 million, excluding interest and the previouslyreferenced penalties. On January 22, 2018, the Companyfiled a protest to the proposed deficiency with the IRS. TheCompany received a rebuttal of its protest from the IRS onJuly 10, 2018, and the matter has now been referred tothe Appeals Division of the IRS. The Company stronglybelieves the position of the IRS with regard to this matteris inconsistent with applicable tax laws and existing Treas-ury regulations, and that the Company’s previouslyreported income tax provision for the year in question isappropriate. However, there can be no assurance that thismatter will be resolved in the Company’s favor. Regardlessof whether the matter is resolved in the Company’s favor,the final resolution of this matter could be expensive andtime consuming to defend and/or settle. While the Com-pany believes that the amount of tax originally paid withrespect to this distribution is correct, and accordingly hasnot provided additional reserve for tax uncertainty, there isstill a possibility that an adverse outcome of the mattercould have a material effect on its results of operationsand financial condition.
The estimate for the potential outcome of any uncertaintax issue is highly judgmental. The Company believes ithas adequately provided for any reasonably foreseeableoutcome related to these matters. However, future resultsmay include favorable or unfavorable adjustments to esti-mated tax liabilities in the period the assessments aremade or resolved or when statutes of limitations on poten-tial assessments expire. Additionally, the jurisdictions inwhich earnings or deductions are realized may differ fromcurrent estimates. As a result, the eventual resolution ofthese matters could have a different impact on the effec-tive rate than currently reflected or expected.
Stock-based compensation plansThe Company utilizes share-based compensation in the
form of stock appreciation rights, restricted stock unitsand other share-based awards. Certain awards are in theform of contingent stock units where the ultimate numberof units are performance based. The amount of share-based compensation expense associated with theseperformance-based awards are based on estimatesregarding future performance using measures defined inthe plans. In 2018, the performance measures consistedof Earnings per Share and Return on Net AssetsEmployed. Changes in estimates regarding the futureachievement of these performance measures may result insignificant fluctuations from period to period in the amountof share-based compensation expense reflected in theCompany’s Consolidated Financial Statements.
The Company uses an option-pricing model todetermine the grant date fair value of its stock apprecia-tion rights. Inputs to the model include a number of sub-jective assumptions. Management routinely assesses theassumptions and methodologies used to calculate esti-mated fair value of share-based compensation per share.Circumstances may change and additional data maybecome available over time that results in changes tothese assumptions and methodologies, which could mate-rially impact fair value determinations.
Pension and postretirement benefit plansThe Company has significant pension and postretire-
ment benefit liabilities and costs that are measured usingactuarial valuations. The actuarial valuations employ keyassumptions that can have a significant effect on thecalculated amounts. The key assumptions used atDecember 31, 2018, in determining the projected benefitobligation and the accumulated benefit obligation for U.S.retirement and retiree health and life insurance plansinclude: discount rates of 4.34% and 4.14% for the activeand inactive qualified retirement plans, respectively, 4.16%for the non-qualified retirement plans, and 4.02% for theretiree health and life insurance plan. The rate of compen-sation increase for the retiree health and life insurance planwas 3.06%. The key assumptions used to determine 2018net periodic benefit cost for U.S. retirement and retireehealth and life insurance plans include: discount rates of3.69% and 3.49% for the active and inactive qualifiedretirement plans, respectively, 3.50% for the non-qualifiedretirement plans, and 3.36% for the retiree health and lifeinsurance plan; an expected long-term rate of return onplan assets of 7.00% and 6.75% for the active andinactive qualified retirement plans, respectively; and ratesof compensation increases ranging from 3.28% to 4.02%.
During 2018, the Company recorded total pension andpostretirement benefit expenses of approximately$34.9 million, compared with $78.5 million during 2017.The 2018 amount reflects $92.2 million of expectedreturns on plan assets at an average assumed rate of6.38% and interest cost of $55.4 million at a weighted-average discount rate of 3.43%. The 2017 amount reflects$82.8 million of expected returns on plan assets at anaverage assumed rate of 6.3% and interest cost of$56.3 million at a weighted-average discount rate of3.34%. The expense recognized in 2017 also includes$32.8 million of pension settlement charges, which arediscussed in more detail below. During 2018, the Com-pany made contributions to its pension and postretirement
35S O N O C O 2 0 1 8 A N N U A L R E P O R TS O N O C O 2 0 1 8 A N N U A L R E P O R T I F O R M 1 0 - K
plans of $25.4 million. In the prior year, the Companymade contributions to its pension and postretirementplans totaling $108.6 million, including a voluntary$50 million contribution to its U.S. active qualified retire-ment plan. Contributions vary from year to year dependingon various factors, the most significant being the marketvalue of assets and interest rates. Cumulative net actuariallosses were approximately $639 million at December 31,2018, and are primarily the result of low discount rates.Actuarial losses/gains outside of the 10% corridor definedby U.S. GAAP are amortized over the average remainingservice life of the plan’s active participants or the averageremaining life expectancy of the plan’s inactive partic-ipants if all, or almost all, of the plan’s participants areinactive.
In February 2017, the Company initiated a program tosettle a portion of the projected benefit obligation (PBO)relating to terminated vested participants in the U.S. quali-fied retirement plans through either a single, lump-sumpayment or the purchase of an annuity. The terminatedvested population comprised approximately 15% of thebeginning of year PBO of these plans. The Companysuccessfully settled approximately 47% of the PBO for theterminated vested plan participants. As a result of theseand other smaller settlements, the Company recognizednon-cash settlement charges of $32.8 million in 2017. Allsettlement payments were funded from plan assets anddid not require the Company to make any additional cashcontributions in 2017. The Company recognized settle-ment charges of $0.7 million in 2018 primarily resultingfrom payments made to certain participants of theCompany’s Canadian pension plan who elected a lumpsum distribution upon retirement. The Company does notexpect to recognize any additional settlement charges in2019.
The Company projects total benefit plan expense to beapproximately $16 million higher in 2019 than in 2018. Theincrease is primarily due to lower expected returns on planassets due to a lower asset base resulting from the weakmarket performance in 2018 and a 25 basis point reduc-tion in the Company’s expected long-term rate of returnassumption. Partially offsetting this unfavorable impact, isthe impact of higher discount rates on year-over-yearbenefit plan expense.
Plan benefits under the U.S. qualified retirement planwere frozen effective December 31, 2018 for all active,non-union participants. As of January 1, 2019, these par-ticipants became eligible for annual contributions under anoncontributory defined contribution program called the“Sonoco Retirement Contribution.”
The Company adjusts its discount rates at the end ofeach fiscal year based on yield curves of high-quality debtinstruments over durations that match the expected bene-fit payouts of each plan. The expected rate of returnassumption is derived by taking into consideration thetargeted plan asset allocation, projected future returns byasset class and active investment management. A third-party asset return model was used to develop anexpected range of returns on plan investments over a 12-to 15-year period, with the expected rate of returnselected from a best estimate range within the total rangeof projected results. The Company periodicallyre-balances its plan asset portfolio in order to maintain thetargeted allocation levels. The rate of compensationincrease assumption is generally based on salary and
incentive compensation increases. A key assumption forthe U.S. retiree health and life insurance plan is a medicalcost trend rate beginning at 6.5% for post-age 65 partic-ipants and trending down to an ultimate rate of 4.5% in2026. The ultimate trend rate of 4.5% represents theCompany’s best estimate of the long-term average annualmedical cost increase over the duration of the plan’sliabilities. It provides for real growth in medical costs inexcess of the overall inflation level.
Other assumptions and estimates impacting the pro-jected liabilities of these plans include inflation, participantwithdrawal and mortality rates and retirement ages. TheCompany annually reevaluates assumptions used inprojecting the pension and postretirement liabilities andassociated expense. These judgments, assumptions andestimates may affect the carrying value of pension andpostretirement plan net assets and liabilities and pensionand postretirement plan expenses in the Company’sConsolidated Financial Statements.
The sensitivity to changes in the critical assumptions forthe Company’s U.S. plans as of December 31, 2018, is asfollows:
Assumption($ in millions)
PercentagePoint
Change
Projected BenefitObligation
Higher/(Lower)
AnnualExpenseHigher/(Lower)
Discount rate -.25 pts $39.8 $3.4Expected return
on assets -.25 pts N/A $2.8
See Note 13 to the Consolidated Financial Statementsfor additional information on the Company’s pension andpostretirement plans.
Recent accounting pronouncementsInformation regarding recent accounting pronounce-
ments is provided in Note 2 to the Consolidated FinancialStatements included in Item 8 of this Annual Report onForm 10-K.
Item 7A. Quantitative and qualitative disclosuresabout market risk
Information regarding market risk is provided in thisAnnual Report on Form 10-K under the following itemsand captions: “Our international operations subject us tovarious risks that could adversely affect our businessoperations and financial results” and “Currency exchangerate fluctuations may reduce operating results and share-holders’ equity” in Item 1A-Risk Factors; “Risk Manage-ment” in Item 7 – Management’s Discussion and Analysisof Financial Condition and Results of Operations; and inNote 10 to the Consolidated Financial Statements inItem 8 – Financial Statements and Supplementary Data.
Item 8. Financial statements and supplementarydata
The Consolidated Financial Statements and Notes tothe Consolidated Financial Statements are provided onpages F-1 through F-40 of this report. Selected quarterlyfinancial data is provided in Note 18 to the ConsolidatedFinancial Statements included in this Annual Report onForm 10-K.
36S O N O C O 2 0 1 8 A N N U A L R E P O R TS O N O C O 2 0 1 8 A N N U A L R E P O R T I F O R M 1 0 - K
REPORT OF INDEPENDENT REGISTERED PUBLIC ACCOUNTING FIRM
To the Board of Directors and shareholders of Sonoco Products Company
Opinions on the financial statements and internal control over financial reportingWe have audited the accompanying consolidated balance sheets of Sonoco Products Company and its subsidiaries (the
“Company”) as of December 31, 2018 and 2017, and the related consolidated statements of income, comprehensive income,changes in total equity and cash flows for each of the three years in the period ended December 31, 2018, including the relatednotes and financial statement schedule listed in the index appearing under Item 15(a)(2) (collectively referred to as the“consolidated financial statements”). We also have audited the Company’s internal control over financial reporting as ofDecember 31, 2018, based on criteria established in Internal Control—Integrated Framework (2013) issued by the Committee ofSponsoring Organizations of the Treadway Commission (COSO).
In our opinion, the consolidated financial statements referred to above present fairly, in all material respects, the financial posi-tion of the Company as of December 31, 2018 and 2017, and the results of its operations and its cash flows for each of the threeyears in the period ended December 31, 2018 in conformity with accounting principles generally accepted in the United States ofAmerica. Also in our opinion, the Company maintained, in all material respects, effective internal control over financial reporting asof December 31, 2018, based on criteria established in Internal Control—Integrated Framework (2013) issued by the COSO.
Basis for opinionsThe Company’s management is responsible for these consolidated financial statements, for maintaining effective internal con-
trol over financial reporting, and for its assessment of the effectiveness of internal control over financial reporting, included inManagement’s Report on Internal Control over Financial Reporting appearing under Item 9A. Our responsibility is to express opin-ions on the Company’s consolidated financial statements and on the Company’s internal control over financial reporting based onour audits. We are a public accounting firm registered with the Public Company Accounting Oversight Board (United States)(PCAOB) and are required to be independent with respect to the Company in accordance with the U.S. federal securities laws andthe applicable rules and regulations of the Securities and Exchange Commission and the PCAOB.
We conducted our audits in accordance with the standards of the PCAOB. Those standards require that we plan and performthe audits to obtain reasonable assurance about whether the consolidated financial statements are free of material misstatement,whether due to error or fraud, and whether effective internal control over financial reporting was maintained in all material respects.
Our audits of the consolidated financial statements included performing procedures to assess the risks of material misstate-ment of the consolidated financial statements, whether due to error or fraud, and performing procedures that respond to thoserisks. Such procedures included examining, on a test basis, evidence regarding the amounts and disclosures in the consolidatedfinancial statements. Our audits also included evaluating the accounting principles used and significant estimates made by man-agement, as well as evaluating the overall presentation of the consolidated financial statements. Our audit of internal control overfinancial reporting included obtaining an understanding of internal control over financial reporting, assessing the risk that a materialweakness exists, and testing and evaluating the design and operating effectiveness of internal control based on the assessed risk.Our audits also included performing such other procedures as we considered necessary in the circumstances. We believe that ouraudits provide a reasonable basis for our opinions.
As described in Management’s Report on Internal Control over Financial Reporting, management has excluded HighlandPackaging Solutions (“Highland”), Conitex Sonoco (BVI), Ltd. (“Conitex Sonoco”) and Compositub from its assessment of internalcontrol over financial reporting as of December 31, 2018 because they were acquired by the Company in purchase businesscombinations during 2018. We have also excluded Highland, Conitex Sonoco and Compositub from our audit of internal controlover financial reporting. Highland, Conitex Sonoco and Compositub are wholly-owned subsidiaries whose total assets and totalrevenues excluded from management’s assessment and our audit of internal control over financial reporting represent 6.2% and2.6%, respectively, of the related consolidated financial statement amounts as of and for the year ended December 31, 2018.
Definition and limitations of internal control over financial reportingA company’s internal control over financial reporting is a process designed to provide reasonable assurance regarding the reli-
ability of financial reporting and the preparation of financial statements for external purposes in accordance with generallyaccepted accounting principles. A company’s internal control over financial reporting includes those policies and procedures that(i) pertain to the maintenance of records that, in reasonable detail, accurately and fairly reflect the transactions and dispositions ofthe assets of the company; (ii) provide reasonable assurance that transactions are recorded as necessary to permit preparation offinancial statements in accordance with generally accepted accounting principles, and that receipts and expenditures of thecompany are being made only in accordance with authorizations of management and directors of the company; and (iii) providereasonable assurance regarding prevention or timely detection of unauthorized acquisition, use, or disposition of the company’sassets that could have a material effect on the financial statements.
Because of its inherent limitations, internal control over financial reporting may not prevent or detect misstatements. Also, pro-jections of any evaluation of effectiveness to future periods are subject to the risk that controls may become inadequate becauseof changes in conditions, or that the degree of compliance with the policies or procedures may deteriorate.
Charlotte, North CarolinaFebruary 28, 2019
We have served as the Company’s auditor since 1967.
F-1S O N O C O 2 0 1 8 A N N U A L R E P O R TS O N O C O 2 0 1 8 A N N U A L R E P O R T I F O R M 1 0 - K
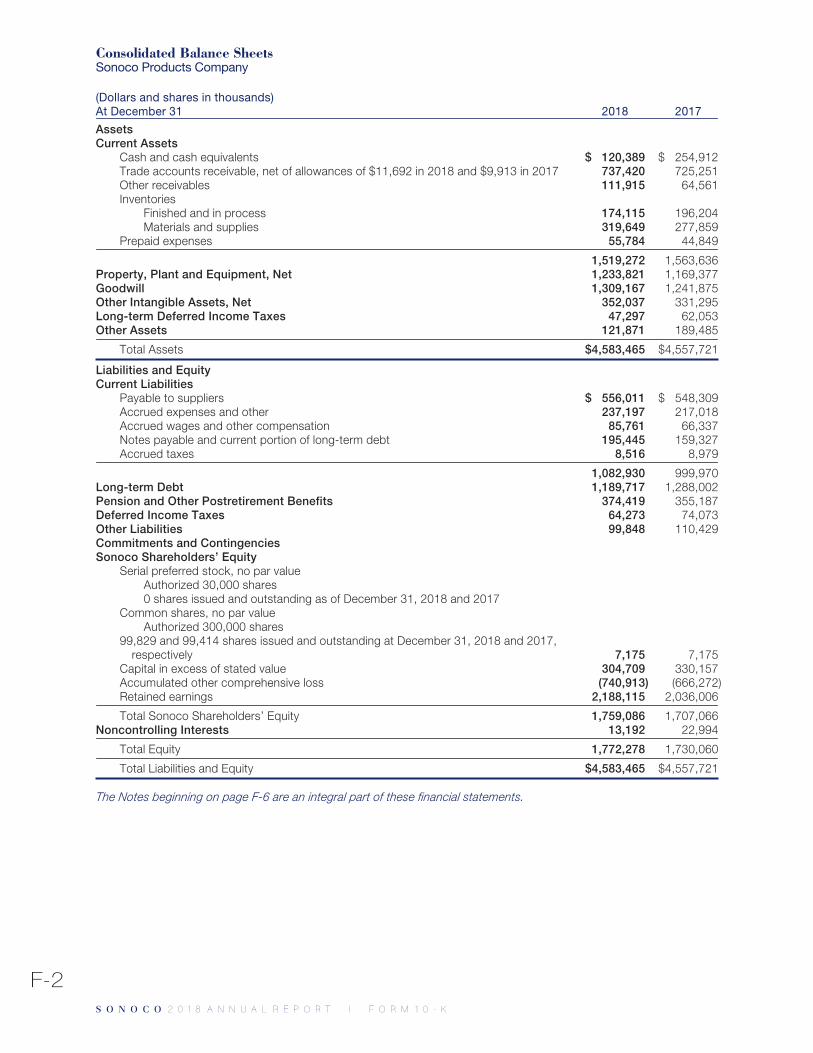
Consolidated Balance SheetsSonoco Products Company
(Dollars and shares in thousands)At December 31 2018 2017
AssetsCurrent Assets
Cash and cash equivalents $ 120,389 $ 254,912Trade accounts receivable, net of allowances of $11,692 in 2018 and $9,913 in 2017 737,420 725,251Other receivables 111,915 64,561Inventories
Finished and in process 174,115 196,204Materials and supplies 319,649 277,859
Prepaid expenses 55,784 44,849
1,519,272 1,563,636Property, Plant and Equipment, Net 1,233,821 1,169,377Goodwill 1,309,167 1,241,875Other Intangible Assets, Net 352,037 331,295Long-term Deferred Income Taxes 47,297 62,053Other Assets 121,871 189,485
Total Assets $4,583,465 $4,557,721
Liabilities and EquityCurrent Liabilities
Payable to suppliers $ 556,011 $ 548,309Accrued expenses and other 237,197 217,018Accrued wages and other compensation 85,761 66,337Notes payable and current portion of long-term debt 195,445 159,327Accrued taxes 8,516 8,979
1,082,930 999,970Long-term Debt 1,189,717 1,288,002Pension and Other Postretirement Benefits 374,419 355,187Deferred Income Taxes 64,273 74,073Other Liabilities 99,848 110,429Commitments and ContingenciesSonoco Shareholders’ Equity
Serial preferred stock, no par valueAuthorized 30,000 shares0 shares issued and outstanding as of December 31, 2018 and 2017
Common shares, no par valueAuthorized 300,000 shares
99,829 and 99,414 shares issued and outstanding at December 31, 2018 and 2017,respectively 7,175 7,175
Capital in excess of stated value 304,709 330,157Accumulated other comprehensive loss (740,913) (666,272)Retained earnings 2,188,115 2,036,006
Total Sonoco Shareholders’ Equity 1,759,086 1,707,066Noncontrolling Interests 13,192 22,994
Total Equity 1,772,278 1,730,060
Total Liabilities and Equity $4,583,465 $4,557,721
The Notes beginning on page F-6 are an integral part of these financial statements.
F-2S O N O C O 2 0 1 8 A N N U A L R E P O R TS O N O C O 2 0 1 8 A N N U A L R E P O R T I F O R M 1 0 - K
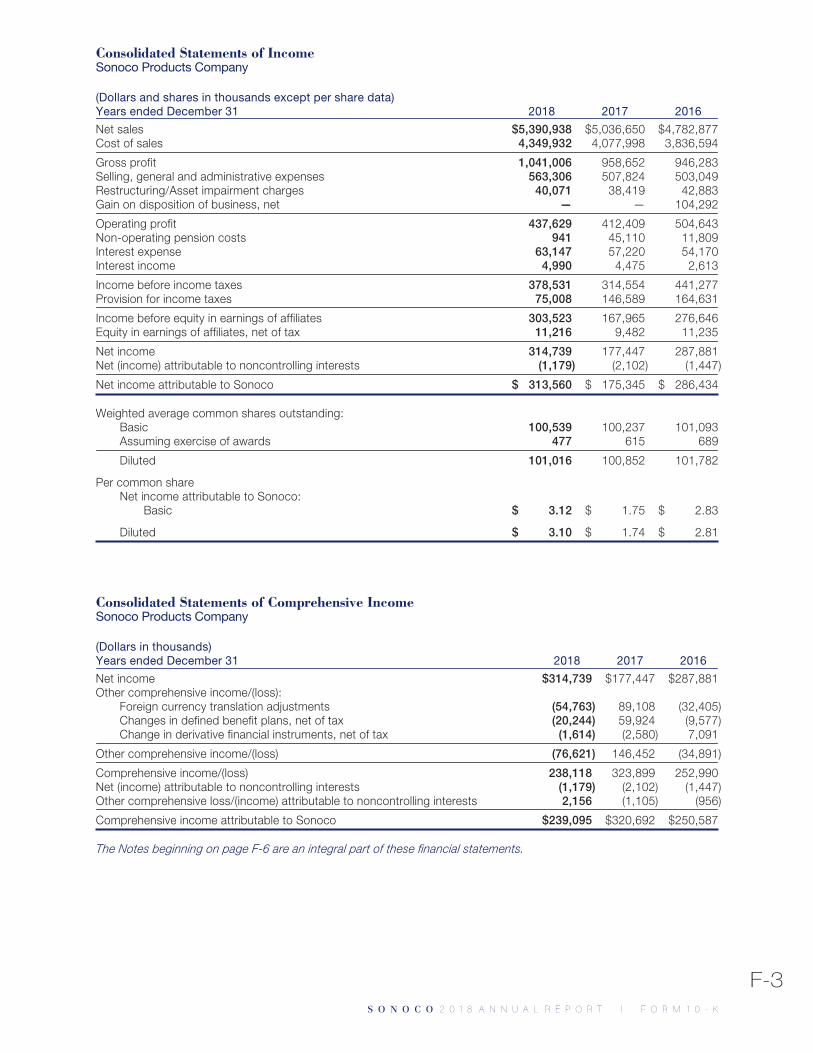
Consolidated Statements of IncomeSonoco Products Company
(Dollars and shares in thousands except per share data)Years ended December 31 2018 2017 2016
Net sales $5,390,938 $5,036,650 $4,782,877Cost of sales 4,349,932 4,077,998 3,836,594
Gross profit 1,041,006 958,652 946,283Selling, general and administrative expenses 563,306 507,824 503,049Restructuring/Asset impairment charges 40,071 38,419 42,883Gain on disposition of business, net — — 104,292
Operating profit 437,629 412,409 504,643Non-operating pension costs 941 45,110 11,809Interest expense 63,147 57,220 54,170Interest income 4,990 4,475 2,613
Income before income taxes 378,531 314,554 441,277Provision for income taxes 75,008 146,589 164,631
Income before equity in earnings of affiliates 303,523 167,965 276,646Equity in earnings of affiliates, net of tax 11,216 9,482 11,235
Net income 314,739 177,447 287,881Net (income) attributable to noncontrolling interests (1,179) (2,102) (1,447)
Net income attributable to Sonoco $ 313,560 $ 175,345 $ 286,434
Weighted average common shares outstanding:Basic 100,539 100,237 101,093Assuming exercise of awards 477 615 689
Diluted 101,016 100,852 101,782
Per common shareNet income attributable to Sonoco:
Basic $ 3.12 $ 1.75 $ 2.83
Diluted $ 3.10 $ 1.74 $ 2.81
Consolidated Statements of Comprehensive IncomeSonoco Products Company
(Dollars in thousands)Years ended December 31 2018 2017 2016
Net income $314,739 $177,447 $287,881Other comprehensive income/(loss):
Foreign currency translation adjustments (54,763) 89,108 (32,405)Changes in defined benefit plans, net of tax (20,244) 59,924 (9,577)Change in derivative financial instruments, net of tax (1,614) (2,580) 7,091
Other comprehensive income/(loss) (76,621) 146,452 (34,891)
Comprehensive income/(loss) 238,118 323,899 252,990Net (income) attributable to noncontrolling interests (1,179) (2,102) (1,447)Other comprehensive loss/(income) attributable to noncontrolling interests 2,156 (1,105) (956)
Comprehensive income attributable to Sonoco $239,095 $320,692 $250,587
The Notes beginning on page F-6 are an integral part of these financial statements.
F-3S O N O C O 2 0 1 8 A N N U A L R E P O R TS O N O C O 2 0 1 8 A N N U A L R E P O R T I F O R M 1 0 - K
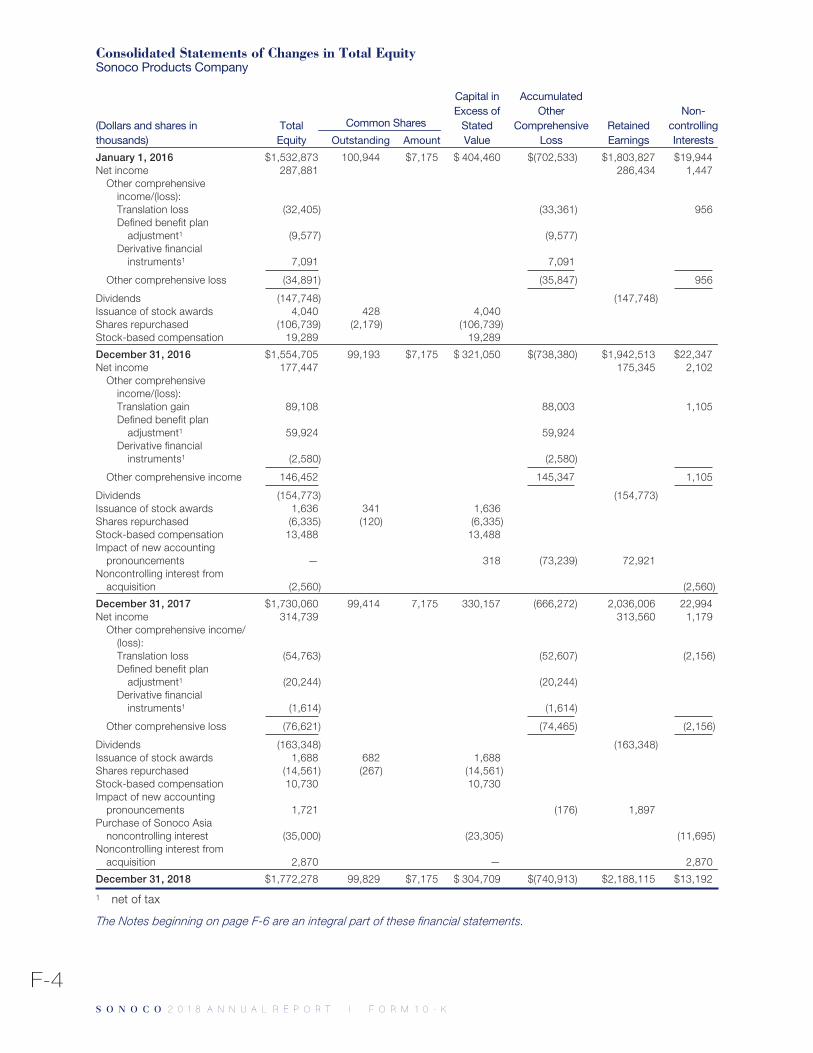
Consolidated Statements of Changes in Total EquitySonoco Products Company
(Dollars and shares inthousands)
TotalEquity
Common Shares
Capital inExcess of
StatedValue
AccumulatedOther
ComprehensiveLoss
RetainedEarnings
Non-controllingInterestsOutstanding Amount
January 1, 2016 $1,532,873 100,944 $7,175 $ 404,460 $(702,533) $1,803,827 $19,944Net income 287,881 286,434 1,447
Other comprehensiveincome/(loss):Translation loss (32,405) (33,361) 956Defined benefit plan
adjustment1 (9,577) (9,577)Derivative financial
instruments1 7,091 7,091
Other comprehensive loss (34,891) (35,847) 956
Dividends (147,748) (147,748)Issuance of stock awards 4,040 428 4,040Shares repurchased (106,739) (2,179) (106,739)Stock-based compensation 19,289 19,289
December 31, 2016 $1,554,705 99,193 $7,175 $ 321,050 $(738,380) $1,942,513 $22,347Net income 177,447 175,345 2,102
Other comprehensiveincome/(loss):Translation gain 89,108 88,003 1,105Defined benefit plan
adjustment1 59,924 59,924Derivative financial
instruments1 (2,580) (2,580)
Other comprehensive income 146,452 145,347 1,105
Dividends (154,773) (154,773)Issuance of stock awards 1,636 341 1,636Shares repurchased (6,335) (120) (6,335)Stock-based compensation 13,488 13,488Impact of new accounting
pronouncements — 318 (73,239) 72,921Noncontrolling interest from
acquisition (2,560) (2,560)
December 31, 2017 $1,730,060 99,414 7,175 330,157 (666,272) 2,036,006 22,994Net income 314,739 313,560 1,179
Other comprehensive income/(loss):Translation loss (54,763) (52,607) (2,156)Defined benefit plan
adjustment1 (20,244) (20,244)Derivative financial
instruments1 (1,614) (1,614)
Other comprehensive loss (76,621) (74,465) (2,156)
Dividends (163,348) (163,348)Issuance of stock awards 1,688 682 1,688Shares repurchased (14,561) (267) (14,561)Stock-based compensation 10,730 10,730Impact of new accounting
pronouncements 1,721 (176) 1,897Purchase of Sonoco Asia
noncontrolling interest (35,000) (23,305) (11,695)Noncontrolling interest from
acquisition 2,870 — 2,870
December 31, 2018 $1,772,278 99,829 $7,175 $ 304,709 $(740,913) $2,188,115 $13,192
1 net of tax
The Notes beginning on page F-6 are an integral part of these financial statements.
F-4S O N O C O 2 0 1 8 A N N U A L R E P O R TS O N O C O 2 0 1 8 A N N U A L R E P O R T I F O R M 1 0 - K
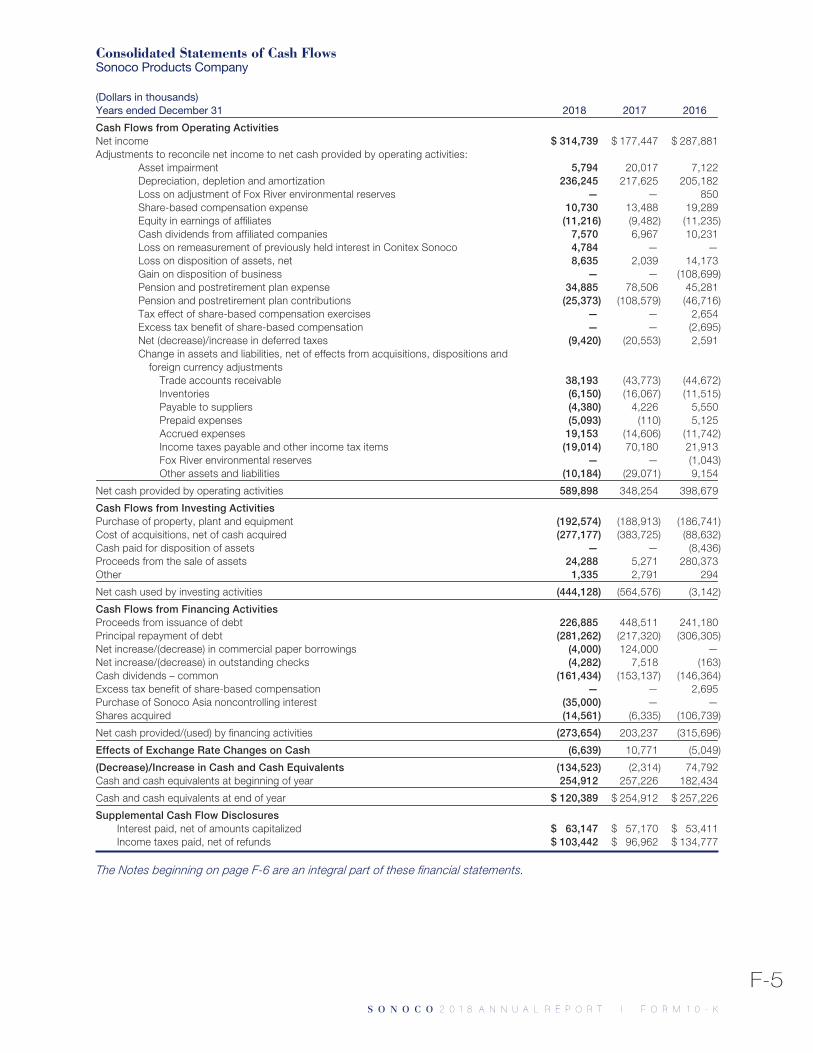
Consolidated Statements of Cash FlowsSonoco Products Company
(Dollars in thousands)Years ended December 31 2018 2017 2016
Cash Flows from Operating ActivitiesNet income $ 314,739 $ 177,447 $ 287,881Adjustments to reconcile net income to net cash provided by operating activities:
Asset impairment 5,794 20,017 7,122Depreciation, depletion and amortization 236,245 217,625 205,182Loss on adjustment of Fox River environmental reserves — — 850Share-based compensation expense 10,730 13,488 19,289Equity in earnings of affiliates (11,216) (9,482) (11,235)Cash dividends from affiliated companies 7,570 6,967 10,231Loss on remeasurement of previously held interest in Conitex Sonoco 4,784 — —Loss on disposition of assets, net 8,635 2,039 14,173Gain on disposition of business — — (108,699)Pension and postretirement plan expense 34,885 78,506 45,281Pension and postretirement plan contributions (25,373) (108,579) (46,716)Tax effect of share-based compensation exercises — — 2,654Excess tax benefit of share-based compensation — — (2,695)Net (decrease)/increase in deferred taxes (9,420) (20,553) 2,591Change in assets and liabilities, net of effects from acquisitions, dispositions and
foreign currency adjustmentsTrade accounts receivable 38,193 (43,773) (44,672)Inventories (6,150) (16,067) (11,515)Payable to suppliers (4,380) 4,226 5,550Prepaid expenses (5,093) (110) 5,125Accrued expenses 19,153 (14,606) (11,742)Income taxes payable and other income tax items (19,014) 70,180 21,913Fox River environmental reserves — — (1,043)Other assets and liabilities (10,184) (29,071) 9,154
Net cash provided by operating activities 589,898 348,254 398,679
Cash Flows from Investing ActivitiesPurchase of property, plant and equipment (192,574) (188,913) (186,741)Cost of acquisitions, net of cash acquired (277,177) (383,725) (88,632)Cash paid for disposition of assets — — (8,436)Proceeds from the sale of assets 24,288 5,271 280,373Other 1,335 2,791 294
Net cash used by investing activities (444,128) (564,576) (3,142)
Cash Flows from Financing ActivitiesProceeds from issuance of debt 226,885 448,511 241,180Principal repayment of debt (281,262) (217,320) (306,305)Net increase/(decrease) in commercial paper borrowings (4,000) 124,000 —Net increase/(decrease) in outstanding checks (4,282) 7,518 (163)Cash dividends – common (161,434) (153,137) (146,364)Excess tax benefit of share-based compensation — — 2,695Purchase of Sonoco Asia noncontrolling interest (35,000) — —Shares acquired (14,561) (6,335) (106,739)
Net cash provided/(used) by financing activities (273,654) 203,237 (315,696)
Effects of Exchange Rate Changes on Cash (6,639) 10,771 (5,049)
(Decrease)/Increase in Cash and Cash Equivalents (134,523) (2,314) 74,792Cash and cash equivalents at beginning of year 254,912 257,226 182,434
Cash and cash equivalents at end of year $ 120,389 $ 254,912 $ 257,226
Supplemental Cash Flow DisclosuresInterest paid, net of amounts capitalized $ 63,147 $ 57,170 $ 53,411Income taxes paid, net of refunds $ 103,442 $ 96,962 $ 134,777
The Notes beginning on page F-6 are an integral part of these financial statements.
F-5S O N O C O 2 0 1 8 A N N U A L R E P O R TS O N O C O 2 0 1 8 A N N U A L R E P O R T I F O R M 1 0 - K
N O T E S T O T H E C O N S O L I D A T E D F I N A N C I A L S T A T E M E N T S
Sonoco Products Company (dollars in thousands except per share data)
1. Summary of significant accounting policiesBasis of presentation
The Consolidated Financial Statements include theaccounts of Sonoco Products Company and its majority-owned subsidiaries (the “Company” or “Sonoco”) afterelimination of intercompany accounts and transactions.
Investments in affiliated companies in which the Com-pany shares control over the financial and operating deci-sions, but in which the Company is not the primarybeneficiary, are accounted for by the equity method ofaccounting. Income applicable to these equity investmentsis reflected in “Equity in earnings of affiliates, net of tax” inthe Consolidated Statements of Income. The aggregatecarrying value of equity investments is reported in “OtherAssets” in the Company’s Consolidated Balance Sheetsand totaled $55,516 and $107,722 at December 31, 2018and 2017, respectively. The year-over-year reduction isprimarily the result of the Company’s October 1, 2018,acquisition of the remaining 70% interest in ConitexSonoco (BVI), Ltd. (see Note 4 for additional information).
Affiliated companies over which the Company exercised asignificant influence at December 31, 2018, included:
Entity
Ownership InterestPercentage at
December 31, 2018
RTS Packaging JVCO 35.0%Cascades Conversion, Inc. 50.0%Cascades Sonoco, Inc. 50.0%Showa Products Company Ltd. 20.0%Papertech Energía, S.L. 25.0%Weidenhammer New Packaging, LLC 40.0%
Also included in the investment totals above is theCompany’s 19.5% ownership in a small tubes and coresbusiness in Chile and its 12.19% ownership in a smallpaper recycling business in Finland. These investmentsare accounted for under the cost method as the Companydoes not have the ability to exercise significant influenceover them.
Estimates and assumptionsThe preparation of financial statements in conformity
with accounting principles generally accepted in theUnited States of America (U.S. GAAP) requires manage-ment to make estimates and assumptions that affect thereported amount of assets and liabilities at the date of thefinancial statements and the reported amounts of rev-enues and expenses during the reporting period. Actualresults could differ from those estimates.
Revenue recognitionBeginning in 2018, the Company records revenue
when control is transferred to the customer, which is eitherupon shipment or over time in cases where the Companyis entitled to payment with margin for products producedthat are customer specific without alternative use. TheCompany recognizes over time revenue under the inputmethod as goods are produced. Revenue that is recog-nized at a point in time is recognized when the customer
obtains control of the goods. Customers obtain controleither when goods are delivered to the customer facility, ifthe Company is responsible for arranging transportation,or when picked up by the customer’s designated carrier.The Company commonly enters into Master SupplyArrangements (MSA) with customers to provide goodsand/or services over specific time periods. Customerssubmit purchase orders with quantities and prices to cre-ate a contract for accounting purposes. Shipping andhandling expenses are considered a fulfillment cost, andincluded in “Cost of Sales,” and freight charged tocustomers is included in “Net Sales” in the Company’sConsolidated Statements of Income.
Prior to 2018, the Company recorded revenue whentitle and risk of ownership passed to the customer, andwhen persuasive evidence of an arrangement existed,delivery had occurred or services had been rendered, thesales price to the customer was fixed or determinable andwhen collectibility was reasonably assured. Certain judg-ments, such as provisions for estimates of sales returnsand allowances, were required in the application of theCompany’s revenue policy and, therefore, were includedin the results of operations in its Consolidated FinancialStatements. Shipping and handling expenses wereincluded in “Cost of sales,” and freight charged tocustomers was included in “Net sales” in the Company’sConsolidated Statements of Income for the years endedDecember 31, 2017 and 2016.
The Company has rebate agreements with certaincustomers. These rebates are recorded as reductions ofsales and are accrued using sales data and rebate percen-tages specific to each customer agreement. Accruedcustomer rebates are included in “Accrued expenses andother” in the Company’s Consolidated Balance Sheets.
Payment terms under the Company’s arrangementsare short term in nature, generally no longer than 120days. The Company does provide prompt payment dis-counts to certain customers if invoices are paid within apredetermined period. Prompt payment discounts aretreated as a reduction of revenue and are determinablewithin a short period after the originating sale.
Accounts receivable and allowance for doubtfulaccounts
The Company’s trade accounts receivable arenon-interest bearing and are recorded at the invoicedamounts. The allowance for doubtful accounts representsthe Company’s best estimate of the amount of probablecredit losses in existing accounts receivable. Provisionsare made to the allowance for doubtful accounts at suchtime that collection of all or part of a trade account receiv-able is in question. The allowance for doubtful accounts ismonitored on a regular basis and adjustments are madeas needed to ensure that the account properly reflects theCompany’s best estimate of uncollectible trade accountsreceivable. Account balances are charged off against theallowance for doubtful accounts when the Companydetermines that the receivable will not be recovered.
Sales to the Company’s largest customer accountedfor approximately 4% of the Company’s net sales in 2018,4% in 2017 and 5% in 2016, primarily in the Display andPackaging and Consumer Packaging segments. Receiv-
F-6S O N O C O 2 0 1 8 A N N U A L R E P O R TS O N O C O 2 0 1 8 A N N U A L R E P O R T I F O R M 1 0 - K
ables from this customer accounted for approximately 4%of the Company’s total trade accounts receivable atDecember 31, 2018 and 4% at December 31, 2017. TheCompany’s next largest customer comprised approx-imately 4% of the Company’s net sales in 2018, 3% in2017 and 4% in 2016.
Certain of the Company’s customers sponsor andactively promote multi-vendor supply chain financearrangements and, in a limited number of cases, theCompany has agreed to participate. Accordingly, approx-imately 9% and 7% of consolidated annual sales were set-tled under these arrangements in 2018 and 2017,respectively.
Research and developmentResearch and development costs are charged to
expense as incurred and include salaries and other directlyrelated expenses. Research and development costs total-ing approximately $23,200 in 2018, $21,000 in 2017 and$22,500 in 2016 are included in “Selling, general andadministrative expenses” in the Company’s ConsolidatedStatements of Income.
Restructuring and asset impairmentCosts associated with exit or disposal activities are
recognized when the liability is incurred. If assets becomeimpaired as a result of a restructuring action, the assetsare written down to fair value, less estimated costs to sell,if applicable. A number of significant estimates andassumptions are involved in the determination of fair value.The Company considers historical experience and allavailable information at the time the estimates are made;however, the amounts that are ultimately realized upon thesale of divested assets may differ from the estimated fairvalues reflected in the Company’s Consolidated FinancialStatements.
Cash and cash equivalentsCash equivalents are composed of highly liquid invest-
ments with an original maturity to the Company of gen-erally three months or less when purchased. Cashequivalents are recorded at cost, which approximatesmarket.
InventoriesInventories are stated at the lower of cost or net realiz-
able value. The last-in, first-out (LIFO) method is used forthe valuation of certain of the Company’s domesticinventories, primarily metal, internally manufactured paperand paper purchased from third parties.
The LIFO method of accounting was used to determinethe carrying costs of approximately 14% and 14% of totalinventories at December 31, 2018 and 2017, respectively.The remaining inventories are determined on the first-in,first-out (FIFO) method.
If the FIFO method of accounting had been used for allinventories, total inventory would have been higher by$18,854 and $17,632 at December 31, 2018 and 2017,respectively.
Property, plant and equipmentPlant assets represent the original cost of land, build-
ings and equipment, less depreciation, computed underthe straight-line method over the estimated useful lives of
the assets, and are reviewed for impairment wheneverevents indicate the carrying value may not be recoverable.Equipment lives generally range from 3 to 11 years, andbuildings from 15 to 40 years.
Timber resources are stated at cost. Depletion ischarged to operations based on the estimated number ofunits of timber cut during the year.
Goodwill and other intangible assetsThe Company assesses its goodwill for impairment
annually and from time to time when warranted by thefacts and circumstances surrounding individual reportingunits or the Company as a whole. In performing theimpairment test, the Company compares the fair value ofthe reporting unit with its carrying amount and recognizesan impairment charge for the amount by which the carry-ing amount exceeds the reporting unit’s fair value. Thisquantitative test considers factors such as the amount bywhich estimated fair value exceeds current carrying value,current year operating performance as compared to priorprojections, and implied fair values from comparable trad-ing and transaction multiples.
Calculated reporting unit estimated fair values reflect anumber of significant management assumptions and esti-mates including the Company’s forecast of sales volumesand prices, profit margins, income taxes, capitalexpenditures and changes in working capital require-ments. Changes in these assumptions and/or discountrates could materially impact the estimated fair values.
When the Company estimates the fair value of a report-ing unit, it does so using a discounted cash flow modelbased on projections of future years’ operating results andassociated cash flows, corroborated by comparable trad-ing and transaction multiples. The Company’s projectionsincorporate management’s best estimates of the expectedfuture results, which include expectations related to newand retained business and future operating margins. Pro-jected future cash flows are then discounted to presentvalue using a discount rate management believes iscommensurate with the risks inherent in the cash flows.
If the fair value of a reporting unit exceeds the carryingvalue of the reporting unit’s assets, including goodwill,there is no impairment. If not, and the carrying value of thereporting unit’s goodwill exceeds the fair value of thatgoodwill, an impairment charge is recognized for theexcess. Goodwill is not amortized.
Intangible assets are amortized, usually on a straight-line basis, over their respective useful lives, which gen-erally range from 3 to 40 years. The Company evaluatesits intangible assets for impairment whenever indicators ofimpairment exist. The Company has no intangibles withindefinite lives.
Income taxesThe Company provides for income taxes using the
asset and liability method. Under this method, deferred taxassets and liabilities are determined based on differencesbetween financial reporting requirements and tax laws.Assets and liabilities are measured using the enacted taxrates and laws that will be in effect when the differencesare expected to reverse.
The Company recognizes liabilities for uncertain incometax positions based on our estimate of whether it is morelikely than not that additional taxes will be required and wereport related interest and penalties as income taxes.
F-7S O N O C O 2 0 1 8 A N N U A L R E P O R TS O N O C O 2 0 1 8 A N N U A L R E P O R T I F O R M 1 0 - K
DerivativesThe Company uses derivatives to mitigate the effect of
fluctuations in some of its raw material and energy costs,foreign currencies, and, from time to time, interest rates.The Company purchases commodities such as recoveredpaper, metal, resins and energy generally at market or atfixed prices that are established with the vendor as part ofthe purchase process for quantities expected to be con-sumed in the ordinary course of business. The Companymay enter into commodity futures or swaps to manage theeffect of price fluctuations. The Company may use foreigncurrency forward contracts and other risk managementinstruments to manage exposure to changes in foreigncurrency cash flows and the translation of monetaryassets and liabilities on the Company’s consolidatedfinancial statements. The Company is exposed to interest-rate fluctuations as a result of using debt as a source offinancing for its operations. The Company may from timeto time use traditional, unleveraged interest rate swaps toadjust its mix of fixed and variable rate debt to manage itsexposure to interest rate movements.
The Company records its derivatives as assets orliabilities on the balance sheet at fair value using publishedmarket prices or estimated values based on current priceand/or rate quotes and discounted estimated cash flows.Changes in the fair value of derivatives are recognizedeither in net income or in other comprehensive income,depending on the designated purpose of the derivative.Amounts in accumulated other comprehensive income arereclassified into earnings in the same period or periodsduring which the hedged forecasted transaction affectsearnings. It is the Company’s policy not to speculate inderivative instruments.
Business combinationsThe Company’s acquisitions of businesses are
accounted for in accordance with ASC 805, “BusinessCombinations.” The Company recognizes the identifiableassets acquired, the liabilities assumed, and any non-controlling interests in an acquired business at their fairvalues as of the date of acquisition. Goodwill is measured asthe excess of consideration transferred, also measured atfair value, over the net of the acquisition date fair values ofthe identifiable assets acquired and liabilities assumed. Theacquisition method of accounting requires us to make sig-nificant estimates and assumptions regarding the fair valuesof the elements of a business combination as of the date ofacquisition, including the fair values of identifiable intangibleassets, deferred tax asset valuation allowances, liabilitiesincluding those related to debt, pensions and other post-retirement plans, uncertain tax positions, contingentconsideration and contingencies. This method also requiresus to refine these estimates over a measurement period notto exceed one year to reflect new information obtainedabout facts and circumstances that existed as of theacquisition date that, if known, would have affected themeasurement of the amounts recognized as of that date. Ifwe are required to adjust provisional amounts that we haverecorded for the fair values of assets and liabilities in con-nection with acquisitions, these adjustments could have amaterial impact on our financial condition and results ofoperations.
Significant estimates and assumptions in estimating thefair value of acquired customer relationships, technology,and other identifiable intangible assets include future cash
flows that we expect to generate from the acquiredassets. If the subsequent actual results and updated pro-jections of the underlying business activity change com-pared with the assumptions and projections used todevelop these values, we could record impairmentcharges. In addition, we have estimated the economiclives of certain acquired assets and these lives are used tocalculate depreciation and amortization expense. If ourestimates of the economic lives change, depreciation oramortization expenses could be increased or decreased,or the acquired asset could be impaired.
Reportable segmentsThe Company identifies its reportable segments by
evaluating the level of detail reviewed by the chief operat-ing decision maker, gross profit margins, nature of prod-ucts sold, nature of the production processes, type andclass of customer, methods used to distribute products,and nature of the regulatory environment. Of these factors,the Company believes that the most significant indetermining the aggregation of operating segments arethe nature of the products and the type of customersserved.
ContingenciesPursuant to U.S. GAAP for accounting for con-
tingencies, accruals for estimated losses are recorded atthe time information becomes available indicating thatlosses are probable and that the amounts are reasonablyestimable. Amounts so accrued are not discounted.
2. New accounting pronouncementsIn December 2018, the Financial Accounting Standards
Board (“FASB”) issued Accounting Standards Update(“ASU”) 2018-16 “Derivatives and Hedging: Inclusion ofthe Secured Overnight Financing Rate (SOFR) OvernightIndex Swap (OIS) Rate as a Benchmark Interest Rate forHedge Accounting Purposes,” which allows the use of theSOFR and OIS rate as benchmark rates after the FederalReserve started publishing such daily rate on April 3,2018. This update is effective for fiscal years beginningafter December 15, 2018, and interim periods within thosefiscal years. The adoption is not expected to have amaterial effect on the consolidated financial statements.
In August 2018, FASB issued ASU 2018-15,“Intangibles – Goodwill and Other Internal-Use Software:Customer’s Accounting for Implementation Costs Incurredin a Cloud Computing Arrangement that is a ServiceContract,” which provides guidance on capitalizingimplementation cost associated with arrangements thatcontain a license. The Company adopted this ASU usingthe prospective method effective October 1, 2018. Theadoption of the standard did not have a material effect onthe Company’s consolidated financial statements.
In February 2018, the FASB issued ASU 2018-02,“Reclassification of Certain Tax Effects from AccumulatedOther Comprehensive Income,” which allows areclassification from accumulated other comprehensiveincome to retained earnings for stranded tax effects result-ing from the Tax Cuts and Jobs Act. This update is effec-tive for fiscal years beginning after December 15, 2018,and interim periods within those years, with early adoptionpermitted. The Company elected to early adopt this stan-dard in the fourth quarter of 2017 using specific identi-fication, and as a result reclassified $73,239 from
F-8S O N O C O 2 0 1 8 A N N U A L R E P O R TS O N O C O 2 0 1 8 A N N U A L R E P O R T I F O R M 1 0 - K
“Accumulated other comprehensive income” to “Retainedearnings.” This reclassification related only to the changein the statutory tax rate and affected only the Company’sConsolidated Balance Sheet at December 31, 2017, andConsolidated Statement of Changes in Total Equity for theyear ended December 31, 2017.
In August 2017, the FASB issued ASU 2017-12,“Derivatives and Hedging: Targeted Improvements toAccounting for Hedging Activities,” which expands andrefines hedge accounting for both financial andnon-financial risk components, aligns the recognition andpresentation of the effects of hedging instruments andhedge items in the financial statements, and includes cer-tain targeted improvements to ease the application ofcurrent guidance related to the assessment of hedgeeffectiveness. The update to the standard is effective forperiods beginning after December 15, 2018, with earlyadoption permitted in any interim period after issuance ofthis update. The Company implemented this ASU effectiveJanuary 1, 2018, and recorded a cumulative adjustment toretained earnings of $176 as of that date in order toremove previously recognized ineffectiveness losses oncontracts outstanding as of the date of adoption
In May 2017, the FASB issued ASU 2017-09, “Scopeof Modification Accounting,” which provides guidanceabout which changes to the terms or conditions of ashare-based payment award require an entity to applymodification accounting under Topic 718. Under the newguidance, modification accounting to a share-basedpayment award will not be applied if all of the following arethe same immediately before and after the change: theaward’s fair value (or calculated value or intrinsic value, ifthose measurement methods are used); the award’s vest-ing conditions; and the award’s classification as an equityor liability instrument. While the new guidance does notchange the accounting for modifications, it is intended toreduce diversity in practice and result in fewer changes tothe terms of an award being accounted for as mod-ifications. This update is effective for annual periods,beginning after December 31, 2017, with early adoptionpermitted in any interim period after issuance of thisupdate. The Company elected to early adopt the standardin the fourth quarter 2017. The adoption did not have amaterial effect on the consolidated financial statements.
In March 2017, the FASB issued ASU 2017-07,“Improving the Presentation of Net Periodic Pension Costand Net Periodic Postretirement Benefit Cost,” whichrequires an employer to report service cost in the sameline item as other compensation costs arising fromemployees during the period. The other components ofnet benefit cost as defined are required to be presentedseparately from the service cost component and outside asubtotal of income from operations, if one is presented, ordisclosed. This update also allows only the service costcomponent to be eligible for capitalization when applicableand is effective for periods beginning after December 15,2017. The amendments are to be applied retrospectivelyfor the presentation of the components of net benefit costin the income statement and prospectively for the capital-ization of the service cost component. The Companyimplemented this ASU effective January 1, 2018, modify-ing its income statement presentation of the componentsof net benefit cost accordingly, including the retrospectiveapplication to previously reported results. As a result of theretrospective application, the amounts previously reported
in “Cost of sales” and “Selling, general and administrativeexpenses” for the year ended December 31, 2017, werereduced by $9,262 and $35,848, respectively, and“Operating profit” increased by $45,110, in order to con-form to the current presentation. The comparable changesfor the year ended December 31, 2016, were $8,857,$2,952, and $11,809, for “Cost of sales,” “Selling, generaland administrative expenses,” and “Operating profit,”respectively. No change was required to the Company’spolicy regarding the capitalization of such costs.
In January 2017, the FASB issued ASU 2017-04,“Simplifying the Test for Goodwill Impairment,” eliminatingthe requirement to determine the fair value of individualassets and liabilities of a reporting unit to measure good-will impairment. Under ASU 2017-04, goodwill impairmenttesting is performed by comparing the fair value of thereporting unit with its carrying amount and recognizing animpairment charge for the amount by which the carryingamount exceeds the reporting unit’s fair value. The newstandard is effective for annual and interim goodwillimpairment tests in fiscal years beginning afterDecember 15, 2019, with early adoption permitted, andshould be applied on a prospective basis. The Companyelected early adoption of the standard effective January 1,2018. Any future goodwill impairment, should it occur, willbe determined in accordance with this ASU.
In October 2016, the FASB issued ASU 2016-16,“Intra-Entity Transfers of Assets Other Than Inventory,”which requires an entity to recognize the income taxconsequences of an intra-entity transfer of an asset upontransfer of an asset other than inventory, eliminating thecurrent recognition exception. Prior to this ASU, GAAPprohibited the recognition of current and deferred incometaxes for intra-entity asset transfers until the asset wassold to an outside party. The recognition prohibition wasan exception to the principle of comprehensive recognitionof current and deferred income taxes in GAAP. This guid-ance became effective for the Company on January 1,2018, and did not have a material effect on its con-solidated financial statements.
In August 2016, the FASB issued ASU 2016-15,“Classification of Certain Cash Receipts and CashPayments,” providing clarification on eight cash flowclassification issues, including 1) debt prepayment or debtextinguishment costs, 2) settlement of relatively insignif-icant debt instruments, 3) contingent consideration pay-ments, 4) insurance claim settlements, 5) life insurancesettlements, 6) distributions received from equity methodinvestees, 7) beneficial interests in securitization trans-actions, and 8) separately identifiable cash flows. Thisguidance, which applies to both interim and annual peri-ods, became effective for the Company on January 1,2018. As a result of the retrospective application,insurance proceeds totaling $1,104 received during theyear ended December 31, 2017 that were previouslyreported in “Cash Flows from Operating Activities” werereclassified to “Cash Flows from Investing Activities.”Otherwise, adoption of the standard did not have amaterial effect on the Company’s consolidated financialstatements, as the Company either did not realize anycash flows from these types of activities, such amountswere immaterial, or the prescribed guidance did not differfrom its current practice.
In March 2016, the FASB issued ASU 2016-08,“Revenue from Contracts with Customers, Principal versus
F-9S O N O C O 2 0 1 8 A N N U A L R E P O R TS O N O C O 2 0 1 8 A N N U A L R E P O R T I F O R M 1 0 - K
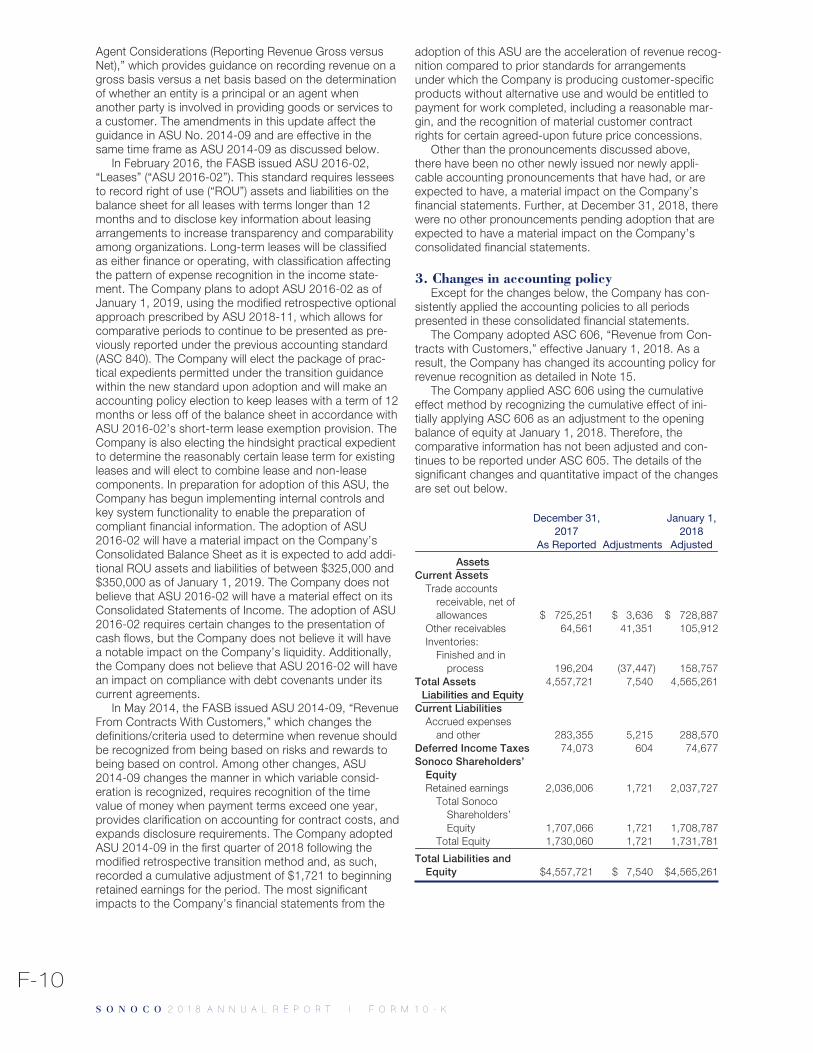
Agent Considerations (Reporting Revenue Gross versusNet),” which provides guidance on recording revenue on agross basis versus a net basis based on the determinationof whether an entity is a principal or an agent whenanother party is involved in providing goods or services toa customer. The amendments in this update affect theguidance in ASU No. 2014-09 and are effective in thesame time frame as ASU 2014-09 as discussed below.
In February 2016, the FASB issued ASU 2016-02,“Leases” (“ASU 2016-02”). This standard requires lesseesto record right of use (“ROU”) assets and liabilities on thebalance sheet for all leases with terms longer than 12months and to disclose key information about leasingarrangements to increase transparency and comparabilityamong organizations. Long-term leases will be classifiedas either finance or operating, with classification affectingthe pattern of expense recognition in the income state-ment. The Company plans to adopt ASU 2016-02 as ofJanuary 1, 2019, using the modified retrospective optionalapproach prescribed by ASU 2018-11, which allows forcomparative periods to continue to be presented as pre-viously reported under the previous accounting standard(ASC 840). The Company will elect the package of prac-tical expedients permitted under the transition guidancewithin the new standard upon adoption and will make anaccounting policy election to keep leases with a term of 12months or less off of the balance sheet in accordance withASU 2016-02’s short-term lease exemption provision. TheCompany is also electing the hindsight practical expedientto determine the reasonably certain lease term for existingleases and will elect to combine lease and non-leasecomponents. In preparation for adoption of this ASU, theCompany has begun implementing internal controls andkey system functionality to enable the preparation ofcompliant financial information. The adoption of ASU2016-02 will have a material impact on the Company’sConsolidated Balance Sheet as it is expected to add addi-tional ROU assets and liabilities of between $325,000 and$350,000 as of January 1, 2019. The Company does notbelieve that ASU 2016-02 will have a material effect on itsConsolidated Statements of Income. The adoption of ASU2016-02 requires certain changes to the presentation ofcash flows, but the Company does not believe it will havea notable impact on the Company’s liquidity. Additionally,the Company does not believe that ASU 2016-02 will havean impact on compliance with debt covenants under itscurrent agreements.
In May 2014, the FASB issued ASU 2014-09, “RevenueFrom Contracts With Customers,” which changes thedefinitions/criteria used to determine when revenue shouldbe recognized from being based on risks and rewards tobeing based on control. Among other changes, ASU2014-09 changes the manner in which variable consid-eration is recognized, requires recognition of the timevalue of money when payment terms exceed one year,provides clarification on accounting for contract costs, andexpands disclosure requirements. The Company adoptedASU 2014-09 in the first quarter of 2018 following themodified retrospective transition method and, as such,recorded a cumulative adjustment of $1,721 to beginningretained earnings for the period. The most significantimpacts to the Company’s financial statements from the
adoption of this ASU are the acceleration of revenue recog-nition compared to prior standards for arrangementsunder which the Company is producing customer-specificproducts without alternative use and would be entitled topayment for work completed, including a reasonable mar-gin, and the recognition of material customer contractrights for certain agreed-upon future price concessions.
Other than the pronouncements discussed above,there have been no other newly issued nor newly appli-cable accounting pronouncements that have had, or areexpected to have, a material impact on the Company’sfinancial statements. Further, at December 31, 2018, therewere no other pronouncements pending adoption that areexpected to have a material impact on the Company’sconsolidated financial statements.
3. Changes in accounting policyExcept for the changes below, the Company has con-
sistently applied the accounting policies to all periodspresented in these consolidated financial statements.
The Company adopted ASC 606, “Revenue from Con-tracts with Customers,” effective January 1, 2018. As aresult, the Company has changed its accounting policy forrevenue recognition as detailed in Note 15.
The Company applied ASC 606 using the cumulativeeffect method by recognizing the cumulative effect of ini-tially applying ASC 606 as an adjustment to the openingbalance of equity at January 1, 2018. Therefore, thecomparative information has not been adjusted and con-tinues to be reported under ASC 605. The details of thesignificant changes and quantitative impact of the changesare set out below.
December 31,2017
As Reported Adjustments
January 1,2018
Adjusted
AssetsCurrent Assets
Trade accountsreceivable, net ofallowances $ 725,251 $ 3,636 $ 728,887
Other receivables 64,561 41,351 105,912Inventories:
Finished and inprocess 196,204 (37,447) 158,757
Total Assets 4,557,721 7,540 4,565,261Liabilities and Equity
Current LiabilitiesAccrued expenses
and other 283,355 5,215 288,570Deferred Income Taxes 74,073 604 74,677Sonoco Shareholders’
EquityRetained earnings 2,036,006 1,721 2,037,727
Total SonocoShareholders’Equity 1,707,066 1,721 1,708,787
Total Equity 1,730,060 1,721 1,731,781
Total Liabilities andEquity $4,557,721 $ 7,540 $4,565,261
F-10S O N O C O 2 0 1 8 A N N U A L R E P O R TS O N O C O 2 0 1 8 A N N U A L R E P O R T I F O R M 1 0 - K
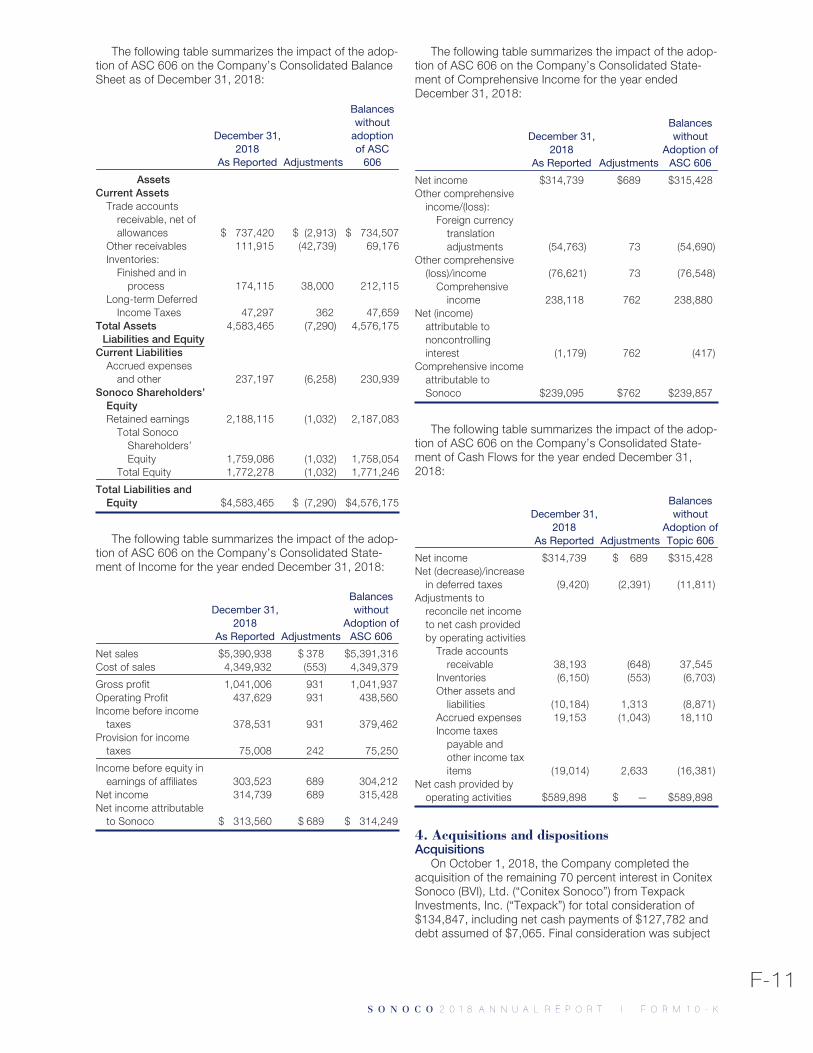
The following table summarizes the impact of the adop-tion of ASC 606 on the Company’s Consolidated BalanceSheet as of December 31, 2018:
December 31,2018
As Reported Adjustments
Balanceswithout
adoptionof ASC
606
AssetsCurrent Assets
Trade accountsreceivable, net ofallowances $ 737,420 $ (2,913) $ 734,507
Other receivables 111,915 (42,739) 69,176Inventories:
Finished and inprocess 174,115 38,000 212,115
Long-term DeferredIncome Taxes 47,297 362 47,659
Total Assets 4,583,465 (7,290) 4,576,175Liabilities and Equity
Current LiabilitiesAccrued expenses
and other 237,197 (6,258) 230,939Sonoco Shareholders’
EquityRetained earnings 2,188,115 (1,032) 2,187,083
Total SonocoShareholders’Equity 1,759,086 (1,032) 1,758,054
Total Equity 1,772,278 (1,032) 1,771,246
Total Liabilities andEquity $4,583,465 $ (7,290) $4,576,175
The following table summarizes the impact of the adop-tion of ASC 606 on the Company’s Consolidated State-ment of Income for the year ended December 31, 2018:
December 31,2018
As Reported Adjustments
Balanceswithout
Adoption ofASC 606
Net sales $5,390,938 $ 378 $5,391,316Cost of sales 4,349,932 (553) 4,349,379
Gross profit 1,041,006 931 1,041,937Operating Profit 437,629 931 438,560Income before income
taxes 378,531 931 379,462Provision for income
taxes 75,008 242 75,250
Income before equity inearnings of affiliates 303,523 689 304,212
Net income 314,739 689 315,428Net income attributable
to Sonoco $ 313,560 $ 689 $ 314,249
The following table summarizes the impact of the adop-tion of ASC 606 on the Company’s Consolidated State-ment of Comprehensive Income for the year endedDecember 31, 2018:
December 31,2018
As Reported Adjustments
Balanceswithout
Adoption ofASC 606
Net income $314,739 $689 $315,428Other comprehensive
income/(loss):Foreign currency
translationadjustments (54,763) 73 (54,690)
Other comprehensive(loss)/income (76,621) 73 (76,548)
Comprehensiveincome 238,118 762 238,880
Net (income)attributable tononcontrollinginterest (1,179) 762 (417)
Comprehensive incomeattributable toSonoco $239,095 $762 $239,857
The following table summarizes the impact of the adop-tion of ASC 606 on the Company’s Consolidated State-ment of Cash Flows for the year ended December 31,2018:
December 31,2018
As Reported Adjustments
Balanceswithout
Adoption ofTopic 606
Net income $314,739 $ 689 $315,428Net (decrease)/increase
in deferred taxes (9,420) (2,391) (11,811)Adjustments to
reconcile net incometo net cash providedby operating activities
Trade accountsreceivable 38,193 (648) 37,545
Inventories (6,150) (553) (6,703)Other assets and
liabilities (10,184) 1,313 (8,871)Accrued expenses 19,153 (1,043) 18,110Income taxes
payable andother income taxitems (19,014) 2,633 (16,381)
Net cash provided byoperating activities $589,898 $ — $589,898
4. Acquisitions and dispositionsAcquisitions
On October 1, 2018, the Company completed theacquisition of the remaining 70 percent interest in ConitexSonoco (BVI), Ltd. (“Conitex Sonoco”) from TexpackInvestments, Inc. (“Texpack”) for total consideration of$134,847, including net cash payments of $127,782 anddebt assumed of $7,065. Final consideration was subject
F-11S O N O C O 2 0 1 8 A N N U A L R E P O R TS O N O C O 2 0 1 8 A N N U A L R E P O R T I F O R M 1 0 - K
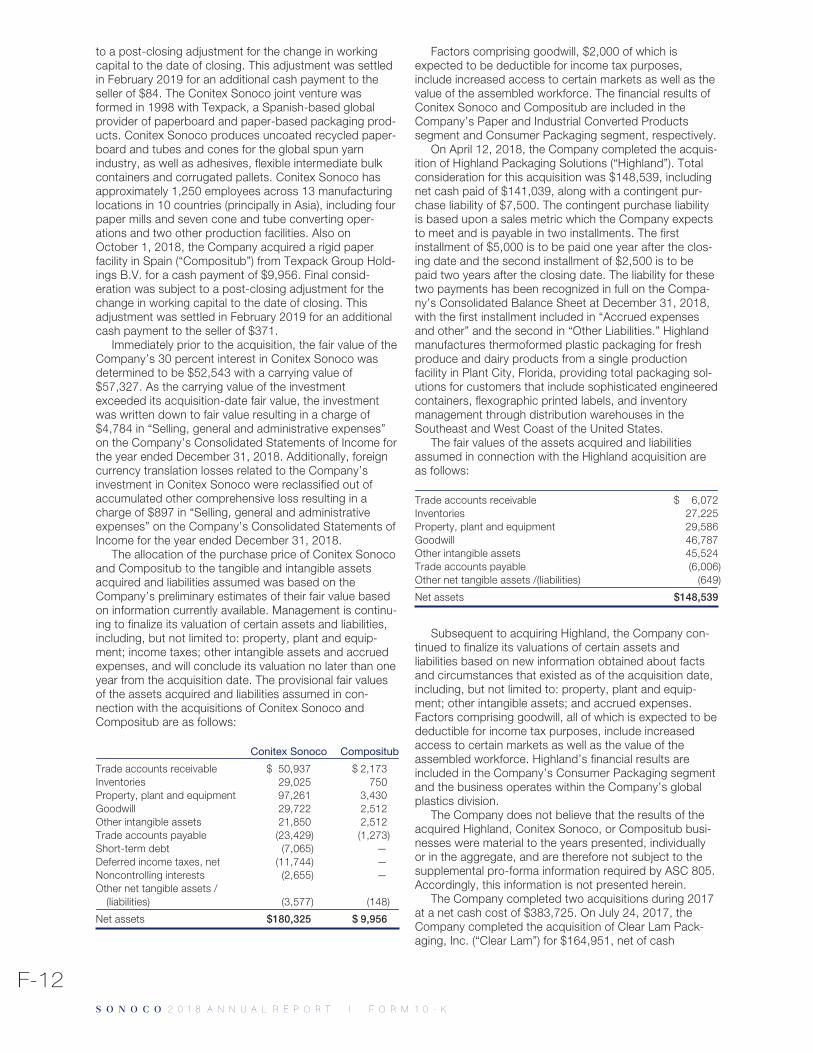
to a post-closing adjustment for the change in workingcapital to the date of closing. This adjustment was settledin February 2019 for an additional cash payment to theseller of $84. The Conitex Sonoco joint venture wasformed in 1998 with Texpack, a Spanish-based globalprovider of paperboard and paper-based packaging prod-ucts. Conitex Sonoco produces uncoated recycled paper-board and tubes and cones for the global spun yarnindustry, as well as adhesives, flexible intermediate bulkcontainers and corrugated pallets. Conitex Sonoco hasapproximately 1,250 employees across 13 manufacturinglocations in 10 countries (principally in Asia), including fourpaper mills and seven cone and tube converting oper-ations and two other production facilities. Also onOctober 1, 2018, the Company acquired a rigid paperfacility in Spain (“Compositub”) from Texpack Group Hold-ings B.V. for a cash payment of $9,956. Final consid-eration was subject to a post-closing adjustment for thechange in working capital to the date of closing. Thisadjustment was settled in February 2019 for an additionalcash payment to the seller of $371.
Immediately prior to the acquisition, the fair value of theCompany’s 30 percent interest in Conitex Sonoco wasdetermined to be $52,543 with a carrying value of$57,327. As the carrying value of the investmentexceeded its acquisition-date fair value, the investmentwas written down to fair value resulting in a charge of$4,784 in “Selling, general and administrative expenses”on the Company’s Consolidated Statements of Income forthe year ended December 31, 2018. Additionally, foreigncurrency translation losses related to the Company’sinvestment in Conitex Sonoco were reclassified out ofaccumulated other comprehensive loss resulting in acharge of $897 in “Selling, general and administrativeexpenses” on the Company’s Consolidated Statements ofIncome for the year ended December 31, 2018.
The allocation of the purchase price of Conitex Sonocoand Compositub to the tangible and intangible assetsacquired and liabilities assumed was based on theCompany’s preliminary estimates of their fair value basedon information currently available. Management is continu-ing to finalize its valuation of certain assets and liabilities,including, but not limited to: property, plant and equip-ment; income taxes; other intangible assets and accruedexpenses, and will conclude its valuation no later than oneyear from the acquisition date. The provisional fair valuesof the assets acquired and liabilities assumed in con-nection with the acquisitions of Conitex Sonoco andCompositub are as follows:
Conitex Sonoco Compositub
Trade accounts receivable $ 50,937 $ 2,173Inventories 29,025 750Property, plant and equipment 97,261 3,430Goodwill 29,722 2,512Other intangible assets 21,850 2,512Trade accounts payable (23,429) (1,273)Short-term debt (7,065) —Deferred income taxes, net (11,744) —Noncontrolling interests (2,655) —Other net tangible assets /
(liabilities) (3,577) (148)
Net assets $180,325 $ 9,956
Factors comprising goodwill, $2,000 of which isexpected to be deductible for income tax purposes,include increased access to certain markets as well as thevalue of the assembled workforce. The financial results ofConitex Sonoco and Compositub are included in theCompany’s Paper and Industrial Converted Productssegment and Consumer Packaging segment, respectively.
On April 12, 2018, the Company completed the acquis-ition of Highland Packaging Solutions (“Highland”). Totalconsideration for this acquisition was $148,539, includingnet cash paid of $141,039, along with a contingent pur-chase liability of $7,500. The contingent purchase liabilityis based upon a sales metric which the Company expectsto meet and is payable in two installments. The firstinstallment of $5,000 is to be paid one year after the clos-ing date and the second installment of $2,500 is to bepaid two years after the closing date. The liability for thesetwo payments has been recognized in full on the Compa-ny’s Consolidated Balance Sheet at December 31, 2018,with the first installment included in “Accrued expensesand other” and the second in “Other Liabilities.” Highlandmanufactures thermoformed plastic packaging for freshproduce and dairy products from a single productionfacility in Plant City, Florida, providing total packaging sol-utions for customers that include sophisticated engineeredcontainers, flexographic printed labels, and inventorymanagement through distribution warehouses in theSoutheast and West Coast of the United States.
The fair values of the assets acquired and liabilitiesassumed in connection with the Highland acquisition areas follows:
Trade accounts receivable $ 6,072Inventories 27,225Property, plant and equipment 29,586Goodwill 46,787Other intangible assets 45,524Trade accounts payable (6,006)Other net tangible assets /(liabilities) (649)
Net assets $148,539
Subsequent to acquiring Highland, the Company con-tinued to finalize its valuations of certain assets andliabilities based on new information obtained about factsand circumstances that existed as of the acquisition date,including, but not limited to: property, plant and equip-ment; other intangible assets; and accrued expenses.Factors comprising goodwill, all of which is expected to bedeductible for income tax purposes, include increasedaccess to certain markets as well as the value of theassembled workforce. Highland’s financial results areincluded in the Company’s Consumer Packaging segmentand the business operates within the Company’s globalplastics division.
The Company does not believe that the results of theacquired Highland, Conitex Sonoco, or Compositub busi-nesses were material to the years presented, individuallyor in the aggregate, and are therefore not subject to thesupplemental pro-forma information required by ASC 805.Accordingly, this information is not presented herein.
The Company completed two acquisitions during 2017at a net cash cost of $383,725. On July 24, 2017, theCompany completed the acquisition of Clear Lam Pack-aging, Inc. (“Clear Lam”) for $164,951, net of cash
F-12S O N O C O 2 0 1 8 A N N U A L R E P O R TS O N O C O 2 0 1 8 A N N U A L R E P O R T I F O R M 1 0 - K
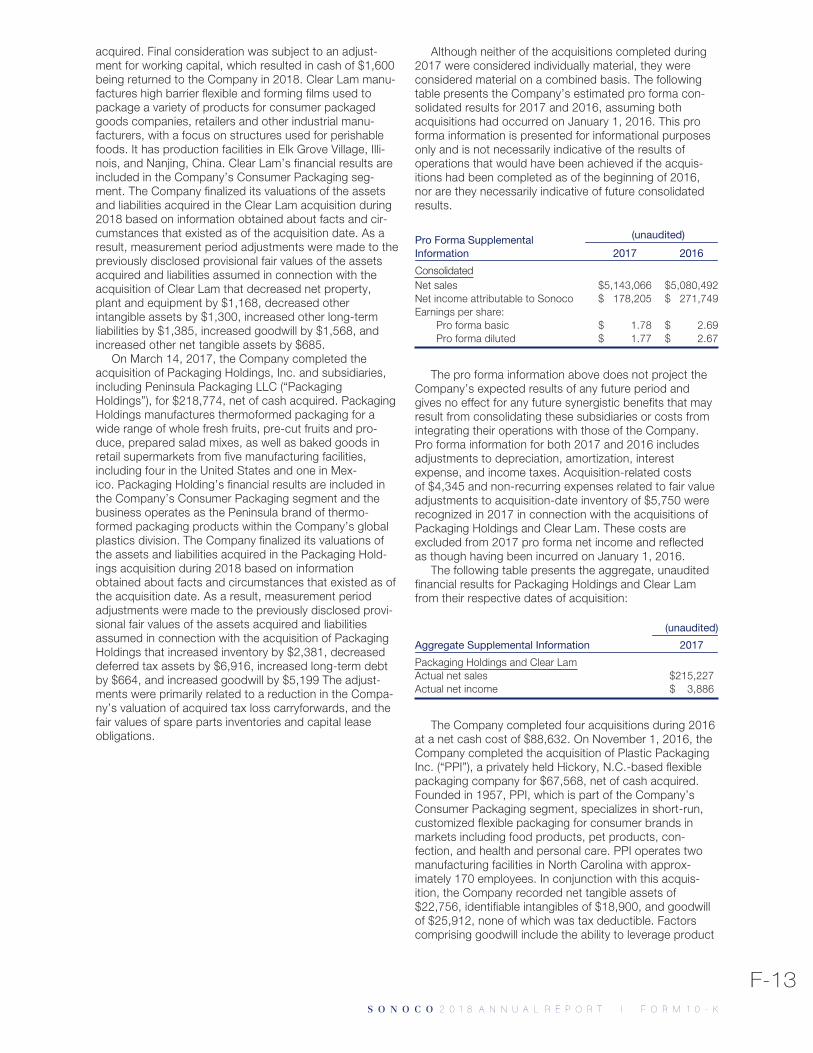
acquired. Final consideration was subject to an adjust-ment for working capital, which resulted in cash of $1,600being returned to the Company in 2018. Clear Lam manu-factures high barrier flexible and forming films used topackage a variety of products for consumer packagedgoods companies, retailers and other industrial manu-facturers, with a focus on structures used for perishablefoods. It has production facilities in Elk Grove Village, Illi-nois, and Nanjing, China. Clear Lam’s financial results areincluded in the Company’s Consumer Packaging seg-ment. The Company finalized its valuations of the assetsand liabilities acquired in the Clear Lam acquisition during2018 based on information obtained about facts and cir-cumstances that existed as of the acquisition date. As aresult, measurement period adjustments were made to thepreviously disclosed provisional fair values of the assetsacquired and liabilities assumed in connection with theacquisition of Clear Lam that decreased net property,plant and equipment by $1,168, decreased otherintangible assets by $1,300, increased other long-termliabilities by $1,385, increased goodwill by $1,568, andincreased other net tangible assets by $685.
On March 14, 2017, the Company completed theacquisition of Packaging Holdings, Inc. and subsidiaries,including Peninsula Packaging LLC (“PackagingHoldings”), for $218,774, net of cash acquired. PackagingHoldings manufactures thermoformed packaging for awide range of whole fresh fruits, pre-cut fruits and pro-duce, prepared salad mixes, as well as baked goods inretail supermarkets from five manufacturing facilities,including four in the United States and one in Mex-ico. Packaging Holding’s financial results are included inthe Company’s Consumer Packaging segment and thebusiness operates as the Peninsula brand of thermo-formed packaging products within the Company’s globalplastics division. The Company finalized its valuations ofthe assets and liabilities acquired in the Packaging Hold-ings acquisition during 2018 based on informationobtained about facts and circumstances that existed as ofthe acquisition date. As a result, measurement periodadjustments were made to the previously disclosed provi-sional fair values of the assets acquired and liabilitiesassumed in connection with the acquisition of PackagingHoldings that increased inventory by $2,381, decreaseddeferred tax assets by $6,916, increased long-term debtby $664, and increased goodwill by $5,199 The adjust-ments were primarily related to a reduction in the Compa-ny’s valuation of acquired tax loss carryforwards, and thefair values of spare parts inventories and capital leaseobligations.
Although neither of the acquisitions completed during2017 were considered individually material, they wereconsidered material on a combined basis. The followingtable presents the Company’s estimated pro forma con-solidated results for 2017 and 2016, assuming bothacquisitions had occurred on January 1, 2016. This proforma information is presented for informational purposesonly and is not necessarily indicative of the results ofoperations that would have been achieved if the acquis-itions had been completed as of the beginning of 2016,nor are they necessarily indicative of future consolidatedresults.
Pro Forma SupplementalInformation
(unaudited)
2017 2016
ConsolidatedNet sales $5,143,066 $5,080,492Net income attributable to Sonoco $ 178,205 $ 271,749Earnings per share:
Pro forma basic $ 1.78 $ 2.69Pro forma diluted $ 1.77 $ 2.67
The pro forma information above does not project theCompany’s expected results of any future period andgives no effect for any future synergistic benefits that mayresult from consolidating these subsidiaries or costs fromintegrating their operations with those of the Company.Pro forma information for both 2017 and 2016 includesadjustments to depreciation, amortization, interestexpense, and income taxes. Acquisition-related costsof $4,345 and non-recurring expenses related to fair valueadjustments to acquisition-date inventory of $5,750 wererecognized in 2017 in connection with the acquisitions ofPackaging Holdings and Clear Lam. These costs areexcluded from 2017 pro forma net income and reflectedas though having been incurred on January 1, 2016.
The following table presents the aggregate, unauditedfinancial results for Packaging Holdings and Clear Lamfrom their respective dates of acquisition:
Aggregate Supplemental Information
(unaudited)
2017
Packaging Holdings and Clear LamActual net sales $215,227Actual net income $ 3,886
The Company completed four acquisitions during 2016at a net cash cost of $88,632. On November 1, 2016, theCompany completed the acquisition of Plastic PackagingInc. (“PPI”), a privately held Hickory, N.C.-based flexiblepackaging company for $67,568, net of cash acquired.Founded in 1957, PPI, which is part of the Company’sConsumer Packaging segment, specializes in short-run,customized flexible packaging for consumer brands inmarkets including food products, pet products, con-fection, and health and personal care. PPI operates twomanufacturing facilities in North Carolina with approx-imately 170 employees. In conjunction with this acquis-ition, the Company recorded net tangible assets of$22,756, identifiable intangibles of $18,900, and goodwillof $25,912, none of which was tax deductible. Factorscomprising goodwill include the ability to leverage product
F-13S O N O C O 2 0 1 8 A N N U A L R E P O R TS O N O C O 2 0 1 8 A N N U A L R E P O R T I F O R M 1 0 - K
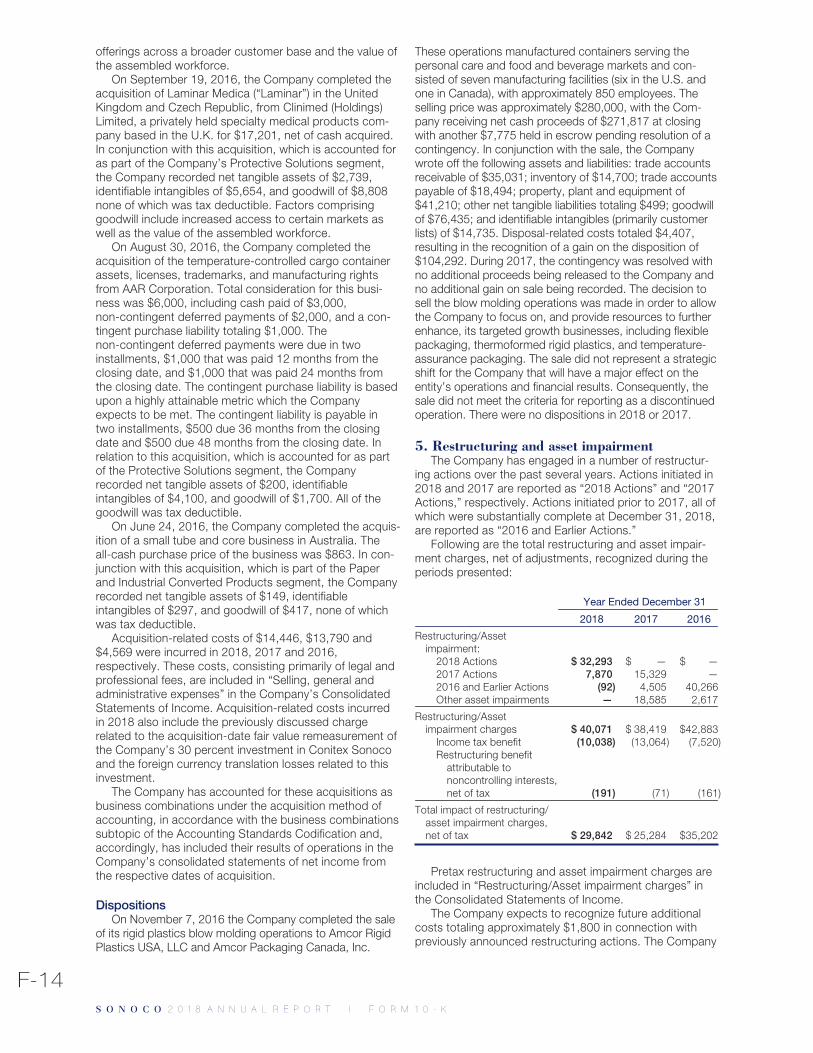
offerings across a broader customer base and the value ofthe assembled workforce.
On September 19, 2016, the Company completed theacquisition of Laminar Medica (“Laminar”) in the UnitedKingdom and Czech Republic, from Clinimed (Holdings)Limited, a privately held specialty medical products com-pany based in the U.K. for $17,201, net of cash acquired.In conjunction with this acquisition, which is accounted foras part of the Company’s Protective Solutions segment,the Company recorded net tangible assets of $2,739,identifiable intangibles of $5,654, and goodwill of $8,808none of which was tax deductible. Factors comprisinggoodwill include increased access to certain markets aswell as the value of the assembled workforce.
On August 30, 2016, the Company completed theacquisition of the temperature-controlled cargo containerassets, licenses, trademarks, and manufacturing rightsfrom AAR Corporation. Total consideration for this busi-ness was $6,000, including cash paid of $3,000,non-contingent deferred payments of $2,000, and a con-tingent purchase liability totaling $1,000. Thenon-contingent deferred payments were due in twoinstallments, $1,000 that was paid 12 months from theclosing date, and $1,000 that was paid 24 months fromthe closing date. The contingent purchase liability is basedupon a highly attainable metric which the Companyexpects to be met. The contingent liability is payable intwo installments, $500 due 36 months from the closingdate and $500 due 48 months from the closing date. Inrelation to this acquisition, which is accounted for as partof the Protective Solutions segment, the Companyrecorded net tangible assets of $200, identifiableintangibles of $4,100, and goodwill of $1,700. All of thegoodwill was tax deductible.
On June 24, 2016, the Company completed the acquis-ition of a small tube and core business in Australia. Theall-cash purchase price of the business was $863. In con-junction with this acquisition, which is part of the Paperand Industrial Converted Products segment, the Companyrecorded net tangible assets of $149, identifiableintangibles of $297, and goodwill of $417, none of whichwas tax deductible.
Acquisition-related costs of $14,446, $13,790 and$4,569 were incurred in 2018, 2017 and 2016,respectively. These costs, consisting primarily of legal andprofessional fees, are included in “Selling, general andadministrative expenses” in the Company’s ConsolidatedStatements of Income. Acquisition-related costs incurredin 2018 also include the previously discussed chargerelated to the acquisition-date fair value remeasurement ofthe Company’s 30 percent investment in Conitex Sonocoand the foreign currency translation losses related to thisinvestment.
The Company has accounted for these acquisitions asbusiness combinations under the acquisition method ofaccounting, in accordance with the business combinationssubtopic of the Accounting Standards Codification and,accordingly, has included their results of operations in theCompany’s consolidated statements of net income fromthe respective dates of acquisition.
DispositionsOn November 7, 2016 the Company completed the sale
of its rigid plastics blow molding operations to Amcor RigidPlastics USA, LLC and Amcor Packaging Canada, Inc.
These operations manufactured containers serving thepersonal care and food and beverage markets and con-sisted of seven manufacturing facilities (six in the U.S. andone in Canada), with approximately 850 employees. Theselling price was approximately $280,000, with the Com-pany receiving net cash proceeds of $271,817 at closingwith another $7,775 held in escrow pending resolution of acontingency. In conjunction with the sale, the Companywrote off the following assets and liabilities: trade accountsreceivable of $35,031; inventory of $14,700; trade accountspayable of $18,494; property, plant and equipment of$41,210; other net tangible liabilities totaling $499; goodwillof $76,435; and identifiable intangibles (primarily customerlists) of $14,735. Disposal-related costs totaled $4,407,resulting in the recognition of a gain on the disposition of$104,292. During 2017, the contingency was resolved withno additional proceeds being released to the Company andno additional gain on sale being recorded. The decision tosell the blow molding operations was made in order to allowthe Company to focus on, and provide resources to furtherenhance, its targeted growth businesses, including flexiblepackaging, thermoformed rigid plastics, and temperature-assurance packaging. The sale did not represent a strategicshift for the Company that will have a major effect on theentity’s operations and financial results. Consequently, thesale did not meet the criteria for reporting as a discontinuedoperation. There were no dispositions in 2018 or 2017.
5. Restructuring and asset impairmentThe Company has engaged in a number of restructur-
ing actions over the past several years. Actions initiated in2018 and 2017 are reported as “2018 Actions” and “2017Actions,” respectively. Actions initiated prior to 2017, all ofwhich were substantially complete at December 31, 2018,are reported as “2016 and Earlier Actions.”
Following are the total restructuring and asset impair-ment charges, net of adjustments, recognized during theperiods presented:
Year Ended December 31
2018 2017 2016
Restructuring/Assetimpairment:
2018 Actions $ 32,293 $ — $ —2017 Actions 7,870 15,329 —2016 and Earlier Actions (92) 4,505 40,266Other asset impairments — 18,585 2,617
Restructuring/Assetimpairment charges $ 40,071 $ 38,419 $42,883
Income tax benefit (10,038) (13,064) (7,520)Restructuring benefit
attributable tononcontrolling interests,net of tax (191) (71) (161)
Total impact of restructuring/asset impairment charges,net of tax $ 29,842 $ 25,284 $35,202
Pretax restructuring and asset impairment charges areincluded in “Restructuring/Asset impairment charges” inthe Consolidated Statements of Income.
The Company expects to recognize future additionalcosts totaling approximately $1,800 in connection withpreviously announced restructuring actions. The Company
F-14S O N O C O 2 0 1 8 A N N U A L R E P O R TS O N O C O 2 0 1 8 A N N U A L R E P O R T I F O R M 1 0 - K
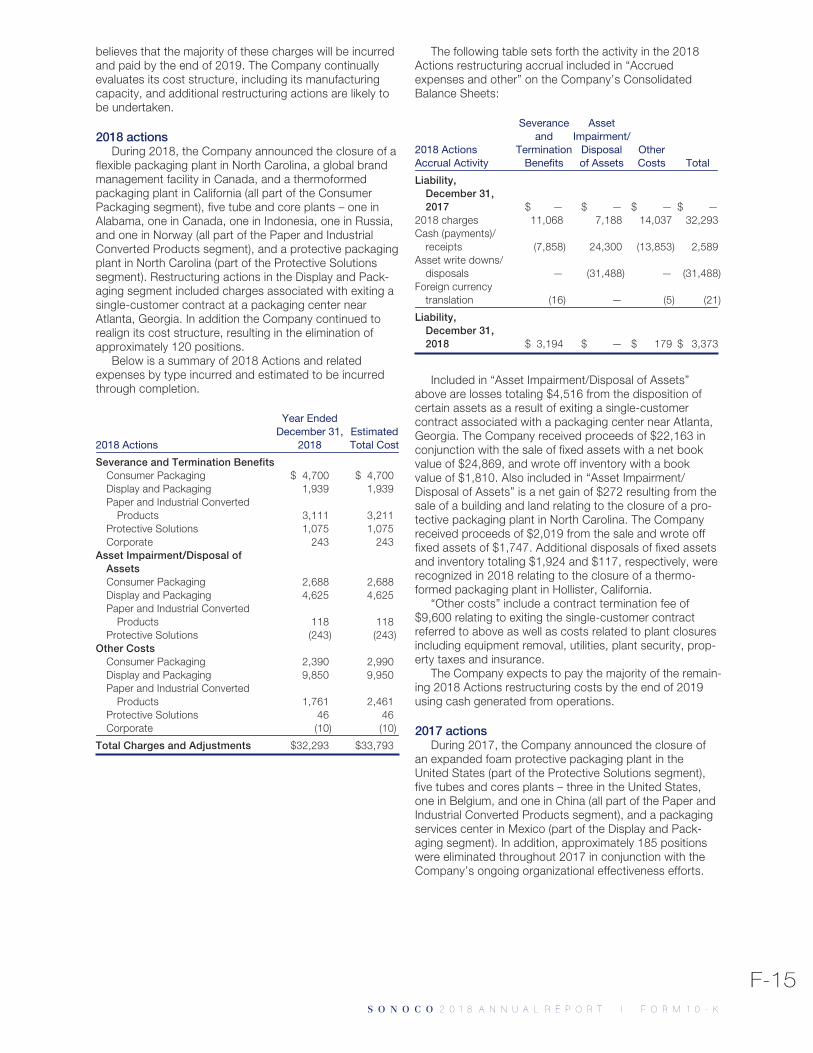
believes that the majority of these charges will be incurredand paid by the end of 2019. The Company continuallyevaluates its cost structure, including its manufacturingcapacity, and additional restructuring actions are likely tobe undertaken.
2018 actionsDuring 2018, the Company announced the closure of a
flexible packaging plant in North Carolina, a global brandmanagement facility in Canada, and a thermoformedpackaging plant in California (all part of the ConsumerPackaging segment), five tube and core plants – one inAlabama, one in Canada, one in Indonesia, one in Russia,and one in Norway (all part of the Paper and IndustrialConverted Products segment), and a protective packagingplant in North Carolina (part of the Protective Solutionssegment). Restructuring actions in the Display and Pack-aging segment included charges associated with exiting asingle-customer contract at a packaging center nearAtlanta, Georgia. In addition the Company continued torealign its cost structure, resulting in the elimination ofapproximately 120 positions.
Below is a summary of 2018 Actions and relatedexpenses by type incurred and estimated to be incurredthrough completion.
2018 Actions
Year EndedDecember 31,
2018EstimatedTotal Cost
Severance and Termination BenefitsConsumer Packaging $ 4,700 $ 4,700Display and Packaging 1,939 1,939Paper and Industrial Converted
Products 3,111 3,211Protective Solutions 1,075 1,075Corporate 243 243
Asset Impairment/Disposal ofAssetsConsumer Packaging 2,688 2,688Display and Packaging 4,625 4,625Paper and Industrial Converted
Products 118 118Protective Solutions (243) (243)
Other CostsConsumer Packaging 2,390 2,990Display and Packaging 9,850 9,950Paper and Industrial Converted
Products 1,761 2,461Protective Solutions 46 46Corporate (10) (10)
Total Charges and Adjustments $32,293 $33,793
The following table sets forth the activity in the 2018Actions restructuring accrual included in “Accruedexpenses and other” on the Company’s ConsolidatedBalance Sheets:
2018 ActionsAccrual Activity
Severanceand
TerminationBenefits
AssetImpairment/
Disposalof Assets
OtherCosts Total
Liability,December 31,2017 $ — $ — $ — $ —
2018 charges 11,068 7,188 14,037 32,293Cash (payments)/
receipts (7,858) 24,300 (13,853) 2,589Asset write downs/
disposals — (31,488) — (31,488)Foreign currency
translation (16) — (5) (21)
Liability,December 31,2018 $ 3,194 $ — $ 179 $ 3,373
Included in “Asset Impairment/Disposal of Assets”above are losses totaling $4,516 from the disposition ofcertain assets as a result of exiting a single-customercontract associated with a packaging center near Atlanta,Georgia. The Company received proceeds of $22,163 inconjunction with the sale of fixed assets with a net bookvalue of $24,869, and wrote off inventory with a bookvalue of $1,810. Also included in “Asset Impairment/Disposal of Assets” is a net gain of $272 resulting from thesale of a building and land relating to the closure of a pro-tective packaging plant in North Carolina. The Companyreceived proceeds of $2,019 from the sale and wrote offfixed assets of $1,747. Additional disposals of fixed assetsand inventory totaling $1,924 and $117, respectively, wererecognized in 2018 relating to the closure of a thermo-formed packaging plant in Hollister, California.
“Other costs” include a contract termination fee of$9,600 relating to exiting the single-customer contractreferred to above as well as costs related to plant closuresincluding equipment removal, utilities, plant security, prop-erty taxes and insurance.
The Company expects to pay the majority of the remain-ing 2018 Actions restructuring costs by the end of 2019using cash generated from operations.
2017 actionsDuring 2017, the Company announced the closure of
an expanded foam protective packaging plant in theUnited States (part of the Protective Solutions segment),five tubes and cores plants – three in the United States,one in Belgium, and one in China (all part of the Paper andIndustrial Converted Products segment), and a packagingservices center in Mexico (part of the Display and Pack-aging segment). In addition, approximately 185 positionswere eliminated throughout 2017 in conjunction with theCompany’s ongoing organizational effectiveness efforts.
F-15S O N O C O 2 0 1 8 A N N U A L R E P O R TS O N O C O 2 0 1 8 A N N U A L R E P O R T I F O R M 1 0 - K
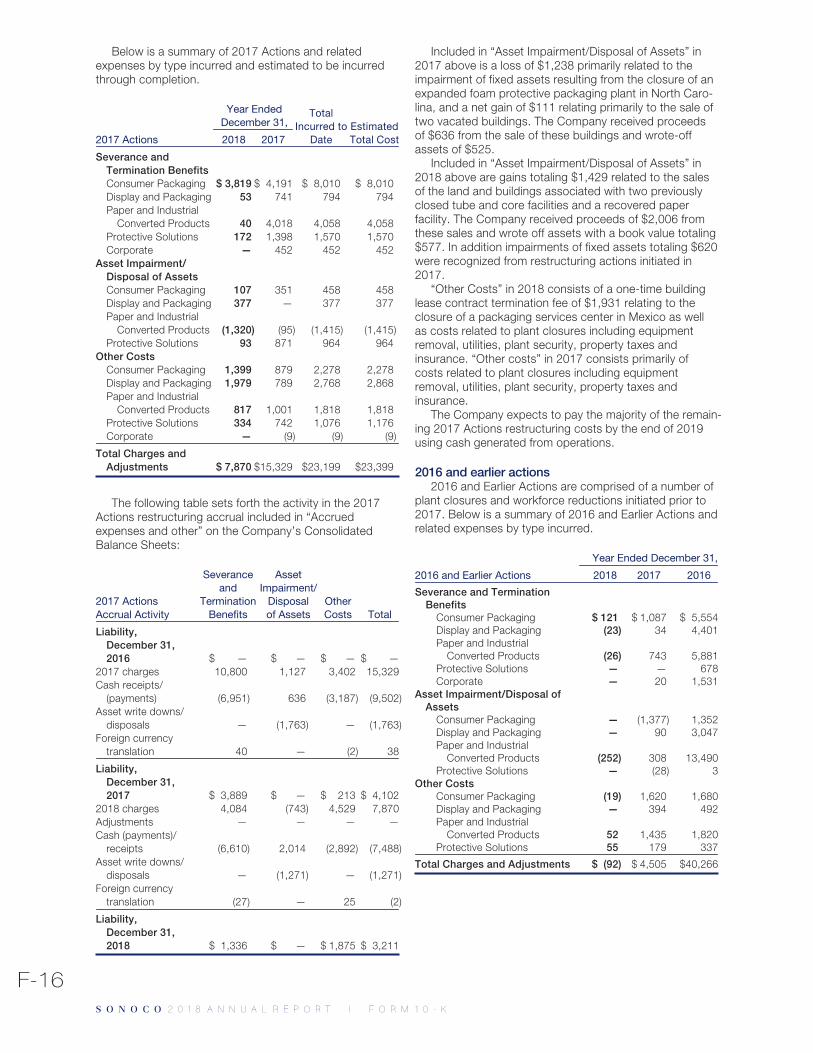
Below is a summary of 2017 Actions and relatedexpenses by type incurred and estimated to be incurredthrough completion.
Year EndedDecember 31,
TotalIncurred to
DateEstimatedTotal Cost2017 Actions 2018 2017
Severance andTermination BenefitsConsumer Packaging $ 3,819 $ 4,191 $ 8,010 $ 8,010Display and Packaging 53 741 794 794Paper and Industrial
Converted Products 40 4,018 4,058 4,058Protective Solutions 172 1,398 1,570 1,570Corporate — 452 452 452
Asset Impairment/Disposal of AssetsConsumer Packaging 107 351 458 458Display and Packaging 377 — 377 377Paper and Industrial
Converted Products (1,320) (95) (1,415) (1,415)Protective Solutions 93 871 964 964
Other CostsConsumer Packaging 1,399 879 2,278 2,278Display and Packaging 1,979 789 2,768 2,868Paper and Industrial
Converted Products 817 1,001 1,818 1,818Protective Solutions 334 742 1,076 1,176Corporate — (9) (9) (9)
Total Charges andAdjustments $ 7,870 $15,329 $23,199 $23,399
The following table sets forth the activity in the 2017Actions restructuring accrual included in “Accruedexpenses and other” on the Company’s ConsolidatedBalance Sheets:
2017 ActionsAccrual Activity
Severanceand
TerminationBenefits
AssetImpairment/
Disposalof Assets
OtherCosts Total
Liability,December 31,2016 $ — $ — $ — $ —
2017 charges 10,800 1,127 3,402 15,329Cash receipts/
(payments) (6,951) 636 (3,187) (9,502)Asset write downs/
disposals — (1,763) — (1,763)Foreign currency
translation 40 — (2) 38
Liability,December 31,2017 $ 3,889 $ — $ 213 $ 4,102
2018 charges 4,084 (743) 4,529 7,870Adjustments — — — —Cash (payments)/
receipts (6,610) 2,014 (2,892) (7,488)Asset write downs/
disposals — (1,271) — (1,271)Foreign currency
translation (27) — 25 (2)
Liability,December 31,2018 $ 1,336 $ — $ 1,875 $ 3,211
Included in “Asset Impairment/Disposal of Assets” in2017 above is a loss of $1,238 primarily related to theimpairment of fixed assets resulting from the closure of anexpanded foam protective packaging plant in North Caro-lina, and a net gain of $111 relating primarily to the sale oftwo vacated buildings. The Company received proceedsof $636 from the sale of these buildings and wrote-offassets of $525.
Included in “Asset Impairment/Disposal of Assets” in2018 above are gains totaling $1,429 related to the salesof the land and buildings associated with two previouslyclosed tube and core facilities and a recovered paperfacility. The Company received proceeds of $2,006 fromthese sales and wrote off assets with a book value totaling$577. In addition impairments of fixed assets totaling $620were recognized from restructuring actions initiated in2017.
“Other Costs” in 2018 consists of a one-time buildinglease contract termination fee of $1,931 relating to theclosure of a packaging services center in Mexico as wellas costs related to plant closures including equipmentremoval, utilities, plant security, property taxes andinsurance. “Other costs” in 2017 consists primarily ofcosts related to plant closures including equipmentremoval, utilities, plant security, property taxes andinsurance.
The Company expects to pay the majority of the remain-ing 2017 Actions restructuring costs by the end of 2019using cash generated from operations.
2016 and earlier actions2016 and Earlier Actions are comprised of a number of
plant closures and workforce reductions initiated prior to2017. Below is a summary of 2016 and Earlier Actions andrelated expenses by type incurred.
Year Ended December 31,
2016 and Earlier Actions 2018 2017 2016
Severance and TerminationBenefits
Consumer Packaging $ 121 $ 1,087 $ 5,554Display and Packaging (23) 34 4,401Paper and Industrial
Converted Products (26) 743 5,881Protective Solutions — — 678Corporate — 20 1,531
Asset Impairment/Disposal ofAssets
Consumer Packaging — (1,377) 1,352Display and Packaging — 90 3,047Paper and Industrial
Converted Products (252) 308 13,490Protective Solutions — (28) 3
Other CostsConsumer Packaging (19) 1,620 1,680Display and Packaging — 394 492Paper and Industrial
Converted Products 52 1,435 1,820Protective Solutions 55 179 337
Total Charges and Adjustments $ (92) $ 4,505 $40,266
F-16S O N O C O 2 0 1 8 A N N U A L R E P O R TS O N O C O 2 0 1 8 A N N U A L R E P O R T I F O R M 1 0 - K
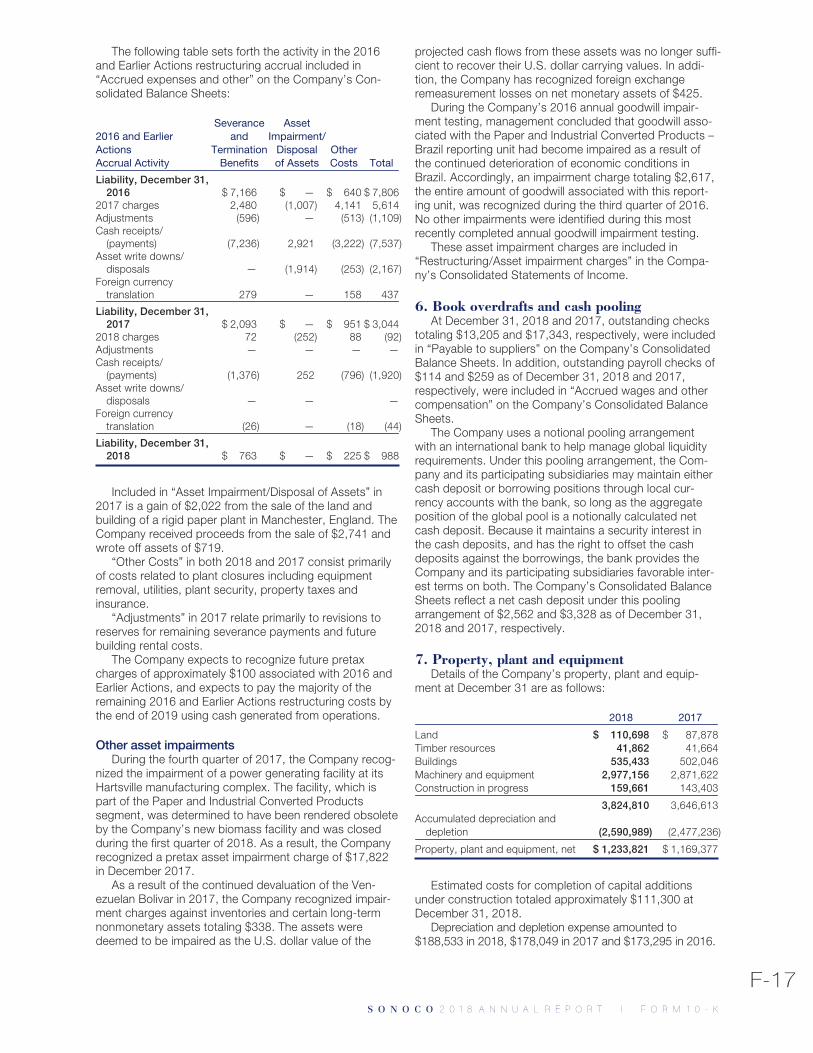
The following table sets forth the activity in the 2016and Earlier Actions restructuring accrual included in“Accrued expenses and other” on the Company’s Con-solidated Balance Sheets:
2016 and EarlierActionsAccrual Activity
Severanceand
TerminationBenefits
AssetImpairment/
Disposalof Assets
OtherCosts Total
Liability, December 31,2016 $ 7,166 $ — $ 640 $ 7,806
2017 charges 2,480 (1,007) 4,141 5,614Adjustments (596) — (513) (1,109)Cash receipts/
(payments) (7,236) 2,921 (3,222) (7,537)Asset write downs/
disposals — (1,914) (253) (2,167)Foreign currency
translation 279 — 158 437
Liability, December 31,2017 $ 2,093 $ — $ 951 $ 3,044
2018 charges 72 (252) 88 (92)Adjustments — — — —Cash receipts/
(payments) (1,376) 252 (796) (1,920)Asset write downs/
disposals — — —Foreign currency
translation (26) — (18) (44)
Liability, December 31,2018 $ 763 $ — $ 225 $ 988
Included in “Asset Impairment/Disposal of Assets” in2017 is a gain of $2,022 from the sale of the land andbuilding of a rigid paper plant in Manchester, England. TheCompany received proceeds from the sale of $2,741 andwrote off assets of $719.
“Other Costs” in both 2018 and 2017 consist primarilyof costs related to plant closures including equipmentremoval, utilities, plant security, property taxes andinsurance.
“Adjustments” in 2017 relate primarily to revisions toreserves for remaining severance payments and futurebuilding rental costs.
The Company expects to recognize future pretaxcharges of approximately $100 associated with 2016 andEarlier Actions, and expects to pay the majority of theremaining 2016 and Earlier Actions restructuring costs bythe end of 2019 using cash generated from operations.
Other asset impairmentsDuring the fourth quarter of 2017, the Company recog-
nized the impairment of a power generating facility at itsHartsville manufacturing complex. The facility, which ispart of the Paper and Industrial Converted Productssegment, was determined to have been rendered obsoleteby the Company’s new biomass facility and was closedduring the first quarter of 2018. As a result, the Companyrecognized a pretax asset impairment charge of $17,822in December 2017.
As a result of the continued devaluation of the Ven-ezuelan Bolivar in 2017, the Company recognized impair-ment charges against inventories and certain long-termnonmonetary assets totaling $338. The assets weredeemed to be impaired as the U.S. dollar value of the
projected cash flows from these assets was no longer suffi-cient to recover their U.S. dollar carrying values. In addi-tion, the Company has recognized foreign exchangeremeasurement losses on net monetary assets of $425.
During the Company’s 2016 annual goodwill impair-ment testing, management concluded that goodwill asso-ciated with the Paper and Industrial Converted Products –Brazil reporting unit had become impaired as a result ofthe continued deterioration of economic conditions inBrazil. Accordingly, an impairment charge totaling $2,617,the entire amount of goodwill associated with this report-ing unit, was recognized during the third quarter of 2016.No other impairments were identified during this mostrecently completed annual goodwill impairment testing.
These asset impairment charges are included in“Restructuring/Asset impairment charges” in the Compa-ny’s Consolidated Statements of Income.
6. Book overdrafts and cash poolingAt December 31, 2018 and 2017, outstanding checks
totaling $13,205 and $17,343, respectively, were includedin “Payable to suppliers” on the Company’s ConsolidatedBalance Sheets. In addition, outstanding payroll checks of$114 and $259 as of December 31, 2018 and 2017,respectively, were included in “Accrued wages and othercompensation” on the Company’s Consolidated BalanceSheets.
The Company uses a notional pooling arrangementwith an international bank to help manage global liquidityrequirements. Under this pooling arrangement, the Com-pany and its participating subsidiaries may maintain eithercash deposit or borrowing positions through local cur-rency accounts with the bank, so long as the aggregateposition of the global pool is a notionally calculated netcash deposit. Because it maintains a security interest inthe cash deposits, and has the right to offset the cashdeposits against the borrowings, the bank provides theCompany and its participating subsidiaries favorable inter-est terms on both. The Company’s Consolidated BalanceSheets reflect a net cash deposit under this poolingarrangement of $2,562 and $3,328 as of December 31,2018 and 2017, respectively.
7. Property, plant and equipmentDetails of the Company’s property, plant and equip-
ment at December 31 are as follows:
2018 2017
Land $ 110,698 $ 87,878Timber resources 41,862 41,664Buildings 535,433 502,046Machinery and equipment 2,977,156 2,871,622Construction in progress 159,661 143,403
3,824,810 3,646,613Accumulated depreciation and
depletion (2,590,989) (2,477,236)
Property, plant and equipment, net $ 1,233,821 $ 1,169,377
Estimated costs for completion of capital additionsunder construction totaled approximately $111,300 atDecember 31, 2018.
Depreciation and depletion expense amounted to$188,533 in 2018, $178,049 in 2017 and $173,295 in 2016.
F-17S O N O C O 2 0 1 8 A N N U A L R E P O R TS O N O C O 2 0 1 8 A N N U A L R E P O R T I F O R M 1 0 - K
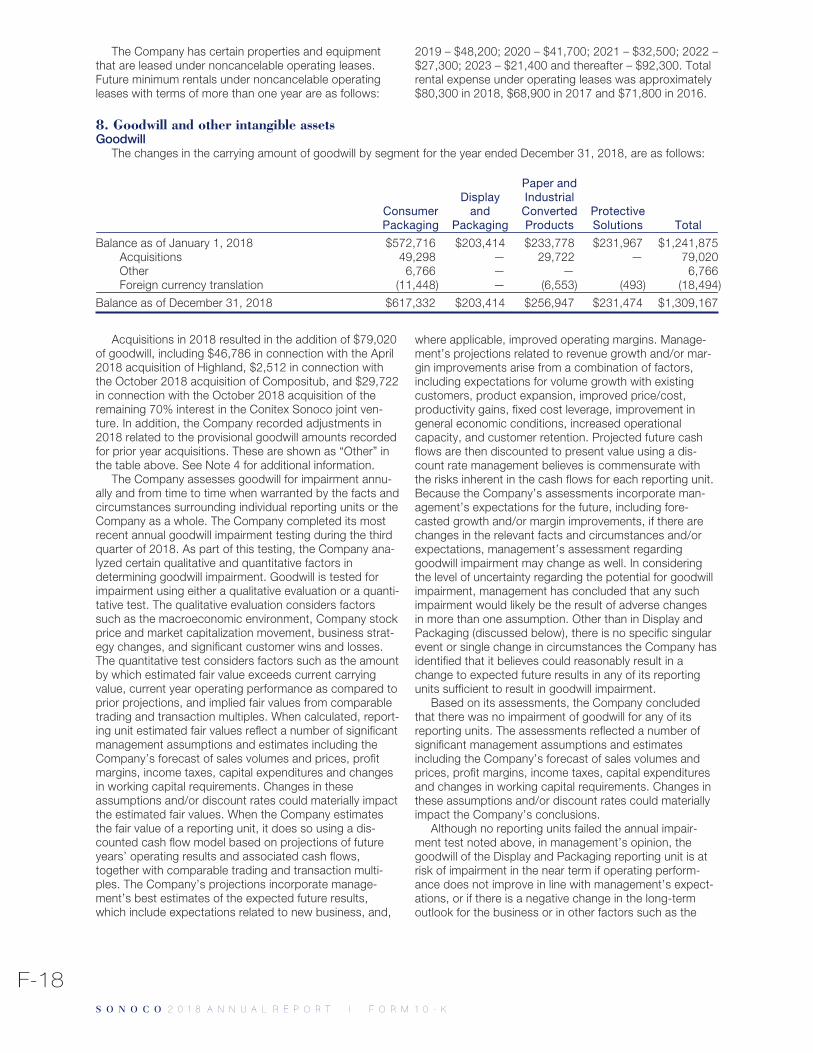
The Company has certain properties and equipmentthat are leased under noncancelable operating leases.Future minimum rentals under noncancelable operatingleases with terms of more than one year are as follows:
2019 – $48,200; 2020 – $41,700; 2021 – $32,500; 2022 –$27,300; 2023 – $21,400 and thereafter – $92,300. Totalrental expense under operating leases was approximately$80,300 in 2018, $68,900 in 2017 and $71,800 in 2016.
8. Goodwill and other intangible assetsGoodwill
The changes in the carrying amount of goodwill by segment for the year ended December 31, 2018, are as follows:
ConsumerPackaging
Displayand
Packaging
Paper andIndustrialConvertedProducts
ProtectiveSolutions Total
Balance as of January 1, 2018 $572,716 $203,414 $233,778 $231,967 $1,241,875Acquisitions 49,298 — 29,722 — 79,020Other 6,766 — — 6,766Foreign currency translation (11,448) — (6,553) (493) (18,494)
Balance as of December 31, 2018 $617,332 $203,414 $256,947 $231,474 $1,309,167
Acquisitions in 2018 resulted in the addition of $79,020of goodwill, including $46,786 in connection with the April2018 acquisition of Highland, $2,512 in connection withthe October 2018 acquisition of Compositub, and $29,722in connection with the October 2018 acquisition of theremaining 70% interest in the Conitex Sonoco joint ven-ture. In addition, the Company recorded adjustments in2018 related to the provisional goodwill amounts recordedfor prior year acquisitions. These are shown as “Other” inthe table above. See Note 4 for additional information.
The Company assesses goodwill for impairment annu-ally and from time to time when warranted by the facts andcircumstances surrounding individual reporting units or theCompany as a whole. The Company completed its mostrecent annual goodwill impairment testing during the thirdquarter of 2018. As part of this testing, the Company ana-lyzed certain qualitative and quantitative factors indetermining goodwill impairment. Goodwill is tested forimpairment using either a qualitative evaluation or a quanti-tative test. The qualitative evaluation considers factorssuch as the macroeconomic environment, Company stockprice and market capitalization movement, business strat-egy changes, and significant customer wins and losses.The quantitative test considers factors such as the amountby which estimated fair value exceeds current carryingvalue, current year operating performance as compared toprior projections, and implied fair values from comparabletrading and transaction multiples. When calculated, report-ing unit estimated fair values reflect a number of significantmanagement assumptions and estimates including theCompany’s forecast of sales volumes and prices, profitmargins, income taxes, capital expenditures and changesin working capital requirements. Changes in theseassumptions and/or discount rates could materially impactthe estimated fair values. When the Company estimatesthe fair value of a reporting unit, it does so using a dis-counted cash flow model based on projections of futureyears’ operating results and associated cash flows,together with comparable trading and transaction multi-ples. The Company’s projections incorporate manage-ment’s best estimates of the expected future results,which include expectations related to new business, and,
where applicable, improved operating margins. Manage-ment’s projections related to revenue growth and/or mar-gin improvements arise from a combination of factors,including expectations for volume growth with existingcustomers, product expansion, improved price/cost,productivity gains, fixed cost leverage, improvement ingeneral economic conditions, increased operationalcapacity, and customer retention. Projected future cashflows are then discounted to present value using a dis-count rate management believes is commensurate withthe risks inherent in the cash flows for each reporting unit.Because the Company’s assessments incorporate man-agement’s expectations for the future, including fore-casted growth and/or margin improvements, if there arechanges in the relevant facts and circumstances and/orexpectations, management’s assessment regardinggoodwill impairment may change as well. In consideringthe level of uncertainty regarding the potential for goodwillimpairment, management has concluded that any suchimpairment would likely be the result of adverse changesin more than one assumption. Other than in Display andPackaging (discussed below), there is no specific singularevent or single change in circumstances the Company hasidentified that it believes could reasonably result in achange to expected future results in any of its reportingunits sufficient to result in goodwill impairment.
Based on its assessments, the Company concludedthat there was no impairment of goodwill for any of itsreporting units. The assessments reflected a number ofsignificant management assumptions and estimatesincluding the Company’s forecast of sales volumes andprices, profit margins, income taxes, capital expendituresand changes in working capital requirements. Changes inthese assumptions and/or discount rates could materiallyimpact the Company’s conclusions.
Although no reporting units failed the annual impair-ment test noted above, in management’s opinion, thegoodwill of the Display and Packaging reporting unit is atrisk of impairment in the near term if operating perform-ance does not improve in line with management’s expect-ations, or if there is a negative change in the long-termoutlook for the business or in other factors such as the
F-18S O N O C O 2 0 1 8 A N N U A L R E P O R TS O N O C O 2 0 1 8 A N N U A L R E P O R T I F O R M 1 0 - K
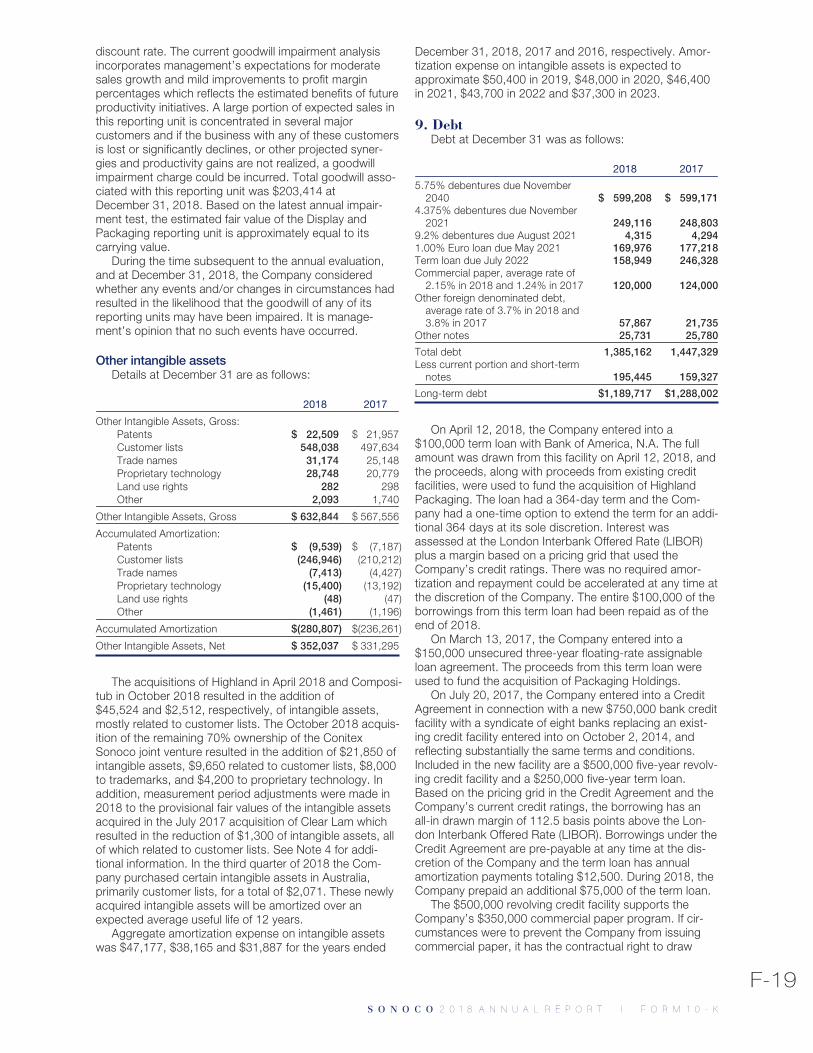
discount rate. The current goodwill impairment analysisincorporates management’s expectations for moderatesales growth and mild improvements to profit marginpercentages which reflects the estimated benefits of futureproductivity initiatives. A large portion of expected sales inthis reporting unit is concentrated in several majorcustomers and if the business with any of these customersis lost or significantly declines, or other projected syner-gies and productivity gains are not realized, a goodwillimpairment charge could be incurred. Total goodwill asso-ciated with this reporting unit was $203,414 atDecember 31, 2018. Based on the latest annual impair-ment test, the estimated fair value of the Display andPackaging reporting unit is approximately equal to itscarrying value.
During the time subsequent to the annual evaluation,and at December 31, 2018, the Company consideredwhether any events and/or changes in circumstances hadresulted in the likelihood that the goodwill of any of itsreporting units may have been impaired. It is manage-ment’s opinion that no such events have occurred.
Other intangible assetsDetails at December 31 are as follows:
2018 2017
Other Intangible Assets, Gross:Patents $ 22,509 $ 21,957Customer lists 548,038 497,634Trade names 31,174 25,148Proprietary technology 28,748 20,779Land use rights 282 298Other 2,093 1,740
Other Intangible Assets, Gross $ 632,844 $ 567,556
Accumulated Amortization:Patents $ (9,539) $ (7,187)Customer lists (246,946) (210,212)Trade names (7,413) (4,427)Proprietary technology (15,400) (13,192)Land use rights (48) (47)Other (1,461) (1,196)
Accumulated Amortization $(280,807) $(236,261)
Other Intangible Assets, Net $ 352,037 $ 331,295
The acquisitions of Highland in April 2018 and Composi-tub in October 2018 resulted in the addition of$45,524 and $2,512, respectively, of intangible assets,mostly related to customer lists. The October 2018 acquis-ition of the remaining 70% ownership of the ConitexSonoco joint venture resulted in the addition of $21,850 ofintangible assets, $9,650 related to customer lists, $8,000to trademarks, and $4,200 to proprietary technology. Inaddition, measurement period adjustments were made in2018 to the provisional fair values of the intangible assetsacquired in the July 2017 acquisition of Clear Lam whichresulted in the reduction of $1,300 of intangible assets, allof which related to customer lists. See Note 4 for addi-tional information. In the third quarter of 2018 the Com-pany purchased certain intangible assets in Australia,primarily customer lists, for a total of $2,071. These newlyacquired intangible assets will be amortized over anexpected average useful life of 12 years.
Aggregate amortization expense on intangible assetswas $47,177, $38,165 and $31,887 for the years ended
December 31, 2018, 2017 and 2016, respectively. Amor-tization expense on intangible assets is expected toapproximate $50,400 in 2019, $48,000 in 2020, $46,400in 2021, $43,700 in 2022 and $37,300 in 2023.
9. DebtDebt at December 31 was as follows:
2018 2017
5.75% debentures due November2040 $ 599,208 $ 599,171
4.375% debentures due November2021 249,116 248,803
9.2% debentures due August 2021 4,315 4,2941.00% Euro loan due May 2021 169,976 177,218Term loan due July 2022 158,949 246,328Commercial paper, average rate of
2.15% in 2018 and 1.24% in 2017 120,000 124,000Other foreign denominated debt,
average rate of 3.7% in 2018 and3.8% in 2017 57,867 21,735
Other notes 25,731 25,780
Total debt 1,385,162 1,447,329Less current portion and short-term
notes 195,445 159,327
Long-term debt $1,189,717 $1,288,002
On April 12, 2018, the Company entered into a$100,000 term loan with Bank of America, N.A. The fullamount was drawn from this facility on April 12, 2018, andthe proceeds, along with proceeds from existing creditfacilities, were used to fund the acquisition of HighlandPackaging. The loan had a 364-day term and the Com-pany had a one-time option to extend the term for an addi-tional 364 days at its sole discretion. Interest wasassessed at the London Interbank Offered Rate (LIBOR)plus a margin based on a pricing grid that used theCompany’s credit ratings. There was no required amor-tization and repayment could be accelerated at any time atthe discretion of the Company. The entire $100,000 of theborrowings from this term loan had been repaid as of theend of 2018.
On March 13, 2017, the Company entered into a$150,000 unsecured three-year floating-rate assignableloan agreement. The proceeds from this term loan wereused to fund the acquisition of Packaging Holdings.
On July 20, 2017, the Company entered into a CreditAgreement in connection with a new $750,000 bank creditfacility with a syndicate of eight banks replacing an exist-ing credit facility entered into on October 2, 2014, andreflecting substantially the same terms and conditions.Included in the new facility are a $500,000 five-year revolv-ing credit facility and a $250,000 five-year term loan.Based on the pricing grid in the Credit Agreement and theCompany’s current credit ratings, the borrowing has anall-in drawn margin of 112.5 basis points above the Lon-don Interbank Offered Rate (LIBOR). Borrowings under theCredit Agreement are pre-payable at any time at the dis-cretion of the Company and the term loan has annualamortization payments totaling $12,500. During 2018, theCompany prepaid an additional $75,000 of the term loan.
The $500,000 revolving credit facility supports theCompany’s $350,000 commercial paper program. If cir-cumstances were to prevent the Company from issuingcommercial paper, it has the contractual right to draw
F-19S O N O C O 2 0 1 8 A N N U A L R E P O R TS O N O C O 2 0 1 8 A N N U A L R E P O R T I F O R M 1 0 - K
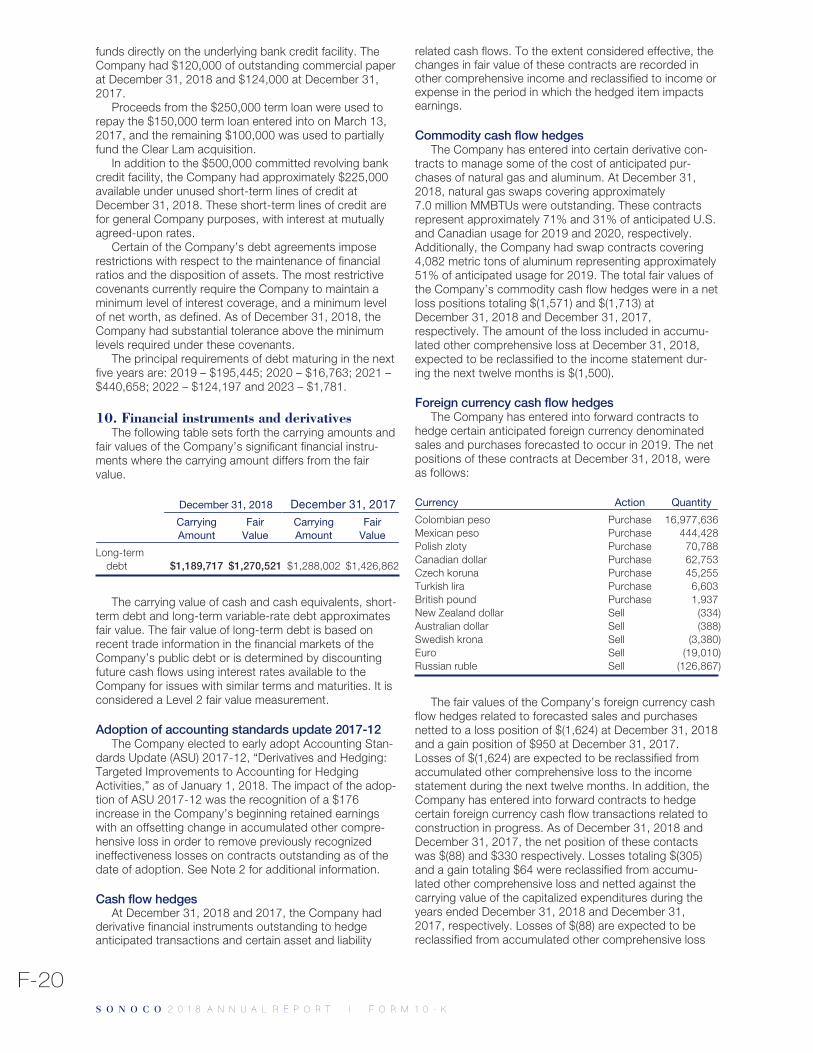
funds directly on the underlying bank credit facility. TheCompany had $120,000 of outstanding commercial paperat December 31, 2018 and $124,000 at December 31,2017.
Proceeds from the $250,000 term loan were used torepay the $150,000 term loan entered into on March 13,2017, and the remaining $100,000 was used to partiallyfund the Clear Lam acquisition.
In addition to the $500,000 committed revolving bankcredit facility, the Company had approximately $225,000available under unused short-term lines of credit atDecember 31, 2018. These short-term lines of credit arefor general Company purposes, with interest at mutuallyagreed-upon rates.
Certain of the Company’s debt agreements imposerestrictions with respect to the maintenance of financialratios and the disposition of assets. The most restrictivecovenants currently require the Company to maintain aminimum level of interest coverage, and a minimum levelof net worth, as defined. As of December 31, 2018, theCompany had substantial tolerance above the minimumlevels required under these covenants.
The principal requirements of debt maturing in the nextfive years are: 2019 – $195,445; 2020 – $16,763; 2021 –$440,658; 2022 – $124,197 and 2023 – $1,781.
10. Financial instruments and derivativesThe following table sets forth the carrying amounts and
fair values of the Company’s significant financial instru-ments where the carrying amount differs from the fairvalue.
December 31, 2018 December 31, 2017CarryingAmount
FairValue
CarryingAmount
FairValue
Long-termdebt $1,189,717 $1,270,521 $1,288,002 $1,426,862
The carrying value of cash and cash equivalents, short-term debt and long-term variable-rate debt approximatesfair value. The fair value of long-term debt is based onrecent trade information in the financial markets of theCompany’s public debt or is determined by discountingfuture cash flows using interest rates available to theCompany for issues with similar terms and maturities. It isconsidered a Level 2 fair value measurement.
Adoption of accounting standards update 2017-12The Company elected to early adopt Accounting Stan-
dards Update (ASU) 2017-12, “Derivatives and Hedging:Targeted Improvements to Accounting for HedgingActivities,” as of January 1, 2018. The impact of the adop-tion of ASU 2017-12 was the recognition of a $176increase in the Company’s beginning retained earningswith an offsetting change in accumulated other compre-hensive loss in order to remove previously recognizedineffectiveness losses on contracts outstanding as of thedate of adoption. See Note 2 for additional information.
Cash flow hedgesAt December 31, 2018 and 2017, the Company had
derivative financial instruments outstanding to hedgeanticipated transactions and certain asset and liability
related cash flows. To the extent considered effective, thechanges in fair value of these contracts are recorded inother comprehensive income and reclassified to income orexpense in the period in which the hedged item impactsearnings.
Commodity cash flow hedgesThe Company has entered into certain derivative con-
tracts to manage some of the cost of anticipated pur-chases of natural gas and aluminum. At December 31,2018, natural gas swaps covering approximately7.0 million MMBTUs were outstanding. These contractsrepresent approximately 71% and 31% of anticipated U.S.and Canadian usage for 2019 and 2020, respectively.Additionally, the Company had swap contracts covering4,082 metric tons of aluminum representing approximately51% of anticipated usage for 2019. The total fair values ofthe Company’s commodity cash flow hedges were in a netloss positions totaling $(1,571) and $(1,713) atDecember 31, 2018 and December 31, 2017,respectively. The amount of the loss included in accumu-lated other comprehensive loss at December 31, 2018,expected to be reclassified to the income statement dur-ing the next twelve months is $(1,500).
Foreign currency cash flow hedgesThe Company has entered into forward contracts to
hedge certain anticipated foreign currency denominatedsales and purchases forecasted to occur in 2019. The netpositions of these contracts at December 31, 2018, wereas follows:
Currency Action Quantity
Colombian peso Purchase 16,977,636Mexican peso Purchase 444,428Polish zloty Purchase 70,788Canadian dollar Purchase 62,753Czech koruna Purchase 45,255Turkish lira Purchase 6,603British pound Purchase 1,937New Zealand dollar Sell (334)Australian dollar Sell (388)Swedish krona Sell (3,380)Euro Sell (19,010)Russian ruble Sell (126,867)
The fair values of the Company’s foreign currency cashflow hedges related to forecasted sales and purchasesnetted to a loss position of $(1,624) at December 31, 2018and a gain position of $950 at December 31, 2017.Losses of $(1,624) are expected to be reclassified fromaccumulated other comprehensive loss to the incomestatement during the next twelve months. In addition, theCompany has entered into forward contracts to hedgecertain foreign currency cash flow transactions related toconstruction in progress. As of December 31, 2018 andDecember 31, 2017, the net position of these contactswas $(88) and $330 respectively. Losses totaling $(305)and a gain totaling $64 were reclassified from accumu-lated other comprehensive loss and netted against thecarrying value of the capitalized expenditures during theyears ended December 31, 2018 and December 31,2017, respectively. Losses of $(88) are expected to bereclassified from accumulated other comprehensive loss
F-20S O N O C O 2 0 1 8 A N N U A L R E P O R TS O N O C O 2 0 1 8 A N N U A L R E P O R T I F O R M 1 0 - K
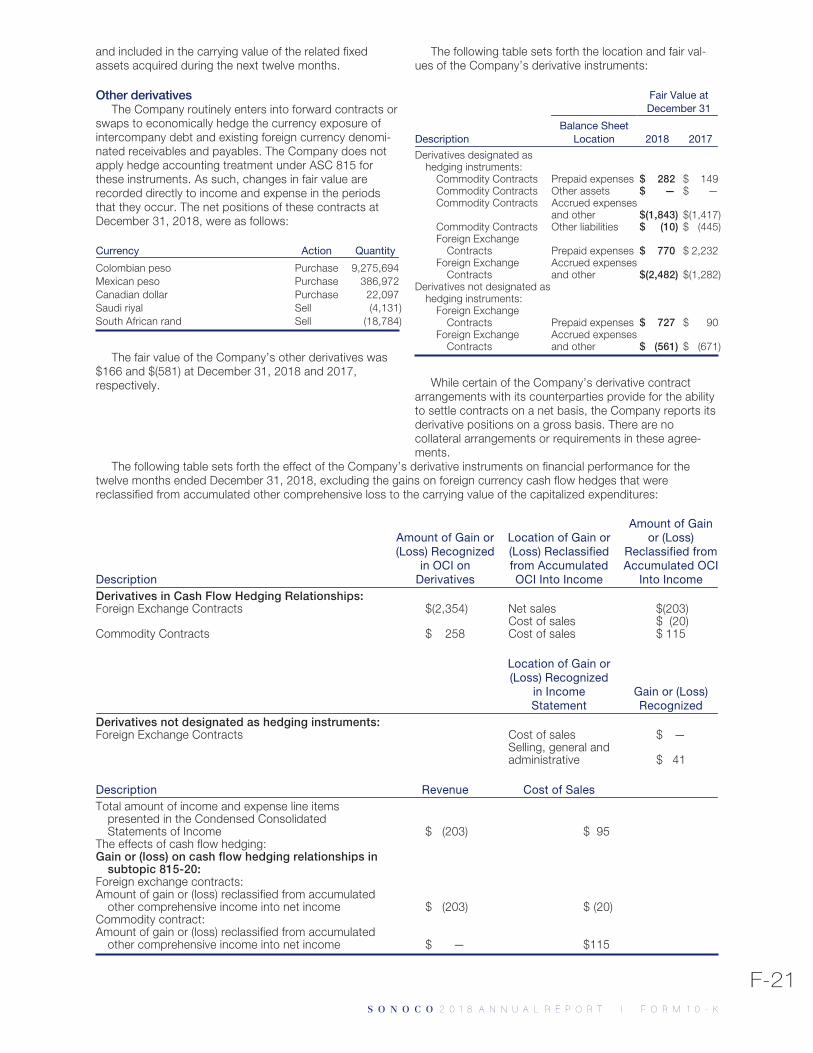
and included in the carrying value of the related fixedassets acquired during the next twelve months.
Other derivativesThe Company routinely enters into forward contracts or
swaps to economically hedge the currency exposure ofintercompany debt and existing foreign currency denomi-nated receivables and payables. The Company does notapply hedge accounting treatment under ASC 815 forthese instruments. As such, changes in fair value arerecorded directly to income and expense in the periodsthat they occur. The net positions of these contracts atDecember 31, 2018, were as follows:
Currency Action Quantity
Colombian peso Purchase 9,275,694Mexican peso Purchase 386,972Canadian dollar Purchase 22,097Saudi riyal Sell (4,131)South African rand Sell (18,784)
The fair value of the Company’s other derivatives was$166 and $(581) at December 31, 2018 and 2017,respectively.
The following table sets forth the location and fair val-ues of the Company’s derivative instruments:
Fair Value atDecember 31
DescriptionBalance Sheet
Location 2018 2017
Derivatives designated ashedging instruments:
Commodity Contracts Prepaid expenses $ 282 $ 149Commodity Contracts Other assets $ — $ —Commodity Contracts Accrued expenses
and other $(1,843) $(1,417)Commodity Contracts Other liabilities $ (10) $ (445)Foreign Exchange
Contracts Prepaid expenses $ 770 $ 2,232Foreign Exchange
ContractsAccrued expensesand other $(2,482) $(1,282)
Derivatives not designated ashedging instruments:
Foreign ExchangeContracts Prepaid expenses $ 727 $ 90
Foreign ExchangeContracts
Accrued expensesand other $ (561) $ (671)
While certain of the Company’s derivative contractarrangements with its counterparties provide for the abilityto settle contracts on a net basis, the Company reports itsderivative positions on a gross basis. There are nocollateral arrangements or requirements in these agree-ments.
The following table sets forth the effect of the Company’s derivative instruments on financial performance for thetwelve months ended December 31, 2018, excluding the gains on foreign currency cash flow hedges that werereclassified from accumulated other comprehensive loss to the carrying value of the capitalized expenditures:
Description
Amount of Gain or(Loss) Recognized
in OCI onDerivatives
Location of Gain or(Loss) Reclassifiedfrom AccumulatedOCI Into Income
Amount of Gainor (Loss)
Reclassified fromAccumulated OCI
Into IncomeDerivatives in Cash Flow Hedging Relationships:Foreign Exchange Contracts $(2,354) Net sales $(203)
Cost of sales $ (20)Commodity Contracts $ 258 Cost of sales $ 115
Location of Gain or(Loss) Recognized
in IncomeStatement
Gain or (Loss)Recognized
Derivatives not designated as hedging instruments:Foreign Exchange Contracts Cost of sales $ —
Selling, general andadministrative $ 41
Description Revenue Cost of SalesTotal amount of income and expense line items
presented in the Condensed ConsolidatedStatements of Income $ (203) $ 95
The effects of cash flow hedging:Gain or (loss) on cash flow hedging relationships in
subtopic 815-20:Foreign exchange contracts:Amount of gain or (loss) reclassified from accumulated
other comprehensive income into net income $ (203) $ (20)Commodity contract:Amount of gain or (loss) reclassified from accumulated
other comprehensive income into net income $ — $115
F-21S O N O C O 2 0 1 8 A N N U A L R E P O R TS O N O C O 2 0 1 8 A N N U A L R E P O R T I F O R M 1 0 - K
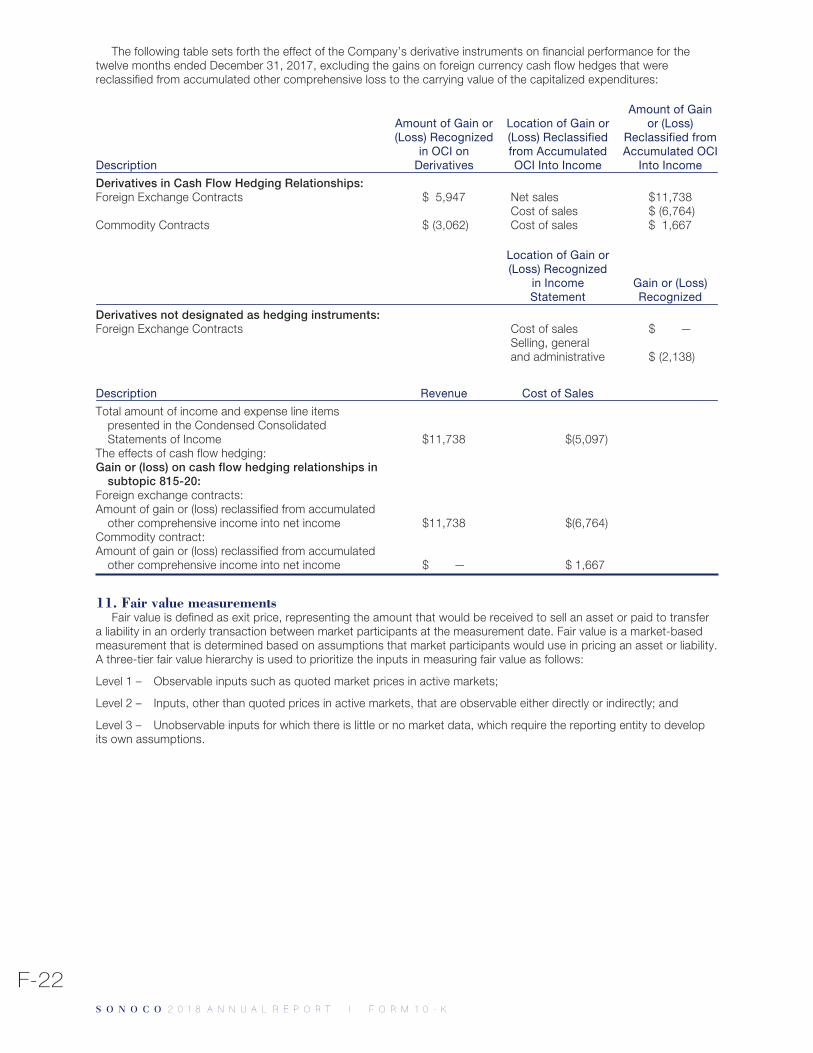
The following table sets forth the effect of the Company’s derivative instruments on financial performance for thetwelve months ended December 31, 2017, excluding the gains on foreign currency cash flow hedges that werereclassified from accumulated other comprehensive loss to the carrying value of the capitalized expenditures:
Description
Amount of Gain or(Loss) Recognized
in OCI onDerivatives
Location of Gain or(Loss) Reclassifiedfrom AccumulatedOCI Into Income
Amount of Gainor (Loss)
Reclassified fromAccumulated OCI
Into Income
Derivatives in Cash Flow Hedging Relationships:Foreign Exchange Contracts $ 5,947 Net sales $11,738
Cost of sales $ (6,764)Commodity Contracts $ (3,062) Cost of sales $ 1,667
Location of Gain or(Loss) Recognized
in IncomeStatement
Gain or (Loss)Recognized
Derivatives not designated as hedging instruments:Foreign Exchange Contracts Cost of sales $ —
Selling, generaland administrative $ (2,138)
Description Revenue Cost of Sales
Total amount of income and expense line itemspresented in the Condensed ConsolidatedStatements of Income $11,738 $(5,097)
The effects of cash flow hedging:Gain or (loss) on cash flow hedging relationships in
subtopic 815-20:Foreign exchange contracts:Amount of gain or (loss) reclassified from accumulated
other comprehensive income into net income $11,738 $(6,764)Commodity contract:Amount of gain or (loss) reclassified from accumulated
other comprehensive income into net income $ — $ 1,667
11. Fair value measurementsFair value is defined as exit price, representing the amount that would be received to sell an asset or paid to transfer
a liability in an orderly transaction between market participants at the measurement date. Fair value is a market-basedmeasurement that is determined based on assumptions that market participants would use in pricing an asset or liability.A three-tier fair value hierarchy is used to prioritize the inputs in measuring fair value as follows:
Level 1 – Observable inputs such as quoted market prices in active markets;
Level 2 – Inputs, other than quoted prices in active markets, that are observable either directly or indirectly; and
Level 3 – Unobservable inputs for which there is little or no market data, which require the reporting entity to developits own assumptions.
F-22S O N O C O 2 0 1 8 A N N U A L R E P O R TS O N O C O 2 0 1 8 A N N U A L R E P O R T I F O R M 1 0 - K
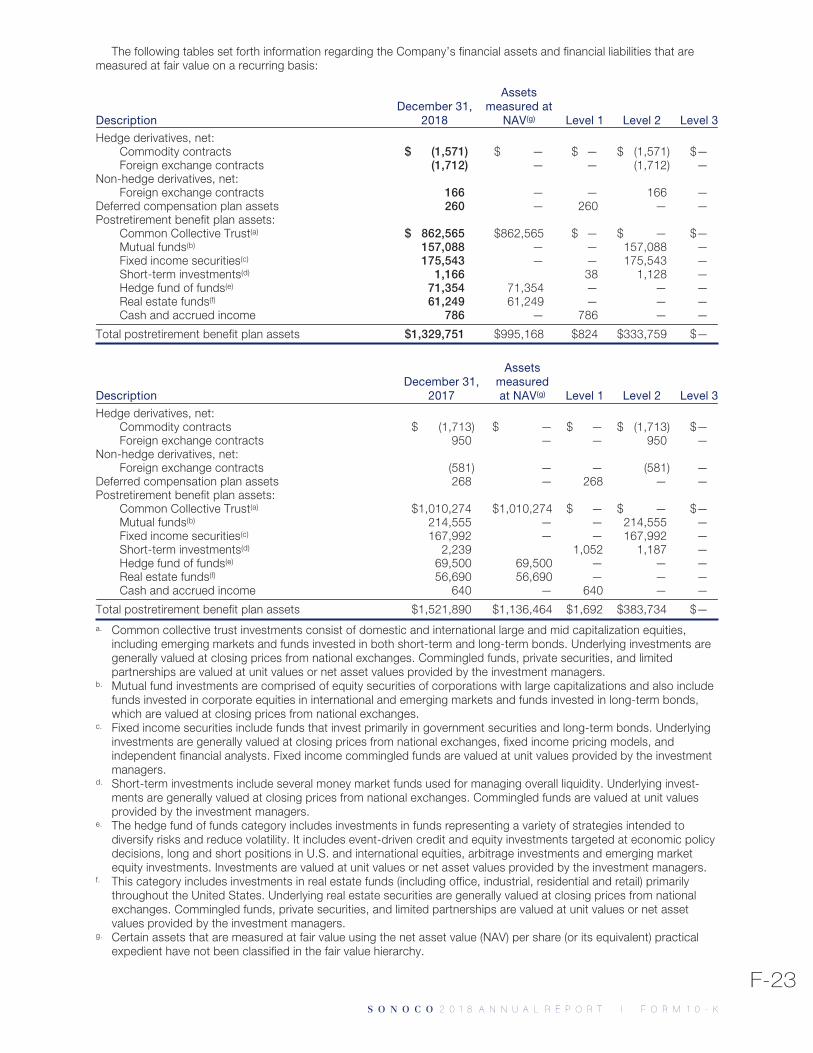
The following tables set forth information regarding the Company’s financial assets and financial liabilities that aremeasured at fair value on a recurring basis:
DescriptionDecember 31,
2018
Assetsmeasured at
NAV(g) Level 1 Level 2 Level 3
Hedge derivatives, net:Commodity contracts $ (1,571) $ — $ — $ (1,571) $—Foreign exchange contracts (1,712) — — (1,712) —
Non-hedge derivatives, net:Foreign exchange contracts 166 — — 166 —
Deferred compensation plan assets 260 — 260 — —Postretirement benefit plan assets:
Common Collective Trust(a) $ 862,565 $862,565 $ — $ — $—Mutual funds(b) 157,088 — — 157,088 —Fixed income securities(c) 175,543 — — 175,543 —Short-term investments(d) 1,166 38 1,128 —Hedge fund of funds(e) 71,354 71,354 — — —Real estate funds(f) 61,249 61,249 — — —Cash and accrued income 786 — 786 — —
Total postretirement benefit plan assets $1,329,751 $995,168 $824 $333,759 $—
DescriptionDecember 31,
2017
Assetsmeasuredat NAV(g) Level 1 Level 2 Level 3
Hedge derivatives, net:Commodity contracts $ (1,713) $ — $ — $ (1,713) $—Foreign exchange contracts 950 — — 950 —
Non-hedge derivatives, net:Foreign exchange contracts (581) — — (581) —
Deferred compensation plan assets 268 — 268 — —Postretirement benefit plan assets:
Common Collective Trust(a) $1,010,274 $1,010,274 $ — $ — $—Mutual funds(b) 214,555 — — 214,555 —Fixed income securities(c) 167,992 — — 167,992 —Short-term investments(d) 2,239 1,052 1,187 —Hedge fund of funds(e) 69,500 69,500 — — —Real estate funds(f) 56,690 56,690 — — —Cash and accrued income 640 — 640 — —
Total postretirement benefit plan assets $1,521,890 $1,136,464 $1,692 $383,734 $—a. Common collective trust investments consist of domestic and international large and mid capitalization equities,
including emerging markets and funds invested in both short-term and long-term bonds. Underlying investments aregenerally valued at closing prices from national exchanges. Commingled funds, private securities, and limitedpartnerships are valued at unit values or net asset values provided by the investment managers.
b. Mutual fund investments are comprised of equity securities of corporations with large capitalizations and also includefunds invested in corporate equities in international and emerging markets and funds invested in long-term bonds,which are valued at closing prices from national exchanges.
c. Fixed income securities include funds that invest primarily in government securities and long-term bonds. Underlyinginvestments are generally valued at closing prices from national exchanges, fixed income pricing models, andindependent financial analysts. Fixed income commingled funds are valued at unit values provided by the investmentmanagers.
d. Short-term investments include several money market funds used for managing overall liquidity. Underlying invest-ments are generally valued at closing prices from national exchanges. Commingled funds are valued at unit valuesprovided by the investment managers.
e. The hedge fund of funds category includes investments in funds representing a variety of strategies intended todiversify risks and reduce volatility. It includes event-driven credit and equity investments targeted at economic policydecisions, long and short positions in U.S. and international equities, arbitrage investments and emerging marketequity investments. Investments are valued at unit values or net asset values provided by the investment managers.
f. This category includes investments in real estate funds (including office, industrial, residential and retail) primarilythroughout the United States. Underlying real estate securities are generally valued at closing prices from nationalexchanges. Commingled funds, private securities, and limited partnerships are valued at unit values or net assetvalues provided by the investment managers.
g. Certain assets that are measured at fair value using the net asset value (NAV) per share (or its equivalent) practicalexpedient have not been classified in the fair value hierarchy.
F-23S O N O C O 2 0 1 8 A N N U A L R E P O R TS O N O C O 2 0 1 8 A N N U A L R E P O R T I F O R M 1 0 - K
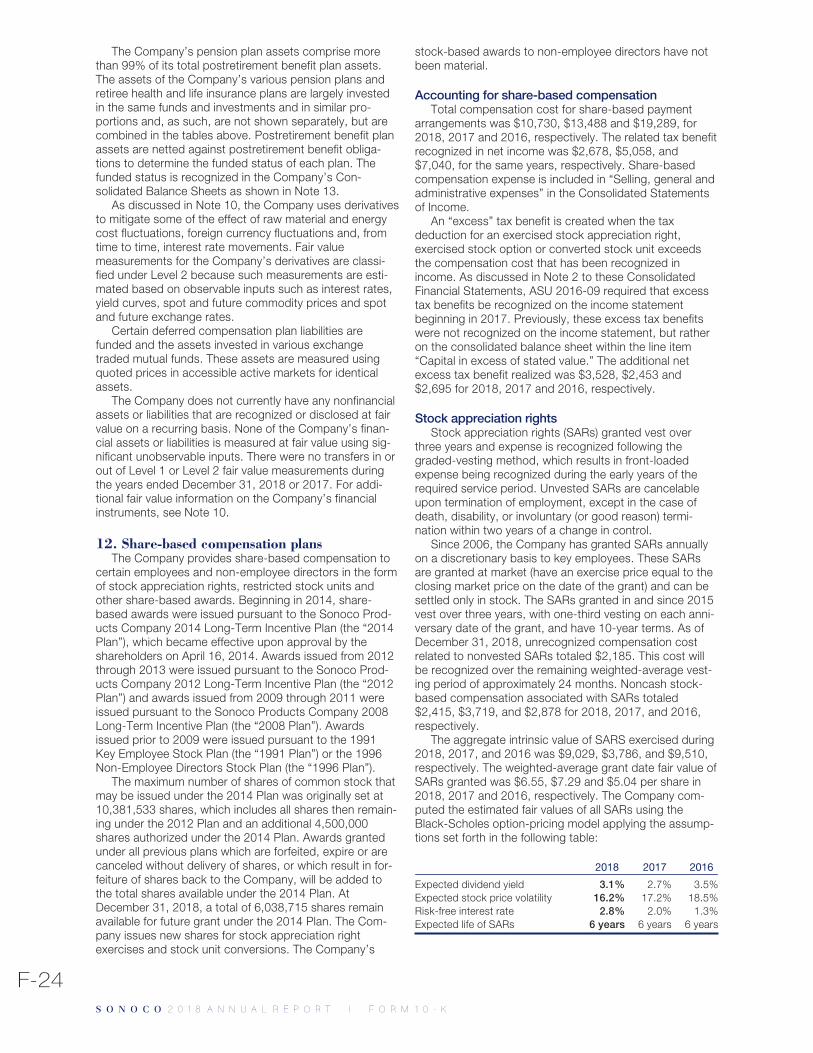
The Company’s pension plan assets comprise morethan 99% of its total postretirement benefit plan assets.The assets of the Company’s various pension plans andretiree health and life insurance plans are largely investedin the same funds and investments and in similar pro-portions and, as such, are not shown separately, but arecombined in the tables above. Postretirement benefit planassets are netted against postretirement benefit obliga-tions to determine the funded status of each plan. Thefunded status is recognized in the Company’s Con-solidated Balance Sheets as shown in Note 13.
As discussed in Note 10, the Company uses derivativesto mitigate some of the effect of raw material and energycost fluctuations, foreign currency fluctuations and, fromtime to time, interest rate movements. Fair valuemeasurements for the Company’s derivatives are classi-fied under Level 2 because such measurements are esti-mated based on observable inputs such as interest rates,yield curves, spot and future commodity prices and spotand future exchange rates.
Certain deferred compensation plan liabilities arefunded and the assets invested in various exchangetraded mutual funds. These assets are measured usingquoted prices in accessible active markets for identicalassets.
The Company does not currently have any nonfinancialassets or liabilities that are recognized or disclosed at fairvalue on a recurring basis. None of the Company’s finan-cial assets or liabilities is measured at fair value using sig-nificant unobservable inputs. There were no transfers in orout of Level 1 or Level 2 fair value measurements duringthe years ended December 31, 2018 or 2017. For addi-tional fair value information on the Company’s financialinstruments, see Note 10.
12. Share-based compensation plansThe Company provides share-based compensation to
certain employees and non-employee directors in the formof stock appreciation rights, restricted stock units andother share-based awards. Beginning in 2014, share-based awards were issued pursuant to the Sonoco Prod-ucts Company 2014 Long-Term Incentive Plan (the “2014Plan”), which became effective upon approval by theshareholders on April 16, 2014. Awards issued from 2012through 2013 were issued pursuant to the Sonoco Prod-ucts Company 2012 Long-Term Incentive Plan (the “2012Plan”) and awards issued from 2009 through 2011 wereissued pursuant to the Sonoco Products Company 2008Long-Term Incentive Plan (the “2008 Plan”). Awardsissued prior to 2009 were issued pursuant to the 1991Key Employee Stock Plan (the “1991 Plan”) or the 1996Non-Employee Directors Stock Plan (the “1996 Plan”).
The maximum number of shares of common stock thatmay be issued under the 2014 Plan was originally set at10,381,533 shares, which includes all shares then remain-ing under the 2012 Plan and an additional 4,500,000shares authorized under the 2014 Plan. Awards grantedunder all previous plans which are forfeited, expire or arecanceled without delivery of shares, or which result in for-feiture of shares back to the Company, will be added tothe total shares available under the 2014 Plan. AtDecember 31, 2018, a total of 6,038,715 shares remainavailable for future grant under the 2014 Plan. The Com-pany issues new shares for stock appreciation rightexercises and stock unit conversions. The Company’s
stock-based awards to non-employee directors have notbeen material.
Accounting for share-based compensationTotal compensation cost for share-based payment
arrangements was $10,730, $13,488 and $19,289, for2018, 2017 and 2016, respectively. The related tax benefitrecognized in net income was $2,678, $5,058, and$7,040, for the same years, respectively. Share-basedcompensation expense is included in “Selling, general andadministrative expenses” in the Consolidated Statementsof Income.
An “excess” tax benefit is created when the taxdeduction for an exercised stock appreciation right,exercised stock option or converted stock unit exceedsthe compensation cost that has been recognized inincome. As discussed in Note 2 to these ConsolidatedFinancial Statements, ASU 2016-09 required that excesstax benefits be recognized on the income statementbeginning in 2017. Previously, these excess tax benefitswere not recognized on the income statement, but ratheron the consolidated balance sheet within the line item“Capital in excess of stated value.” The additional netexcess tax benefit realized was $3,528, $2,453 and$2,695 for 2018, 2017 and 2016, respectively.
Stock appreciation rightsStock appreciation rights (SARs) granted vest over
three years and expense is recognized following thegraded-vesting method, which results in front-loadedexpense being recognized during the early years of therequired service period. Unvested SARs are cancelableupon termination of employment, except in the case ofdeath, disability, or involuntary (or good reason) termi-nation within two years of a change in control.
Since 2006, the Company has granted SARs annuallyon a discretionary basis to key employees. These SARsare granted at market (have an exercise price equal to theclosing market price on the date of the grant) and can besettled only in stock. The SARs granted in and since 2015vest over three years, with one-third vesting on each anni-versary date of the grant, and have 10-year terms. As ofDecember 31, 2018, unrecognized compensation costrelated to nonvested SARs totaled $2,185. This cost willbe recognized over the remaining weighted-average vest-ing period of approximately 24 months. Noncash stock-based compensation associated with SARs totaled$2,415, $3,719, and $2,878 for 2018, 2017, and 2016,respectively.
The aggregate intrinsic value of SARS exercised during2018, 2017, and 2016 was $9,029, $3,786, and $9,510,respectively. The weighted-average grant date fair value ofSARs granted was $6.55, $7.29 and $5.04 per share in2018, 2017 and 2016, respectively. The Company com-puted the estimated fair values of all SARs using theBlack-Scholes option-pricing model applying the assump-tions set forth in the following table:
2018 2017 2016
Expected dividend yield 3.1% 2.7% 3.5%Expected stock price volatility 16.2% 17.2% 18.5%Risk-free interest rate 2.8% 2.0% 1.3%Expected life of SARs 6 years 6 years 6 years
F-24S O N O C O 2 0 1 8 A N N U A L R E P O R TS O N O C O 2 0 1 8 A N N U A L R E P O R T I F O R M 1 0 - K
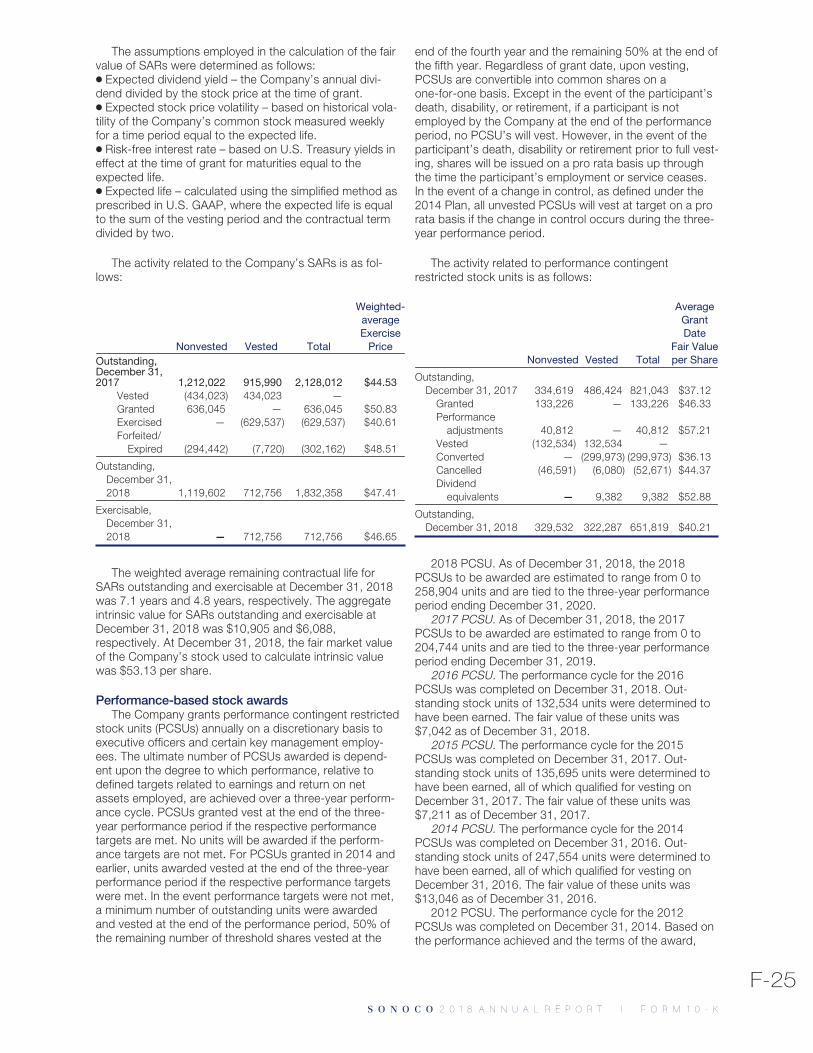
The assumptions employed in the calculation of the fairvalue of SARs were determined as follows:Š Expected dividend yield – the Company’s annual divi-dend divided by the stock price at the time of grant.Š Expected stock price volatility – based on historical vola-tility of the Company’s common stock measured weeklyfor a time period equal to the expected life.Š Risk-free interest rate – based on U.S. Treasury yields ineffect at the time of grant for maturities equal to theexpected life.Š Expected life – calculated using the simplified method asprescribed in U.S. GAAP, where the expected life is equalto the sum of the vesting period and the contractual termdivided by two.
The activity related to the Company’s SARs is as fol-lows:
Nonvested Vested Total
Weighted-averageExercise
PriceOutstanding,December 31,2017 1,212,022 915,990 2,128,012 $44.53
Vested (434,023) 434,023 —Granted 636,045 — 636,045 $50.83Exercised — (629,537) (629,537) $40.61Forfeited/
Expired (294,442) (7,720) (302,162) $48.51
Outstanding,December 31,2018 1,119,602 712,756 1,832,358 $47.41
Exercisable,December 31,2018 — 712,756 712,756 $46.65
The weighted average remaining contractual life forSARs outstanding and exercisable at December 31, 2018was 7.1 years and 4.8 years, respectively. The aggregateintrinsic value for SARs outstanding and exercisable atDecember 31, 2018 was $10,905 and $6,088,respectively. At December 31, 2018, the fair market valueof the Company’s stock used to calculate intrinsic valuewas $53.13 per share.
Performance-based stock awardsThe Company grants performance contingent restricted
stock units (PCSUs) annually on a discretionary basis toexecutive officers and certain key management employ-ees. The ultimate number of PCSUs awarded is depend-ent upon the degree to which performance, relative todefined targets related to earnings and return on netassets employed, are achieved over a three-year perform-ance cycle. PCSUs granted vest at the end of the three-year performance period if the respective performancetargets are met. No units will be awarded if the perform-ance targets are not met. For PCSUs granted in 2014 andearlier, units awarded vested at the end of the three-yearperformance period if the respective performance targetswere met. In the event performance targets were not met,a minimum number of outstanding units were awardedand vested at the end of the performance period, 50% ofthe remaining number of threshold shares vested at the
end of the fourth year and the remaining 50% at the end ofthe fifth year. Regardless of grant date, upon vesting,PCSUs are convertible into common shares on aone-for-one basis. Except in the event of the participant’sdeath, disability, or retirement, if a participant is notemployed by the Company at the end of the performanceperiod, no PCSU’s will vest. However, in the event of theparticipant’s death, disability or retirement prior to full vest-ing, shares will be issued on a pro rata basis up throughthe time the participant’s employment or service ceases.In the event of a change in control, as defined under the2014 Plan, all unvested PCSUs will vest at target on a prorata basis if the change in control occurs during the three-year performance period.
The activity related to performance contingentrestricted stock units is as follows:
Nonvested Vested Total
AverageGrantDate
Fair Valueper Share
Outstanding,December 31, 2017 334,619 486,424 821,043 $37.12
Granted 133,226 — 133,226 $46.33Performance
adjustments 40,812 — 40,812 $57.21Vested (132,534) 132,534 —Converted — (299,973) (299,973) $36.13Cancelled (46,591) (6,080) (52,671) $44.37Dividend
equivalents — 9,382 9,382 $52.88
Outstanding,December 31, 2018 329,532 322,287 651,819 $40.21
2018 PCSU. As of December 31, 2018, the 2018PCSUs to be awarded are estimated to range from 0 to258,904 units and are tied to the three-year performanceperiod ending December 31, 2020.
2017 PCSU. As of December 31, 2018, the 2017PCSUs to be awarded are estimated to range from 0 to204,744 units and are tied to the three-year performanceperiod ending December 31, 2019.
2016 PCSU. The performance cycle for the 2016PCSUs was completed on December 31, 2018. Out-standing stock units of 132,534 units were determined tohave been earned. The fair value of these units was$7,042 as of December 31, 2018.
2015 PCSU. The performance cycle for the 2015PCSUs was completed on December 31, 2017. Out-standing stock units of 135,695 units were determined tohave been earned, all of which qualified for vesting onDecember 31, 2017. The fair value of these units was$7,211 as of December 31, 2017.
2014 PCSU. The performance cycle for the 2014PCSUs was completed on December 31, 2016. Out-standing stock units of 247,554 units were determined tohave been earned, all of which qualified for vesting onDecember 31, 2016. The fair value of these units was$13,046 as of December 31, 2016.
2012 PCSU. The performance cycle for the 2012PCSUs was completed on December 31, 2014. Based onthe performance achieved and the terms of the award,
F-25S O N O C O 2 0 1 8 A N N U A L R E P O R TS O N O C O 2 0 1 8 A N N U A L R E P O R T I F O R M 1 0 - K
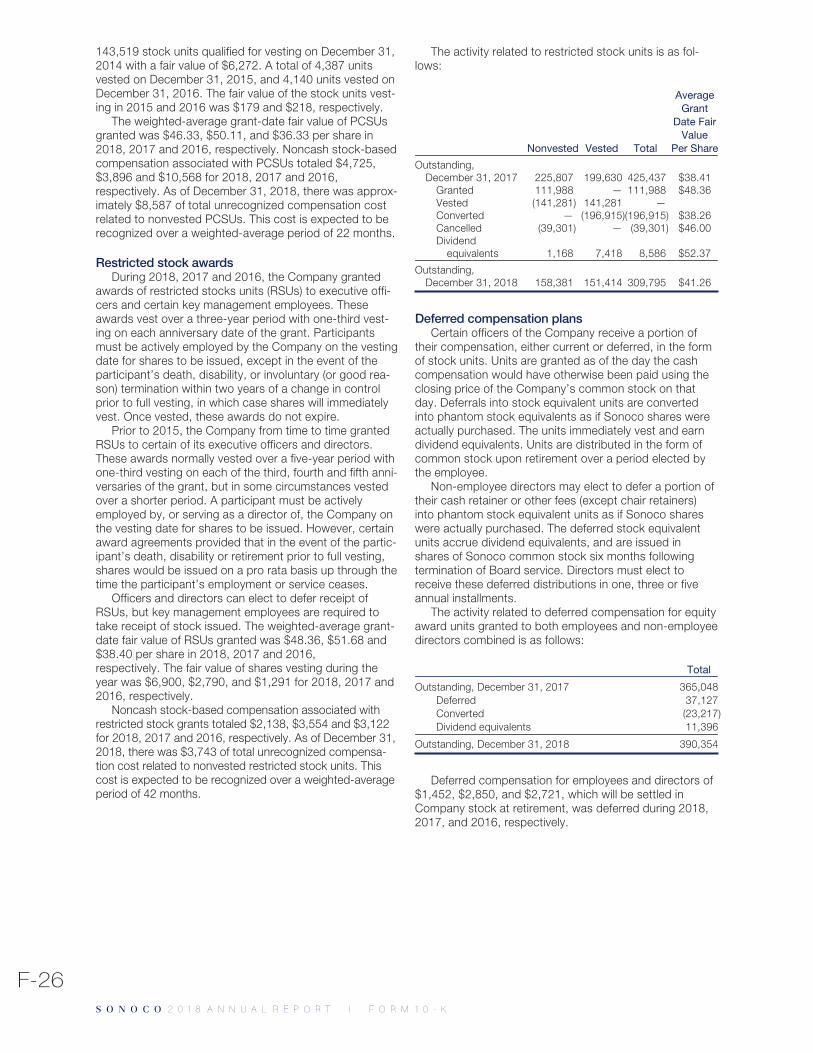
143,519 stock units qualified for vesting on December 31,2014 with a fair value of $6,272. A total of 4,387 unitsvested on December 31, 2015, and 4,140 units vested onDecember 31, 2016. The fair value of the stock units vest-ing in 2015 and 2016 was $179 and $218, respectively.
The weighted-average grant-date fair value of PCSUsgranted was $46.33, $50.11, and $36.33 per share in2018, 2017 and 2016, respectively. Noncash stock-basedcompensation associated with PCSUs totaled $4,725,$3,896 and $10,568 for 2018, 2017 and 2016,respectively. As of December 31, 2018, there was approx-imately $8,587 of total unrecognized compensation costrelated to nonvested PCSUs. This cost is expected to berecognized over a weighted-average period of 22 months.
Restricted stock awardsDuring 2018, 2017 and 2016, the Company granted
awards of restricted stocks units (RSUs) to executive offi-cers and certain key management employees. Theseawards vest over a three-year period with one-third vest-ing on each anniversary date of the grant. Participantsmust be actively employed by the Company on the vestingdate for shares to be issued, except in the event of theparticipant’s death, disability, or involuntary (or good rea-son) termination within two years of a change in controlprior to full vesting, in which case shares will immediatelyvest. Once vested, these awards do not expire.
Prior to 2015, the Company from time to time grantedRSUs to certain of its executive officers and directors.These awards normally vested over a five-year period withone-third vesting on each of the third, fourth and fifth anni-versaries of the grant, but in some circumstances vestedover a shorter period. A participant must be activelyemployed by, or serving as a director of, the Company onthe vesting date for shares to be issued. However, certainaward agreements provided that in the event of the partic-ipant’s death, disability or retirement prior to full vesting,shares would be issued on a pro rata basis up through thetime the participant’s employment or service ceases.
Officers and directors can elect to defer receipt ofRSUs, but key management employees are required totake receipt of stock issued. The weighted-average grant-date fair value of RSUs granted was $48.36, $51.68 and$38.40 per share in 2018, 2017 and 2016,respectively. The fair value of shares vesting during theyear was $6,900, $2,790, and $1,291 for 2018, 2017 and2016, respectively.
Noncash stock-based compensation associated withrestricted stock grants totaled $2,138, $3,554 and $3,122for 2018, 2017 and 2016, respectively. As of December 31,2018, there was $3,743 of total unrecognized compensa-tion cost related to nonvested restricted stock units. Thiscost is expected to be recognized over a weighted-averageperiod of 42 months.
The activity related to restricted stock units is as fol-lows:
Nonvested Vested Total
AverageGrant
Date FairValue
Per Share
Outstanding,December 31, 2017 225,807 199,630 425,437 $38.41
Granted 111,988 — 111,988 $48.36Vested (141,281) 141,281 —Converted — (196,915)(196,915) $38.26Cancelled (39,301) — (39,301) $46.00Dividend
equivalents 1,168 7,418 8,586 $52.37
Outstanding,December 31, 2018 158,381 151,414 309,795 $41.26
Deferred compensation plansCertain officers of the Company receive a portion of
their compensation, either current or deferred, in the formof stock units. Units are granted as of the day the cashcompensation would have otherwise been paid using theclosing price of the Company’s common stock on thatday. Deferrals into stock equivalent units are convertedinto phantom stock equivalents as if Sonoco shares wereactually purchased. The units immediately vest and earndividend equivalents. Units are distributed in the form ofcommon stock upon retirement over a period elected bythe employee.
Non-employee directors may elect to defer a portion oftheir cash retainer or other fees (except chair retainers)into phantom stock equivalent units as if Sonoco shareswere actually purchased. The deferred stock equivalentunits accrue dividend equivalents, and are issued inshares of Sonoco common stock six months followingtermination of Board service. Directors must elect toreceive these deferred distributions in one, three or fiveannual installments.
The activity related to deferred compensation for equityaward units granted to both employees and non-employeedirectors combined is as follows:
Total
Outstanding, December 31, 2017 365,048Deferred 37,127Converted (23,217)Dividend equivalents 11,396
Outstanding, December 31, 2018 390,354
Deferred compensation for employees and directors of$1,452, $2,850, and $2,721, which will be settled inCompany stock at retirement, was deferred during 2018,2017, and 2016, respectively.
F-26S O N O C O 2 0 1 8 A N N U A L R E P O R TS O N O C O 2 0 1 8 A N N U A L R E P O R T I F O R M 1 0 - K
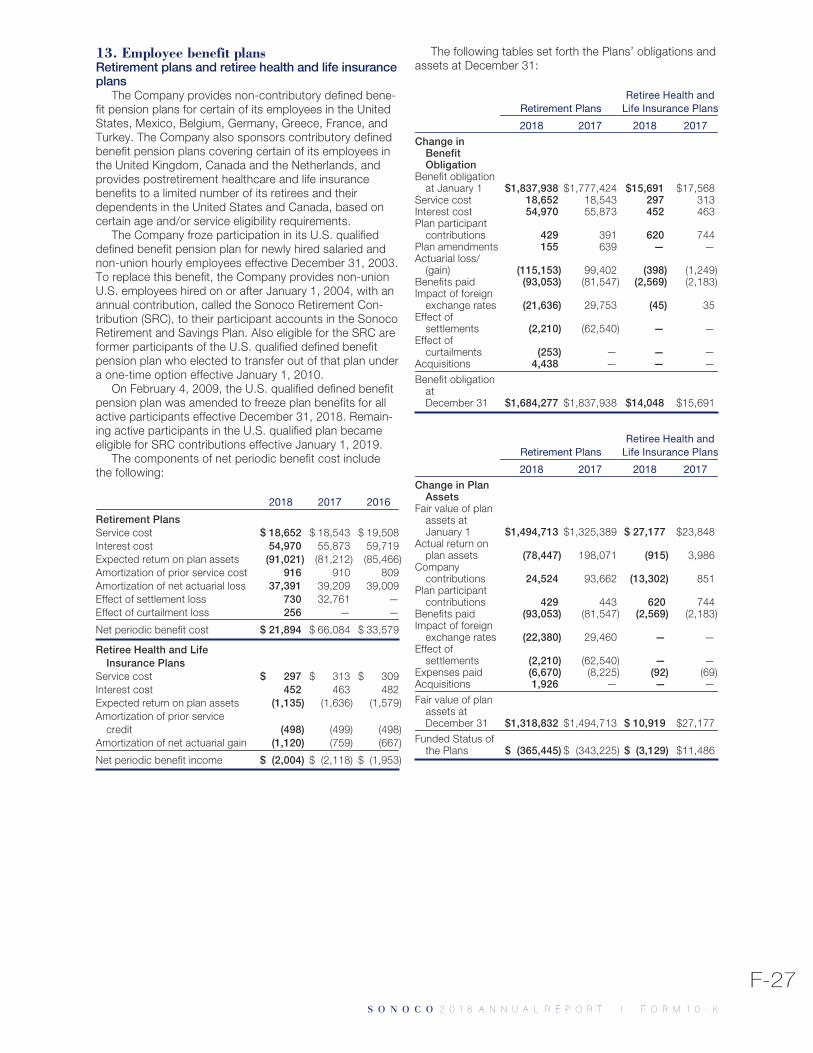
13. Employee benefit plansRetirement plans and retiree health and life insuranceplans
The Company provides non-contributory defined bene-fit pension plans for certain of its employees in the UnitedStates, Mexico, Belgium, Germany, Greece, France, andTurkey. The Company also sponsors contributory definedbenefit pension plans covering certain of its employees inthe United Kingdom, Canada and the Netherlands, andprovides postretirement healthcare and life insurancebenefits to a limited number of its retirees and theirdependents in the United States and Canada, based oncertain age and/or service eligibility requirements.
The Company froze participation in its U.S. qualifieddefined benefit pension plan for newly hired salaried andnon-union hourly employees effective December 31, 2003.To replace this benefit, the Company provides non-unionU.S. employees hired on or after January 1, 2004, with anannual contribution, called the Sonoco Retirement Con-tribution (SRC), to their participant accounts in the SonocoRetirement and Savings Plan. Also eligible for the SRC areformer participants of the U.S. qualified defined benefitpension plan who elected to transfer out of that plan undera one-time option effective January 1, 2010.
On February 4, 2009, the U.S. qualified defined benefitpension plan was amended to freeze plan benefits for allactive participants effective December 31, 2018. Remain-ing active participants in the U.S. qualified plan becameeligible for SRC contributions effective January 1, 2019.
The components of net periodic benefit cost includethe following:
2018 2017 2016
Retirement PlansService cost $ 18,652 $ 18,543 $ 19,508Interest cost 54,970 55,873 59,719Expected return on plan assets (91,021) (81,212) (85,466)Amortization of prior service cost 916 910 809Amortization of net actuarial loss 37,391 39,209 39,009Effect of settlement loss 730 32,761 —Effect of curtailment loss 256 — —
Net periodic benefit cost $ 21,894 $ 66,084 $ 33,579
Retiree Health and LifeInsurance Plans
Service cost $ 297 $ 313 $ 309Interest cost 452 463 482Expected return on plan assets (1,135) (1,636) (1,579)Amortization of prior service
credit (498) (499) (498)Amortization of net actuarial gain (1,120) (759) (667)
Net periodic benefit income $ (2,004) $ (2,118) $ (1,953)
The following tables set forth the Plans’ obligations andassets at December 31:
Retirement PlansRetiree Health and
Life Insurance Plans
2018 2017 2018 2017
Change inBenefitObligation
Benefit obligationat January 1 $1,837,938 $1,777,424 $15,691 $17,568
Service cost 18,652 18,543 297 313Interest cost 54,970 55,873 452 463Plan participant
contributions 429 391 620 744Plan amendments 155 639 — —Actuarial loss/
(gain) (115,153) 99,402 (398) (1,249)Benefits paid (93,053) (81,547) (2,569) (2,183)Impact of foreign
exchange rates (21,636) 29,753 (45) 35Effect of
settlements (2,210) (62,540) — —Effect of
curtailments (253) — — —Acquisitions 4,438 — — —Benefit obligation
atDecember 31 $1,684,277 $1,837,938 $14,048 $15,691
Retirement PlansRetiree Health and
Life Insurance Plans
2018 2017 2018 2017
Change in PlanAssets
Fair value of planassets atJanuary 1 $1,494,713 $1,325,389 $ 27,177 $23,848
Actual return onplan assets (78,447) 198,071 (915) 3,986
Companycontributions 24,524 93,662 (13,302) 851
Plan participantcontributions 429 443 620 744
Benefits paid (93,053) (81,547) (2,569) (2,183)Impact of foreign
exchange rates (22,380) 29,460 — —Effect of
settlements (2,210) (62,540) — —Expenses paid (6,670) (8,225) (92) (69)Acquisitions 1,926 — — —Fair value of plan
assets atDecember 31 $1,318,832 $1,494,713 $ 10,919 $27,177
Funded Status ofthe Plans $ (365,445) $ (343,225) $ (3,129) $11,486
F-27S O N O C O 2 0 1 8 A N N U A L R E P O R TS O N O C O 2 0 1 8 A N N U A L R E P O R T I F O R M 1 0 - K
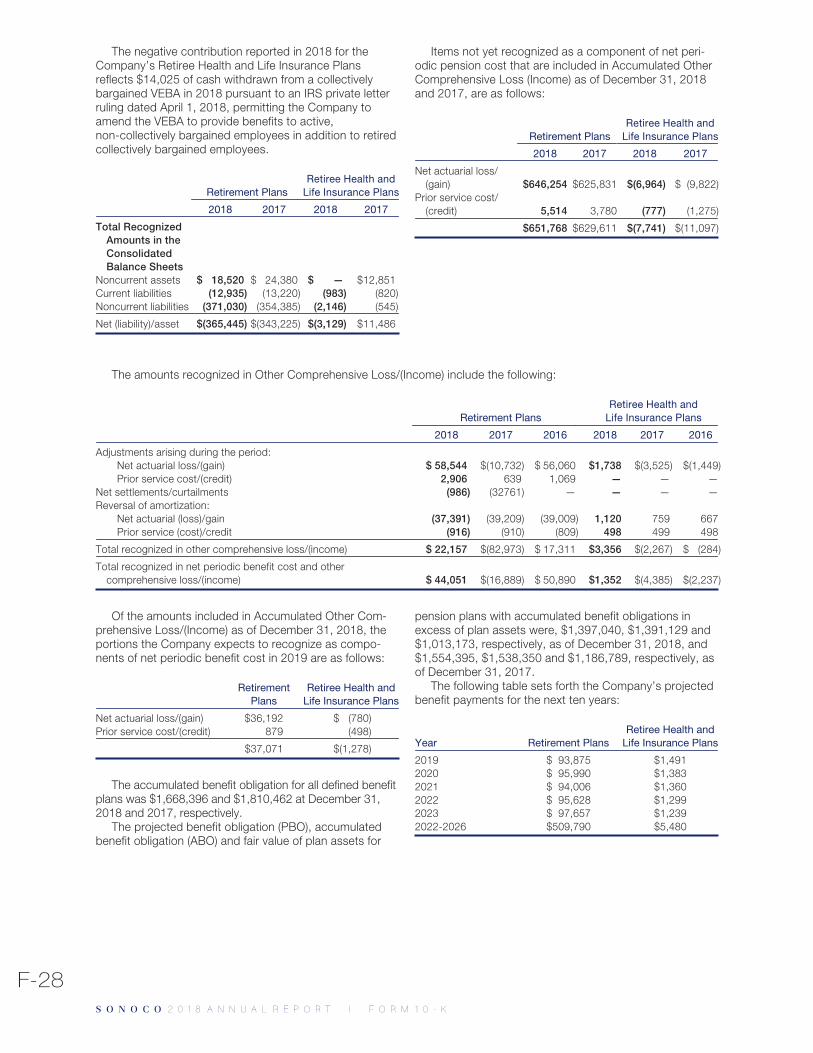
The negative contribution reported in 2018 for theCompany’s Retiree Health and Life Insurance Plansreflects $14,025 of cash withdrawn from a collectivelybargained VEBA in 2018 pursuant to an IRS private letterruling dated April 1, 2018, permitting the Company toamend the VEBA to provide benefits to active,non-collectively bargained employees in addition to retiredcollectively bargained employees.
Retirement PlansRetiree Health and
Life Insurance Plans
2018 2017 2018 2017
Total RecognizedAmounts in theConsolidatedBalance Sheets
Noncurrent assets $ 18,520 $ 24,380 $ — $12,851Current liabilities (12,935) (13,220) (983) (820)Noncurrent liabilities (371,030) (354,385) (2,146) (545)
Net (liability)/asset $(365,445) $(343,225) $(3,129) $11,486
Items not yet recognized as a component of net peri-odic pension cost that are included in Accumulated OtherComprehensive Loss (Income) as of December 31, 2018and 2017, are as follows:
Retirement PlansRetiree Health and
Life Insurance Plans
2018 2017 2018 2017
Net actuarial loss/(gain) $646,254 $625,831 $(6,964) $ (9,822)
Prior service cost/(credit) 5,514 3,780 (777) (1,275)
$651,768 $629,611 $(7,741) $(11,097)
The amounts recognized in Other Comprehensive Loss/(Income) include the following:
Retirement PlansRetiree Health and
Life Insurance Plans
2018 2017 2016 2018 2017 2016
Adjustments arising during the period:Net actuarial loss/(gain) $ 58,544 $(10,732) $ 56,060 $1,738 $(3,525) $(1,449)Prior service cost/(credit) 2,906 639 1,069 — — —
Net settlements/curtailments (986) (32761) — — — —Reversal of amortization:
Net actuarial (loss)/gain (37,391) (39,209) (39,009) 1,120 759 667Prior service (cost)/credit (916) (910) (809) 498 499 498
Total recognized in other comprehensive loss/(income) $ 22,157 $(82,973) $ 17,311 $3,356 $(2,267) $ (284)
Total recognized in net periodic benefit cost and othercomprehensive loss/(income) $ 44,051 $(16,889) $ 50,890 $1,352 $(4,385) $(2,237)
Of the amounts included in Accumulated Other Com-prehensive Loss/(Income) as of December 31, 2018, theportions the Company expects to recognize as compo-nents of net periodic benefit cost in 2019 are as follows:
RetirementPlans
Retiree Health andLife Insurance Plans
Net actuarial loss/(gain) $36,192 $ (780)Prior service cost/(credit) 879 (498)
$37,071 $(1,278)
The accumulated benefit obligation for all defined benefitplans was $1,668,396 and $1,810,462 at December 31,2018 and 2017, respectively.
The projected benefit obligation (PBO), accumulatedbenefit obligation (ABO) and fair value of plan assets for
pension plans with accumulated benefit obligations inexcess of plan assets were, $1,397,040, $1,391,129 and$1,013,173, respectively, as of December 31, 2018, and$1,554,395, $1,538,350 and $1,186,789, respectively, asof December 31, 2017.
The following table sets forth the Company’s projectedbenefit payments for the next ten years:
Year Retirement PlansRetiree Health and
Life Insurance Plans
2019 $ 93,875 $1,4912020 $ 95,990 $1,3832021 $ 94,006 $1,3602022 $ 95,628 $1,2992023 $ 97,657 $1,2392022-2026 $509,790 $5,480
F-28S O N O C O 2 0 1 8 A N N U A L R E P O R TS O N O C O 2 0 1 8 A N N U A L R E P O R T I F O R M 1 0 - K
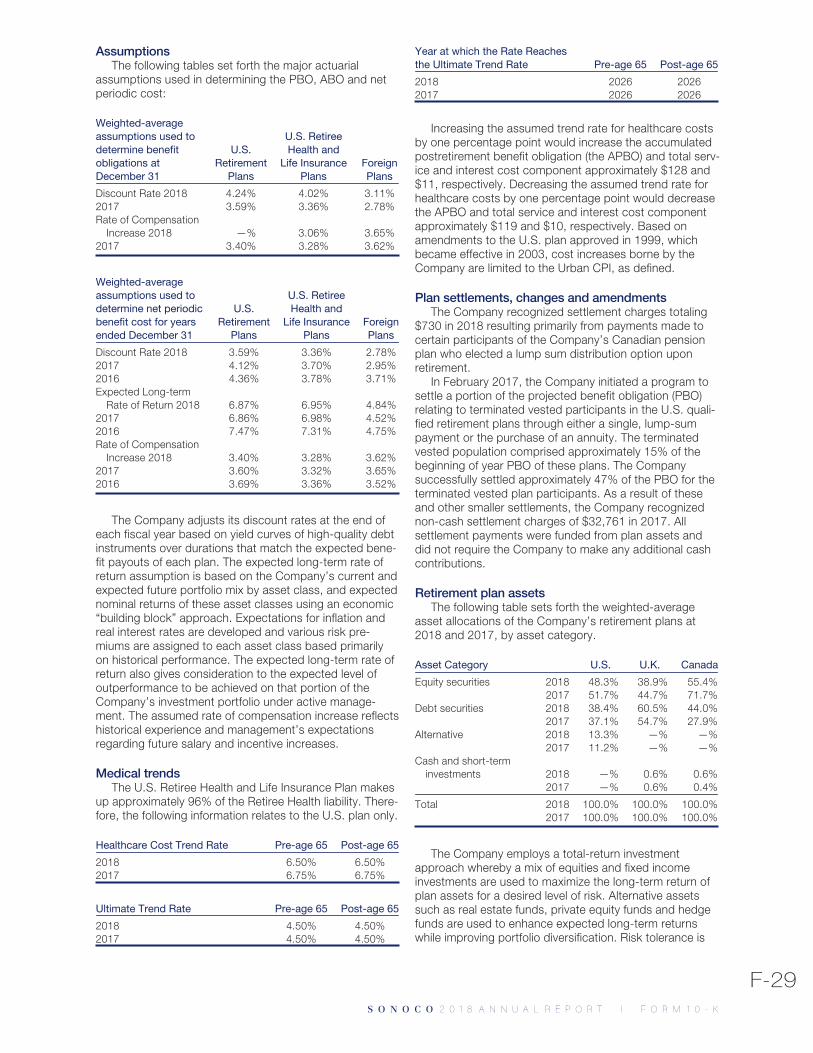
AssumptionsThe following tables set forth the major actuarial
assumptions used in determining the PBO, ABO and netperiodic cost:
Weighted-averageassumptions used todetermine benefitobligations atDecember 31
U.S.Retirement
Plans
U.S. RetireeHealth and
Life InsurancePlans
ForeignPlans
Discount Rate 2018 4.24% 4.02% 3.11%2017 3.59% 3.36% 2.78%Rate of Compensation
Increase 2018 —% 3.06% 3.65%2017 3.40% 3.28% 3.62%
Weighted-averageassumptions used todetermine net periodicbenefit cost for yearsended December 31
U.S.Retirement
Plans
U.S. RetireeHealth and
Life InsurancePlans
ForeignPlans
Discount Rate 2018 3.59% 3.36% 2.78%2017 4.12% 3.70% 2.95%2016 4.36% 3.78% 3.71%Expected Long-term
Rate of Return 2018 6.87% 6.95% 4.84%2017 6.86% 6.98% 4.52%2016 7.47% 7.31% 4.75%Rate of Compensation
Increase 2018 3.40% 3.28% 3.62%2017 3.60% 3.32% 3.65%2016 3.69% 3.36% 3.52%
The Company adjusts its discount rates at the end ofeach fiscal year based on yield curves of high-quality debtinstruments over durations that match the expected bene-fit payouts of each plan. The expected long-term rate ofreturn assumption is based on the Company’s current andexpected future portfolio mix by asset class, and expectednominal returns of these asset classes using an economic“building block” approach. Expectations for inflation andreal interest rates are developed and various risk pre-miums are assigned to each asset class based primarilyon historical performance. The expected long-term rate ofreturn also gives consideration to the expected level ofoutperformance to be achieved on that portion of theCompany’s investment portfolio under active manage-ment. The assumed rate of compensation increase reflectshistorical experience and management’s expectationsregarding future salary and incentive increases.
Medical trendsThe U.S. Retiree Health and Life Insurance Plan makes
up approximately 96% of the Retiree Health liability. There-fore, the following information relates to the U.S. plan only.
Healthcare Cost Trend Rate Pre-age 65 Post-age 65
2018 6.50% 6.50%2017 6.75% 6.75%
Ultimate Trend Rate Pre-age 65 Post-age 65
2018 4.50% 4.50%2017 4.50% 4.50%
Year at which the Rate Reachesthe Ultimate Trend Rate Pre-age 65 Post-age 65
2018 2026 20262017 2026 2026
Increasing the assumed trend rate for healthcare costsby one percentage point would increase the accumulatedpostretirement benefit obligation (the APBO) and total serv-ice and interest cost component approximately $128 and$11, respectively. Decreasing the assumed trend rate forhealthcare costs by one percentage point would decreasethe APBO and total service and interest cost componentapproximately $119 and $10, respectively. Based onamendments to the U.S. plan approved in 1999, whichbecame effective in 2003, cost increases borne by theCompany are limited to the Urban CPI, as defined.
Plan settlements, changes and amendmentsThe Company recognized settlement charges totaling
$730 in 2018 resulting primarily from payments made tocertain participants of the Company’s Canadian pensionplan who elected a lump sum distribution option uponretirement.
In February 2017, the Company initiated a program tosettle a portion of the projected benefit obligation (PBO)relating to terminated vested participants in the U.S. quali-fied retirement plans through either a single, lump-sumpayment or the purchase of an annuity. The terminatedvested population comprised approximately 15% of thebeginning of year PBO of these plans. The Companysuccessfully settled approximately 47% of the PBO for theterminated vested plan participants. As a result of theseand other smaller settlements, the Company recognizednon-cash settlement charges of $32,761 in 2017. Allsettlement payments were funded from plan assets anddid not require the Company to make any additional cashcontributions.
Retirement plan assetsThe following table sets forth the weighted-average
asset allocations of the Company’s retirement plans at2018 and 2017, by asset category.
Asset Category U.S. U.K. Canada
Equity securities 2018 48.3% 38.9% 55.4%2017 51.7% 44.7% 71.7%
Debt securities 2018 38.4% 60.5% 44.0%2017 37.1% 54.7% 27.9%
Alternative 2018 13.3% —% —%2017 11.2% —% —%
Cash and short-terminvestments 2018 —% 0.6% 0.6%
2017 —% 0.6% 0.4%
Total 2018 100.0% 100.0% 100.0%2017 100.0% 100.0% 100.0%
The Company employs a total-return investmentapproach whereby a mix of equities and fixed incomeinvestments are used to maximize the long-term return ofplan assets for a desired level of risk. Alternative assetssuch as real estate funds, private equity funds and hedgefunds are used to enhance expected long-term returnswhile improving portfolio diversification. Risk tolerance is
F-29S O N O C O 2 0 1 8 A N N U A L R E P O R TS O N O C O 2 0 1 8 A N N U A L R E P O R T I F O R M 1 0 - K
established through consideration of plan liabilities, planfunded status and corporate financial condition. Invest-ment risk is measured and monitored on an ongoing basisthrough periodic investment portfolio reviews and periodicasset/liability studies.
At December 31, 2018, postretirement benefit planassets totaled $1,329,751, of which $995,207 wereassets of the U.S. Defined Benefit Plans.
U.S. defined benefit plansThe equity investments consist of direct ownership and
funds and are diversified among U.S. and non-U.S. stocksof small to large capitalizations. Following the December2010 amendment that split the U.S. qualified definedbenefit pension plan into the Active Plan and the InactivePlan effective January 1, 2011, the Company completedseparate asset/liability studies for both plans during 2011and adopted revised investment guidelines for each. Therevised guidelines establish a dynamic de-risking frame-work that will gradually shift the allocation of assets tolong-duration domestic fixed income from equity and otherasset categories, as the relative funding ratio of each planincreases over time. The current target allocation(midpoint) for the Inactive Plan investment portfolio is:Equity Securities – 49%, Debt Securities – 40%, Alter-native – 11% and Cash – 0%. The current target allocation(midpoint) for the Active Plan investment portfolio is: EquitySecurities – 57%, Debt Securities – 30%, Alternative –13% and Cash – 0%.
United Kingdom defined benefit planThe equity investments consist of direct ownership and
funds and are diversified among U.K. and internationalstocks of small and large capitalizations. The current tar-get allocation (midpoint) for the investment portfolio is:Equity Securities – 48%, Debt Securities – 52%, Alter-native – 0% and Cash – 0%.
Canada defined benefit planThe equity investments consist of direct ownership and
funds and are diversified among Canadian and interna-tional stocks of primarily large capitalizations and short tointermediate duration corporate and government bonds.The current target allocation (midpoint) for the investmentportfolio is: Equity Securities – 53%, Debt Securities –45%, Alternative – 0% and Cash – 2%.
Retiree health and life insurance plan assetsThe following table sets forth the weighted-average
asset allocations by asset category of the Company’sretiree health and life insurance plan.
Asset Category 2018 2017
Equity securities 48.3% 63.6%Debt securities 38.4% 30.8%Alternative 13.3% 5.4%Cash —% 0.2%
Total 100.0% 100.0%
ContributionsBased on current actuarial estimates, the Company
anticipates that the total contributions to its retirementplans and retiree health and life insurance plans, excludingcontributions to the Sonoco Savings Plan, will be approx-imately $31,000 in 2019. No assurances can be made,however, about funding requirements beyond 2019, asthey will depend largely on actual investment returns andfuture actuarial assumptions.
Sonoco Savings and Retirement PlanThe Sonoco Savings and Retirement Plan is a defined
contribution retirement plan provided for certain of theCompany’s U.S. employees. The plan is comprised ofboth an elective and non-elective component.
The elective component of the plan, which is designedto meet the requirements of section 401(k) of the InternalRevenue Code, allows participants to set aside a portionof their wages and salaries for retirement and encouragessaving by matching a portion of their contributions withcontributions from the Company. The plan provides forparticipant contributions of 1% to 100% of gross pay.Since January 1, 2010, the Company has matched 50%on the first 4% of compensation contributed by the partic-ipant as pretax contributions which are immediately fullyvested. The Company’s expenses related to the plan for2018, 2017 and 2016 were approximately $12,500,$11,200 and $11,400, respectively.
The non-elective component of the plan, the SonocoRetirement Contribution (SRC), is available to certainemployees who are not currently active participants in theCompany’s U.S. qualified defined benefit pension plan.The SRC provides for an annual Company contribution of4% of all eligible pay plus 4% of eligible pay in excess ofthe Social Security wage base to eligible participantaccounts. Participants are fully vested after three years ofservice or upon reaching age 55, if earlier. The Company’sexpenses related to the plan for 2018, 2017 and 2016were approximately $14,995, $14,540 and $13,655,respectively. Cash contributions to the SRC totaled$14,151, $14,066 and $13,352 in 2018, 2017 and 2016,respectively.
Other plansThe Company also provides retirement and postretire-
ment benefits to certain other non-U.S. employeesthrough various Company-sponsored and local govern-ment sponsored defined contribution arrangements. Forthe most part, the liabilities related to these arrangementsare funded in the period they arise. The Company’sexpenses for these plans were not material for all yearspresented.
F-30S O N O C O 2 0 1 8 A N N U A L R E P O R TS O N O C O 2 0 1 8 A N N U A L R E P O R T I F O R M 1 0 - K
14. Income taxesThe provision for taxes on income for the years ended
December 31 consists of the following:
2018 2017 2016
Pretax incomeDomestic $225,442 $168,180 $318,702Foreign 153,089 146,374 122,575
Total pretax income $378,531 $314,554 $441,277
CurrentFederal $ 37,345 $120,398 $110,567State 6,164 5,623 10,808Foreign 38,648 40,328 40,788
Total current $ 82,157 $166,349 $162,163
DeferredFederal $ (5,571) $ (16,797) $ (861)State (738) $ 3,499 (869)Foreign (840) (6,462) 4,198
Total deferred $ (7,149) $ (19,760) $ 2,468
Total taxes $ 75,008 $146,589 $164,631
Deferred tax liabilities/(assets) are comprised of thefollowing at December 31:
2018 2017
Property, plant and equipment $ 102,007 $ 83,584Intangibles 178,883 174,395
Gross deferred tax liabilities $ 280,890 $ 257,979
Retiree health benefits $ (2,989) $ 595Foreign loss carryforwards (57,581) (59,975)U.S. Federal loss and credit
carryforwards (86,655) (17,977)Capital loss carryforwards (2,757) —Employee benefits (114,872) (115,771)Accrued liabilities and other (102,349) (100,031)
Gross deferred tax assets $(367,203) $(293,159)
Valuation allowance on deferred taxassets $ 103,289 $ 47,200
Total deferred taxes, net $ 16,976 $ 12,020
The Company has total federal net operating loss carry-forwards of approximately $67,700 remaining atDecember 31, 2018. These losses are limited based uponfuture taxable earnings of the respective entities andexpire between 2030 and 2037. U.S. foreign tax creditcarryforwards of approximately $71,800 exist atDecember 31, 2018 and expire in 2027. Foreign sub-sidiary loss carryforwards of approximately $226,700remain at December 31, 2018. Their use is limited tofuture taxable earnings of the respective foreign sub-sidiaries or filing groups. Approximately $207,500 of theseloss carryforwards do not have an expiration date. Of theremaining foreign subsidiary loss carryforwards, approx-imately $8,800 expire within the next five years andapproximately $10,400 expire between 2024 and 2037.Foreign subsidiary capital loss carryforwards of approx-imately $15,700 exist at December 31, 2018 and do nothave an expiration date. Their use is limited to future capi-tal gains of the respective foreign subsidiaries.
Approximately $10,500 in tax value of state loss carry-forwards and $17,300 of state credit carryforwards remainat December 31, 2018. These state loss and credit carry-forwards are limited based upon future taxable earnings ofthe respective entities and expire between 2019 and2038. State loss and credit carryforwards are reflected attheir “tax” value, as opposed to the amount of expectedgross deduction due to the vastly different apportionmentand statutory tax rates applicable to the various entitiesand states in which they file.
A reconciliation of the U.S. federal statutory tax rate to the actual consolidated tax expense is as follows:
2018 2017 2016
Statutory tax rate $ 79,491 21.0% $110,094 35.0% $154,447 35.0%State income taxes, net of federal tax benefit 7,534 2.0% 4,780 1.5% 7,477 1.7%Valuation allowance (14,902) (3.9)% (3,333) (1.1)% 639 0.1%Tax examinations including change in reserve for uncertain tax
positions (3,076) (0.8)% 4,895 1.6% 732 0.2%Adjustments to prior year deferred taxes (1,899) (0.5)% (1,415) (0.4)% (2,401) (0.5)%Foreign earnings taxed at other than U.S. rates 8,224 2.2% (16,233) (5.2)% (15,930) (3.6)%Disposition of business — —% 537 0.2% 22,810 5.2%Effect of tax rate changes (6,218) (1.6)% (22,183) (7.1)% 2,517 0.6%Deduction related to qualified production activities 341 0.1% (5,384) (1.7)% (5,215) (1.2)%Transition tax 3,647 1.0% 76,933 24.5% — —%Tax credits (10,083) (2.7)% (1,197) (0.4)% (1,100) (0.2)%Global intangible low-taxed income (GILTI) 12,878 3.4% — —% — —%Foreign-derived intangible income (1,174) (0.3)% — — — —Other, net 245 0.1% (905) (0.3)% 655 0.1%
Total taxes $ 75,008 19.8% $146,589 46.6% $164,631 37.3%
F-31S O N O C O 2 0 1 8 A N N U A L R E P O R TS O N O C O 2 0 1 8 A N N U A L R E P O R T I F O R M 1 0 - K
On December 22, 2017, the Tax Cuts and Jobs Act(“Tax Act”) was signed into law making significant changesto the Internal Revenue Code. Changes provided by theTax Act included a corporate tax rate decrease from 35%to 21% effective for tax years beginning afterDecember 31, 2017, a change in methodology for taxationof earnings from non-US operations, and a one-time tran-sition tax on certain accumulated foreign earnings as ofDecember 31, 2017. As a result of the Tax Act, the SECstaff issued Staff Accounting Bulletin No. 118 (“SAB 118”)to address the application of U.S. GAAP in situationswhere a registrant does not have the necessaryinformation available, prepared, or analyzed (includingcomputations) in reasonable detail to complete theaccounting for certain income tax effects of the Tax Act.As explained below, the Company has finalized the provi-sional tax impacts related to the one-time transition taxand the revaluation of deferred tax assets and liabilities,recognized the additional impact in its consolidated finan-cial statements for the year ended December 31, 2018,and finalized its indefinite reinvestment assertion.
The Company has recorded $4,152 of additional bene-fit related to applying the decrease in the corporate taxrate to deferred income taxes and $3,647 of additionalincome tax expense related to the one-time transition tax.The total amount of the one-time transition tax on certainaccumulated foreign earnings was $80,580. Under theprovisions of the Tax Act, the transition tax is payable ininstallments over a period of 8 years. The first installmentwas paid in 2018 with the filing of the Company’s 2017federal income tax return. The second installment, dueduring 2019, has been paid using the Company’s regular2018 estimated federal tax installments and the liability isfurther reduced by the deemed overpayment of federalincome taxes. The remaining obligation of $61,777 isincluded in “Other Liabilities” in the Company’s Con-solidated Balance Sheet at December 31, 2018.
The change in “Tax examinations including change inreserve for uncertain tax positions” is shown net of asso-ciated deferred taxes and accrued interest. Included in thechange are net increases in reserves for uncertain taxpositions of approximately $1,700, $2,600 and $3,000 foruncertain items arising in 2018, 2017 and 2016,respectively, combined with adjustments related to prioryear items, primarily decreases related to lapses of stat-utes of limitations in international, federal and state juris-dictions as well as overall changes in facts and judgment.These adjustments decreased the reserve by a total ofapproximately $(2,900), $(2,300) and $(2,300) in 2018,2017 and 2016, respectively.
In many of the countries in which the Company oper-ates, earnings are taxed at rates different than in the U.S.This difference is reflected in “Foreign earnings taxed atother than U.S. rates” along with other items, if any, thatimpacted taxes on foreign earnings in the periods pre-sented.
The effect on tax expense for “Disposition of business”in 2016 relates to the sale of the Company’s rigid plasticblow molding operations, its retail security packagingoperation in Juncos, Puerto Rico, and its paper mill inFrance. The above adjustment reflects the recognition oftax gains in excess of book gains due to basis differences,and losses on which no future tax benefit will be recog-nized.
The benefits included in “Adjustments to prior yeardeferred taxes” for each of the years presented consistprimarily of adjustments to deferred tax assets andliabilities arising from changes in estimates. The benefitsincluded in the “Effect of tax rate changes enacted duringthe year” for 2018 includes adjustments to the 2017 bene-fits related to the revaluation of deferred tax assets andliabilities due to the enactment of the Tax Act as well aschanges in state, local and foreign tax rates. The 2017benefit relates primarily to changes made as a result of theTax Act.
The benefits included in “Valuation allowance” include abenefit of $16,100 related to the revaluation of the valu-ation allowance on foreign tax credits due to the Tax Act.
Of the $10,083 of tax credits for 2018, $8,319 directlyoffsets the $12,878 of GILTI tax, resulting in a net GILTItax of $4,559.
The Company maintains its assertion that its undis-tributed foreign earnings are indefinitely reinvested and,accordingly, has not recorded any deferred income taxliabilities that would be due if those earnings were repa-triated. As of December 31, 2018, these undistributedearnings total $868,395. While the majority of these earn-ings have already been taxed in the U.S., a portion wouldbe subject to foreign withholding and U.S. income taxesand credits if distributed. The tax cost is not practical todetermine.
Reserve for uncertain tax positionsThe following table sets forth the reconciliation of the
gross amounts of unrecognized tax benefits at the begin-ning and ending of the periods indicated:
2018 2017 2016
Gross Unrecognized TaxBenefits at January 1 $17,100 $17,700 $17,200
Increases in prior years’unrecognized taxbenefits — 700 1,400
Decreases in prior years’unrecognized taxbenefits (700) (2,400) (3,500)
Increases in current year’sunrecognized taxbenefits 1,200 1,600 3,000
Decreases in unrecognizedtax benefits from thelapse of statutes oflimitations (2,600) (300) (100)
Settlements (600) (200) (300)
Gross Unrecognized TaxBenefits at December 31 $14,400 $17,100 $17,700
Of the unrecognized tax benefit balances atDecember 31, 2018 and December 31, 2017, approx-imately $13,500 and $15,500, respectively, would have animpact on the effective tax rate if ultimately recognized.
Interest and/or penalties related to income taxes arereported as part of income tax expense. The Companyhad approximately $2,100 and $2,300 accrued for interestrelated to uncertain tax positions at December 31, 2018and December 31, 2017, respectively. Tax expense for theyear ended December 31, 2018, includes approximately$200 of interest benefit, which is comprised of an interest
F-32S O N O C O 2 0 1 8 A N N U A L R E P O R TS O N O C O 2 0 1 8 A N N U A L R E P O R T I F O R M 1 0 - K
benefit of approximately $700 related to the adjustment ofprior years’ items and interest expense of $500 onunrecognized tax benefits. The amounts listed above foraccrued interest and interest expense do not reflect thebenefit of a federal tax deduction which would be availableif the interest were ultimately paid.
The Company and/or its subsidiaries file federal, stateand local income tax returns in the United States and vari-ous foreign jurisdictions. With few exceptions, the Com-pany is no longer subject to income tax examinations bytax authorities for years before 2012.
The Company believes that it is reasonably possiblethat the amount reserved for uncertain tax positions atDecember 31, 2018 will decrease by approximately$2,600 over the next twelve months. This change includesthe anticipated increase in reserves related to existingpositions offset by settlements of issues currently underexamination and the release of existing reserves due to theexpiration of the statute of limitations. Although theCompany’s estimate for the potential outcome for anyuncertain tax issue is highly judgmental, managementbelieves that any reasonably foreseeable outcomes relatedto these matters have been adequately provided for.However, future results may include favorable orunfavorable adjustments to estimated tax liabilities in theperiod the assessments are made or resolved or whenstatutes of limitation on potential assessments expire.Additionally, the jurisdictions in which earnings ordeductions are realized may differ from current estimates.As a result, the effective tax rate may fluctuate significantlyon a quarterly basis. The Company has operations inmany countries outside of the United States and the taxespaid on those earnings are subject to varying rates. TheCompany is not dependent upon the favorable benefit ofany one jurisdiction to an extent that loss of those benefitswould have a material effect on the Company’s overalleffective tax rate.
As previously disclosed, the Company received a draftNotice of Proposed Adjustment (“NOPA”) from the InternalRevenue Service (IRS) in February 2017 proposing anadjustment to income for the 2013 tax year based on theIRS’s recharacterization of a distribution of an inter-company note made in 2012, and the subsequent repay-ment of the note over the course of 2013, as if it were acash distribution made in 2013. In March 2017, theCompany received a draft NOPA proposing penalties of$18,000 associated with the IRS’s recharacterization, aswell as an Information Document Request (“IDR”) request-ing the Company’s analysis of why such penalties shouldnot apply. The Company responded to this IDR in April2017. On October 5, 2017, the Company received tworevised draft NOPAs proposing the same adjustments andpenalties as in the prior NOPAs. On November 14, 2017,the Company received two final NOPAs proposing thesame adjustments and penalties as in the prior draftNOPAs. On November 20, 2017, the Company received aRevenue Agent’s Report (“RAR”) that included the sameadjustments and penalties as in the prior NOPAs. At thetime of the distribution in 2012, it was characterized as adividend to the extent of earnings and profits, with theremainder as a tax free return of basis and taxable capitalgain. As the IRS proposes to recharacterize the dis-tribution, the entire distribution would be characterized asa dividend. The incremental tax liability associated with the
income adjustment proposed in the RAR would be approx-imately $89,000, excluding interest and the previouslyreferenced penalties. On January 22, 2018, the Companyfiled a protest to the proposed deficiency with the IRS. TheCompany received a rebuttal of its protest from the IRS onJuly 10, 2018, and the matter has now been referred tothe Appeals Division of the IRS. The Company stronglybelieves the position of the IRS with regard to this matteris inconsistent with applicable tax laws and existing Treas-ury regulations, and that the Company’s previouslyreported income tax provision for the year in question isappropriate. However, there can be no assurance that thismatter will be resolved in the Company’s favor. Regardlessof whether the matter is resolved in the Company’s favor,the final resolution of this matter could be expensive andtime consuming to defend and/or settle. While the Com-pany believes that the amount of tax originally paid withrespect to this distribution is correct, and accordingly hasnot provided additional reserve for tax uncertainty, there isstill a possibility that an adverse outcome of the mattercould have a material effect on its results of operationsand financial condition.
In January 2018, the FASB released guidance onaccounting for the global intangible low-taxed income(“GILTI”) provisions of the Tax Act. The GILTI provisionsimpose a tax on foreign income in excess of a deemedreturn on tangible assets of foreign corporations. Theguidance indicates that, subject to an accounting policyelection, it will be acceptable to either recognize deferredtaxes for temporary differences expected to reverse asGILTI or treat the effects of such a reversal as a currenttax item if and when incurred. The Company has electedthe current method, and will recognize GILTI tax liability asa current tax item in future periods when incurred.
15. Revenue recognitionThe Company adopted ASC 606, “Revenue from Con-
tracts with Customers,” as of January 1, 2018. The impactof the adoption was the recognition of a $1,721 increasein the Company’s beginning retained earnings. See impactof adoption in Note 3 and additional discussion in Note 2to these consolidated financial statements.
The Company records revenue when control is trans-ferred to the customer, which is either upon shipment orover time in cases where the Company is entitled topayment with margin for products produced that are cus-tomer specific without alternative use. The Companyrecognizes over time revenue under the input method asgoods are produced. Revenue that is recognized at apoint in time is recognized when the customer obtainscontrol of the goods. Customers obtain control eitherwhen goods are delivered to the customer facility, if theCompany is responsible for arranging transportation, orwhen picked up by the customer’s designated carrier. TheCompany commonly enters into Master Supply Arrange-ments (MSA) with customers to provide goods and/orservices over specific time periods. Customers submitpurchase orders with quantities and prices to create acontract for accounting purposes. Shipping and handlingexpenses are included in “Cost of Sales,” and freightcharged to customers is included in “Net Sales” in theCompany’s Consolidated Statements of Income.
The Company has rebate agreements with certaincustomers. These rebates are recorded as reductions of
F-33S O N O C O 2 0 1 8 A N N U A L R E P O R TS O N O C O 2 0 1 8 A N N U A L R E P O R T I F O R M 1 0 - K
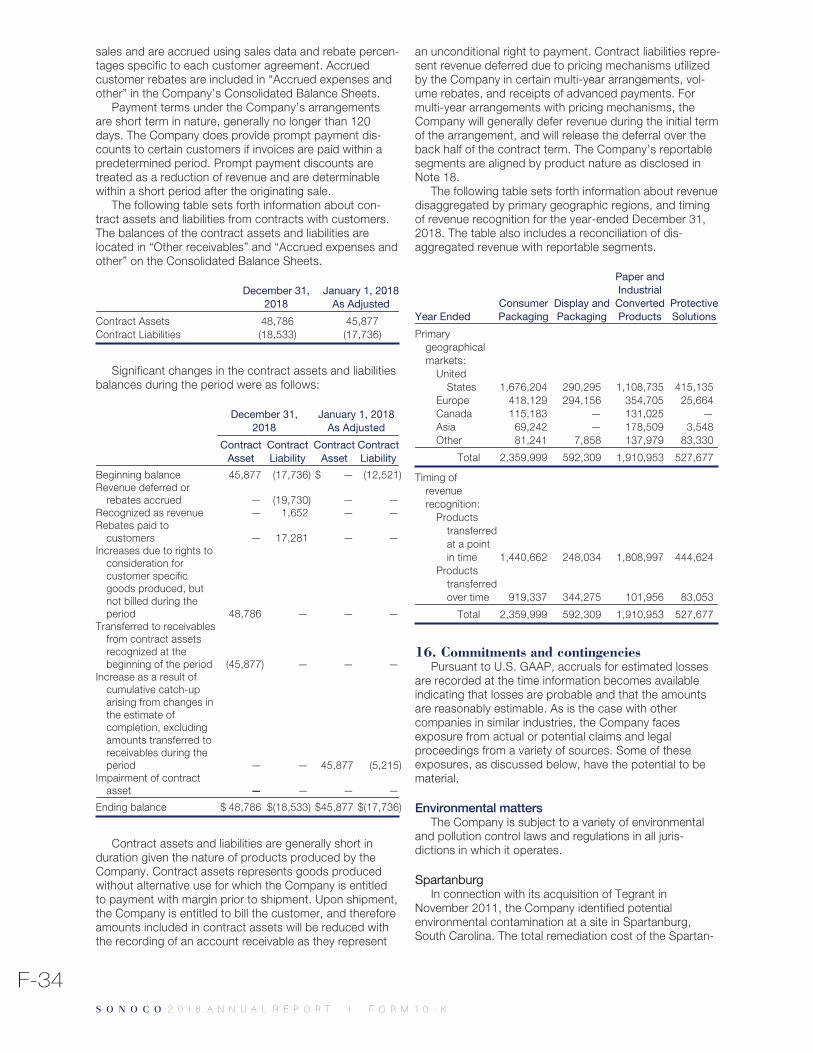
sales and are accrued using sales data and rebate percen-tages specific to each customer agreement. Accruedcustomer rebates are included in “Accrued expenses andother” in the Company’s Consolidated Balance Sheets.
Payment terms under the Company’s arrangementsare short term in nature, generally no longer than 120days. The Company does provide prompt payment dis-counts to certain customers if invoices are paid within apredetermined period. Prompt payment discounts aretreated as a reduction of revenue and are determinablewithin a short period after the originating sale.
The following table sets forth information about con-tract assets and liabilities from contracts with customers.The balances of the contract assets and liabilities arelocated in “Other receivables” and “Accrued expenses andother” on the Consolidated Balance Sheets.
December 31,2018
January 1, 2018As Adjusted
Contract Assets 48,786 45,877Contract Liabilities (18,533) (17,736)
Significant changes in the contract assets and liabilitiesbalances during the period were as follows:
December 31,2018
January 1, 2018As Adjusted
ContractAsset
ContractLiability
ContractAsset
ContractLiability
Beginning balance 45,877 (17,736) $ — (12,521)Revenue deferred or
rebates accrued — (19,730) — —Recognized as revenue — 1,652 — —Rebates paid to
customers — 17,281 — —Increases due to rights to
consideration forcustomer specificgoods produced, butnot billed during theperiod 48,786 — — —
Transferred to receivablesfrom contract assetsrecognized at thebeginning of the period (45,877) — — —
Increase as a result ofcumulative catch-uparising from changes inthe estimate ofcompletion, excludingamounts transferred toreceivables during theperiod — — 45,877 (5,215)
Impairment of contractasset — — — —
Ending balance $ 48,786 $(18,533) $45,877 $(17,736)
Contract assets and liabilities are generally short induration given the nature of products produced by theCompany. Contract assets represents goods producedwithout alternative use for which the Company is entitledto payment with margin prior to shipment. Upon shipment,the Company is entitled to bill the customer, and thereforeamounts included in contract assets will be reduced withthe recording of an account receivable as they represent
an unconditional right to payment. Contract liabilities repre-sent revenue deferred due to pricing mechanisms utilizedby the Company in certain multi-year arrangements, vol-ume rebates, and receipts of advanced payments. Formulti-year arrangements with pricing mechanisms, theCompany will generally defer revenue during the initial termof the arrangement, and will release the deferral over theback half of the contract term. The Company’s reportablesegments are aligned by product nature as disclosed inNote 18.
The following table sets forth information about revenuedisaggregated by primary geographic regions, and timingof revenue recognition for the year-ended December 31,2018. The table also includes a reconciliation of dis-aggregated revenue with reportable segments.
Year EndedConsumerPackaging
Display andPackaging
Paper andIndustrial
ConvertedProducts
ProtectiveSolutions
Primarygeographicalmarkets:
UnitedStates 1,676,204 290,295 1,108,735 415,135
Europe 418,129 294,156 354,705 25,664Canada 115,183 — 131,025 —Asia 69,242 — 178,509 3,548Other 81,241 7,858 137,979 83,330
Total 2,359,999 592,309 1,910,953 527,677
Timing ofrevenuerecognition:
Productstransferredat a pointin time 1,440,662 248,034 1,808,997 444,624
Productstransferredover time 919,337 344,275 101,956 83,053
Total 2,359,999 592,309 1,910,953 527,677
16. Commitments and contingenciesPursuant to U.S. GAAP, accruals for estimated losses
are recorded at the time information becomes availableindicating that losses are probable and that the amountsare reasonably estimable. As is the case with othercompanies in similar industries, the Company facesexposure from actual or potential claims and legalproceedings from a variety of sources. Some of theseexposures, as discussed below, have the potential to bematerial.
Environmental mattersThe Company is subject to a variety of environmental
and pollution control laws and regulations in all juris-dictions in which it operates.
SpartanburgIn connection with its acquisition of Tegrant in
November 2011, the Company identified potentialenvironmental contamination at a site in Spartanburg,South Carolina. The total remediation cost of the Spartan-
F-34S O N O C O 2 0 1 8 A N N U A L R E P O R TS O N O C O 2 0 1 8 A N N U A L R E P O R T I F O R M 1 0 - K
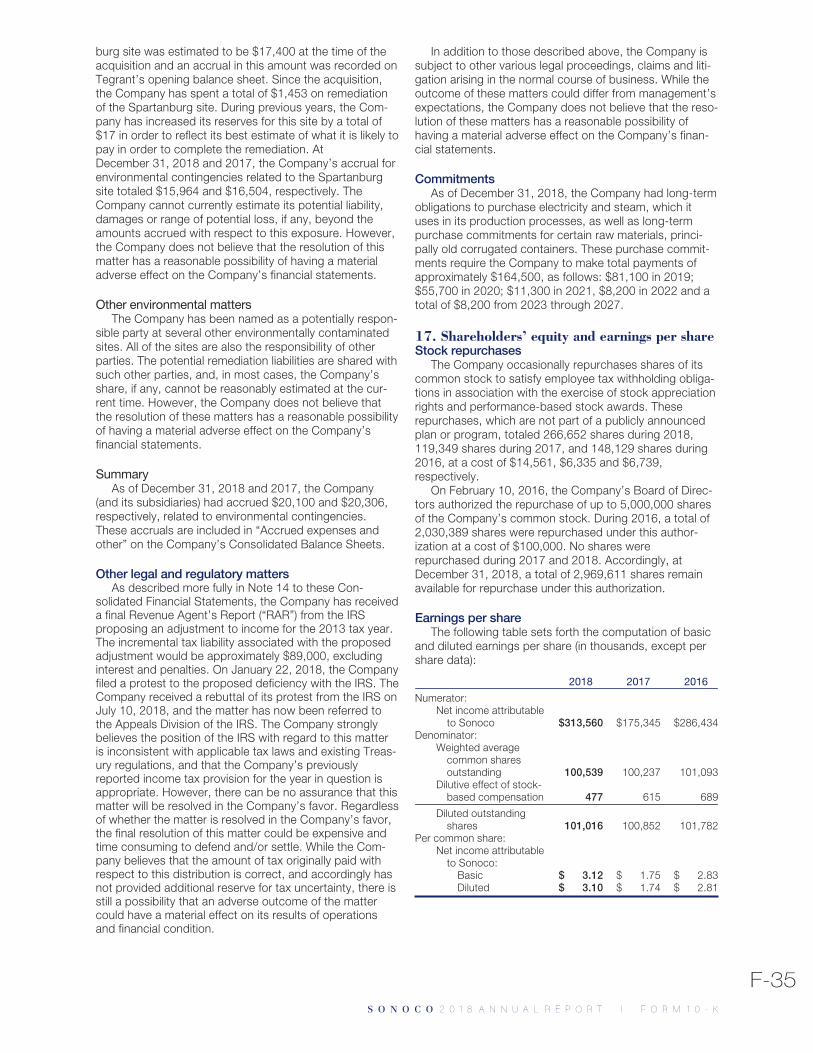
burg site was estimated to be $17,400 at the time of theacquisition and an accrual in this amount was recorded onTegrant’s opening balance sheet. Since the acquisition,the Company has spent a total of $1,453 on remediationof the Spartanburg site. During previous years, the Com-pany has increased its reserves for this site by a total of$17 in order to reflect its best estimate of what it is likely topay in order to complete the remediation. AtDecember 31, 2018 and 2017, the Company’s accrual forenvironmental contingencies related to the Spartanburgsite totaled $15,964 and $16,504, respectively. TheCompany cannot currently estimate its potential liability,damages or range of potential loss, if any, beyond theamounts accrued with respect to this exposure. However,the Company does not believe that the resolution of thismatter has a reasonable possibility of having a materialadverse effect on the Company’s financial statements.
Other environmental mattersThe Company has been named as a potentially respon-
sible party at several other environmentally contaminatedsites. All of the sites are also the responsibility of otherparties. The potential remediation liabilities are shared withsuch other parties, and, in most cases, the Company’sshare, if any, cannot be reasonably estimated at the cur-rent time. However, the Company does not believe thatthe resolution of these matters has a reasonable possibilityof having a material adverse effect on the Company’sfinancial statements.
SummaryAs of December 31, 2018 and 2017, the Company
(and its subsidiaries) had accrued $20,100 and $20,306,respectively, related to environmental contingencies.These accruals are included in “Accrued expenses andother” on the Company’s Consolidated Balance Sheets.
Other legal and regulatory mattersAs described more fully in Note 14 to these Con-
solidated Financial Statements, the Company has receiveda final Revenue Agent’s Report (“RAR”) from the IRSproposing an adjustment to income for the 2013 tax year.The incremental tax liability associated with the proposedadjustment would be approximately $89,000, excludinginterest and penalties. On January 22, 2018, the Companyfiled a protest to the proposed deficiency with the IRS. TheCompany received a rebuttal of its protest from the IRS onJuly 10, 2018, and the matter has now been referred tothe Appeals Division of the IRS. The Company stronglybelieves the position of the IRS with regard to this matteris inconsistent with applicable tax laws and existing Treas-ury regulations, and that the Company’s previouslyreported income tax provision for the year in question isappropriate. However, there can be no assurance that thismatter will be resolved in the Company’s favor. Regardlessof whether the matter is resolved in the Company’s favor,the final resolution of this matter could be expensive andtime consuming to defend and/or settle. While the Com-pany believes that the amount of tax originally paid withrespect to this distribution is correct, and accordingly hasnot provided additional reserve for tax uncertainty, there isstill a possibility that an adverse outcome of the mattercould have a material effect on its results of operationsand financial condition.
In addition to those described above, the Company issubject to other various legal proceedings, claims and liti-gation arising in the normal course of business. While theoutcome of these matters could differ from management’sexpectations, the Company does not believe that the reso-lution of these matters has a reasonable possibility ofhaving a material adverse effect on the Company’s finan-cial statements.
CommitmentsAs of December 31, 2018, the Company had long-term
obligations to purchase electricity and steam, which ituses in its production processes, as well as long-termpurchase commitments for certain raw materials, princi-pally old corrugated containers. These purchase commit-ments require the Company to make total payments ofapproximately $164,500, as follows: $81,100 in 2019;$55,700 in 2020; $11,300 in 2021, $8,200 in 2022 and atotal of $8,200 from 2023 through 2027.
17. Shareholders’ equity and earnings per shareStock repurchases
The Company occasionally repurchases shares of itscommon stock to satisfy employee tax withholding obliga-tions in association with the exercise of stock appreciationrights and performance-based stock awards. Theserepurchases, which are not part of a publicly announcedplan or program, totaled 266,652 shares during 2018,119,349 shares during 2017, and 148,129 shares during2016, at a cost of $14,561, $6,335 and $6,739,respectively.
On February 10, 2016, the Company’s Board of Direc-tors authorized the repurchase of up to 5,000,000 sharesof the Company’s common stock. During 2016, a total of2,030,389 shares were repurchased under this author-ization at a cost of $100,000. No shares wererepurchased during 2017 and 2018. Accordingly, atDecember 31, 2018, a total of 2,969,611 shares remainavailable for repurchase under this authorization.
Earnings per shareThe following table sets forth the computation of basic
and diluted earnings per share (in thousands, except pershare data):
2018 2017 2016
Numerator:Net income attributable
to Sonoco $313,560 $175,345 $286,434Denominator:
Weighted averagecommon sharesoutstanding 100,539 100,237 101,093
Dilutive effect of stock-based compensation 477 615 689
Diluted outstandingshares 101,016 100,852 101,782
Per common share:Net income attributable
to Sonoco:Basic $ 3.12 $ 1.75 $ 2.83Diluted $ 3.10 $ 1.74 $ 2.81
F-35S O N O C O 2 0 1 8 A N N U A L R E P O R TS O N O C O 2 0 1 8 A N N U A L R E P O R T I F O R M 1 0 - K
No adjustments were made to reported net income inthe computation of earnings per share.
The Company paid dividends totaling $1.62, $1.54,and $1.46 per share in 2018, 2017 and 2016,respectively.
Potentially dilutive securities are calculated in accord-ance with the treasury stock method, which assumes theproceeds from the exercise of all dilutive stock apprecia-tion rights (SARs) are used to repurchase the Company’scommon stock. Certain SARs are not dilutive becauseeither the exercise price is greater than the average mar-ket price of the stock during the reporting period orassumed repurchases from proceeds from the exercise ofthe SARs were antidilutive.
The average number of shares that were not dilutiveand therefore not included in the computation of dilutedincome per share was as follows for the years endedDecember 31, 2018, 2017 and 2016 (in thousands):
2018 2017 2016
Anti-dilutive stock appreciation rights 786 487 357
These stock appreciation rights may become dilutive infuture periods if the market price of the Company’scommon stock appreciates.
Noncontrolling interestsIn 1994, the Company entered into a joint venture
agreement with two partners in Asia for the manufacturingand marketing of products in the Asian markets. Prior toDecember 31, 2018, the Company owned a controllinginterest of 79.25% of the joint venture and consolidatedthe net assets of the Asia joint venture. On December 31,2018, the Company acquired the 19.08% ownership inter-est of PFE Hong Kong Limited, one of the joint venturepartners, for $35,000 in cash, bringing the Company’stotal ownership in the Asia joint venture to 98.33%. As aresult of the purchase, the Company wrote off the$11,695 book value of the noncontrolling interest andrecorded a $23,305 reduction in Capital in Excess ofStated Value. One of the Company’s directors, Harry A.Cockrell, is a principal shareholder of PFE Hong KongLimited.
On October 1, 2018, the Company completed theacquisition of the remaining 70% interest in ConitexSonoco (see Note 4). The acquisition of Conitex Sonocoincluded joint ventures in Indonesia and China in which theCompany owns a controlling interest. The noncontrollinginterests relating to these joint ventures were recorded onthe opening balance sheet at their fair value of $2,655.
During the third quarter of 2017, the Companyrecorded a $1,341 noncontrolling interest related to thecreation of a joint venture for the manufacture of tubesand cores from a facility in Saudi Arabia. The Companyowns a 51% share in the joint venture and the assets havebeen consolidated.
18. Segment reportingThe Company reports its financial results in four report-
able segments – Consumer Packaging, Display and Pack-aging, Paper and Industrial Converted Products, andProtective Solutions.
The Consumer Packaging segment includes the follow-ing products and services: round and shaped rigidcontainers and trays (both composite and thermoformedplastic); extruded and injection-molded plastic products;printed flexible packaging; global brand artwork manage-ment; and metal and peelable membrane ends and clo-sures. This segment also included blow-molded plasticbottles and jars through November 7, 2016, when theCompany completed the sale of its rigid plastics blowmolding operations.
The Display and Packaging segment includes the follow-ing products and services: designing, manufacturing,assembling, packing and distributing temporary, semi-permanent and permanent point-of-purchase displays;supply chain management services, including contractpacking, fulfillment and scalable service centers; retailpackaging, including printed backer cards, thermoformedblisters and heat sealing equipment; and paper amenities,such as coasters and glass covers.
The Paper and Industrial Converted Products segmentincludes the following products: paperboard tubes andcores; fiber-based construction tubes and forms; wooden,metal and composite wire and cable reels and spools; andrecycled paperboard, linerboard, corrugating medium,recovered paper and material recycling services.
The Protective Solutions segment includes the follow-ing products: custom-engineered paperboard-based andexpanded foam protective packaging and components;and temperature-assurance packaging.
Restructuring charges, asset impairment charges,gains from the disposition of businesses, insurancesettlement gains, acquisition-related costs, pensionsettlement charges, interest expense and interest incomeare included in income before income taxes under“Corporate.”
F-36S O N O C O 2 0 1 8 A N N U A L R E P O R TS O N O C O 2 0 1 8 A N N U A L R E P O R T I F O R M 1 0 - K
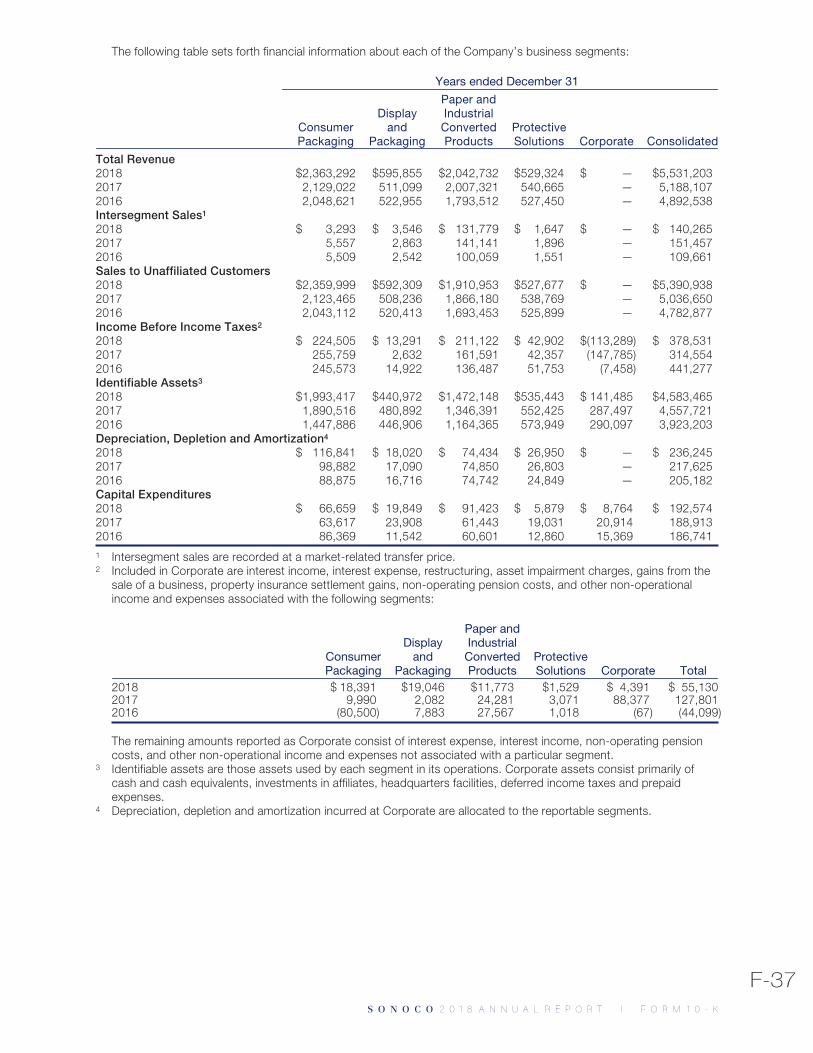
The following table sets forth financial information about each of the Company’s business segments:
Years ended December 31
ConsumerPackaging
Displayand
Packaging
Paper andIndustrialConvertedProducts
ProtectiveSolutions Corporate Consolidated
Total Revenue2018 $2,363,292 $595,855 $2,042,732 $529,324 $ — $5,531,2032017 2,129,022 511,099 2,007,321 540,665 — 5,188,1072016 2,048,621 522,955 1,793,512 527,450 — 4,892,538Intersegment Sales1
2018 $ 3,293 $ 3,546 $ 131,779 $ 1,647 $ — $ 140,2652017 5,557 2,863 141,141 1,896 — 151,4572016 5,509 2,542 100,059 1,551 — 109,661Sales to Unaffiliated Customers2018 $2,359,999 $592,309 $1,910,953 $527,677 $ — $5,390,9382017 2,123,465 508,236 1,866,180 538,769 — 5,036,6502016 2,043,112 520,413 1,693,453 525,899 — 4,782,877Income Before Income Taxes2
2018 $ 224,505 $ 13,291 $ 211,122 $ 42,902 $(113,289) $ 378,5312017 255,759 2,632 161,591 42,357 (147,785) 314,5542016 245,573 14,922 136,487 51,753 (7,458) 441,277Identifiable Assets3
2018 $1,993,417 $440,972 $1,472,148 $535,443 $ 141,485 $4,583,4652017 1,890,516 480,892 1,346,391 552,425 287,497 4,557,7212016 1,447,886 446,906 1,164,365 573,949 290,097 3,923,203Depreciation, Depletion and Amortization4
2018 $ 116,841 $ 18,020 $ 74,434 $ 26,950 $ — $ 236,2452017 98,882 17,090 74,850 26,803 — 217,6252016 88,875 16,716 74,742 24,849 — 205,182Capital Expenditures2018 $ 66,659 $ 19,849 $ 91,423 $ 5,879 $ 8,764 $ 192,5742017 63,617 23,908 61,443 19,031 20,914 188,9132016 86,369 11,542 60,601 12,860 15,369 186,7411 Intersegment sales are recorded at a market-related transfer price.2 Included in Corporate are interest income, interest expense, restructuring, asset impairment charges, gains from the
sale of a business, property insurance settlement gains, non-operating pension costs, and other non-operationalincome and expenses associated with the following segments:
ConsumerPackaging
Displayand
Packaging
Paper andIndustrial
ConvertedProducts
ProtectiveSolutions Corporate Total
2018 $ 18,391 $19,046 $11,773 $1,529 $ 4,391 $ 55,1302017 9,990 2,082 24,281 3,071 88,377 127,8012016 (80,500) 7,883 27,567 1,018 (67) (44,099)
The remaining amounts reported as Corporate consist of interest expense, interest income, non-operating pensioncosts, and other non-operational income and expenses not associated with a particular segment.
3 Identifiable assets are those assets used by each segment in its operations. Corporate assets consist primarily ofcash and cash equivalents, investments in affiliates, headquarters facilities, deferred income taxes and prepaidexpenses.
4 Depreciation, depletion and amortization incurred at Corporate are allocated to the reportable segments.
F-37S O N O C O 2 0 1 8 A N N U A L R E P O R TS O N O C O 2 0 1 8 A N N U A L R E P O R T I F O R M 1 0 - K
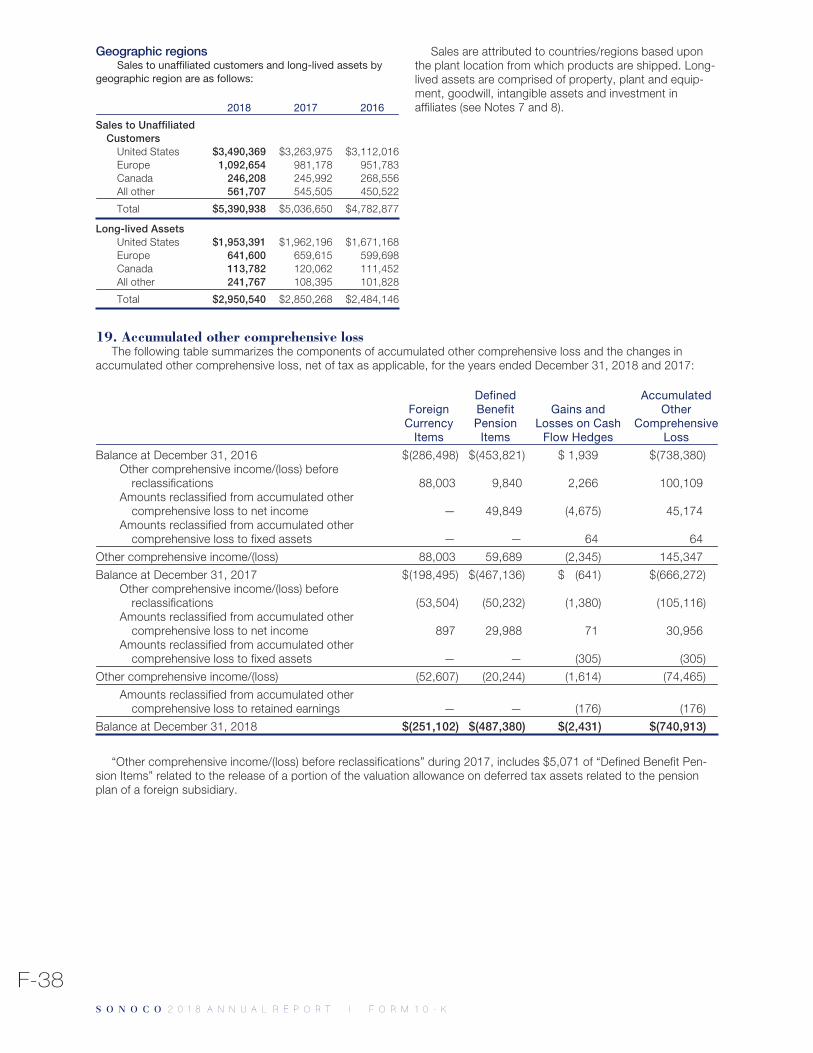
Geographic regionsSales to unaffiliated customers and long-lived assets by
geographic region are as follows:
2018 2017 2016
Sales to UnaffiliatedCustomers
United States $3,490,369 $3,263,975 $3,112,016Europe 1,092,654 981,178 951,783Canada 246,208 245,992 268,556All other 561,707 545,505 450,522
Total $5,390,938 $5,036,650 $4,782,877
Long-lived AssetsUnited States $1,953,391 $1,962,196 $1,671,168Europe 641,600 659,615 599,698Canada 113,782 120,062 111,452All other 241,767 108,395 101,828
Total $2,950,540 $2,850,268 $2,484,146
Sales are attributed to countries/regions based uponthe plant location from which products are shipped. Long-lived assets are comprised of property, plant and equip-ment, goodwill, intangible assets and investment inaffiliates (see Notes 7 and 8).
19. Accumulated other comprehensive lossThe following table summarizes the components of accumulated other comprehensive loss and the changes in
accumulated other comprehensive loss, net of tax as applicable, for the years ended December 31, 2018 and 2017:
ForeignCurrency
Items
DefinedBenefitPension
Items
Gains andLosses on Cash
Flow Hedges
AccumulatedOther
ComprehensiveLoss
Balance at December 31, 2016 $(286,498) $(453,821) $ 1,939 $(738,380)Other comprehensive income/(loss) before
reclassifications 88,003 9,840 2,266 100,109Amounts reclassified from accumulated other
comprehensive loss to net income — 49,849 (4,675) 45,174Amounts reclassified from accumulated other
comprehensive loss to fixed assets — — 64 64
Other comprehensive income/(loss) 88,003 59,689 (2,345) 145,347
Balance at December 31, 2017 $(198,495) $(467,136) $ (641) $(666,272)Other comprehensive income/(loss) before
reclassifications (53,504) (50,232) (1,380) (105,116)Amounts reclassified from accumulated other
comprehensive loss to net income 897 29,988 71 30,956Amounts reclassified from accumulated other
comprehensive loss to fixed assets — — (305) (305)
Other comprehensive income/(loss) (52,607) (20,244) (1,614) (74,465)
Amounts reclassified from accumulated othercomprehensive loss to retained earnings — — (176) (176)
Balance at December 31, 2018 $(251,102) $(487,380) $(2,431) $(740,913)
“Other comprehensive income/(loss) before reclassifications” during 2017, includes $5,071 of “Defined Benefit Pen-sion Items” related to the release of a portion of the valuation allowance on deferred tax assets related to the pensionplan of a foreign subsidiary.
F-38S O N O C O 2 0 1 8 A N N U A L R E P O R TS O N O C O 2 0 1 8 A N N U A L R E P O R T I F O R M 1 0 - K
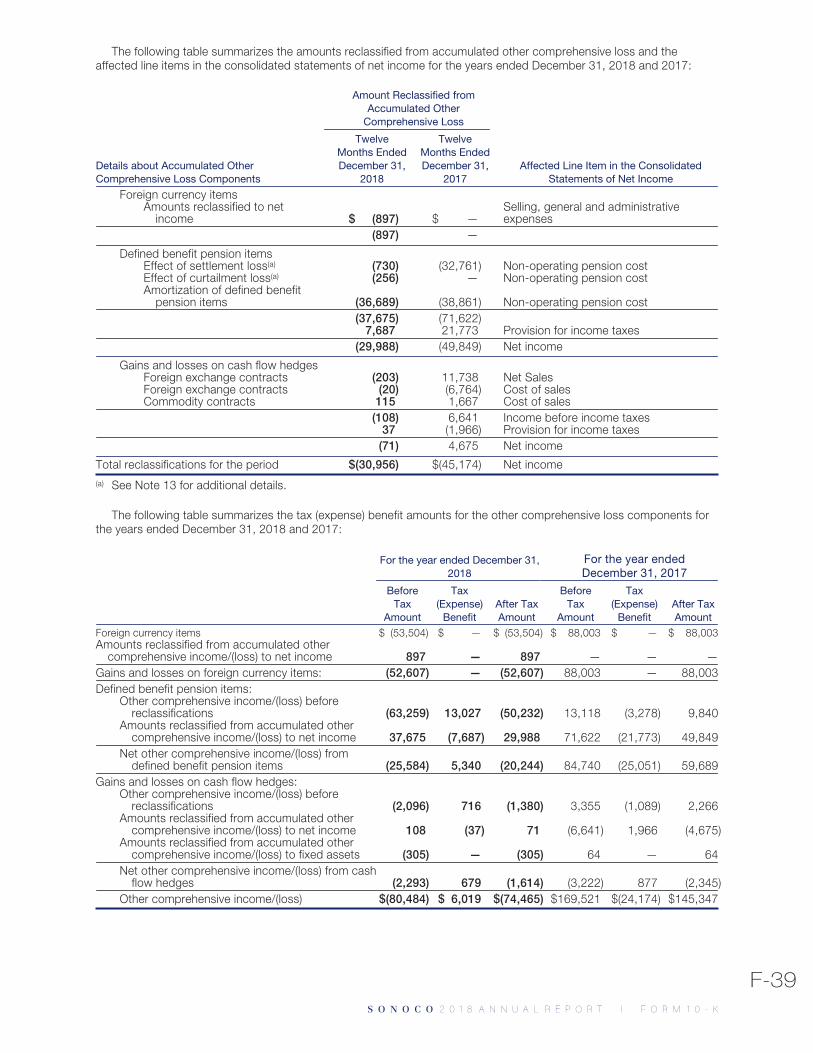
The following table summarizes the amounts reclassified from accumulated other comprehensive loss and theaffected line items in the consolidated statements of net income for the years ended December 31, 2018 and 2017:
Amount Reclassified fromAccumulated Other
Comprehensive Loss
Details about Accumulated OtherComprehensive Loss Components
TwelveMonths EndedDecember 31,
2018
TwelveMonths EndedDecember 31,
2017Affected Line Item in the Consolidated
Statements of Net Income
Foreign currency itemsAmounts reclassified to net
income $ (897) $ —Selling, general and administrativeexpenses
(897) —
Defined benefit pension itemsEffect of settlement loss(a) (730) (32,761) Non-operating pension costEffect of curtailment loss(a) (256) — Non-operating pension costAmortization of defined benefit
pension items (36,689) (38,861) Non-operating pension cost(37,675) (71,622)
7,687 21,773 Provision for income taxes(29,988) (49,849) Net income
Gains and losses on cash flow hedgesForeign exchange contracts (203) 11,738 Net SalesForeign exchange contracts (20) (6,764) Cost of salesCommodity contracts 115 1,667 Cost of sales
(108) 6,641 Income before income taxes37 (1,966) Provision for income taxes
(71) 4,675 Net income
Total reclassifications for the period $(30,956) $(45,174) Net income(a) See Note 13 for additional details.
The following table summarizes the tax (expense) benefit amounts for the other comprehensive loss components forthe years ended December 31, 2018 and 2017:
For the year ended December 31,2018
For the year endedDecember 31, 2017
BeforeTax
Amount
Tax(Expense)
BenefitAfter TaxAmount
BeforeTax
Amount
Tax(Expense)
BenefitAfter TaxAmount
Foreign currency items $ (53,504) $ — $ (53,504) $ 88,003 $ — $ 88,003Amounts reclassified from accumulated other
comprehensive income/(loss) to net income 897 — 897 — — —Gains and losses on foreign currency items: (52,607) — (52,607) 88,003 — 88,003Defined benefit pension items:
Other comprehensive income/(loss) beforereclassifications (63,259) 13,027 (50,232) 13,118 (3,278) 9,840
Amounts reclassified from accumulated othercomprehensive income/(loss) to net income 37,675 (7,687) 29,988 71,622 (21,773) 49,849
Net other comprehensive income/(loss) fromdefined benefit pension items (25,584) 5,340 (20,244) 84,740 (25,051) 59,689
Gains and losses on cash flow hedges:Other comprehensive income/(loss) before
reclassifications (2,096) 716 (1,380) 3,355 (1,089) 2,266Amounts reclassified from accumulated other
comprehensive income/(loss) to net income 108 (37) 71 (6,641) 1,966 (4,675)Amounts reclassified from accumulated other
comprehensive income/(loss) to fixed assets (305) — (305) 64 — 64Net other comprehensive income/(loss) from cash
flow hedges (2,293) 679 (1,614) (3,222) 877 (2,345)Other comprehensive income/(loss) $(80,484) $ 6,019 $(74,465) $169,521 $(24,174) $145,347
F-39S O N O C O 2 0 1 8 A N N U A L R E P O R TS O N O C O 2 0 1 8 A N N U A L R E P O R T I F O R M 1 0 - K
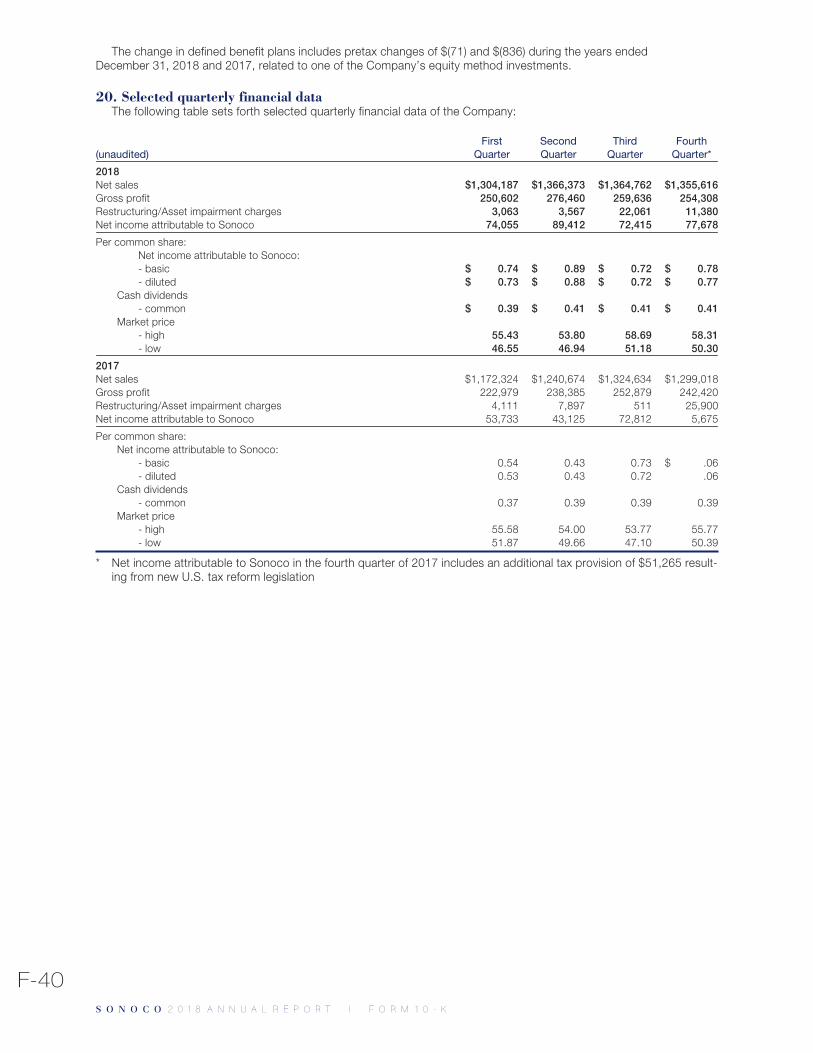
The change in defined benefit plans includes pretax changes of $(71) and $(836) during the years endedDecember 31, 2018 and 2017, related to one of the Company’s equity method investments.
20. Selected quarterly financial dataThe following table sets forth selected quarterly financial data of the Company:
(unaudited)First
QuarterSecondQuarter
ThirdQuarter
FourthQuarter*
2018Net sales $1,304,187 $1,366,373 $1,364,762 $1,355,616Gross profit 250,602 276,460 259,636 254,308Restructuring/Asset impairment charges 3,063 3,567 22,061 11,380Net income attributable to Sonoco 74,055 89,412 72,415 77,678
Per common share:Net income attributable to Sonoco:- basic $ 0.74 $ 0.89 $ 0.72 $ 0.78- diluted $ 0.73 $ 0.88 $ 0.72 $ 0.77
Cash dividends- common $ 0.39 $ 0.41 $ 0.41 $ 0.41
Market price- high 55.43 53.80 58.69 58.31- low 46.55 46.94 51.18 50.30
2017Net sales $1,172,324 $1,240,674 $1,324,634 $1,299,018Gross profit 222,979 238,385 252,879 242,420Restructuring/Asset impairment charges 4,111 7,897 511 25,900Net income attributable to Sonoco 53,733 43,125 72,812 5,675
Per common share:Net income attributable to Sonoco:
- basic 0.54 0.43 0.73 $ .06- diluted 0.53 0.43 0.72 .06
Cash dividends- common 0.37 0.39 0.39 0.39
Market price- high 55.58 54.00 53.77 55.77- low 51.87 49.66 47.10 50.39
* Net income attributable to Sonoco in the fourth quarter of 2017 includes an additional tax provision of $51,265 result-ing from new U.S. tax reform legislation
F-40S O N O C O 2 0 1 8 A N N U A L R E P O R TS O N O C O 2 0 1 8 A N N U A L R E P O R T I F O R M 1 0 - K
Item 9. Changes in and disagreements withaccountants on accounting and financialdisclosure
None.
Item 9A. Controls and proceduresDisclosure Controls and Procedures
Our management, under the supervision and with theparticipation of our Chief Executive Officer (“CEO”) andChief Financial Officer (“CFO”), conducted an evaluation ofour disclosure controls and procedures as defined in Rule13a-15(e) under the Securities Exchange Act of 1934, asamended (the “Exchange Act”). Our disclosure controlsand procedures are designed to ensure that informationdisclosed in the reports that we file or submit is recorded,processed, summarized and reported within the relevanttime periods specified in SEC rules and forms. For thispurpose, disclosure controls and procedures include,without limitation, controls and procedures designed toensure that information that is required to be disclosed inthe reports we file or submit under the Exchange Act isaccumulated and communicated to the Company’smanagement, including the CEO and CFO, as appropriate,to allow timely decisions regarding required disclosures.Based on this evaluation, our CEO and CFO concludedthat such controls and procedures, as of December 31,2018, the end of the period covered by this Annual Reporton Form 10-K, were effective.
Management’s report on internal control overfinancial reporting
Our management is responsible for establishing andmaintaining adequate internal control over financial report-ing, as such term is defined in Exchange Act Rule13a-15(f). Our internal control over financial reporting is aprocess designed by, or under the supervision of, ourCEO and CFO to provide reasonable assurance regardingthe reliability of financial reporting and the preparation offinancial statements for external purposes in accordancewith generally accepted accounting principles. Under thesupervision and with the participation of our management,including our CEO and CFO, we conducted an evaluationof the effectiveness of our internal control over financialreporting as of December 31, 2018, the end of the periodcovered by this report based on the framework in InternalControl – Integrated Framework (2013) issued by theCommittee of Sponsoring Organizations of the TreadwayCommission (“COSO”).
Based on our evaluation under the framework inInternal Control – Integrated Framework (2013), ourmanagement concluded that our internal control overfinancial reporting was effective as of December 31, 2018.In conducting management’s evaluation as described
above, Highland Packaging Solutions, acquired April 12,2018, as well as Conitex Sonoco (BVI), Ltd (“ConitexSonoco”) and Compositub, each acquired October 1,2018, were excluded. The operations of Highland Pack-aging Solutions, Conitex Sonoco and Compositub,excluded from management’s assessment of internal con-trol over financial reporting, collectively represent approx-imately 2.6% of the Company’s consolidated revenuesand approximately 6.2% of total assets as ofDecember 31, 2018.
PricewaterhouseCoopers LLP, an independent regis-tered public accounting firm, has audited the effectivenessof our internal control over financial reporting as ofDecember 31, 2018 as stated in their report, whichappears at the beginning of Item 8 of this Annual Reporton Form 10-K.
Changes in internal control over financial reportingThere have been no changes in the Company’s internal
control over financial reporting during the three monthsended December 31, 2018, that have materially affected,or that are reasonably likely to materially affect, our internalcontrol over financial reporting.
Limitations on the effectiveness of controlsThe Company’s management, including the CEO and
CFO, does not expect that the Company’s disclosurecontrols and procedures or internal control over financialreporting will prevent all error and all fraud. Internal controlover financial reporting, no matter how well designed andoperated, can provide only reasonable, not absolute,assurance that the objectives will be met. Because of theinherent limitations in internal control over financial report-ing, no evaluation of controls can provide absolute assur-ance that all control issues and instances of fraud, if any,within the Company have been detected. These inherentlimitations include the realities that judgments in decisionmaking can be faulty and that breakdowns can occurbecause of simple error or mistake. Controls can also becircumvented by the individual acts of some persons, bycollusion of two or more people, or by management over-ride of the controls. The design of any system of controlsis based in part on certain assumptions about the like-lihood of future events, and there can be no assurancethat any design will succeed in achieving its stated goalsunder all potential future conditions. Over time, controlsmay become inadequate because of changes in con-ditions or deterioration in the degree of compliance withpolicies or procedures. Because of the inherent limitationsin a cost-effective control system, misstatements due toerror or fraud may occur and not be detected timely.
Item 9B. Other informationNot applicable.
37S O N O C O 2 0 1 8 A N N U A L R E P O R TS O N O C O 2 0 1 8 A N N U A L R E P O R T I F O R M 1 0 - K
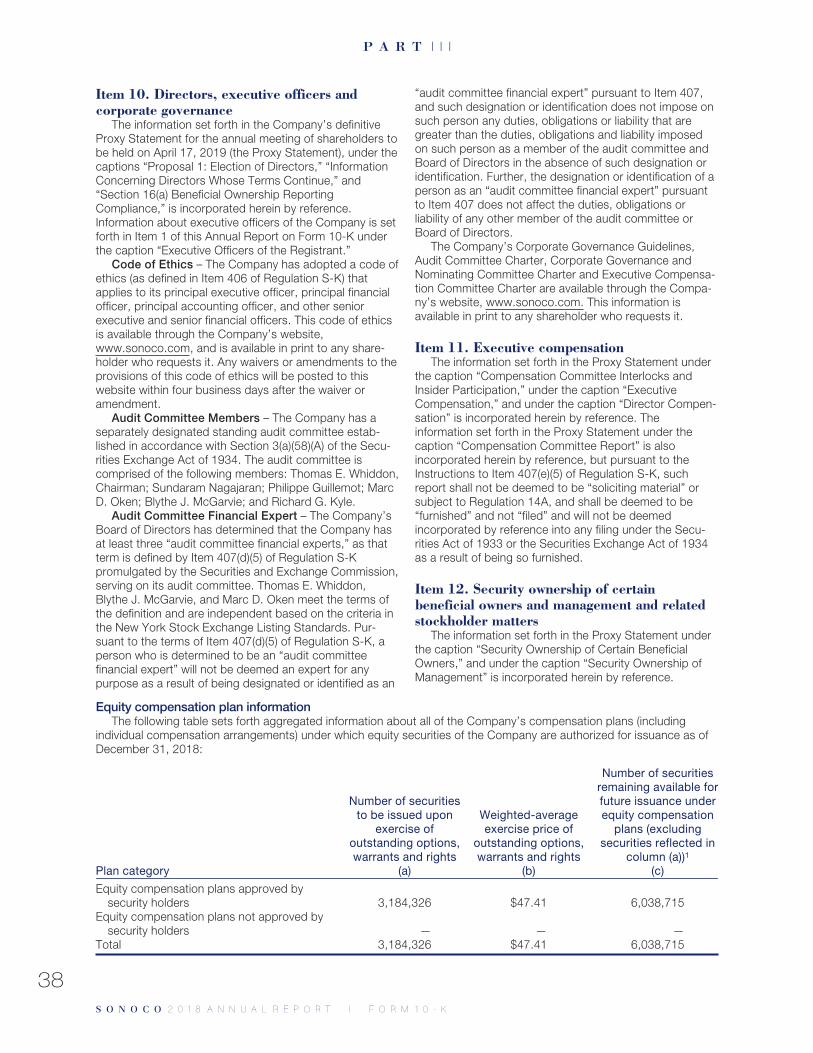
P A R T I I I
Item 10. Directors, executive officers andcorporate governance
The information set forth in the Company’s definitiveProxy Statement for the annual meeting of shareholders tobe held on April 17, 2019 (the Proxy Statement), under thecaptions “Proposal 1: Election of Directors,” “InformationConcerning Directors Whose Terms Continue,” and“Section 16(a) Beneficial Ownership ReportingCompliance,” is incorporated herein by reference.Information about executive officers of the Company is setforth in Item 1 of this Annual Report on Form 10-K underthe caption “Executive Officers of the Registrant.”
Code of Ethics – The Company has adopted a code ofethics (as defined in Item 406 of Regulation S-K) thatapplies to its principal executive officer, principal financialofficer, principal accounting officer, and other seniorexecutive and senior financial officers. This code of ethicsis available through the Company’s website,www.sonoco.com, and is available in print to any share-holder who requests it. Any waivers or amendments to theprovisions of this code of ethics will be posted to thiswebsite within four business days after the waiver oramendment.
Audit Committee Members – The Company has aseparately designated standing audit committee estab-lished in accordance with Section 3(a)(58)(A) of the Secu-rities Exchange Act of 1934. The audit committee iscomprised of the following members: Thomas E. Whiddon,Chairman; Sundaram Nagajaran; Philippe Guillemot; MarcD. Oken; Blythe J. McGarvie; and Richard G. Kyle.
Audit Committee Financial Expert – The Company’sBoard of Directors has determined that the Company hasat least three “audit committee financial experts,” as thatterm is defined by Item 407(d)(5) of Regulation S-Kpromulgated by the Securities and Exchange Commission,serving on its audit committee. Thomas E. Whiddon,Blythe J. McGarvie, and Marc D. Oken meet the terms ofthe definition and are independent based on the criteria inthe New York Stock Exchange Listing Standards. Pur-suant to the terms of Item 407(d)(5) of Regulation S-K, aperson who is determined to be an “audit committeefinancial expert” will not be deemed an expert for anypurpose as a result of being designated or identified as an
“audit committee financial expert” pursuant to Item 407,and such designation or identification does not impose onsuch person any duties, obligations or liability that aregreater than the duties, obligations and liability imposedon such person as a member of the audit committee andBoard of Directors in the absence of such designation oridentification. Further, the designation or identification of aperson as an “audit committee financial expert” pursuantto Item 407 does not affect the duties, obligations orliability of any other member of the audit committee orBoard of Directors.
The Company’s Corporate Governance Guidelines,Audit Committee Charter, Corporate Governance andNominating Committee Charter and Executive Compensa-tion Committee Charter are available through the Compa-ny’s website, www.sonoco.com. This information isavailable in print to any shareholder who requests it.
Item 11. Executive compensationThe information set forth in the Proxy Statement under
the caption “Compensation Committee Interlocks andInsider Participation,” under the caption “ExecutiveCompensation,” and under the caption “Director Compen-sation” is incorporated herein by reference. Theinformation set forth in the Proxy Statement under thecaption “Compensation Committee Report” is alsoincorporated herein by reference, but pursuant to theInstructions to Item 407(e)(5) of Regulation S-K, suchreport shall not be deemed to be “soliciting material” orsubject to Regulation 14A, and shall be deemed to be“furnished” and not “filed” and will not be deemedincorporated by reference into any filing under the Secu-rities Act of 1933 or the Securities Exchange Act of 1934as a result of being so furnished.
Item 12. Security ownership of certainbeneficial owners and management and relatedstockholder matters
The information set forth in the Proxy Statement underthe caption “Security Ownership of Certain BeneficialOwners,” and under the caption “Security Ownership ofManagement” is incorporated herein by reference.
Equity compensation plan informationThe following table sets forth aggregated information about all of the Company’s compensation plans (including
individual compensation arrangements) under which equity securities of the Company are authorized for issuance as ofDecember 31, 2018:
Plan category
Number of securitiesto be issued upon
exercise ofoutstanding options,warrants and rights
(a)
Weighted-averageexercise price of
outstanding options,warrants and rights
(b)
Number of securitiesremaining available forfuture issuance underequity compensation
plans (excludingsecurities reflected in
column (a))1(c)
Equity compensation plans approved bysecurity holders 3,184,326 $47.41 6,038,715
Equity compensation plans not approved bysecurity holders — — —
Total 3,184,326 $47.41 6,038,715
38S O N O C O 2 0 1 8 A N N U A L R E P O R TS O N O C O 2 0 1 8 A N N U A L R E P O R T I F O R M 1 0 - K
1 The Sonoco Products Company 2014 Long-term Incentive Plan was adopted at the Company’s 2014 Annual Meet-ing of Shareholders. The maximum number of shares of common stock that may be issued under this plan was set at10,381,533 shares, which included all shares remaining under the 2012 Plan and an additional 4,500,000 sharesauthorized under the 2014 Plan. Awards granted under all previous plans which are forfeited, expire or are cancelledwithout delivery of shares, or which result in forfeiture of shares back to the Company, will be added to the totalshares available under the 2014 Plan. At December 31, 2018, a total of 6,038,715 shares remain available for futuregrant under the 2014 Plan.
The weighted-average exercise price of $47.41 relatesto stock appreciation rights, which account for 1,832,358of the 3,184,326 securities issuable upon exercise. Theremaining 1,351,968 securities relate to deferred compen-sation stock units, performance-contingent restrictedstock units and restricted stock unit awards that have noexercise price requirement.
Item 13. Certain relationships and relatedtransactions, and director independence
The information set forth in the Proxy Statement underthe captions “Related Party Transactions” and “Corporate
Governance – Director Independence Policies” isincorporated herein by reference. Each current member ofthe Audit, Corporate Governance and Nominating andExecutive Compensation Committees is independent asdefined in the listing standards of the New York StockExchange.
Item 14. Principal accountant fees and servicesThe information set forth in the Proxy Statement under
the caption “Independent Registered Public AccountingFirm” is incorporated herein by reference.
39S O N O C O 2 0 1 8 A N N U A L R E P O R TS O N O C O 2 0 1 8 A N N U A L R E P O R T I F O R M 1 0 - K
P A R T I V
Item 15. Exhibits and financial statement schedules
(a) 1 Financial Statements – The following financial statements are provided under Item 8 – FinancialStatements and Supplementary Data of this Annual Report on Form 10-K:
– Report of Independent Registered Public Accounting Firm
– Consolidated Balance Sheets as of December 31, 2018 and 2017
– Consolidated Statements of Income for the years ended December 31, 2018, 2017 and 2016
– Consolidated Statements of Comprehensive Income for the years ended December 31, 2018, 2017and 2016
– Consolidated Statements of Changes in Total Equity for the years ended December 31, 2018, 2017and 2016
– Consolidated Statements of Cash Flows for the years ended December 31, 2018, 2017 and 2016
– Notes to Consolidated Financial Statements
2 Financial Statement Schedules
Schedule II – Valuation and Qualifying Accounts for the Years Ended December 31, 2018, 2017 and2016
Column A Column B Column C – Additions Column D Column E
Description
Balance atBeginning
of Year
Charged toCosts andExpenses
Charged toOther Deductions
Balanceat Endof Year
2018Allowance for Doubtful Accounts $ 9,913 $ 3,471 $ (425)1 $1,2672 $ 11,692LIFO Reserve 17,632 1,2223 — — 18,854Valuation Allowance on Deferred Tax Assets 47,199 (11,187) 70,9934 3,7165 103,2892017Allowance for Doubtful Accounts $10,884 $ 1,439 $ 2431 $2,6532 $ 9,913LIFO Reserve 17,319 3133 — — 17,632Valuation Allowance on Deferred Tax Assets 49,797 6,967 (2,365)4 7,2005 47,1992016Allowance for Doubtful Accounts $11,069 $ 1,566 $ (86)1 $ 16652 $ 10,884LIFO Reserve 18,894 (1575)3 — — 17,319Valuation Allowance on Deferred Tax Assets 49,464 3,273 (306)4 2,6345 49,797
1 Includes translation adjustments and other insignificant adjustments.2 Includes amounts written off.3 Includes adjustments based on pricing and inventory levels.4 Includes translation adjustments and increases to deferred tax assets which were previously fully reserved.5 Includes utilization of capital loss carryforwards, net operating loss carryforwards and other deferred tax assets.
All other schedules not included have been omitted because they are not required, are not applicable or the requiredinformation is given in the financial statements or notes thereto.
3 The exhibits listed on the Exhibit Index to this Form 10-K are incorporated herein by reference.
Item 16. Form 10-K summaryThe Company has chosen not to provide a Form 10-K summary.
40S O N O C O 2 0 1 8 A N N U A L R E P O R TS O N O C O 2 0 1 8 A N N U A L R E P O R T I F O R M 1 0 - K
Exhibit Index
3-1 Restated Articles of Incorporation, as amended through June 7, 2017 (incorporated by reference to the Registrant’sForm 10-K for the year ended December 31, 2017)
3-2 By-Laws of Sonoco Products Company; as amended October 1, 2018 (incorporated by reference to the Registrant’sForm 8-K filed October 1, 2018)
4-1 Indenture, dated as of June 15, 1991, between Registrant and The Bank of New York, as Trustee (incorporated byreference to the Registrant’s Form S-4 (File Number 333-119863))
4-2 Form of Second Supplemental Indenture, dated as of November 1, 2010, between the Registrant and The Bank ofNew York Mellon Trust Company, N.A., as Trustee (including form of 5.75% Notes due 2040)(incorporated byreference to Registrant’s Form 8-K filed October 28, 2010)
4-3 Form of Third Supplemental Indenture (including form of 4.375% Notes due 2021), between Sonoco ProductsCompany and the Bank of New York Mellon Trust Company, N.A. (incorporated by reference to Registrant’sForm 8-K filed October 27, 2011)
4-4 Form of Fourth Supplemental Indenture (including form of 5.75% Notes due 2040), between Sonoco ProductsCompany and the Bank of New York Mellon Trust Company, N.A. (incorporated by reference to Registrant’sForm 8-K filed October 27, 2011)
10-1 1991 Sonoco Products Company Key Employee Stock Plan, as amended (incorporated by reference to theRegistrant’s Form 10-Q for the quarter ended September 30, 2007)
10-2 Sonoco Products Company 1996 Non-employee Directors’ Stock Plan, as amended (incorporated by reference tothe Registrant’s Form 10-Q for the quarter ended September 30, 2007)
10-3 Sonoco Retirement and Savings Plan (formerly the Sonoco Savings Plan), as amended (incorporated by reference tothe Registrant’s Form 10-K for the year ended December 31, 2012).
10-4 Sonoco Products Company 2008 Long-term Incentive Plan (incorporated by reference to the Company’s ProxyStatement for the Annual Meeting of Shareholders on April 16, 2008)
10-5 Sonoco Products Company 2012 Long-term Incentive Plan (incorporated by reference to the Company’s ProxyStatement for the Annual Meeting of Shareholders on April 18, 2012)
10-6 Sonoco Products Company 2014 Long-term Incentive Plan (incorporated by reference to the Company’s ProxyStatement for the Annual Meeting of Shareholders on April 16, 2014)
10-7 Deferred Compensation Plan for Key Employees of Sonoco Products Company (a.k.a. Deferred Compensation Planfor Corporate Officers of Sonoco Products Company), as amended (incorporated by reference to the Registrant’sForm 10-Q for the quarter ended September 28, 2008)
10-8 Deferred Compensation Plan for Outside Directors of Sonoco Products Company, as amended (incorporated byreference to the Registrant’s Form 10-Q for the quarter ended September 28, 2008)
10-9 Sonoco Products Company Amended and Restated Trust Agreement for Executives, as of October 15, 2008(incorporated by reference to the Registrant’s Form 10-Q for the quarter ended September 28, 2008)
10-10 Sonoco Products Company Amended and Restated Directors Deferral Trust Agreement, as of October 15, 2008(incorporated by reference to the Registrant’s Form 10-Q for the quarter ended September 28, 2008)
10-11 Omnibus Benefit Restoration Plan of Sonoco Products Company, amended and restated as of January 1, 2015(incorporated by reference to the Registrant’s Form 10-K for the year ended December 31, 2014, filed on March 2,2015)
10-12 Performance-based Annual Incentive Plan for Executive Officers (incorporated by reference to the Registrant’s ProxyStatement for the April 19, 2000, Annual Meeting of Shareholders)
10-13 Form of Executive Bonus Life Agreement between the Company and certain executive officers (incorporated byreference to the Registrant’s Form 10-Q for the quarter ended September 26, 2004)
10-14 Description of Stock Appreciation Rights and Performance Contingent Restricted Stock Units granted to executiveofficers of the Registrant on February 12, 2014 (incorporated by reference to Registrant’s Form 8-K filedFebruary 18, 2014)
41S O N O C O 2 0 1 8 A N N U A L R E P O R TS O N O C O 2 0 1 8 A N N U A L R E P O R T I F O R M 1 0 - K
10-15 Description of Stock Appreciation Rights, Restricted Stock Units and Performance Contingent Restricted StockUnits granted to executive officers of the Registrant on February 11, 2015 (incorporated by reference to Registrant’sForm 8-K filed February 17, 2015)
10-16 Description of Stock Appreciation Rights, Restricted Stock Units and Performance Contingent Restricted StockUnits granted to executive officers of the Registrant on February 10, 2016 (incorporated by reference to Registrant’sForm 8-K filed February 16, 2016)
10-17 Description of Stock Appreciation Rights, Restricted Stock Units and Performance Contingent Restricted StockUnits granted to executive officers of the Registrant on February 8, 2017 (incorporated by reference to Registrant’sForm 8-K filed February 14, 2017)
10-18 Description of Stock Appreciation Rights, Restricted Stock Units and Performance Contingent Restricted StockUnits granted to executive officers of the Registrant on February 14, 2018 (incorporated by reference to Registrant’sForm 8-K filed February 20, 2018)
10-19 Description of Stock Appreciation Rights, Restricted Stock Units and Performance Contingent Restricted StockUnits granted to executive officers of the Registrant on February 13, 2019 (incorporated by reference to Registrant’sForm 8-K filed February 19, 2019)
10-20 Unsecured Five-Year Fixed Rate Assignable Loan Agreement, dated May 25, 2016 (incorporated by reference toRegistrant’s Form 10-Q for the quarter ended July 3, 2016)
10-21 Three-year Term Loan Agreement dated March 13, 2017 between the Registrant and Bank of America, N.A.(incorporated by reference to the Registrant’s Form 10-Q for the quarter ended April 2, 2017)
10-22 Credit Facility, effective July 20, 2017 (incorporated by reference to Registrant’s Form 10-Q for the quarter endedJuly 2, 2017)
10-23 Term Loan Agreement between Sonoco Products Company and Bank of America, N.A. dated April 12, 2018
21 Subsidiaries of the Registrant
23 Consent of Independent Registered Public Accounting Firm with respect to Registrant’s Form 10-K
31 Certifications of Chief Executive Officer and Chief Financial Officer pursuant to Section 302 of the Sarbanes-OxleyAct of 2002 and 17 C.F.R. 240.13a-14(a)
32 Certifications of Chief Executive Officer and Chief Financial Officer pursuant to Section 906 of the Sarbanes-OxleyAct of 2002 and 17 C.F.R. 240.13a-14(b)
99 Proxy Statement, filed in conjunction with annual shareholders’ meeting scheduled for April 17, 2019 (to be filedwithin 120 days after December 31, 2018)
101 The following materials from Sonoco Products Company’s Annual Report on Form 10-K for the year endedDecember 31, 2018, formatted in XBRL (eXtensible Business Reporting Language): (i) Consolidated Balance Sheetsat December 31, 2018 and 2017, (ii) Consolidated Statements of Income for the years ended December 31, 2018,2017 and 2016, (iii) Consolidated Statements of Comprehensive Income for the years ended December 31, 2018,2017 and 2016, (iv) Consolidated Statements of Changes in Total Equity for the years ended December 31, 2018,2017 and 2016, (v) Consolidated Statements of Cash Flows for the years ended December 31, 2018, 2017 and2016, and (vi) Notes to the Consolidated Financial Statements.
42S O N O C O 2 0 1 8 A N N U A L R E P O R TS O N O C O 2 0 1 8 A N N U A L R E P O R T I F O R M 1 0 - K
S I G N A T U R E S
Pursuant to the requirements of Section 13 or 15(d) of the Securities Exchange Act of 1934, the Registrant has dulycaused this report to be signed on its behalf by the undersigned, thereunto duly authorized, on this 28th day of February2019.
SONOCO PRODUCTS COMPANY
/s/ R.C. Tiede
R.C. TiedePresident and Chief Executive Officer
Pursuant to the requirements of the Securities Exchange Act of 1934, this report has been signed below by the follow-ing persons on behalf of the Registrant and in the capacities indicated on this 28th day of February 2019.
/s/ Barry L. Saunders /s/ James W. Kirkland
Barry L. Saunders James W. KirklandSenior Vice President and Chief Financial Officer Corporate Controller(principal financial officer) (principal accounting officer)
43S O N O C O 2 0 1 8 A N N U A L R E P O R TS O N O C O 2 0 1 8 A N N U A L R E P O R T I F O R M 1 0 - K
/s/ H.E. DeLoach, Jr. Director (Executive Chairman)
H.E. DeLoach, Jr.
/s/ R.C. Tiede President, Chief Executive Officer and Director
R.C. Tiede
/s/ H.A. Cockrell Director
H.A. Cockrell
/s/ P.L. Davies Director
P.L. Davies
/s/ T.J. Drew Director
T.J. Drew
/s/ P. Guillemot Director
P. Guillemot
/s/ J.R. Haley Director
J.R. Haley
/s/ R.G. Kyle Director
R.G. Kyle
/s/ B.J. McGarvie Director
B.J. McGarvie
/s/ J.M. Micali Director
J.M. Micali
/s/ S. Nagarajan Director
S. Nagarajan
/s/ M.D. Oken Director
M.D. Oken
/s/ T.E. Whiddon Director
T.E. Whiddon
44S O N O C O 2 0 1 8 A N N U A L R E P O R T
S I G N A T U R E S ( C O N T I N U E D )
S O N O C O 2 0 1 8 A N N U A L R E P O R T I F O R M 1 0 - K
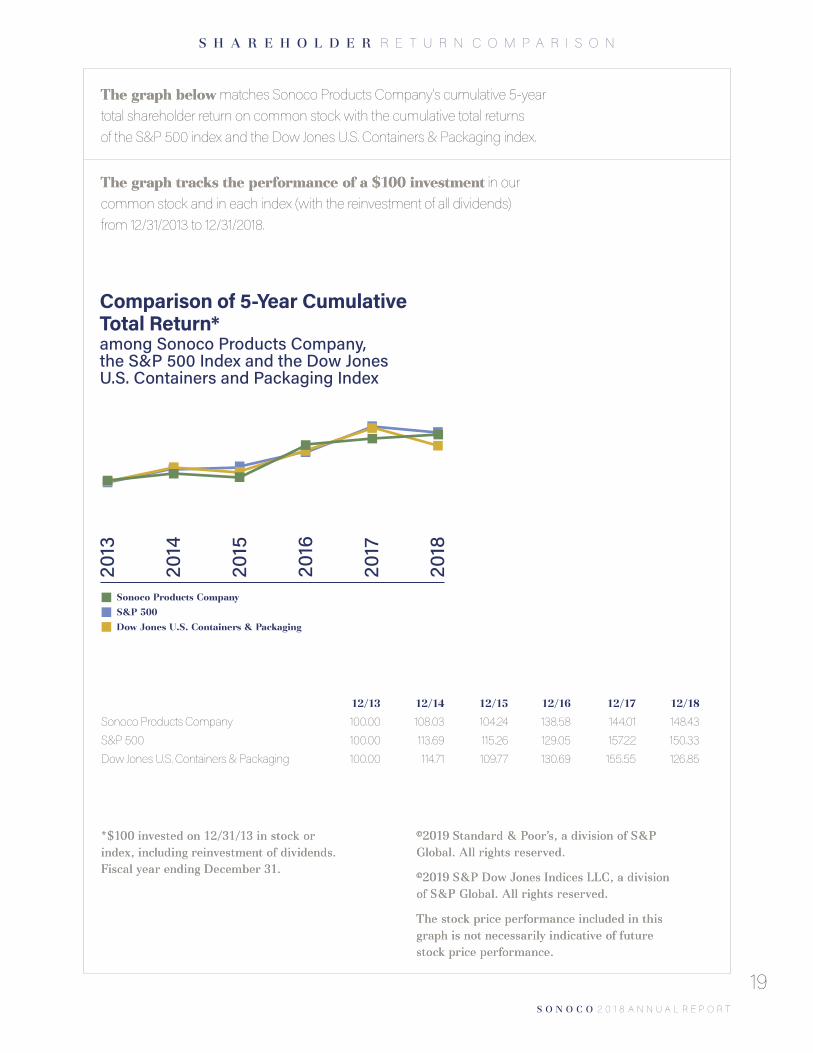
S O N O C O 2 0 1 8 A N N U A L R E P O R T
*$100 invested on 12/31/13 in stock or *$100 invested on 12/31/13 in stock or index, including reinvestment of dividends. index, including reinvestment of dividends. Fiscal year ending December 31. Fiscal year ending December 31.
12/13 12/14 12/15 12/16 12/17 12/18
Sonoco Products Company 100.00 108.03 104.24 138.58 144.01 148.43S&P 500 100.00 113.69 115.26 129.05 157.22 150.33 Dow Jones U.S. Containers & Packaging 100.00 114.71 109.77 130.69 155.55 126.85
The graph belowThe graph below matches Sonoco Products Company’s cumulative 5-year total shareholder return on common stock with the cumulative total returns of the S&P 500 index and the Dow Jones U.S. Containers & Packaging index.
The graph tracks the performance of a $100 investmentThe graph tracks the performance of a $100 investment in our common stock and in each index (with the reinvestment of all dividends) from 12/31/2013 to 12/31/2018.
Comparison of 5-Year Cumulative Total Return* among Sonoco Products Company, the S&P 500 Index and the Dow Jones U.S. Containers and Packaging Index
2017
2016
2015
2014
2013
Sonoco Products CompanyS&P 500Dow Jones U.S. Containers & Packaging
2018
19
S H A R E H O L D E R R E T U R N C O M P A R I S O N
©2019 Standard & Poor’s, a division of S&P ©2019 Standard & Poor’s, a division of S&P Global. All rights reserved. Global. All rights reserved.
©2019 S&P Dow Jones Indices LLC, a division ©2019 S&P Dow Jones Indices LLC, a division of S&P Global. All rights reserved.of S&P Global. All rights reserved.
The stock price performance included in this The stock price performance included in this graph is not necessarily indicative of future graph is not necessarily indicative of future stock price performance.stock price performance.
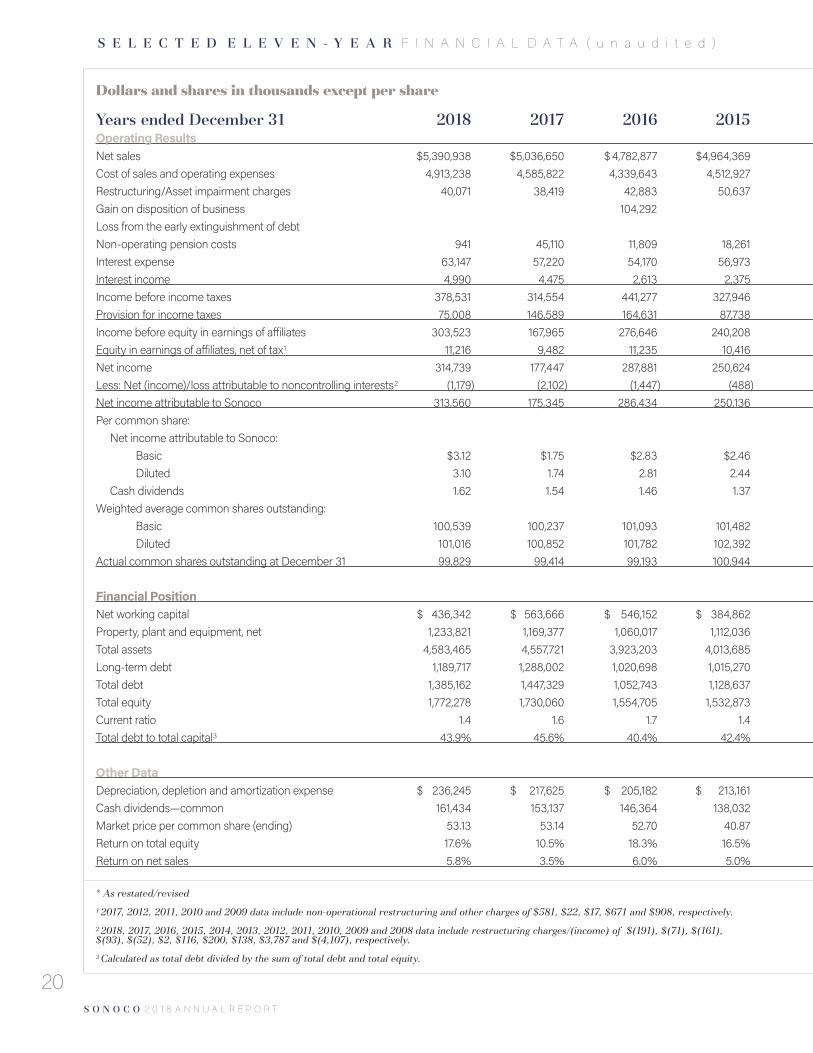
S O N O C O 2 0 1 8 A N N U A L R E P O R T
Dollars and shares in thousands except per share
20
S E L E C T E D E L E V E N - Y E A R F I N A N C I A L D A T A ( u n a u d i t e d )
* As restated/revised
1 2017, 2012, 2011, 2010 and 2009 data include non-operational restructuring and other charges of $581, $22, $17, $671 and $908, respectively.
2 2018, 2017, 2016, 2015, 2014, 2013, 2012, 2011, 2010, 2009 and 2008 data include restructuring charges/(income) of $(191), $(71), $(161), $(93), $(52), $2, $116, $200, $138, $3,787 and $(4,107), respectively.
3 Calculated as total debt divided by the sum of total debt and total equity.
Years ended December 31 2018 2017 2016 2015 *2014 *2013 *2012 *2011 *2010 *2009 2008 Operating Results Net sales $5,390,938 $5,036,650 $ 4,782,877 $4,964,369 $5,016,994 $4,861,657 $ 4,813,571 $4,498,932 $ 4,124,121 $ 3,597,331 $ 4,122,385Cost of sales and operating expenses 4,913,238 4,585,822 4,339,643 4,512,927 4,610,300 4,464,021 4,419,585 4,133,788 3,739,404 3,263,752 3,775,092Restructuring/Asset impairment charges 40,071 38,419 42,883 50,637 22,792 25,038 32,858 36,826 23,999 26,801 100,061Gain on disposition of business 104,292Loss from the early extinguishment of debt 48,617Non-operating pension costs 941 45,110 11,809 18,261 5,804 23,163 18,137 5,838 22,541 53,992 (2,341)Interest expense 63,147 57,220 54,170 56,973 55,140 59,913 64,114 41,832 37,413 40,992 53,401Interest income 4,990 4,475 2,613 2,375 2,749 3,187 4,129 3,758 2,307 2,427 6,204 Income before income taxes 378,531 314,554 441,277 327,946 325,707 292,709 283,006 284,406 254,454 214,221 202,376Provision for income taxes 75,008 146,589 164,631 87,738 108,758 93,631 100,402 77,634 63,575 66,445 54,797Income before equity in earnings of affiliates 303,523 167,965 276,646 240,208 216,949 199,078 182,604 206,772 190,879 147,776 147,579Equity in earnings of affiliates, net of tax1 11,216 9,482 11,235 10,416 9,886 12,029 12,805 12,061 11,505 7,742 9,679 Net income 314,739 177,447 287,881 250,624 226,835 211,107 195,409 218,833 202,384 155,518 157,258Less: Net (income)/loss attributable to noncontrolling interests2 (1,179) (2,102) (1,447) (488) (919) (1,282) (110) (527) (421) (3,663) 7,350 Net income attributable to Sonoco 313,560 175,345 286,434 250,136 225,916 209,825 195,299 218,306 201,963 151,855 164,608Per common share: Net income attributable to Sonoco: Basic $3.12 $1.75 $2.83 $2.46 $2.21 $2.05 $1.92 $2.16 $1.99 $1.50 $1.64 Diluted 3.10 1.74 2.81 2.44 2.19 2.03 1.90 2.14 1.97 1.50 1.63 Cash dividends 1.62 1.54 1.46 1.37 1.27 1.23 1.19 1.15 1.11 1.08 1.07Weighted average common shares outstanding: Basic 100,539 100,237 101,093 101,482 102,215 102,577 101,804 101,071 101,599 100,780 100,321 Diluted 101,016 100,852 101,782 102,392 103,172 103,248 102,573 102,173 102,543 101,029 100,986Actual common shares outstanding at December 31 99,829 99,414 99,193 100,944 100,603 102,147 100,847 100,211 100,510 100,149 99,732
Financial Position Net working capital $ 436,342 $ 563,666 $ 546,152 $ 384,862 $ 461,596 $ 498,105 $ 453,145 $ 467,958 $ 376,867 $ 190,934 $ 231,794Property, plant and equipment, net 1,233,821 1,169,377 1,060,017 1,112,036 1,148,607 1,021,920 1,034,906 1,013,622 944,136 926,829 973,442Total assets 4,583,465 4,557,721 3,923,203 4,013,685 4,186,706 3,967,322 4,152,390 3,971,362 3,272,398 3,061,265 3,084,426Long-term debt 1,189,717 1,288,002 1,020,698 1,015,270 1,193,680 939,056 1,091,454 1,224,290 599,904 461,055 654,807Total debt 1,385,162 1,447,329 1,052,743 1,128,637 1,245,960 974,257 1,365,062 1,277,956 616,853 579,108 687,785Total equity 1,772,278 1,730,060 1,554,705 1,532,873 1,503,847 1,706,049 1,487,539 1,412,692 1,503,114 1,381,003 1,174,518Current ratio 1.4 1.6 1.7 1.4 1.5 1.6 1.4 1.6 1.5 1.2 1.3Total debt to total capital3 43.9% 45.6% 40.4% 42.4% 45.3% 36.3% 47.9% 47.5% 29.1% 29.5% 36.9%
Other Data Depreciation, depletion and amortization expense $ 236,245 $ 217,625 $ 205,182 $ 213,161 $ 198,718 $ 197,671 $ 200,403 $ 179,871 $ 169,665 $ 173,587 $ 183,034Cash dividends—common 161,434 153,137 146,364 138,032 128,793 124,845 119,771 114,958 111,756 107,887 106,558Market price per common share (ending) 53.13 53.14 52.70 40.87 43.70 41.72 29.73 32.96 33.67 29.25 23.16Return on total equity 17.6% 10.5% 18.3% 16.5% 13.4% 13.4% 13.2% 14.3% 14.0% 12.0% 11.6%Return on net sales 5.8% 3.5% 6.0% 5.0% 4.5% 4.3% 4.1% 4.9% 4.9% 4.2% 4.0%
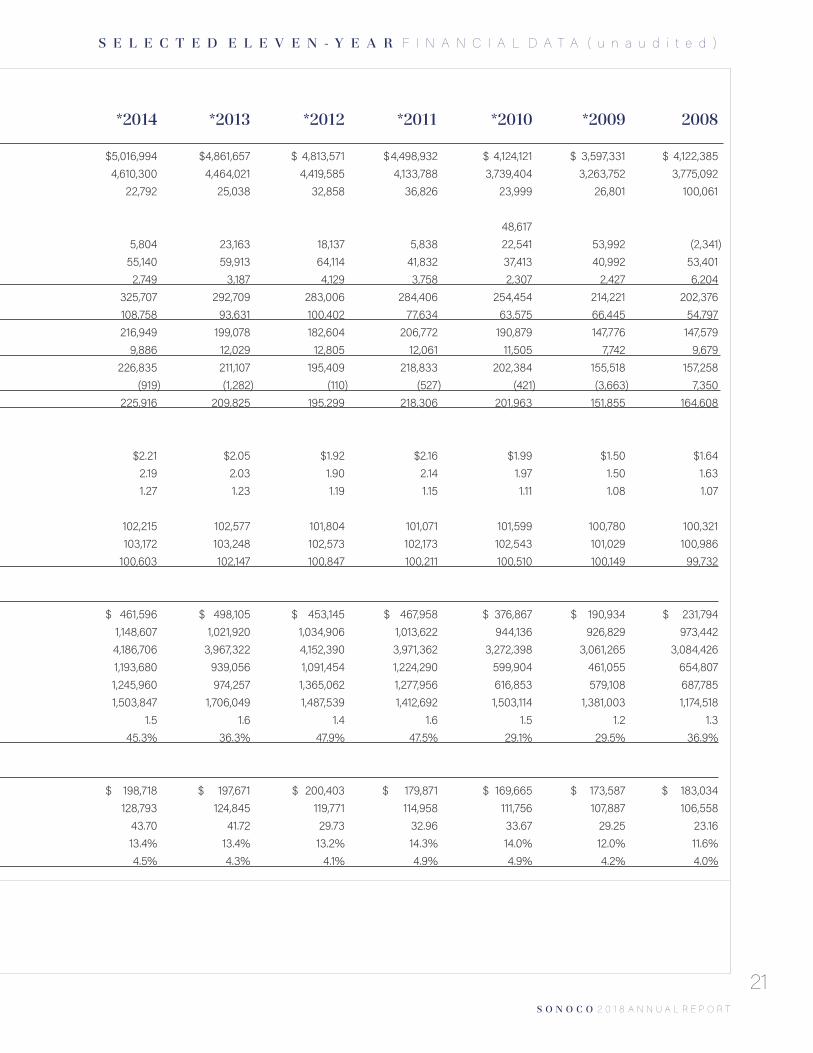
S O N O C O 2 0 1 8 A N N U A L R E P O R T
21
S E L E C T E D E L E V E N - Y E A R F I N A N C I A L D A T A ( u n a u d i t e d )
Years ended December 31 2018 2017 2016 2015 *2014 *2013 *2012 *2011 *2010 *2009 2008 Operating Results Net sales $5,390,938 $5,036,650 $ 4,782,877 $4,964,369 $5,016,994 $4,861,657 $ 4,813,571 $4,498,932 $ 4,124,121 $ 3,597,331 $ 4,122,385Cost of sales and operating expenses 4,913,238 4,585,822 4,339,643 4,512,927 4,610,300 4,464,021 4,419,585 4,133,788 3,739,404 3,263,752 3,775,092Restructuring/Asset impairment charges 40,071 38,419 42,883 50,637 22,792 25,038 32,858 36,826 23,999 26,801 100,061Gain on disposition of business 104,292Loss from the early extinguishment of debt 48,617Non-operating pension costs 941 45,110 11,809 18,261 5,804 23,163 18,137 5,838 22,541 53,992 (2,341)Interest expense 63,147 57,220 54,170 56,973 55,140 59,913 64,114 41,832 37,413 40,992 53,401Interest income 4,990 4,475 2,613 2,375 2,749 3,187 4,129 3,758 2,307 2,427 6,204 Income before income taxes 378,531 314,554 441,277 327,946 325,707 292,709 283,006 284,406 254,454 214,221 202,376Provision for income taxes 75,008 146,589 164,631 87,738 108,758 93,631 100,402 77,634 63,575 66,445 54,797Income before equity in earnings of affiliates 303,523 167,965 276,646 240,208 216,949 199,078 182,604 206,772 190,879 147,776 147,579Equity in earnings of affiliates, net of tax1 11,216 9,482 11,235 10,416 9,886 12,029 12,805 12,061 11,505 7,742 9,679 Net income 314,739 177,447 287,881 250,624 226,835 211,107 195,409 218,833 202,384 155,518 157,258Less: Net (income)/loss attributable to noncontrolling interests2 (1,179) (2,102) (1,447) (488) (919) (1,282) (110) (527) (421) (3,663) 7,350 Net income attributable to Sonoco 313,560 175,345 286,434 250,136 225,916 209,825 195,299 218,306 201,963 151,855 164,608Per common share: Net income attributable to Sonoco: Basic $3.12 $1.75 $2.83 $2.46 $2.21 $2.05 $1.92 $2.16 $1.99 $1.50 $1.64 Diluted 3.10 1.74 2.81 2.44 2.19 2.03 1.90 2.14 1.97 1.50 1.63 Cash dividends 1.62 1.54 1.46 1.37 1.27 1.23 1.19 1.15 1.11 1.08 1.07Weighted average common shares outstanding: Basic 100,539 100,237 101,093 101,482 102,215 102,577 101,804 101,071 101,599 100,780 100,321 Diluted 101,016 100,852 101,782 102,392 103,172 103,248 102,573 102,173 102,543 101,029 100,986Actual common shares outstanding at December 31 99,829 99,414 99,193 100,944 100,603 102,147 100,847 100,211 100,510 100,149 99,732
Financial Position Net working capital $ 436,342 $ 563,666 $ 546,152 $ 384,862 $ 461,596 $ 498,105 $ 453,145 $ 467,958 $ 376,867 $ 190,934 $ 231,794Property, plant and equipment, net 1,233,821 1,169,377 1,060,017 1,112,036 1,148,607 1,021,920 1,034,906 1,013,622 944,136 926,829 973,442Total assets 4,583,465 4,557,721 3,923,203 4,013,685 4,186,706 3,967,322 4,152,390 3,971,362 3,272,398 3,061,265 3,084,426Long-term debt 1,189,717 1,288,002 1,020,698 1,015,270 1,193,680 939,056 1,091,454 1,224,290 599,904 461,055 654,807Total debt 1,385,162 1,447,329 1,052,743 1,128,637 1,245,960 974,257 1,365,062 1,277,956 616,853 579,108 687,785Total equity 1,772,278 1,730,060 1,554,705 1,532,873 1,503,847 1,706,049 1,487,539 1,412,692 1,503,114 1,381,003 1,174,518Current ratio 1.4 1.6 1.7 1.4 1.5 1.6 1.4 1.6 1.5 1.2 1.3Total debt to total capital3 43.9% 45.6% 40.4% 42.4% 45.3% 36.3% 47.9% 47.5% 29.1% 29.5% 36.9%
Other Data Depreciation, depletion and amortization expense $ 236,245 $ 217,625 $ 205,182 $ 213,161 $ 198,718 $ 197,671 $ 200,403 $ 179,871 $ 169,665 $ 173,587 $ 183,034Cash dividends—common 161,434 153,137 146,364 138,032 128,793 124,845 119,771 114,958 111,756 107,887 106,558Market price per common share (ending) 53.13 53.14 52.70 40.87 43.70 41.72 29.73 32.96 33.67 29.25 23.16Return on total equity 17.6% 10.5% 18.3% 16.5% 13.4% 13.4% 13.2% 14.3% 14.0% 12.0% 11.6%Return on net sales 5.8% 3.5% 6.0% 5.0% 4.5% 4.3% 4.1% 4.9% 4.9% 4.2% 4.0%
S O N O C O 2 0 1 8 A N N U A L R E P O R T
Transfer Agent and Registrar Shareholder inquiries, certificates for transfer, address changes and dividend reinvestment transactions should be sent to: Continental Stock Transfer & Trust Company 1 State Street Plaza–30th floor New York, NY 10004-1561 Domestic: 866 509 5584 International shareholders: +212 981 1705 Email: [email protected] Website: continentalstock.com
Shareholder ServicesElizabeth Kremer Sonoco–A09 1 North Second Street Hartsville, SC 29550-3305+843 383 [email protected]
Electronic Payment of DividendsShareholders may elect to have their dividends deposited directly into their bank accounts by contacting Continental Stock Transfer & Trust Company at [email protected].
Shareholder Investment ProgramThis program allows participants to purchase Sonoco stock and reinvest dividends directly without contacting a broker. For more information and a prospectus, go to sonoco.com or continentalstock.com.
Duplicate Annual Reports To eliminate duplicate report mailings, contact Continental Stock Transfer & Trust Company at [email protected].
Availability of Form 10-K and ExhibitsSonoco has filed with the Securities and Exchange Commission its Annual Report on Form 10-K for the fiscal year ended December 31, 2018.
A copy of the Form 10-K, including the financial statements and financial schedules and a list of exhibits, forms a part of this 2018 Annual Report to shareholders. The exhibits to the Form 10-K are not included with this Annual Report, but will be delivered without charge to any shareholder upon receipt of a written request. Requests for the exhibits should be directed to: Sonoco–A09 1 North Second Street Hartsville, SC 29550-3305
Dividend Reinvestment PlanEnrolling in Sonoco’s Dividend Reinvestment Plan (“Plan”) provides a simple, economical and convenient way for you to invest in Sonoco common shares. To be eligible for participation, you must own at least one share of the common stock in registered form. Benefits of enrolling include:• Provides a convenient way to sell or transfer your shares• Protects your “certificated” shares against possible loss or theft, which also protects you from the additional expense to replace those certificates• Allows for reinvestment of your cash dividend. Dividends are reinvested in Sonoco common stock and additional shares purchased with these dividends are credited to your account• Allows you to invest as little as $50 per month to purchase additional shares
To enroll in the Plan or to receive more information, please contact the Plan administrator, Continental Stock Transfer & Trust Company, by visiting continentalstock.com or by calling toll free 866 509 5584. International callers should dial +212 981 1705. You can also reach the Plan administrator by writing to:Continental Stock Transfer & Trust CompanyDividend Reinvestment Department1 State Street Plaza–30th FloorNew York, NY 10004-1561
22
I N V E S T O R I N F O R M A T I O N
Sonoco (NYSE: SON)Sonoco (NYSE: SON) offers its shareholders a wide range of services and several ways to access important Company information.
AddressCorporate Headquarters and Investor Relations1 North Second Street Hartsville, SC 29550-3305 Main: +843 383 7000 Investor Relations: +843 383 7862 Toll-free: 800 377 2692 Fax: +843 383 7008 Email: [email protected]
Annual Meeting The annual meeting of shareholders will be held at 11 a.m. Eastern Time on Wednesday, April 17, 2019, at:The Center Theater 212 North Fifth Street Hartsville, SC 29550-4136
A live audiocast will be available, with a replay archived for six months. Instructions for listening to this audiocast will be available at sonoco.com, approximately one week prior to the event.
Legal Counsel John M. FlorenceSonoco – A43 1 North Second Street Hartsville, SC [email protected]
Independent Registered Public Accounting Firm PricewaterhouseCoopers LLP Hearst Tower 214 North Tryon Street, Suite 3600 Charlotte, NC 28202-2137
Intellectual Capital Management Sonoco Development, Inc., manages the Company’s intellectual assets, including patents, licenses and agreements. Company trademarks, domain names and patents are managed by SPC Resources, Inc. The address for both companies is: 125 West Home Avenue Hartsville, SC 29550-4123
Equal Opportunity Employer Sonoco believes a diverse workforce is required to compete successfully in today’s global marketplace. The Company provides equal employment opportunities in its global operations without regard to race, color, age, gender, religion, sexual orientation, national origin or physical disability.
References to Website Addresses and Social Media PlatformsReferences to Sonoco’s website address and social media platforms, and Continental Stock Transfer & Trust Company’s website address, are for informational purposes only, and are not intended to, and do not, incorporate those websites or social media platforms, or their contents by reference, into this annual report.
Sonoco on the Internet Sonoco’s website, sonoco.com, provides a variety of information about the Company. The site features a newsroom for press releases, photos, financial reports and presentations, proxy statements, various SEC filings, events, sustainability activity and more.
Information about Sonoco’s products, technologies, awards and activities is also available on Facebook (facebook.com/sonoco.products), LinkedIn (linkedin.com/companies/sonoco), Twitter (twitter.com/sonoco_products) and YouTube (youtube.com/sonocoproducts).
Sonoco Publications Annual reports, current and past, can be found on sonoco.com. Paper copies are also available without charge from: Sonoco – A09 1 North Second Street Hartsville, SC 29550-3305
G E N E R A L I N F O R M A T I O N
Sonoco1 North Second Street
Hartsville, SC 29550-3305843 383 7000sonoco.com
Paper in Sonoco’s Annual Report was manufactured with electricity
in the form of renewable energy and came from well-managed forests or other controlled sources certified in accordance with the international
standards of the Forest Stewardship Council® (FSC®).