Embed Size (px)
Citation preview

SOUTH CAROLINA CHANGING DEMOGRAPHICS
WEBCAST TRAINING
SOUTH CAROLINAASSOCIATION OF COUNTIES
May 21, 2015
By
Frank A. RainwaterExecutive Director
Mike MacfarlaneDemographic Director
South Carolina Revenue and Fiscal Affairs Office1000 Assembly Street
Rembert Dennis Building, Suite 402Columbia, SC 29201
(803) 734-2265

POINTS TO REMEMBER
Heraclitus Mark Twain
May 21, 2015

“Change is the only constant in life.”
~Heraclitus 500 BC
May 21, 2015

“There are three kinds of lies: lies, damned lies, and
statistics.”~Mark Twain quoting Prime Minister
Disraeli
Mark Twain Prime Minister Disraeli

SC CHANGING DEMOGRAPHICS
• Continuous change
• Different than in prior decades
• Varies from county to county
SOME KEY POINTS ARE:
• South Carolina’s natural increase is declining, but net migration has been large enough to result in a consistent net gain.
• The proportion of people in South Carolina who can speak a foreign language is increasing.
• The largest sources of domestic migration into South Carolina are the Northeast states and our immediate neighbors (North Carolina, Georgia, and Florida).
• The population as a whole is getting older, particularly in rural counties.
• The proportion of SC population in urban areas is increasing.


NOTES
• SC experienced a loss in net migration until 1980
• Recent net migration gains are larger than natural increase
• Impact of natural increase is different than net migration
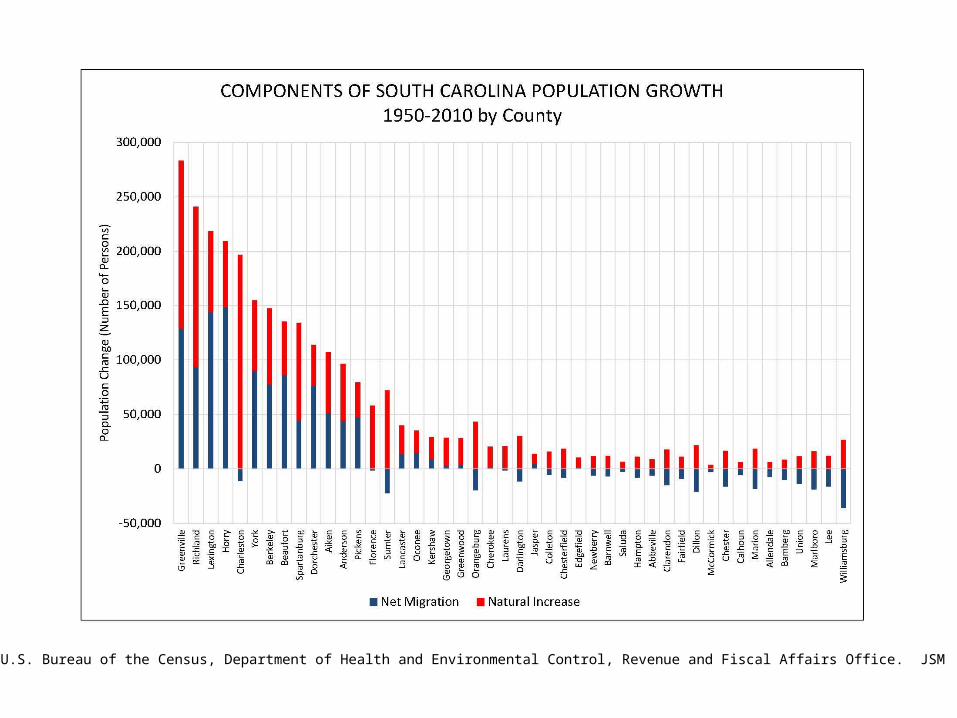
Source: U.S. Bureau of the Census, Department of Health and Environmental Control, Revenue and Fiscal Affairs Office. JSM 3/9/15

Source: U.S. Bureau of the Census, Department of Health and Environmental Control, Revenue and Fiscal Affairs Office. JSM 3/9/15
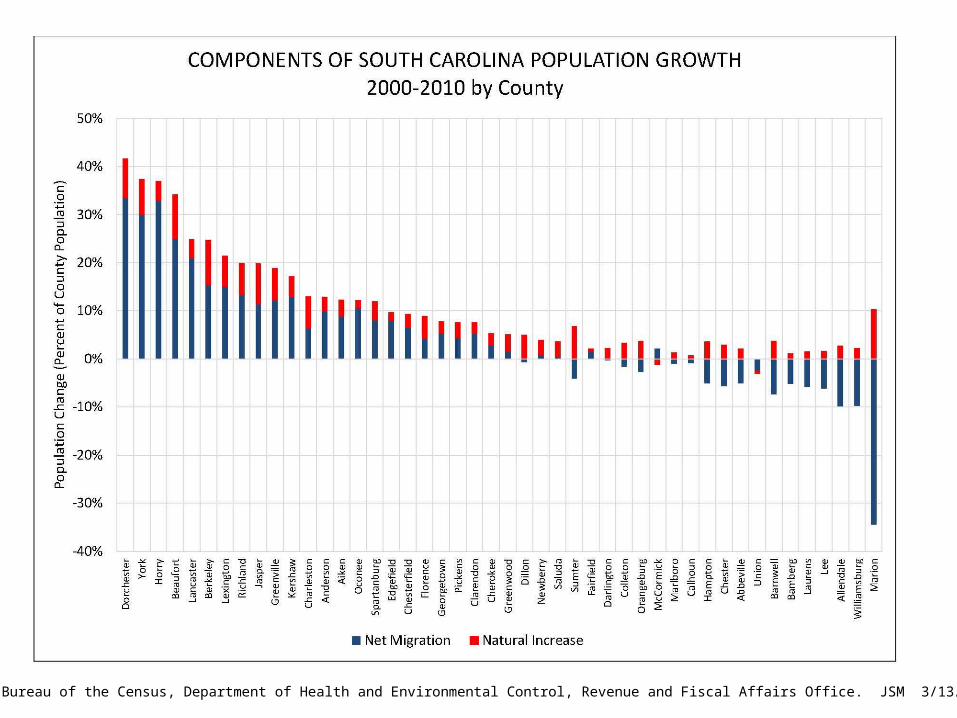
Source: U.S. Bureau of the Census, Department of Health and Environmental Control, Revenue and Fiscal Affairs Office. JSM 3/13/15

NOTES
• Relationship between natural growth and net migration is different in each county
• Last Census noted tremendous variations between counties
• Impact may vary based upon actual number or percentage of population

Source: Internal Revenue Service, Statistics of Income Division, Revenue and Fiscal Affairs Office. JSM 2/25/15

Source: Internal Revenue Service, Statistics of Income Division, Revenue and Fiscal Affairs Office. JSM 2/25/15Source: Internal Revenue Service, Statistics of Income Division, Revenue and Fiscal Affairs Office. JSM 2/25/15

Source: Internal Revenue Service, Statistics of Income Division, Revenue and Fiscal Affairs Office. JSM 2/25/15
NOTES
• Largest number of net migration gains are from New York and New Jersey
• Largest percentage of net migrations are from North Carolina and Georgia
• Large in-migration before recession

Source: U.S. Bureau of the Census, 2000 Census of Population, American Community Survey 2009-2013, Revenue and Fiscal Affairs Office JSM 3/13/15

Source: U.S. Bureau of Census, 2000 Census of Population, American Community Survey 2009-2013, Revenue and Fiscal Affairs Office. JSM 3/12/15

Source: U.S. Bureau of Census, 2000 Census of Population, American Community Survey 2009-2013, Revenue and Fiscal Affairs Office JSM 3/12/15

NOTES
• Number of residents who speak a language other than English is increasing
• Spanish is becoming a larger share of the other languages
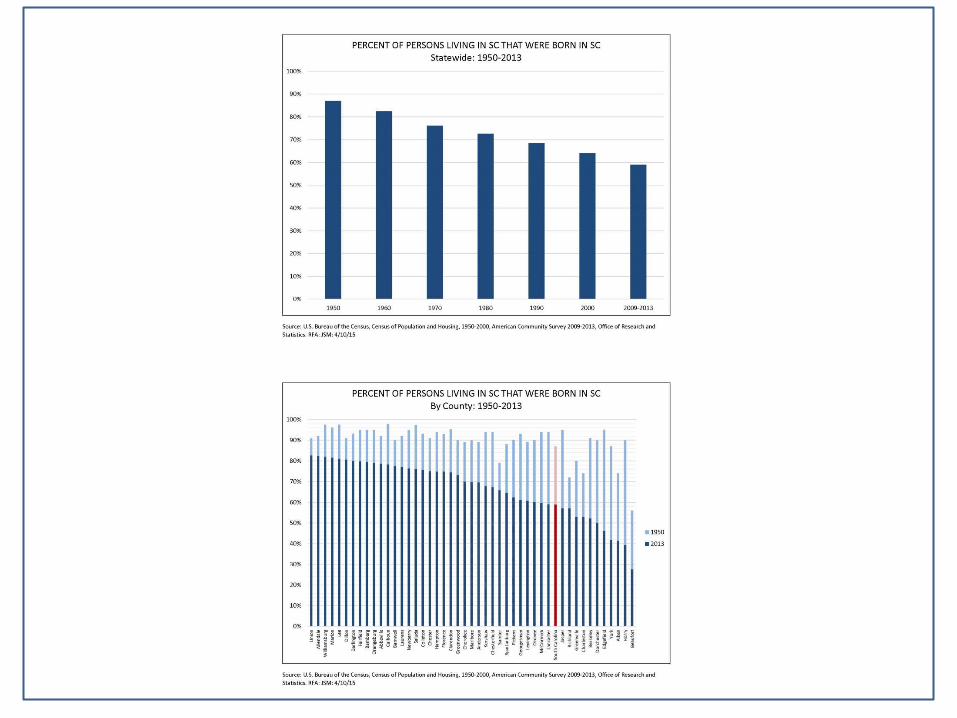
• Pattern varies by county• Remember “Twain”

Source: U.S. Bureau of the Census, Census of Population and Housing 1950-2010, Revenue and Fiscal Affairs Office. JSM 3/13/15


NOTES
• SC median age between 1970 and 2013 – increased from 26 to 38 years
• The increase stems from the aging baby boomers


NOTES
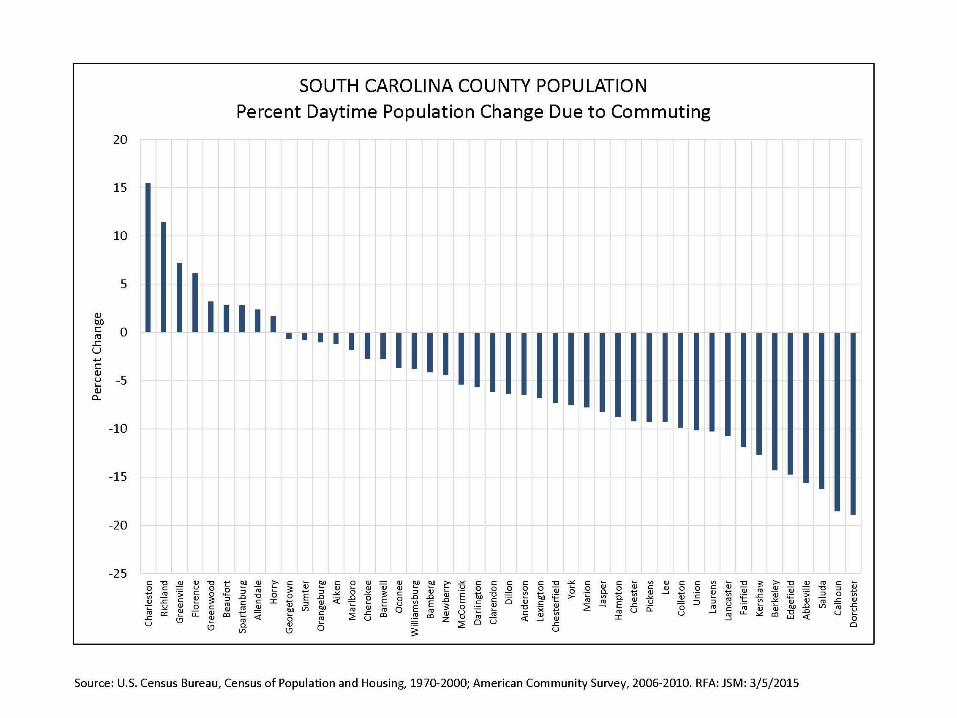
• SC population is becoming more urbanized
• Urbanization does not mean living within municipal boundaries
• Community patterns drastically affect “daytime” and “nighttime” populations

APPENDIX


Fairfield12.2 %
LeeGreenwood
Clarendon
Georgetown
SC NATURAL INCREASE BY COUNTY
1950-2010
Horry
Charleston
BeaufortJasper
HamptonColleton
DorchesterBerkeley
Williamsburg
Marion
Dillon
Florence
Orangeburg
Bamberg
Allendale
Barnwell
Aiken
Edgefield
SaludaLexington
RichlandSumter
Darlington
MarlboroChesterfieldLancaster
KershawFairfieldNewberry
McCormick
Abbeville
LaurensAnderson
Oconee
Pickens
Greenville
Spartanburg
Cherokee
York
Union Chester
Calhoun
100,001 to 196,609
30,001 to 100,000
10,001 to 30,000
3,561 to 10,000
Statewide: 1,719,418
Source: U.S. Bureau of the Census and S.C. Department of Health & Environmental Control. RFA: JSM: 3/18/15
Fairfield12.2 %
SC NATURAL INCREASE BY COUNTY
2000-2010
Horry
Georgetown
Charleston
BeaufortJasper
HamptonColleton
DorchesterBerkeley
Williamsburg
Marion
Dillon
Florence
Clarendon
Orangeburg
Bamberg
Allendale
Barnwell
Aiken
Edgefield
SaludaLexington
RichlandSumter
Lee
Darlington
MarlboroChesterfieldLancaster
KershawFairfieldNewberry
Greenwood
McCormick
Abbeville
LaurensAnderson
Oconee
Pickens
Greenville
Spartanburg
Cherokee
York
Union Chester
Calhoun
10,001 to 25,417
1,001 to 10,000
1 to 1,000
-352 to 0
Statewide: 201,268
Source: U.S. Bureau of the Census and S.C. Department of Health & Environmental Control. RFA: JSM: 3/18/15