Embed Size (px)
Citation preview
South Carolina Early School Start Dates and the South Carolina Travel and Tourism Industries
An Analysis of Economic & Tax Revenue Impacts
Report for:
Uniform School Start Date Task Force South Carolina Department of Education
Report by:
Stephen C. Morse, Ph.D. Professor & Economist
School of Hotel, Restaurant and Tourism Management University of South Carolina
Columbia, SC
Ph: (803) 777-3458 e-mail: [email protected]
The views expressed in this report are solely those of the author, Stephen C. Morse, and do not necessarily reflect the views of the University of South Carolina
South Carolina Early School Start Dates and the South Carolina Travel and Tourism Industries Stephen C. Morse, Ph.D., Economist, School of Hotel, Restaurant and Tourism Management
University of South Carolina, Columbia
2
Executive Summary
South Carolina Early School Start Dates and the South Carolina Travel and Tourism Industries
Purpose of the Study The purpose of this report is to examine the effects and impacts of early school start dates in South Carolina on the Travel and Tourism economy of the State. Findings of the Study
South Carolina public schools have begun earlier and earlier in August, taking away up to 3 weeks of summer August vacation time from families with children in South Carolina public schools.
Early school start dates shorten the August vacation season in South Carolina and is associated with decreased August tourism demand, costing the State’s largest industry – tourism – millions in lost economic activity and millions in lost State and local tax revenues.
Early school start dates in South Carolina are associated with lower August tourist business activity including decreased August hotel occupancy rates, decreased August State and local accommodations taxes generated, decreased State and local sales tax generated, and decreased August employment in tourist areas.
Decreased August tourist activity as schools start earlier, is not off-set by increases in tourist activity in other summer months.
Starting schools in August mean schools must cool facilities for children during the hottest month of the year - August, costing unnecessary utility expenses by starting early, as opposed to starting after Labor Day in September.
One conservative scenario estimates economic and tax revenue impacts where as little as 4 out of 10 families with children in South Carolina take one additional vacation if August summer vacation were restored; plus induced additional families from in-state and out-of-state family vacations, would generate $180 million in total economic impact, $6.03 million is State tax revenues, $2.34 million in local tax revenues, and $8.37 million in total State and local tax revenues.
South Carolina Early School Start Dates and the South Carolina Travel and Tourism Industries Stephen C. Morse, Ph.D., Economist, School of Hotel, Restaurant and Tourism Management
University of South Carolina, Columbia
3
South Carolina Early School Start Dates and the South Carolina Travel and Tourism Industries
Purpose of Study The purpose of this study is to examine the effects and impacts of early school start dates in South Carolina on the Travel and Tourism economy of the State. In August 2002, the South Carolina Department of Education requested Dr. Steve Morse, economist and professor in the School of Hotel, Restaurant and Tourism Management at the University of South Carolina conduct an impact study to examine the effects of early school start dates on the State’s travel and tourism industry. Background In 2002, the South Carolina state legislature examined the possibility of establishing a uniform school start date for SC public schools. To examine the issue further, the legislature directed the SC Department of Education to establish a task force. The SC legislative bill establishing the task force is below:
“Section 59-5-71. The General Assembly declares that it is in the best interest of the students of South Carolina for a uniform beginning date for the annual school term to be developed and adopted by the State Board of Education to be implemented in all public schools of the State. Therefore, the State Board of Education is directed to establish a task force comprised of superintendents, principals, teachers, parents, school board members, and representatives of business and industry, including tourism-related industries no later than July 1, 2002. The task force to the fullest extent possible shall be equally divided among proponents of existing or earlier starting dates for schools, proponents of later starting dates for schools, including proponents for dates after Labor Day, and persons who legitimately have no preferences. The task force shall make recommendations to the board including, but not limited to, the desirability of and if agreed upon a suggested uniform beginning date for the annual school term. The task force shall report its findings to the State Board of Education no later than October 15, 2002.” (Source: SC State Legislature & SC Department of Education)
South Carolina Early School Start Dates and the South Carolina Travel and Tourism Industries Stephen C. Morse, Ph.D., Economist, School of Hotel, Restaurant and Tourism Management
University of South Carolina, Columbia
4
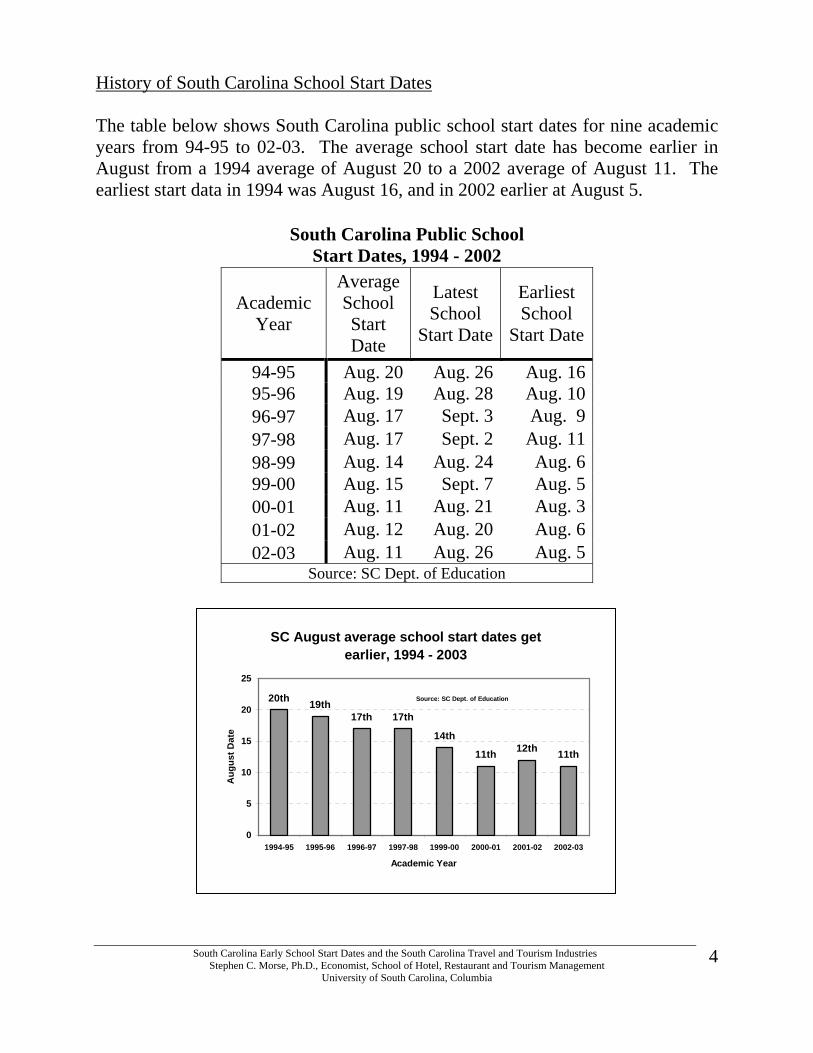
History of South Carolina School Start Dates The table below shows South Carolina public school start dates for nine academic years from 94-95 to 02-03. The average school start date has become earlier in August from a 1994 average of August 20 to a 2002 average of August 11. The earliest start data in 1994 was August 16, and in 2002 earlier at August 5.
South Carolina Public School Start Dates, 1994 - 2002
Academic Year
Average School Start Date
Latest School
Start Date
Earliest School
Start Date
94-95 Aug. 20 Aug. 26 Aug. 16 95-96 Aug. 19 Aug. 28 Aug. 10 96-97 Aug. 17 Sept. 3 Aug. 9 97-98 Aug. 17 Sept. 2 Aug. 11 98-99 Aug. 14 Aug. 24 Aug. 6 99-00 Aug. 15 Sept. 7 Aug. 5 00-01 Aug. 11 Aug. 21 Aug. 3 01-02 Aug. 12 Aug. 20 Aug. 6 02-03 Aug. 11 Aug. 26 Aug. 5
Source: SC Dept. of Education
SC August average school start dates get earlier, 1994 - 2003
11th12th11th
14th
17th17th19th20th
0
5
10
15
20
25
1994-95 1995-96 1996-97 1997-98 1999-00 2000-01 2001-02 2002-03
Academic Year
Aug
ust D
ate
Source: SC Dept. of Education
South Carolina Early School Start Dates and the South Carolina Travel and Tourism Industries Stephen C. Morse, Ph.D., Economist, School of Hotel, Restaurant and Tourism Management
University of South Carolina, Columbia
5
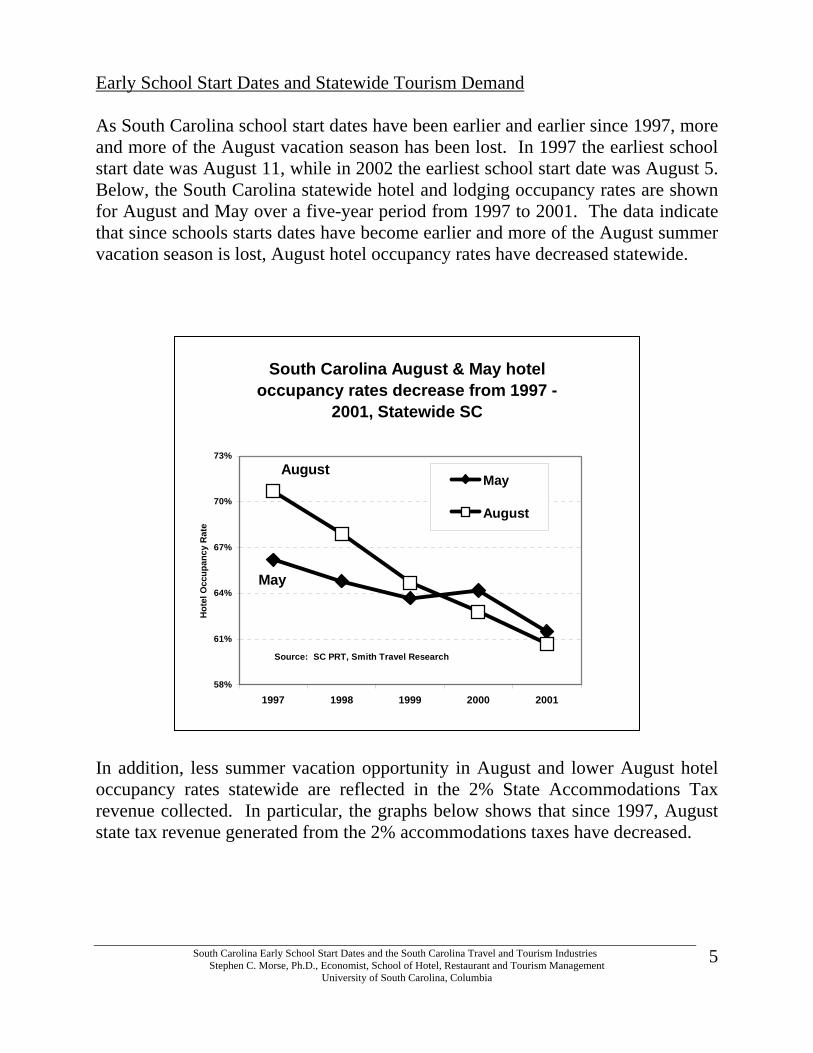
Early School Start Dates and Statewide Tourism Demand As South Carolina school start dates have been earlier and earlier since 1997, more and more of the August vacation season has been lost. In 1997 the earliest school start date was August 11, while in 2002 the earliest school start date was August 5. Below, the South Carolina statewide hotel and lodging occupancy rates are shown for August and May over a five-year period from 1997 to 2001. The data indicate that since schools starts dates have become earlier and more of the August summer vacation season is lost, August hotel occupancy rates have decreased statewide. In addition, less summer vacation opportunity in August and lower August hotel occupancy rates statewide are reflected in the 2% State Accommodations Tax revenue collected. In particular, the graphs below shows that since 1997, August state tax revenue generated from the 2% accommodations taxes have decreased.
South Carolina August & May hotel occupancy rates decrease from 1997 -
2001, Statewide SC
58%
61%
64%
67%
70%
73%
1997 1998 1999 2000 2001
Hot
el O
ccup
ancy
Rat
e
May
August
May
August
Source: SC PRT, Smith Travel Research
South Carolina Early School Start Dates and the South Carolina Travel and Tourism Industries Stephen C. Morse, Ph.D., Economist, School of Hotel, Restaurant and Tourism Management
University of South Carolina, Columbia
6
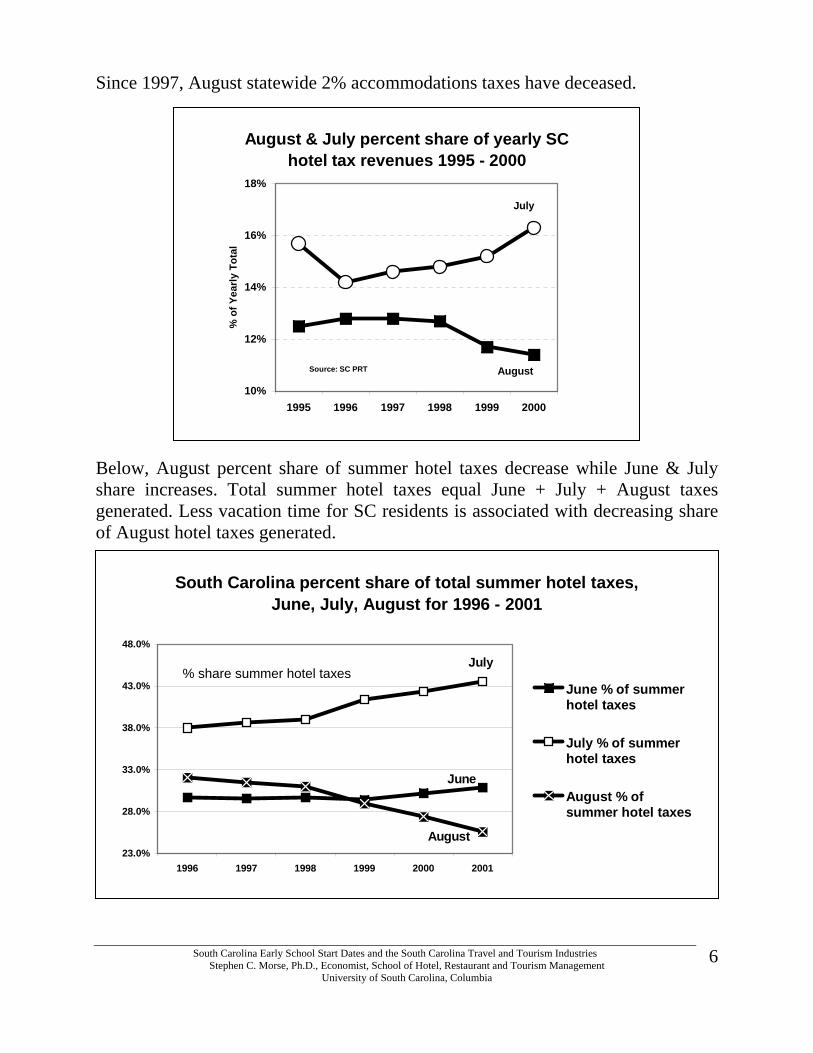
Since 1997, August statewide 2% accommodations taxes have deceased. Below, August percent share of summer hotel taxes decrease while June & July share increases. Total summer hotel taxes equal June + July + August taxes generated. Less vacation time for SC residents is associated with decreasing share of August hotel taxes generated.
August & July percent share of yearly SC hotel tax revenues 1995 - 2000
10%
12%
14%
16%
18%
1995 1996 1997 1998 1999 2000
% o
f Yea
rly T
otal
July
AugustSource: SC PRT
South Carolina percent share of total summer hotel taxes, June, July, August for 1996 - 2001
23.0%
28.0%
33.0%
38.0%
43.0%
48.0%
1996 1997 1998 1999 2000 2001
June % of summerhotel taxes
July % of summerhotel taxes
August % ofsummer hotel taxes
July
June
August
% share summer hotel taxes
South Carolina Early School Start Dates and the South Carolina Travel and Tourism Industries Stephen C. Morse, Ph.D., Economist, School of Hotel, Restaurant and Tourism Management
University of South Carolina, Columbia
7
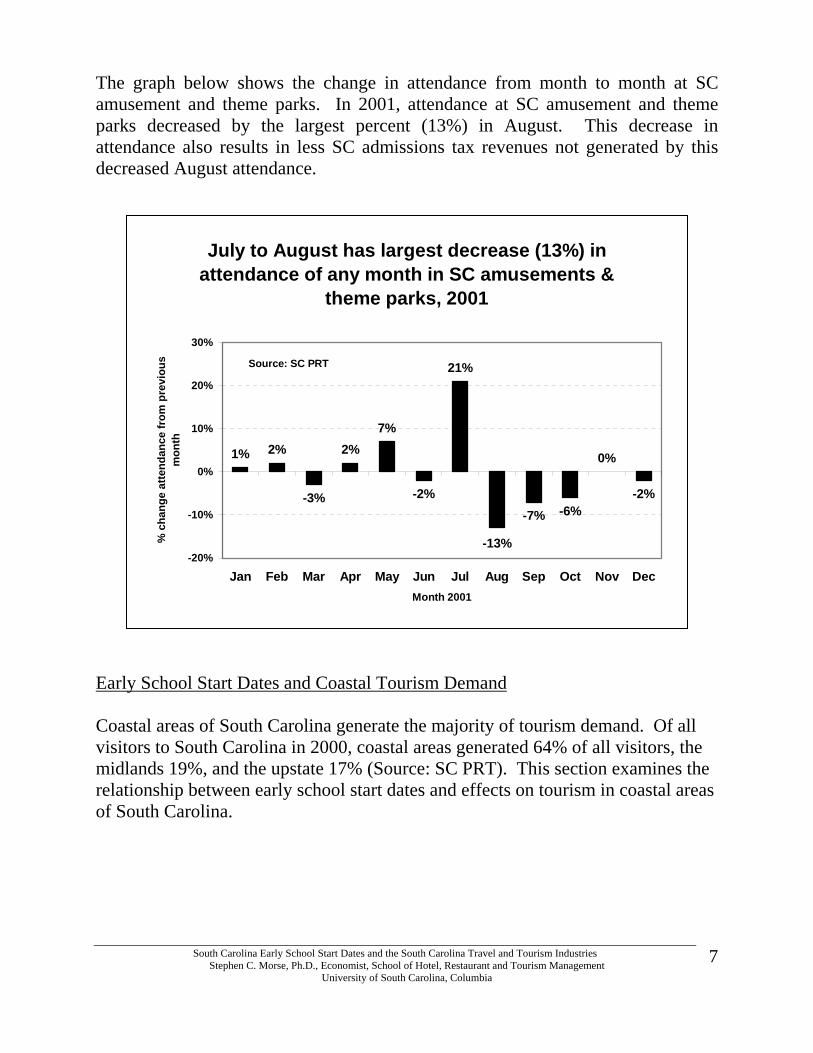
The graph below shows the change in attendance from month to month at SC amusement and theme parks. In 2001, attendance at SC amusement and theme parks decreased by the largest percent (13%) in August. This decrease in attendance also results in less SC admissions tax revenues not generated by this decreased August attendance.
Early School Start Dates and Coastal Tourism Demand Coastal areas of South Carolina generate the majority of tourism demand. Of all visitors to South Carolina in 2000, coastal areas generated 64% of all visitors, the midlands 19%, and the upstate 17% (Source: SC PRT). This section examines the relationship between early school start dates and effects on tourism in coastal areas of South Carolina.
July to August has largest decrease (13%) in attendance of any month in SC amusements &
theme parks, 2001
1% 2%
-3%
2%7%
-2%
21%
-7% -6%
0%
-2%
-13%-20%
-10%
0%
10%
20%
30%
Jan Feb Mar Apr May Jun Jul Aug Sep Oct Nov DecMonth 2001
% c
hang
e at
tend
ance
from
pre
viou
s m
onth
Source: SC PRT
South Carolina Early School Start Dates and the South Carolina Travel and Tourism Industries Stephen C. Morse, Ph.D., Economist, School of Hotel, Restaurant and Tourism Management
University of South Carolina, Columbia
8
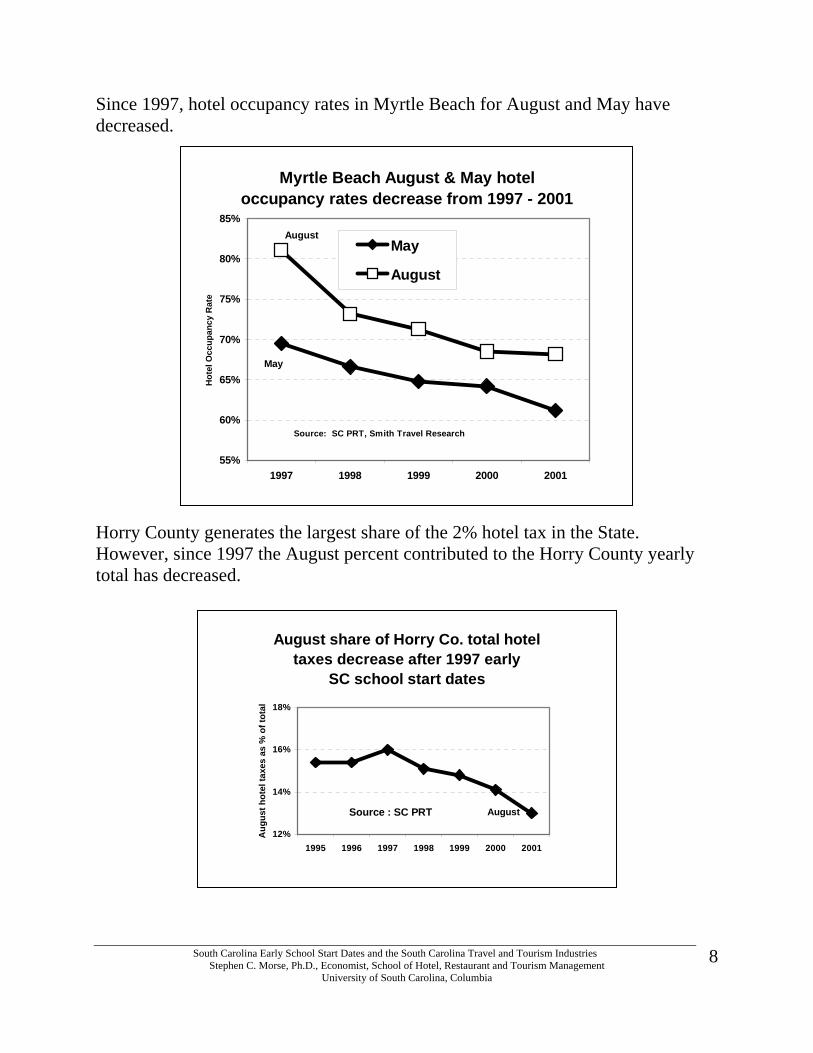
Since 1997, hotel occupancy rates in Myrtle Beach for August and May have decreased. Horry County generates the largest share of the 2% hotel tax in the State. However, since 1997 the August percent contributed to the Horry County yearly total has decreased.
Myrtle Beach August & May hotel occupancy rates decrease from 1997 - 2001
55%
60%
65%
70%
75%
80%
85%
1997 1998 1999 2000 2001
Hot
el O
ccup
ancy
Rat
e
May
August
August
May
Source: SC PRT, Smith Travel Research
August share of Horry Co. total hotel taxes decrease after 1997 early
SC school start dates
12%
14%
16%
18%
1995 1996 1997 1998 1999 2000 2001
Aug
ust h
otel
taxe
s as
% o
f tot
al
Source : SC PRT August
South Carolina Early School Start Dates and the South Carolina Travel and Tourism Industries Stephen C. Morse, Ph.D., Economist, School of Hotel, Restaurant and Tourism Management
University of South Carolina, Columbia
9
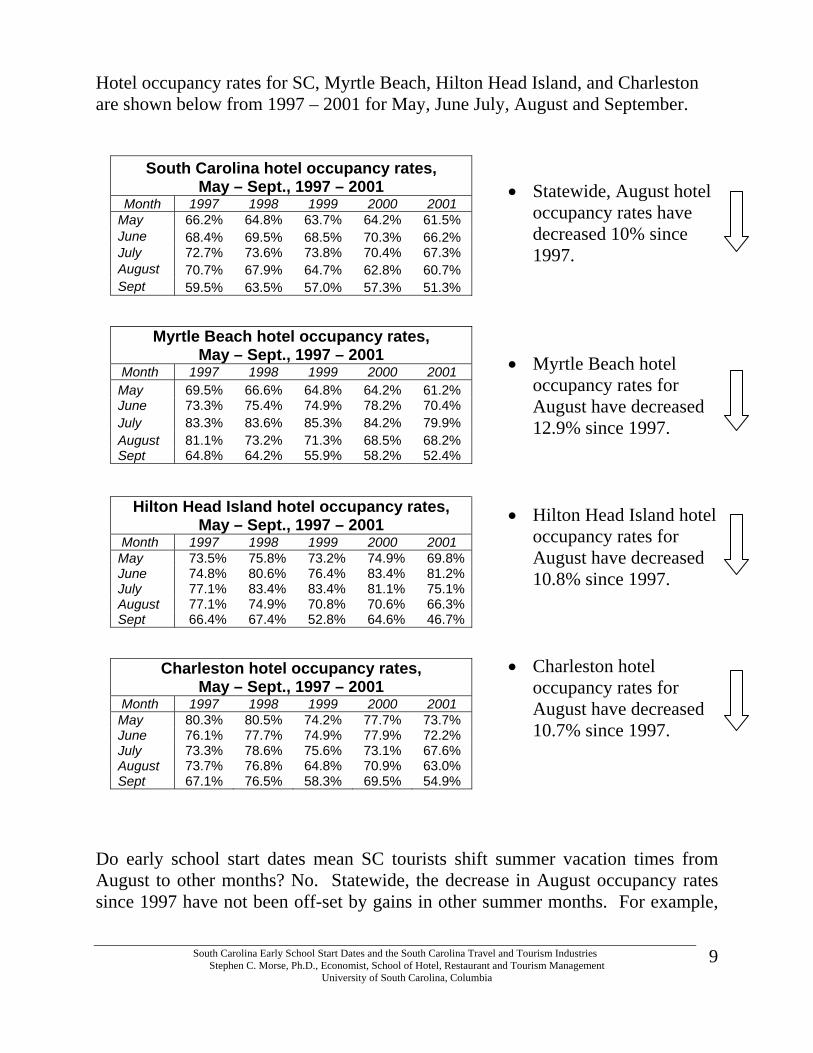
Hotel occupancy rates for SC, Myrtle Beach, Hilton Head Island, and Charleston are shown below from 1997 – 2001 for May, June July, August and September.
• Statewide, August hotel occupancy rates have decreased 10% since 1997.
• Myrtle Beach hotel occupancy rates for August have decreased 12.9% since 1997.
• Hilton Head Island hotel occupancy rates for August have decreased 10.8% since 1997.
• Charleston hotel occupancy rates for August have decreased 10.7% since 1997.
Do early school start dates mean SC tourists shift summer vacation times from August to other months? No. Statewide, the decrease in August occupancy rates since 1997 have not been off-set by gains in other summer months. For example,
South Carolina hotel occupancy rates, May – Sept., 1997 – 2001
Month 1997 1998 1999 2000 2001 May 66.2% 64.8% 63.7% 64.2% 61.5% June 68.4% 69.5% 68.5% 70.3% 66.2% July 72.7% 73.6% 73.8% 70.4% 67.3% August 70.7% 67.9% 64.7% 62.8% 60.7% Sept 59.5% 63.5% 57.0% 57.3% 51.3%
Myrtle Beach hotel occupancy rates, May – Sept., 1997 – 2001
Month 1997 1998 1999 2000 2001 May 69.5% 66.6% 64.8% 64.2% 61.2% June 73.3% 75.4% 74.9% 78.2% 70.4% July 83.3% 83.6% 85.3% 84.2% 79.9% August 81.1% 73.2% 71.3% 68.5% 68.2% Sept 64.8% 64.2% 55.9% 58.2% 52.4%
Hilton Head Island hotel occupancy rates, May – Sept., 1997 – 2001
Month 1997 1998 1999 2000 2001 May 73.5% 75.8% 73.2% 74.9% 69.8%June 74.8% 80.6% 76.4% 83.4% 81.2%July 77.1% 83.4% 83.4% 81.1% 75.1%August 77.1% 74.9% 70.8% 70.6% 66.3%Sept 66.4% 67.4% 52.8% 64.6% 46.7%
Charleston hotel occupancy rates, May – Sept., 1997 – 2001
Month 1997 1998 1999 2000 2001 May 80.3% 80.5% 74.2% 77.7% 73.7% June 76.1% 77.7% 74.9% 77.9% 72.2% July 73.3% 78.6% 75.6% 73.1% 67.6% August 73.7% 76.8% 64.8% 70.9% 63.0% Sept 67.1% 76.5% 58.3% 69.5% 54.9%
South Carolina Early School Start Dates and the South Carolina Travel and Tourism Industries Stephen C. Morse, Ph.D., Economist, School of Hotel, Restaurant and Tourism Management
University of South Carolina, Columbia
10
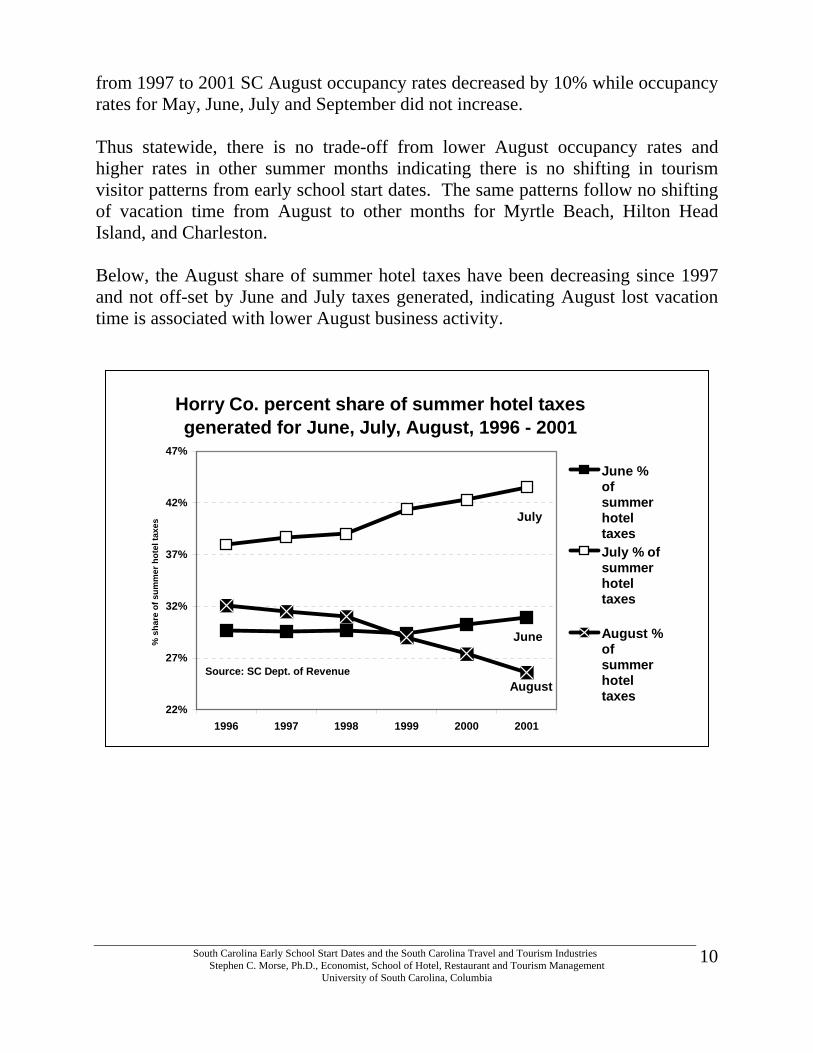
from 1997 to 2001 SC August occupancy rates decreased by 10% while occupancy rates for May, June, July and September did not increase. Thus statewide, there is no trade-off from lower August occupancy rates and higher rates in other summer months indicating there is no shifting in tourism visitor patterns from early school start dates. The same patterns follow no shifting of vacation time from August to other months for Myrtle Beach, Hilton Head Island, and Charleston. Below, the August share of summer hotel taxes have been decreasing since 1997 and not off-set by June and July taxes generated, indicating August lost vacation time is associated with lower August business activity.
Horry Co. percent share of summer hotel taxes generated for June, July, August, 1996 - 2001
22%
27%
32%
37%
42%
47%
1996 1997 1998 1999 2000 2001
% s
hare
of s
umm
er h
otel
taxe
s
June %ofsummerhoteltaxesJuly % ofsummerhoteltaxes
August %ofsummerhoteltaxes
June
July
AugustSource: SC Dept. of Revenue
South Carolina Early School Start Dates and the South Carolina Travel and Tourism Industries Stephen C. Morse, Ph.D., Economist, School of Hotel, Restaurant and Tourism Management
University of South Carolina, Columbia
11
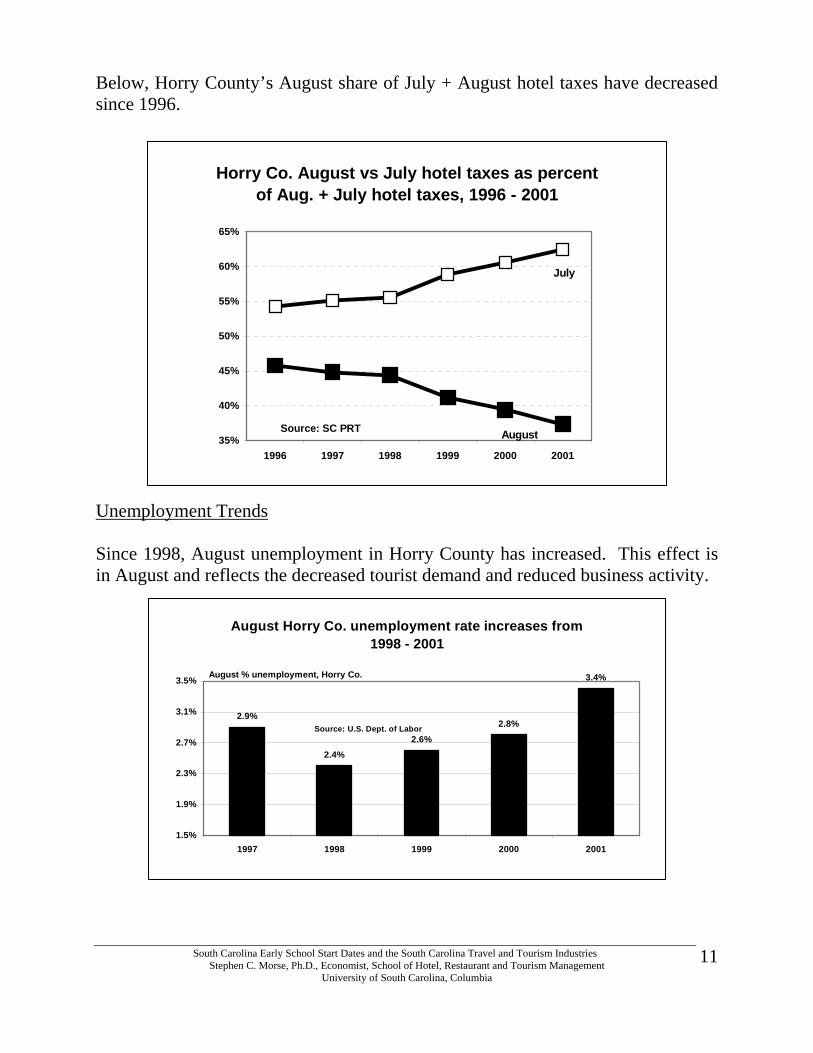
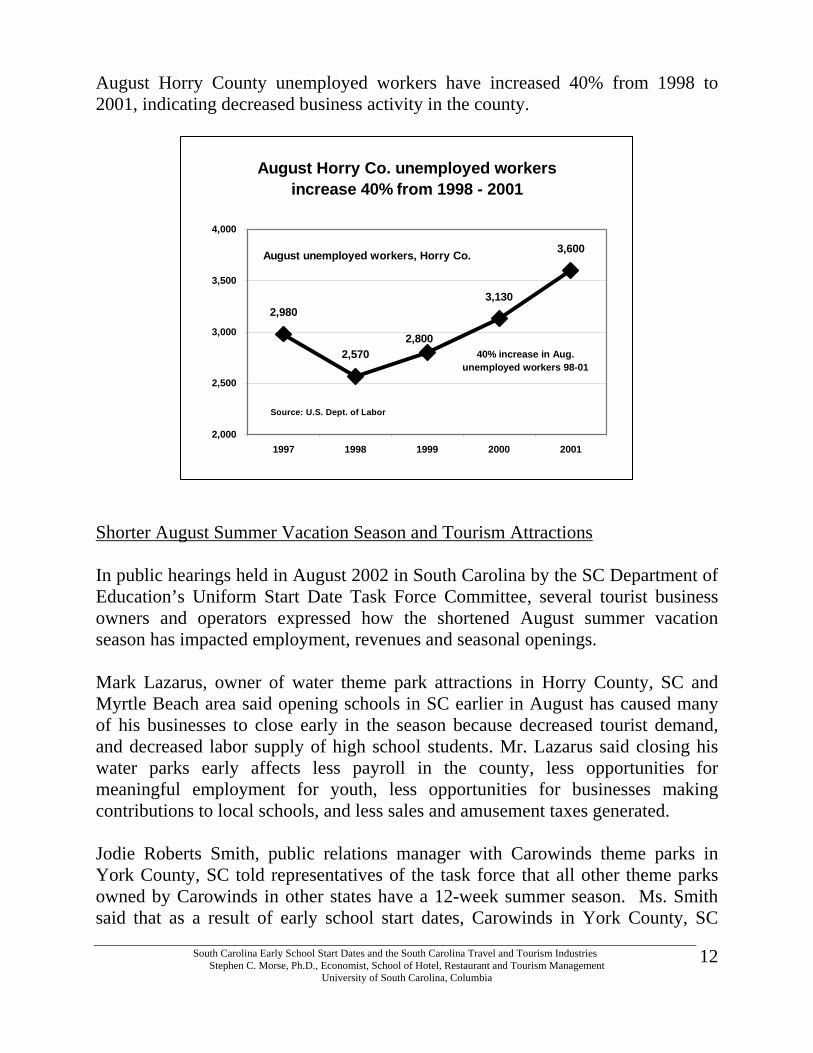
Below, Horry County’s August share of July + August hotel taxes have decreased since 1996. Unemployment Trends Since 1998, August unemployment in Horry County has increased. This effect is in August and reflects the decreased tourist demand and reduced business activity.
August Horry Co. unemployment rate increases from 1998 - 2001
2.9%
2.4%2.6%
2.8%
3.4%
1.5%
1.9%
2.3%
2.7%
3.1%
3.5%
1997 1998 1999 2000 2001
August % unemployment, Horry Co.
Source: U.S. Dept. of Labor
Horry Co. August vs July hotel taxes as percent of Aug. + July hotel taxes, 1996 - 2001
35%
40%
45%
50%
55%
60%
65%
1996 1997 1998 1999 2000 2001
July
AugustSource: SC PRT
South Carolina Early School Start Dates and the South Carolina Travel and Tourism Industries Stephen C. Morse, Ph.D., Economist, School of Hotel, Restaurant and Tourism Management
University of South Carolina, Columbia
12
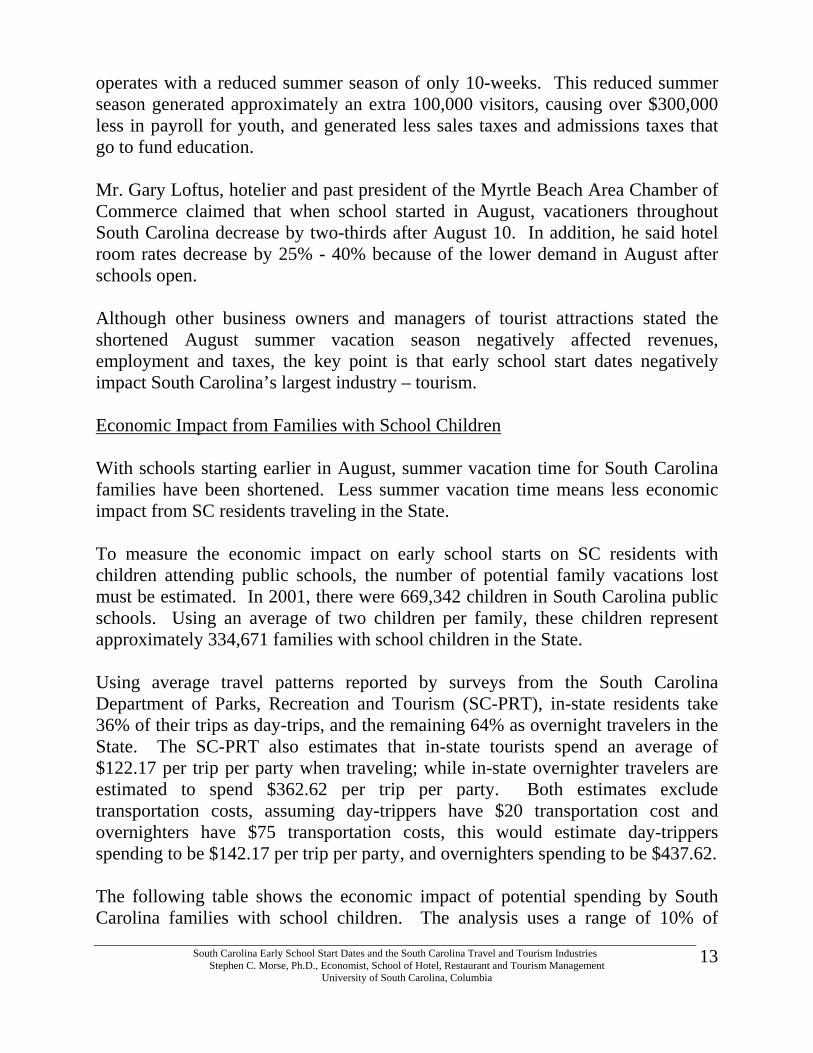
August Horry County unemployed workers have increased 40% from 1998 to 2001, indicating decreased business activity in the county. Shorter August Summer Vacation Season and Tourism Attractions In public hearings held in August 2002 in South Carolina by the SC Department of Education’s Uniform Start Date Task Force Committee, several tourist business owners and operators expressed how the shortened August summer vacation season has impacted employment, revenues and seasonal openings. Mark Lazarus, owner of water theme park attractions in Horry County, SC and Myrtle Beach area said opening schools in SC earlier in August has caused many of his businesses to close early in the season because decreased tourist demand, and decreased labor supply of high school students. Mr. Lazarus said closing his water parks early affects less payroll in the county, less opportunities for meaningful employment for youth, less opportunities for businesses making contributions to local schools, and less sales and amusement taxes generated. Jodie Roberts Smith, public relations manager with Carowinds theme parks in York County, SC told representatives of the task force that all other theme parks owned by Carowinds in other states have a 12-week summer season. Ms. Smith said that as a result of early school start dates, Carowinds in York County, SC
August Horry Co. unemployed workers increase 40% from 1998 - 2001
2,980
2,570
3,130
3,600
2,800
2,000
2,500
3,000
3,500
4,000
1997 1998 1999 2000 2001
August unemployed workers, Horry Co.
Source: U.S. Dept. of Labor
40% increase in Aug. unemployed workers 98-01
South Carolina Early School Start Dates and the South Carolina Travel and Tourism Industries Stephen C. Morse, Ph.D., Economist, School of Hotel, Restaurant and Tourism Management
University of South Carolina, Columbia
13
operates with a reduced summer season of only 10-weeks. This reduced summer season generated approximately an extra 100,000 visitors, causing over $300,000 less in payroll for youth, and generated less sales taxes and admissions taxes that go to fund education. Mr. Gary Loftus, hotelier and past president of the Myrtle Beach Area Chamber of Commerce claimed that when school started in August, vacationers throughout South Carolina decrease by two-thirds after August 10. In addition, he said hotel room rates decrease by 25% - 40% because of the lower demand in August after schools open. Although other business owners and managers of tourist attractions stated the shortened August summer vacation season negatively affected revenues, employment and taxes, the key point is that early school start dates negatively impact South Carolina’s largest industry – tourism. Economic Impact from Families with School Children With schools starting earlier in August, summer vacation time for South Carolina families have been shortened. Less summer vacation time means less economic impact from SC residents traveling in the State. To measure the economic impact on early school starts on SC residents with children attending public schools, the number of potential family vacations lost must be estimated. In 2001, there were 669,342 children in South Carolina public schools. Using an average of two children per family, these children represent approximately 334,671 families with school children in the State. Using average travel patterns reported by surveys from the South Carolina Department of Parks, Recreation and Tourism (SC-PRT), in-state residents take 36% of their trips as day-trips, and the remaining 64% as overnight travelers in the State. The SC-PRT also estimates that in-state tourists spend an average of $122.17 per trip per party when traveling; while in-state overnighter travelers are estimated to spend $362.62 per trip per party. Both estimates exclude transportation costs, assuming day-trippers have $20 transportation cost and overnighters have $75 transportation costs, this would estimate day-trippers spending to be $142.17 per trip per party, and overnighters spending to be $437.62. The following table shows the economic impact of potential spending by South Carolina families with school children. The analysis uses a range of 10% of
South Carolina Early School Start Dates and the South Carolina Travel and Tourism Industries Stephen C. Morse, Ph.D., Economist, School of Hotel, Restaurant and Tourism Management
University of South Carolina, Columbia
14
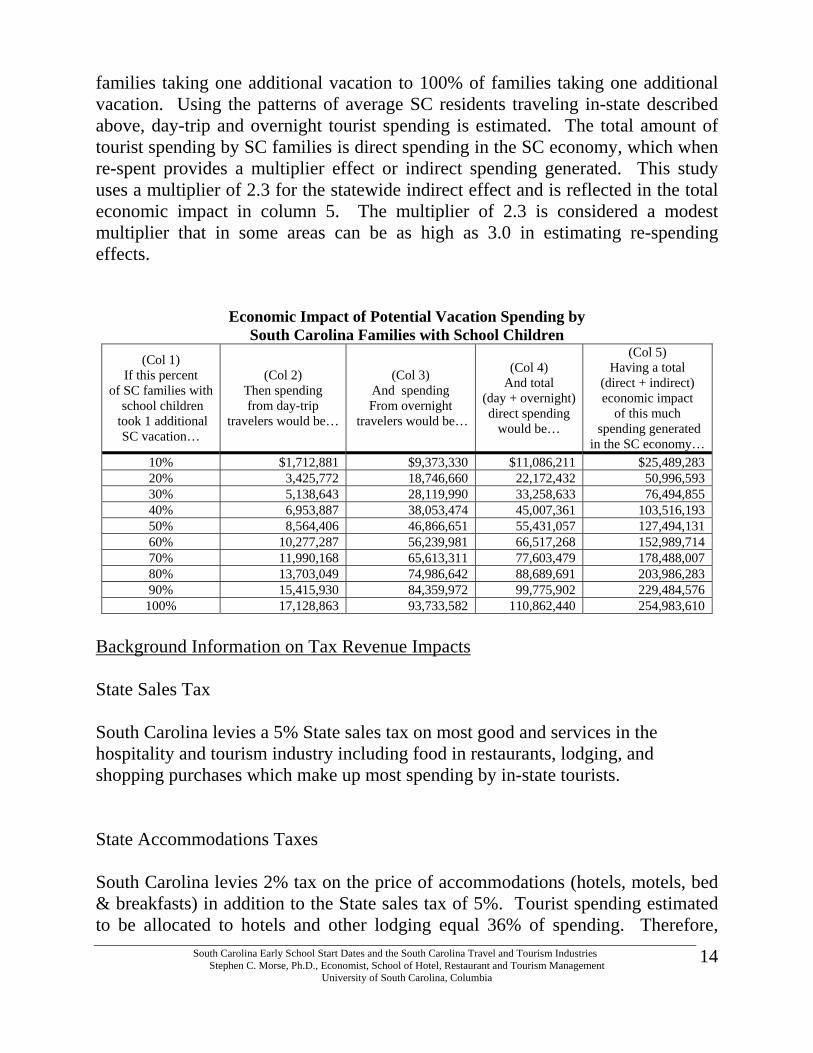
families taking one additional vacation to 100% of families taking one additional vacation. Using the patterns of average SC residents traveling in-state described above, day-trip and overnight tourist spending is estimated. The total amount of tourist spending by SC families is direct spending in the SC economy, which when re-spent provides a multiplier effect or indirect spending generated. This study uses a multiplier of 2.3 for the statewide indirect effect and is reflected in the total economic impact in column 5. The multiplier of 2.3 is considered a modest multiplier that in some areas can be as high as 3.0 in estimating re-spending effects.
Background Information on Tax Revenue Impacts State Sales Tax South Carolina levies a 5% State sales tax on most good and services in the hospitality and tourism industry including food in restaurants, lodging, and shopping purchases which make up most spending by in-state tourists. State Accommodations Taxes South Carolina levies 2% tax on the price of accommodations (hotels, motels, bed & breakfasts) in addition to the State sales tax of 5%. Tourist spending estimated to be allocated to hotels and other lodging equal 36% of spending. Therefore,
Economic Impact of Potential Vacation Spending by South Carolina Families with School Children
(Col 1) If this percent
of SC families with school children
took 1 additional SC vacation…
(Col 2) Then spending from day-trip
travelers would be…
(Col 3) And spending From overnight
travelers would be…
(Col 4) And total
(day + overnight) direct spending
would be…
(Col 5) Having a total
(direct + indirect) economic impact
of this much spending generated
in the SC economy… 10% $1,712,881 $9,373,330 $11,086,211 $25,489,283 20% 3,425,772 18,746,660 22,172,432 50,996,593 30% 5,138,643 28,119,990 33,258,633 76,494,855 40% 6,953,887 38,053,474 45,007,361 103,516,193 50% 8,564,406 46,866,651 55,431,057 127,494,131 60% 10,277,287 56,239,981 66,517,268 152,989,714 70% 11,990,168 65,613,311 77,603,479 178,488,007 80% 13,703,049 74,986,642 88,689,691 203,986,283 90% 15,415,930 84,359,972 99,775,902 229,484,576
100% 17,128,863 93,733,582 110,862,440 254,983,610
South Carolina Early School Start Dates and the South Carolina Travel and Tourism Industries Stephen C. Morse, Ph.D., Economist, School of Hotel, Restaurant and Tourism Management
University of South Carolina, Columbia
15
State accommodations taxes are estimated based on 36% of total tourist spending allocated to hotels and lodging expenses. State Admissions Tax South Carolina levies a 5% admission tax on most events and theme parks . State Income Taxes The maximum State income tax rate is 7% on income over $12,000 and declining percentages with lower incomes. Because many employees are seasonal, a lower income tax rate of 6% is used here. The 6% tax rate is used on the portion of tourist spending that reflects labor costs, here assumed to be 35% of spending. State Beverage Alcohol Taxes Taxes generated by sales of beer, wine and spirits to tourist are generated as a State tax revenue source for South Carolina. It is difficult to estimate these taxes, but increased tourism demand will certainly increase tax revenues generated from the sale on on-premise and off-premise sales. The tax revenue generated from these beverage alcohol sales are not included in this study. State Corporate Income Taxes South Carolina corporate income tax is 5%, however the contribution of corporate income taxes are not included here as this information is not readily defined or available from the South Carolina Department of Revenue. Local Taxes South Carolina allows counties and municipalities to add on sales and accommodations taxes to required state taxes. Local taxes are retained locally for local spending projects and to help support local education. For this study, local tax rates of 3% is used to estimate local tax revenues which include an additional 2% local accommodations tax and 1% local sales tax.
South Carolina Early School Start Dates and the South Carolina Travel and Tourism Industries Stephen C. Morse, Ph.D., Economist, School of Hotel, Restaurant and Tourism Management
University of South Carolina, Columbia
16
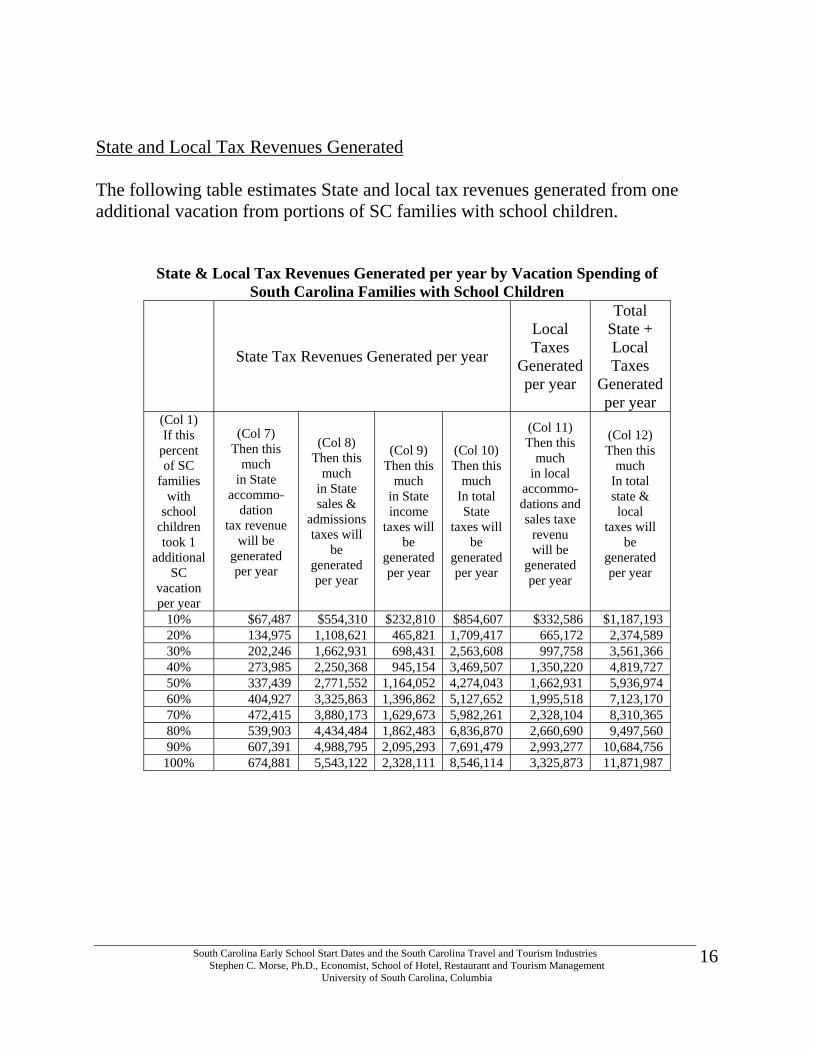
State and Local Tax Revenues Generated The following table estimates State and local tax revenues generated from one additional vacation from portions of SC families with school children.
State & Local Tax Revenues Generated per year by Vacation Spending of South Carolina Families with School Children
State Tax Revenues Generated per year
Local Taxes
Generated per year
Total State + Local Taxes
Generated per year
(Col 1) If this
percent of SC
families with
school children took 1
additional SC
vacation per year
(Col 7) Then this
much in State
accommo-dation
tax revenue will be
generated per year
(Col 8) Then this
much in State sales &
admissions taxes will
be generated per year
(Col 9) Then this
much in State income
taxes will be
generated per year
(Col 10) Then this
much In total State
taxes will be
generated per year
(Col 11) Then this
much in local
accommo-dations and sales taxe
revenu will be
generated per year
(Col 12) Then this
much In total state & local
taxes will be
generated per year
10% $67,487 $554,310 $232,810 $854,607 $332,586 $1,187,193 20% 134,975 1,108,621 465,821 1,709,417 665,172 2,374,589 30% 202,246 1,662,931 698,431 2,563,608 997,758 3,561,366 40% 273,985 2,250,368 945,154 3,469,507 1,350,220 4,819,727 50% 337,439 2,771,552 1,164,052 4,274,043 1,662,931 5,936,974 60% 404,927 3,325,863 1,396,862 5,127,652 1,995,518 7,123,170 70% 472,415 3,880,173 1,629,673 5,982,261 2,328,104 8,310,365 80% 539,903 4,434,484 1,862,483 6,836,870 2,660,690 9,497,560 90% 607,391 4,988,795 2,095,293 7,691,479 2,993,277 10,684,756
100% 674,881 5,543,122 2,328,111 8,546,114 3,325,873 11,871,987
South Carolina Early School Start Dates and the South Carolina Travel and Tourism Industries Stephen C. Morse, Ph.D., Economist, School of Hotel, Restaurant and Tourism Management
University of South Carolina, Columbia
17
Additional Tourism Spending by Other In-state and Out-of-state Tourists Restoration of the full August summer vacation season will not only increase demand from in-state SC families with children, but also will increase demand from other tourists inside and outside the state. With the lost August vacation period restored, more SC tourist related businesses will stay open as the supply of labor is not reduced when school opens. At public hearings, business owners from across the state said early August school starts drained youth employment and forced businesses to close early during August by up to three weeks. Water Parks in Myrtle Beach and amusement theme parks in York County reported shorter August seasons as a result in early August school start dates. Myrtle Beach tourism officials report tourist activity decreases substantially during the last three weeks of the August. Beginning August 10th, Myrtle Beach tourism officials estimate tourists and vacationers decrease by approximately two-thirds. In Myrtle Beach, lower tourism demand in August is reflected in the decrease in August hotel occupancy rates, decreased accommodations taxes collected in Horry County for August, decrease in hotel room rates as demand is lower, higher worker unemployment rates and the early closing of many tourist related businesses in August. In addition, Myrtle Beach tourism officials say both in-state and out-of-state tourist decreases from 300,000 to 240,000 visitors per day after August 10th each year because of early school openings. This decrease in tourists by 60,000 per day includes both in-state and out-of-state tourists to the area and is estimated to produce a loss of $178 million to the Grand Strand area. Myrtle Beach tourist officials state that if this pattern is true across South Carolina, statewide the State could be losing up to $400 million per year from both in-state and out-of-state lost tourist revenues from the shorter August vacation season. Estimating the impact of increased tourist demand from additional in-state and out-of-state tourist is difficult. Also, South Carolina tourist destinations may embark on new marketing campaigns that increase demand from in-state and out-of-state tourist. One method would assume August tourist activity levels in hotels, restaurants, retail shopping areas and attractions would not decease as they do now in August, but be maintained at July levels. Restoration of the full August vacation season to will increase demand for tourism is South Carolina from in-state and out-of-state tourists. Increasing the August tourist season by two weeks will have a substantial impact on state and local revenues generated by this additional tourism period.
South Carolina Early School Start Dates and the South Carolina Travel and Tourism Industries Stephen C. Morse, Ph.D., Economist, School of Hotel, Restaurant and Tourism Management
University of South Carolina, Columbia
18
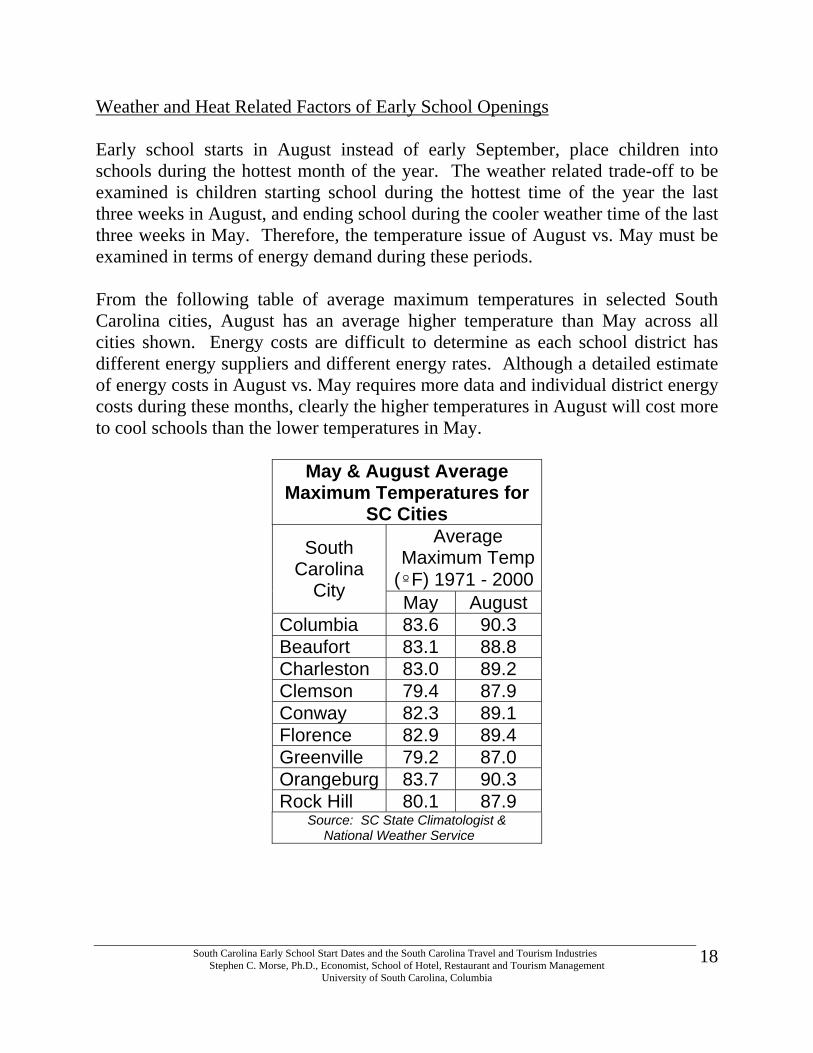
Weather and Heat Related Factors of Early School Openings Early school starts in August instead of early September, place children into schools during the hottest month of the year. The weather related trade-off to be examined is children starting school during the hottest time of the year the last three weeks in August, and ending school during the cooler weather time of the last three weeks in May. Therefore, the temperature issue of August vs. May must be examined in terms of energy demand during these periods. From the following table of average maximum temperatures in selected South Carolina cities, August has an average higher temperature than May across all cities shown. Energy costs are difficult to determine as each school district has different energy suppliers and different energy rates. Although a detailed estimate of energy costs in August vs. May requires more data and individual district energy costs during these months, clearly the higher temperatures in August will cost more to cool schools than the lower temperatures in May.
May & August Average Maximum Temperatures for
SC Cities Average
Maximum Temp (ºF) 1971 - 2000
South Carolina
City May August Columbia 83.6 90.3 Beaufort 83.1 88.8 Charleston 83.0 89.2 Clemson 79.4 87.9 Conway 82.3 89.1 Florence 82.9 89.4 Greenville 79.2 87.0 Orangeburg 83.7 90.3 Rock Hill 80.1 87.9
Source: SC State Climatologist & National Weather Service
South Carolina Early School Start Dates and the South Carolina Travel and Tourism Industries Stephen C. Morse, Ph.D., Economist, School of Hotel, Restaurant and Tourism Management
University of South Carolina, Columbia
19
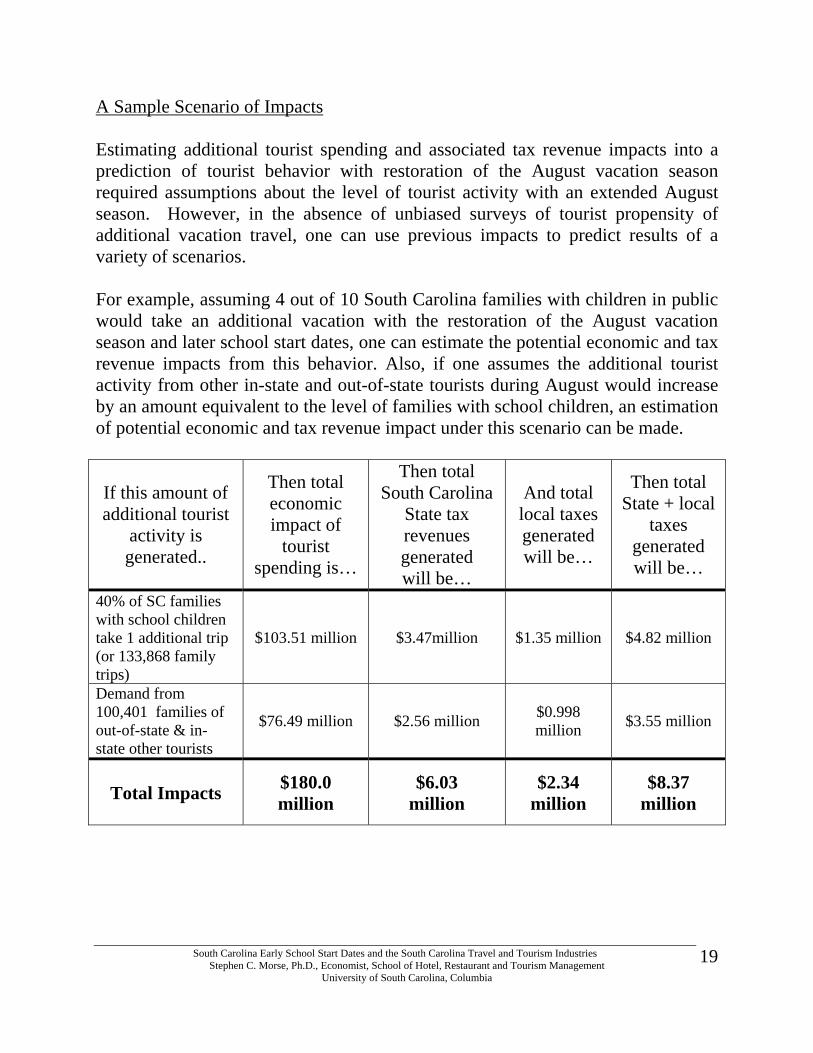
A Sample Scenario of Impacts Estimating additional tourist spending and associated tax revenue impacts into a prediction of tourist behavior with restoration of the August vacation season required assumptions about the level of tourist activity with an extended August season. However, in the absence of unbiased surveys of tourist propensity of additional vacation travel, one can use previous impacts to predict results of a variety of scenarios. For example, assuming 4 out of 10 South Carolina families with children in public would take an additional vacation with the restoration of the August vacation season and later school start dates, one can estimate the potential economic and tax revenue impacts from this behavior. Also, if one assumes the additional tourist activity from other in-state and out-of-state tourists during August would increase by an amount equivalent to the level of families with school children, an estimation of potential economic and tax revenue impact under this scenario can be made.
If this amount of additional tourist
activity is generated..
Then total economic impact of
tourist spending is…
Then total South Carolina
State tax revenues generated will be…
And total local taxes generated will be…
Then total State + local
taxes generated will be…
40% of SC families with school children take 1 additional trip (or 133,868 family trips)
$103.51 million $3.47million $1.35 million $4.82 million
Demand from 100,401 families of out-of-state & in-state other tourists
$76.49 million $2.56 million $0.998 million $3.55 million
Total Impacts
$180.0 million
$6.03 million
$2.34 million
$8.37 million
South Carolina Early School Start Dates and the South Carolina Travel and Tourism Industries Stephen C. Morse, Ph.D., Economist, School of Hotel, Restaurant and Tourism Management
University of South Carolina, Columbia
20
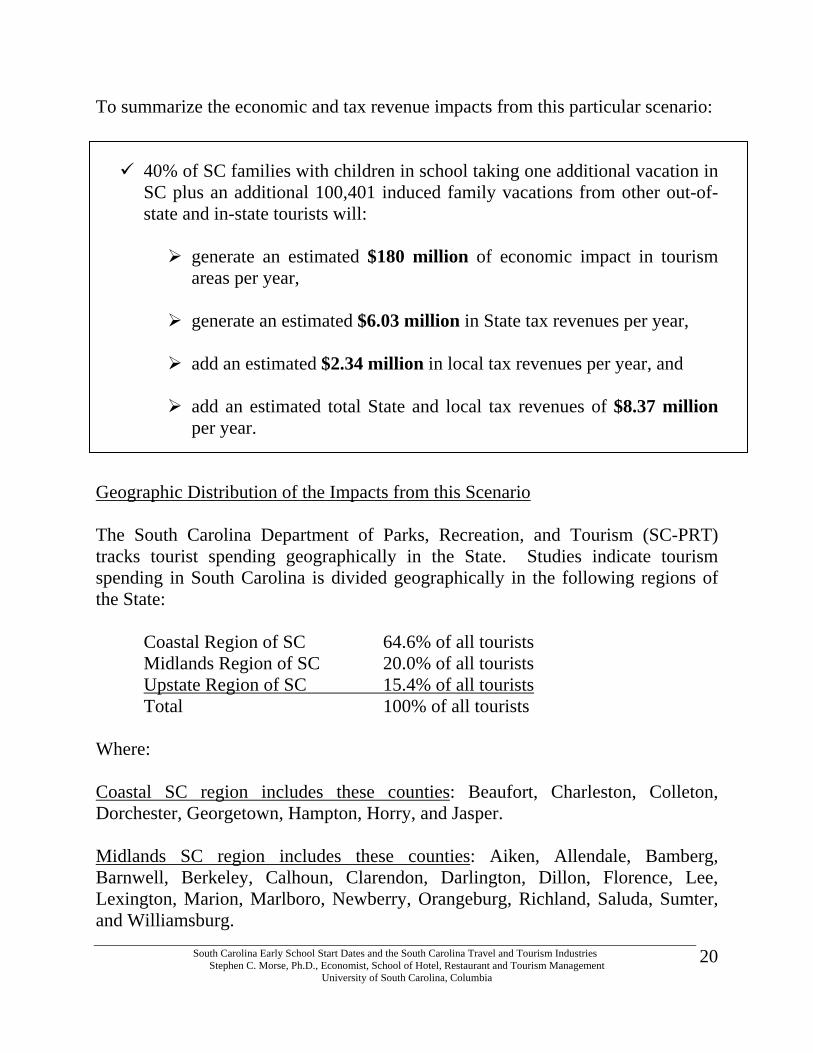
To summarize the economic and tax revenue impacts from this particular scenario:
40% of SC families with children in school taking one additional vacation in SC plus an additional 100,401 induced family vacations from other out-of-state and in-state tourists will:
generate an estimated $180 million of economic impact in tourism areas per year,
generate an estimated $6.03 million in State tax revenues per year,
add an estimated $2.34 million in local tax revenues per year, and
add an estimated total State and local tax revenues of $8.37 million per year.
Geographic Distribution of the Impacts from this Scenario The South Carolina Department of Parks, Recreation, and Tourism (SC-PRT) tracks tourist spending geographically in the State. Studies indicate tourism spending in South Carolina is divided geographically in the following regions of the State: Coastal Region of SC 64.6% of all tourists Midlands Region of SC 20.0% of all tourists Upstate Region of SC 15.4% of all tourists Total 100% of all tourists Where: Coastal SC region includes these counties: Beaufort, Charleston, Colleton, Dorchester, Georgetown, Hampton, Horry, and Jasper. Midlands SC region includes these counties: Aiken, Allendale, Bamberg, Barnwell, Berkeley, Calhoun, Clarendon, Darlington, Dillon, Florence, Lee, Lexington, Marion, Marlboro, Newberry, Orangeburg, Richland, Saluda, Sumter, and Williamsburg.
South Carolina Early School Start Dates and the South Carolina Travel and Tourism Industries Stephen C. Morse, Ph.D., Economist, School of Hotel, Restaurant and Tourism Management
University of South Carolina, Columbia
21
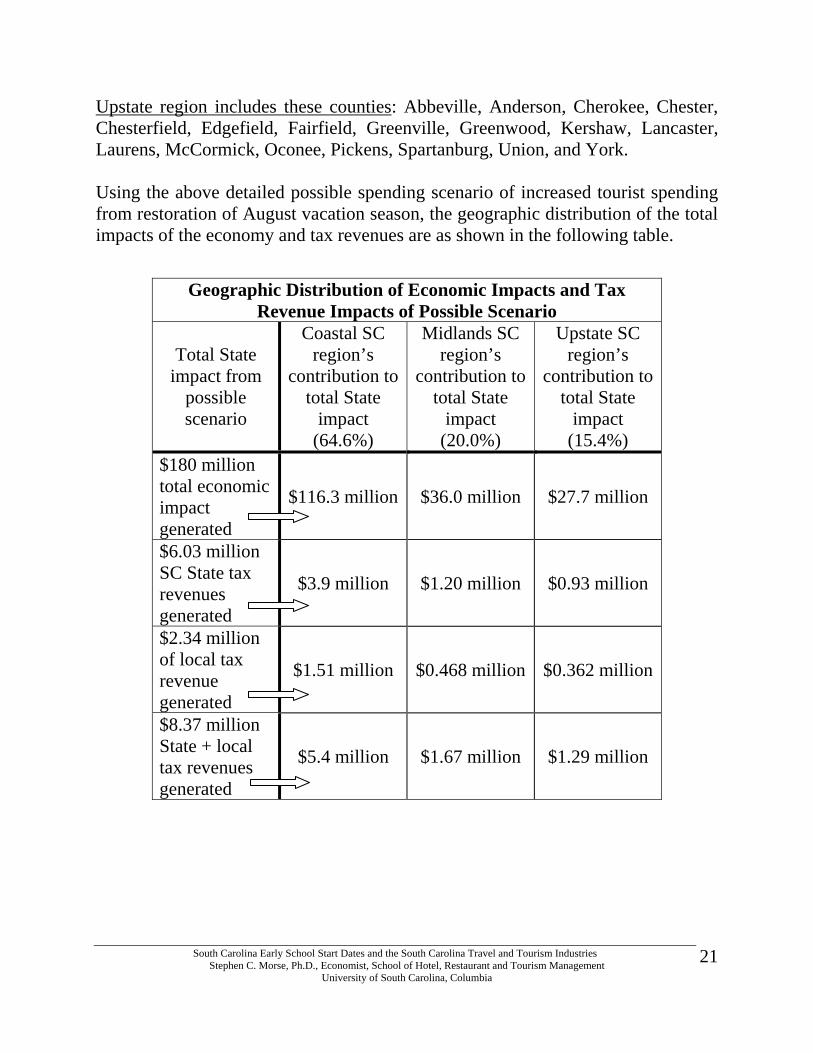
Upstate region includes these counties: Abbeville, Anderson, Cherokee, Chester, Chesterfield, Edgefield, Fairfield, Greenville, Greenwood, Kershaw, Lancaster, Laurens, McCormick, Oconee, Pickens, Spartanburg, Union, and York. Using the above detailed possible spending scenario of increased tourist spending from restoration of August vacation season, the geographic distribution of the total impacts of the economy and tax revenues are as shown in the following table.
Geographic Distribution of Economic Impacts and Tax Revenue Impacts of Possible Scenario
Total State impact from
possible scenario
Coastal SC region’s
contribution to total State
impact (64.6%)
Midlands SC region’s
contribution to total State
impact (20.0%)
Upstate SC region’s
contribution to total State
impact (15.4%)
$180 million total economic impact generated
$116.3 million $36.0 million $27.7 million
$6.03 million SC State tax revenues generated
$3.9 million $1.20 million $0.93 million
$2.34 million of local tax revenue generated
$1.51 million $0.468 million $0.362 million
$8.37 million State + local tax revenues generated
$5.4 million $1.67 million $1.29 million
South Carolina Early School Start Dates and the South Carolina Travel and Tourism Industries Stephen C. Morse, Ph.D., Economist, School of Hotel, Restaurant and Tourism Management
University of South Carolina, Columbia
22
Additional Possible Scenarios The above analysis is but one of many scenarios of the impacts of restoring the August vacation season with later school start dates. There are many other possible scenarios, all dependent on how in-state and out-of-state tourists respond to a longer vacation season in South Carolina. The above scenario demonstrated uses a conservative estimate of tourist response by assuming only 4 out of 10 families with children in South Carolina school would take an additional vacation in SC and also the longer vacation season would induce approximately 100,000 other in-state and out-of-state family tourists trips. There are scenarios under less conservative assumptions that would estimate higher economic impacts and tax revenues, and scenarios under more conservative assumptions that would estimate lower economic impacts and tax revenues generated. Conclusion and Summary
South Carolina public schools have begun earlier and earlier in August, taking away up to 3 weeks of summer August vacation time from families with children in South Carolina public schools.
Early school start dates shorten the August vacation season in South
Carolina and is associated with decreased August tourism demand, costing the State’s largest industry – tourism – millions in lost economic activity and millions in lost State and local tax revenues.
Early school start dates in South Carolina are associated with lower August
tourist business activity including decreased August hotel occupancy rates, decreased August State and local accommodations taxes generated, decreased State and local sales tax generated, and decreased August employment in tourist areas.
Decreased August tourist activity as schools start earlier, are not off-set by
increases in tourist activity in other summer months.
South Carolina Early School Start Dates and the South Carolina Travel and Tourism Industries Stephen C. Morse, Ph.D., Economist, School of Hotel, Restaurant and Tourism Management
University of South Carolina, Columbia
23
Starting schools in August mean schools must cool facilities for children during the hottest month of the year - August, costing unnecessary utility expenses by starting early, as opposed to starting after Labor Day in September.
One scenario estimates economic and tax revenue impacts where as little as
4 out of 10 families with children in South Carolina take one additional vacation if August summer vacation were restored; plus an induced additional 100,000 families from in-state and out-of-state family vacations would generate $180 million in total economic impact, $6.03 million is State tax revenues, $2.34 million in local tax revenues, and $8.37 million in total State and local tax revenues.