Embed Size (px)
Citation preview

South Carolina Longitudinal Information Center for Education
(SLICE)
Nancy Busbee, Ph.D.Paul Butler-Nalin, Ph.D.
South Carolina Department of Education
November 13, 2012
SLICE UPDATE

OC1 Establish data governance structures (Fall 2012)
OC2 Incorporate P-20 data (under way)OC3 Expand interfaces to the SLICE (under way)OC4 Integrate educator data (DSE) (Fall 2012)OC5 Implement data quality controls (completed)OC6 Integrate assessment data (under way)OC7 Implement a unique program identification
numbering system (under way)OC8 Implement a statewide curriculum
management system (CMS and Recommender System) (Winter 2012)
OC9 Implement a unique educator identifier (under way)
OC10 Provide accessible training for all stakeholder groups (under way)
STATEWIDE LONGITUDINAL DATA SYSTEM
PROJECT OUTCOMES

STATE AGENCY PARTNERS
• Department of Employment and Workforce• Department of Social Services• Office of First Steps• Office of Research and Statistics
• Department of Corrections
• Division of State Information Technology (eCommerce)

K-12 / HIGHER ED DATA LINKAGES
• Created Data Gateway with help of SC Office of Research and Statistics (ORS)
• Provides way to connect K-12 data to all ORS holdings – overcomes lack of common identifier
• Building direct link between K-12 and Higher Ed
• State Fiscal Stabilization Fund and EdFacts reporting requirements
• High School Feedback Report

COMMISSION ON HIGHER EDUCATION
• CHE will coordinate participation of the institutions in this project.
• Contract with National Student Clearinghouse
• Implement Business Intelligence tools – Cognos
• Expand the e-Transcript to include Higher Ed to Higher Ed transcripts
• Partnership between SCDE, CHE and ORS to develop a data gateway for linking K-12 and Higher ED data

UPD CONSULTING
• Contracted to help complete all grant goals by June 2013
• Redesign of SLICE technology architecture and web portal
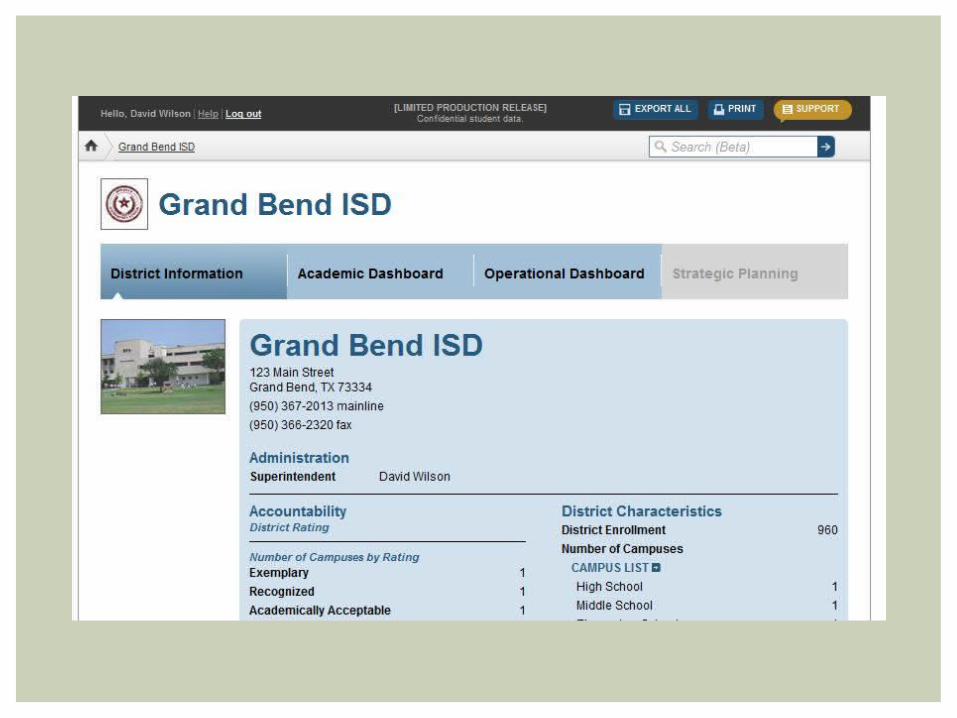
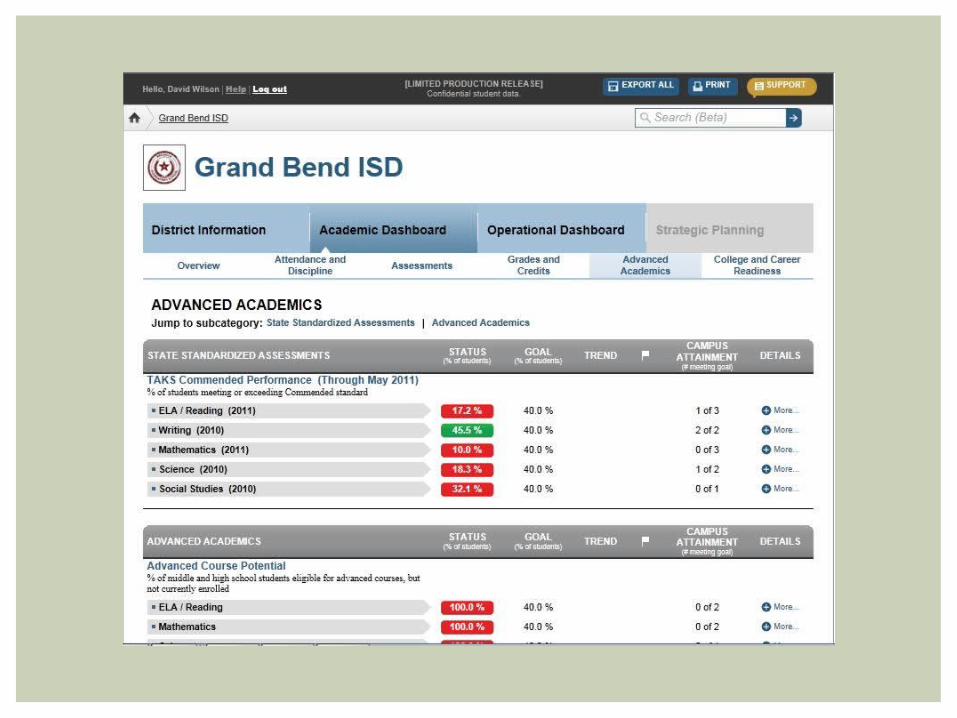
• Adoption of Dell Ed-Fi K-12 Education Dashboards (Michael and Susan Dell Foundation) http://www.ed-fi.org/for-states/
• ETL solutions to load PowerSchool data and all other identified data sources

SLICE
S L I C E


ABC AT-RISK FLAGS

SPPS DROP OUT DATA

SOUTH CAROLINA AT-RISK INDEX
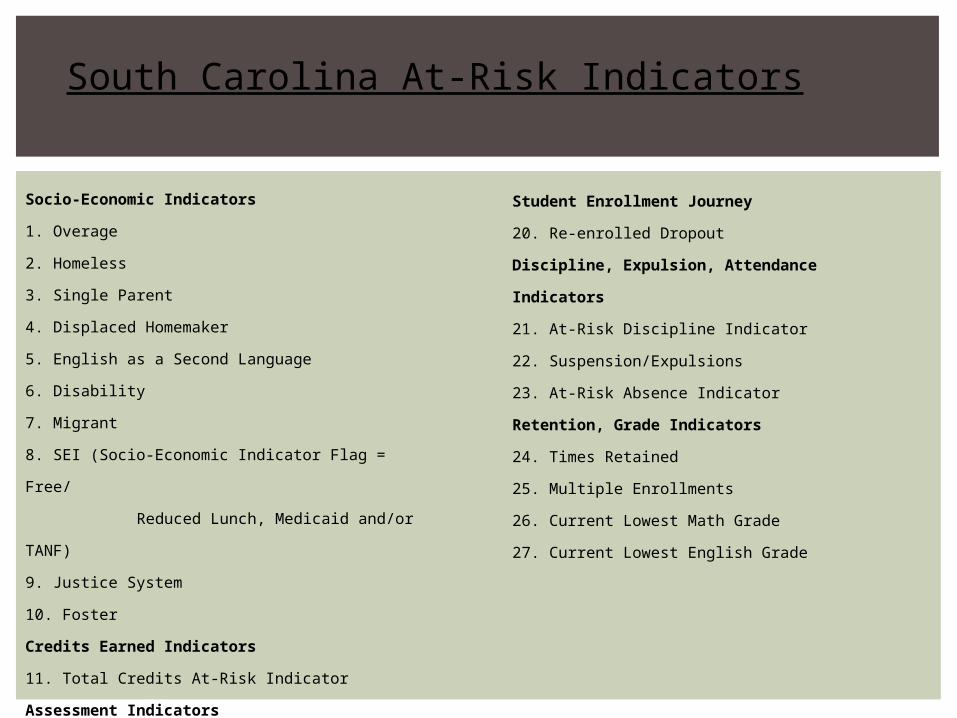
Socio-Economic Indicators
1. Overage
2. Homeless
3. Single Parent
4. Displaced Homemaker
5. English as a Second Language
6. Disability
7. Migrant
8. SEI (Socio-Economic Indicator Flag = Free/
Reduced Lunch, Medicaid and/or TANF)
9. Justice System
10. Foster
Credits Earned Indicators
11. Total Credits At-Risk Indicator
Assessment Indicators
12. 3rd Grade ELA
13. 3rd Grade Math
14. 5th Grade ELA
15. 5th Grade Math
16. 6th Grade ELA
17. 6th Grade Math
18. 8th Grade ELA
19. 8th Grade Math
Student Enrollment Journey
20. Re-enrolled Dropout
Discipline, Expulsion, Attendance Indicators
21. At-Risk Discipline Indicator
22. Suspension/Expulsions
23. At-Risk Absence Indicator
Retention, Grade Indicators
24. Times Retained
25. Multiple Enrollments
26. Current Lowest Math Grade
27. Current Lowest English Grade
South Carolina At-Risk Indicators

SPPSINDICATORS
LEVEL 1 (Moderate Risk)
1 point
LEVEL 2 (High Risk)
2 points
WeightFor Risk Total
Notes
Daily Absences 4-8 days absent >8 days absent
2.0Level 2 is same as SPPS
Daily Absences flag
Overage n/a> 2 years above appropriate age
1.5
Level 2 is same as SPPS Overage
flag
Credits Earned
n/a if(9th =5 cr,
10th = 12 cr,11th = 18 cr)
Same requirements as credits flag
(9th <=4 cr, 10th <= 10 cr,11th <= 16 cr)
1.5
Level 2 is same as SPPS Credits
flag
All Suspensions (ISS, OSS, Other)
1 or 2 suspensions; no expulsions
3 or more suspensions; any expulsions
1.0
In school, out-of-school, and other suspensions
included
PASS ELA Basic/Met Below Basic/Not Met 1 or 2 1.0 Latest score only
PASS Math Basic/MetBelow Basic/ Not Met 1 or
21.0 Latest score only
Reading/English n/aFailing most current
Reading or English grade
1.0 Previous year end Reading grade used for non-high school grade levels; English grade used for high school
Math n/a Failing math grade 1.0 Uses year end course
grade from previous year.
Discipline Events 3-5 6 or more1.0 Current year discipline
events
English Proficiency n/a A,B,C,D,1,2 or 3 ESL Score0.5 Uses SPPS ESL
flag
SC WEIGHTED AT-RISK INDEX