Embed Size (px)
Citation preview
Prepared for the Southern California Association of Governments
December 2012
Southern CaliforniaPlug-in Electric Vehicle Readiness Plan

About this DocumentThis document was prepared for the Southern California Association of Governments (SCAG) by the UCLA Luskin Center for Innovation. It constitutes Deliverable 10 of SCAG contract 12-021-C1 to support regional planning for plug-in electric vehicle (PEV) adoption. SCAG is coordinating a multi-stakeholder group of government agencies, utilities, and university researchers to prepare multi-faceted and interdisciplinary regional PEV readiness plans. Among other purposes, these plans will help illuminate and guide strategic infrastructure investment, PEV-related economic development, and supportive policy design in Southern California.
DisclaimerThis report was prepared as a result of work sponsored, paid for, in whole or in part, by a U.S. Department of Energy (DOE) Award to the South Coast Air Quality Management District (AQMD). The opinions, findings, conclusions, and recommendations are those of the authors and do not necessarily represent the views of AQMD or the DOE. The AQMD and DOE, their officers, employees, contractors, and subcontractors make no warranty, expressed or implied, and assume no legal liability for the information in this report. The AQMD and DOE have not approved or disapproved this report, nor have the AQMD or DOE passed upon the accuracy or adequacy of the information contained herein.
This document was prepared as a result of work sponsored by the California Energy Commission. It does not necessarily represent the views of the Energy Commission, its employees, or the State of California. The Commission, the State of California, its employees, contractors, and subcontractors make no warranty, express or implied, and assume no legal liability for the information in this document; nor does any party represent that the use of this information will not infringe upon privately owned rights.
Acknowledgements We thank the Southern California Association of Governments, the South Coast Air Quality Management District, U.S. Department of Energy, and the California Energy Commission for support of this project. In particular, we thank Marco Anderson of SCAG, Patricia Kwon of SCAQMD and the other governmental and utility members of the SoCal PEV Coordinating Council for their guidance and assistance. We also thank the University of California Office of the President Multicampus Research Programs and Initiatives for its support.
For More Information Contact J.R. DeShazo, Director, UCLA Luskin Center for Innovation, [email protected]; luskin.ucla.edu/ev
Southern California Plug-in Electric Vehicle Readiness Plan
Southern California Plug-in Electric Vehicle Readiness Plan
Principal Investigator
J.R. DeShazo, Ph.D.
Project Manager
Ayala Ben-Yehuda
Spatial Analysis and Cartography
Norman Wong
Design and Layout
Susan Woodward
Cover Design
Will Sherwood
Contributors
Vicky Hsu
Patricia Kwon
Benjamin Nguyen
Jon Overman
Tamar Sarkisian
Michael Sin
Alex Turek
Brett Williams, MPhil (cantab), Ph.D.
Christian Zarate
UCLA Luskin Center, December 2012DRAFT
Southern California Plug-in Electric Vehicle Readiness PlanContents
1 Introduction ................................................................................................................ 11.1 How to use this Plan ................................................................................................ 21.2 The Southern California Plug-in Electric Vehicle Atlas ............................................. 31.3 Utility PEV growth projections ................................................................................. 4
2 The PEV Ecosystem ...................................................................................................... 52.1 Introduction ............................................................................................................. 52.2 Shopping for a PEV ................................................................................................... 52.3 Refueling at single-family homes ............................................................................. 62.4 Refueling at multi-unit dwellings ............................................................................. 72.5 Refueling at workplaces, retail, and public places ................................................... 82.6 The role of government ........................................................................................... 9
3 PEVs and Charging Basics ........................................................................................... 113.1 Introduction .......................................................................................................... 113.2 Emerging PEV trends .............................................................................................. 11
3.2.1 Battery electric vehicles ............................................................................ 133.2.2 Plug-in hybrid electric vehicles ................................................................. 13
3.3 Charge levels .......................................................................................................... 143.3.1 Level 1 ....................................................................................................... 153.3.2 Level 2 ....................................................................................................... 153.3.3 DC fast charging ........................................................................................ 163.3.4 Multi-armed chargers ............................................................................... 16
3.4 Charging environments .......................................................................................... 173.5 Finding charge stations .......................................................................................... 173.6 References.............................................................................................................. 19
4 Evaluating Land Use Opportunities and Existing Charge Stations ................................ 204.1 Introduction .......................................................................................................... 204.2 Identifying local land use priorities for PEV readiness .......................................... 20
4.2.1 Steps and assumptions in land use/parking analysis ................................ 214.3 Conventional wisdom on charging sites vs. municipal land use priorities ............ 224.4 State, regional, and local land use planning metrics ........................................... 23
UCLA Luskin Center, December 2012 DRAFT
4.4.1 Estimates of parking space counts by land use ........................................ 234.4.2 Estimating shares of parking spaces by land use ...................................... 244.4.3 Spatial density of parking spaces by land use ........................................... 24
4.5 The base of the pyramid: assessing residential potential ...................................... 244.5.1 Single-family homes in Los Angeles County ............................................. 254.5.2 Multi-unit dwellings .................................................................................. 26
4.6 Workplace charging in the parking/land use assessment .................................... 284.7 Publicly-accessible charging opportunities ............................................................ 29
4.7.1 Council of government charge station maps .......................................... 294.7.2 A regional overview of publicly-accessible charge stations ..................... 304.7.3 Types of charging site owners ................................................................... 314.7.4 Types of charging sites ............................................................................. 31
4.8 Charging locations for long-distance travel ............................................................ 334.9 Recommendations ................................................................................................. 334.10 References.............................................................................................................. 33
5 Demand-driven PEV Planning and Single-Family Residential Charging ........................ 345.1 Introduction ........................................................................................................... 345.2 Assessing the single-family home charging opportunity........................................ 355.3 Where will PEVs be parked overnight? .................................................................. 355.4 Where will PEVs be parked during the day? .......................................................... 385.5 How significant a land use are single-family homes in my jurisdiction? ................ 39
5.5.1 Ranking cities by single-family residential counts ................................... 395.5.2 Ranking cities by single-family vs. other uses .......................................... 40
5.6 The single-family charging installation process ...................................................... 425.7 PEV planning reduces the cost of electric driving .................................................. 435.8 References.............................................................................................................. 46
6 Planning for Charging in Multi-Unit Dwellings ............................................................ 476.1 Introduction ........................................................................................................... 476.2 Planning metrics for MUD charging ...................................................................... 47
6.2.1 Ranking cities by MUD counts ................................................................. 486.2.2 Ranking cities by MUDs vs. other uses .................................................... 496.2.3 Measuring MUD charging potential within cities ..................................... 51
6.3 Mapping MUD charging potential at the COG level ............................................... 526.4 The PEV Charging Installation Process in MUDs ..................................................... 54
UCLA Luskin Center, December 2012DRAFT
6.5 Barriers to charging in MUDs ................................................................................. 556.5.1 Institutional and physical barriers to PEV charging .................................. 556.5.2 MUD cost recovery rules .......................................................................... 56
6.6 Financial viability of multi-unit dwelling charging.................................................. 566.6.1 How much resident demand will there be for PEV charging? .................. 576.6.2 How should the MUD owner price PEV charging?.................................... 586.6.3 How much charging capacity should the MUD owner provide? .............. 586.6.4 Financial viability scenarios ...................................................................... 586.6.5 Recovering costs of charging the first PEV ................................................ 596.6.6 Recovering the costs of charging several PEVs ......................................... 636.6.7 Selecting Pricing Policies for MUD Charging ............................................. 64
6.7 State-level policies for MUDs ................................................................................. 646.7.1 “EV rights” in MUDs .................................................................................. 64
6.8 Recommendations for facilitating MUD charging .................................................. 656.8.1 Utility policies ........................................................................................... 656.8.2 Regional planners ..................................................................................... 666.8.3 Local planners ........................................................................................... 66
6.9 References.............................................................................................................. 677 Planning for Workplace Charging ............................................................................... 69
7.1 Introduction ........................................................................................................... 697.2 Assessing the workplace charging opportunity ..................................................... 70
7.2.1 How many employees and workplaces are there in absolute numbers within each city? ...................................................................................... 70
7.2.2 How significant are workplaces compared to other types of parcels? .... 717.2.3 What are the largest employers and where are they located? ................ 727.2.4 Which employers have the highest numbers of white-collar and high-tech
workers? .................................................................................................. 737.2.5 Which employers are located in neighborhoods where current PEV owners
drive on weekday mornings? ................................................................... 757.3 The workplace PEV charging installation process .................................................. 777.4 Planning for workplace charging ............................................................................ 78
7.4.1 Typical workplace charging considerations .............................................. 797.4.2 Pre-planning ............................................................................................. 797.4.3 Installation ................................................................................................ 79
UCLA Luskin Center, December 2012 DRAFT
7.4.4 Economic considerations .......................................................................... 797.5 Financial viability of workplace charging ............................................................... 80
7.5.1 How much employee demand will there be for PEV charging? ................ 807.5.2 How should the employer price PEV charging? ........................................ 817.5.3 How much charging capacity should the employer provide? ................... 817.5.4 Financial viability scenarios ...................................................................... 817.5.5 Recovering costs of charging the first PEV ................................................ 827.5.6 Recovering the costs of charging several PEVs ......................................... 867.5.7 Selecting Pricing Policies for Workplace Charging .................................... 877.5.8 Institutional and physical barriers to PEV charging .................................. 87
7.6 Recommendations for facilitating workplace charging .......................................... 887.6.1 Utility policies ........................................................................................... 887.6.2 Regional planners ..................................................................................... 887.6.3 Local planners ........................................................................................... 89
7.7 References.............................................................................................................. 898 Planning for Retail and Public Sector Charging ........................................................... 90
8.1 Introduction ........................................................................................................... 908.2 Evaluative criteria for the selection of public-sector and retail charging sites ....... 90
8.2.1 Sites and areas with high potential demand for charging ....................... 918.2.2 Criteria for selecting cost-effective charge sites ....................................... 928.2.3 Retail site characteristics that affect benefits ........................................... 938.2.4 Types of publicly-owned and retail sites ................................................... 93
8.3 Siting of retail charging stations ............................................................................. 948.4 Siting public-sector charging sites .......................................................................... 988.5 Pricing, utilization and the financial viability of retail charging.............................. 99
8.5.1 How much customer demand will there be for PEV charging? ................ 998.5.2 How should the retailer price PEV charging?............................................ 998.5.3 How much charging capacity should the retailer provide? ...................... 998.5.4 Financial viability scenarios for retailers ................................................. 100
8.6 References............................................................................................................ 1029 Pricing Policies for PEV Infrastructure ...................................................................... 103
9.1 Introduction ......................................................................................................... 1039.2 The benefits of well-designed pricing policies ..................................................... 1049.3 Types of pricing policies ....................................................................................... 105
UCLA Luskin Center, December 2012DRAFT
9.3.1 Monthly flat fees..................................................................................... 1069.3.2 Hourly rates ............................................................................................ 1069.3.3 Markup on costs ..................................................................................... 1069.3.4 Combination rates .................................................................................. 107
9.4 Evaluative criteria ................................................................................................. 1079.5 Why pricing policies mean different things to different PEV drivers ................... 107
9.5.1 Monthly flat fees..................................................................................... 1089.5.2 Hourly rates ............................................................................................ 1099.5.3 Markup on costs ..................................................................................... 1109.5.4 The costs of alternatives to workplace, commercial retail, and MUD
charging ................................................................................................. 1109.6 Choosing pricing policies for different charge environments ............................... 1119.7 References............................................................................................................ 112
10 Zoning Policies for PEV Readiness ............................................................................ 11310.1 Introduction ......................................................................................................... 11310.2 Charging as an allowed use .................................................................................. 114
10.2.1 San Jacinto (proposed) ........................................................................... 11510.2.2 Lancaster ................................................................................................ 115
10.3 Development incentives ...................................................................................... 11610.3.1 San Jacinto (proposed) ........................................................................... 11710.3.2 San Clemente .......................................................................................... 11710.3.3 Hawaii .................................................................................................... 118
10.4 Recommendations ............................................................................................... 11810.5 Additional resources ............................................................................................ 11910.6 References............................................................................................................ 119
11 Building Codes for PEV Readiness ............................................................................ 12111.1 Introduction ......................................................................................................... 12111.2 CALGreen ............................................................................................................. 12211.3 Local ordinances in the South Coast region ......................................................... 124
11.3.1 Panel capacity and outlets ...................................................................... 12411.3.2 Conduits and meters............................................................................... 12511.3.3 Charging units ......................................................................................... 12511.3.4 Beverly Hills ........................................................................................... 12611.3.5 Lancaster ................................................................................................ 126
UCLA Luskin Center, December 2012 DRAFT
11.3.6 City of Los Angeles ................................................................................. 12811.3.7 Rolling Hills Estates ................................................................................ 12811.3.8 Temecula ................................................................................................ 12911.3.9 Torrance (proposed) ............................................................................... 129
11.4 Conclusion ............................................................................................................ 12911.5 Recommendations .............................................................................................. 13011.6 Additional resources ............................................................................................ 13011.7 References............................................................................................................ 131
12 Permits and Inspections for PEV Readiness .............................................................. 13412.1 Introduction ......................................................................................................... 13412.2 The Installation Process ....................................................................................... 13512.3 Right-sizing permits and inspections .................................................................... 13612.4 Assessing opportunities to streamline ................................................................. 13712.5 Recommendations ............................................................................................... 13812.6 References............................................................................................................ 140
13 Parking Guidelines for PEV Readiness ...................................................................... 14213.1 Introduction ......................................................................................................... 14213.2 Location and number of charging spaces ............................................................. 14313.3 Designing ADA-compliant PEV charging spaces ................................................... 143
13.3.1 Division of the State Architect Interim Disabled Access Guidelines for Electrical Vehicle Charging Stations ........................................................ 144
13.3.2 California PEV Collaborative Accessibility Guidelines ............................. 14613.4 Managing access to charging spaces.................................................................... 149
13.4.1 Santa Monica (2012) ............................................................................... 14913.5 Pricing PEV parking .............................................................................................. 14913.6 Signage ................................................................................................................. 150
13.6.1 Other sign considerations ....................................................................... 15213.7 PEV parking in different environments ................................................................ 15213.8 Recommendations ............................................................................................... 15213.9 Additional resources ............................................................................................ 15313.10 References............................................................................................................ 154
14 Utility Policies .......................................................................................................... 15514.1 Introduction ......................................................................................................... 15514.2 Current and future PEV ownership across utilities within the region .................. 155
UCLA Luskin Center, December 2012DRAFT
14.3 Streamlining permits and site inspections ........................................................... 15814.4 PEV time-of-use rates ........................................................................................... 158
14.4.1 Single-family residential policies............................................................. 15814.4.2 Multi-unit residential policies ................................................................. 15914.4.3 Commercial TOU Policies ........................................................................ 159
14.5 Incentives ............................................................................................................. 16014.5.1 Second meter incentives ........................................................................ 16014.5.2 Equipment rebates ................................................................................. 16014.5.3 Other types of rebates ............................................................................ 160
14.6 Customer Education ............................................................................................. 16014.7 Utility recommendations ..................................................................................... 16214.8 Additional resources ............................................................................................ 16214.9 References............................................................................................................ 163
15 Developing PEV Outreach Campaigns ...................................................................... 16415.1 Introduction ......................................................................................................... 164
15.1.1 Local marketing and outreach efforts to date ........................................ 16515.2 Single-family residential charging ........................................................................ 166
15.2.1 What stakeholders should be the target of outreach efforts? ................ 16615.2.2 How should stakeholders be engaged? ................................................. 166
15.3 Multi-unit dwelling charging ................................................................................ 16715.3.1 What stakeholders should be the target of outreach efforts? ................ 16715.3.2 How should stakeholders be engaged? ................................................. 168
15.4 Workplace charging ............................................................................................. 16915.4.1 What stakeholders should be the target of outreach efforts? ................ 16915.4.2 How should stakeholders be engaged? ................................................. 169
15.5 Retail charging ...................................................................................................... 17015.5.1 What stakeholders should be the target of outreach efforts? ................ 17115.5.2 How should stakeholders be engaged? ................................................. 171
UCLA Luskin Center, December 2012 DRAFT
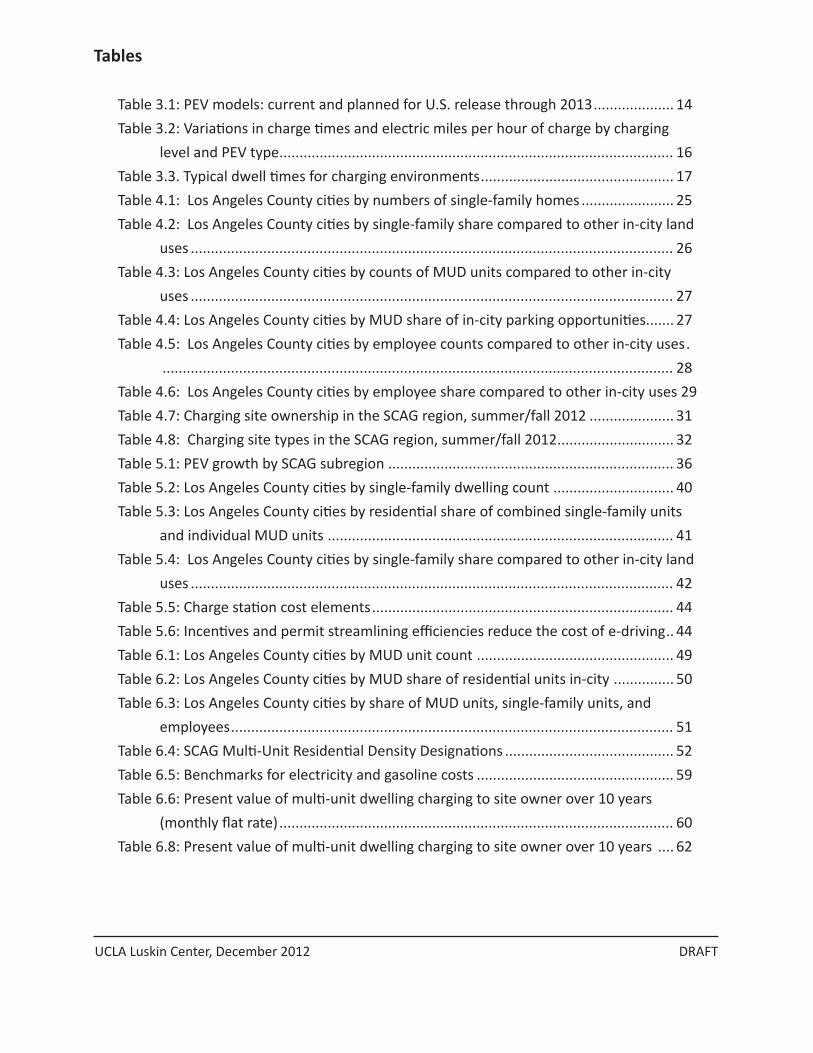
Tables
Table 3.1: PEV models: current and planned for U.S. release through 2013 .................... 14Table 3.2: Variations in charge times and electric miles per hour of charge by charging
level and PEV type .................................................................................................. 16Table 3.3. Typical dwell times for charging environments ................................................ 17Table 4.1: Los Angeles County cities by numbers of single-family homes ....................... 25Table 4.2: Los Angeles County cities by single-family share compared to other in-city land
uses ........................................................................................................................ 26Table 4.3: Los Angeles County cities by counts of MUD units compared to other in-city
uses ........................................................................................................................ 27Table 4.4: Los Angeles County cities by MUD share of in-city parking opportunities....... 27Table 4.5: Los Angeles County cities by employee counts compared to other in-city uses .
............................................................................................................................... 28Table 4.6: Los Angeles County cities by employee share compared to other in-city uses 29Table 4.7: Charging site ownership in the SCAG region, summer/fall 2012 ..................... 31Table 4.8: Charging site types in the SCAG region, summer/fall 2012 ............................. 32Table 5.1: PEV growth by SCAG subregion ....................................................................... 36Table 5.2: Los Angeles County cities by single-family dwelling count .............................. 40Table 5.3: Los Angeles County cities by residential share of combined single-family units
and individual MUD units ...................................................................................... 41Table 5.4: Los Angeles County cities by single-family share compared to other in-city land
uses ........................................................................................................................ 42Table 5.5: Charge station cost elements ........................................................................... 44Table 5.6: Incentives and permit streamlining efficiencies reduce the cost of e-driving .. 44Table 6.1: Los Angeles County cities by MUD unit count ................................................. 49Table 6.2: Los Angeles County cities by MUD share of residential units in-city ............... 50Table 6.3: Los Angeles County cities by share of MUD units, single-family units, and
employees .............................................................................................................. 51Table 6.4: SCAG Multi-Unit Residential Density Designations .......................................... 52Table 6.5: Benchmarks for electricity and gasoline costs ................................................. 59Table 6.6: Present value of multi-unit dwelling charging to site owner over 10 years
(monthly flat rate) .................................................................................................. 60Table 6.8: Present value of multi-unit dwelling charging to site owner over 10 years .... 62
UCLA Luskin Center, December 2012DRAFT
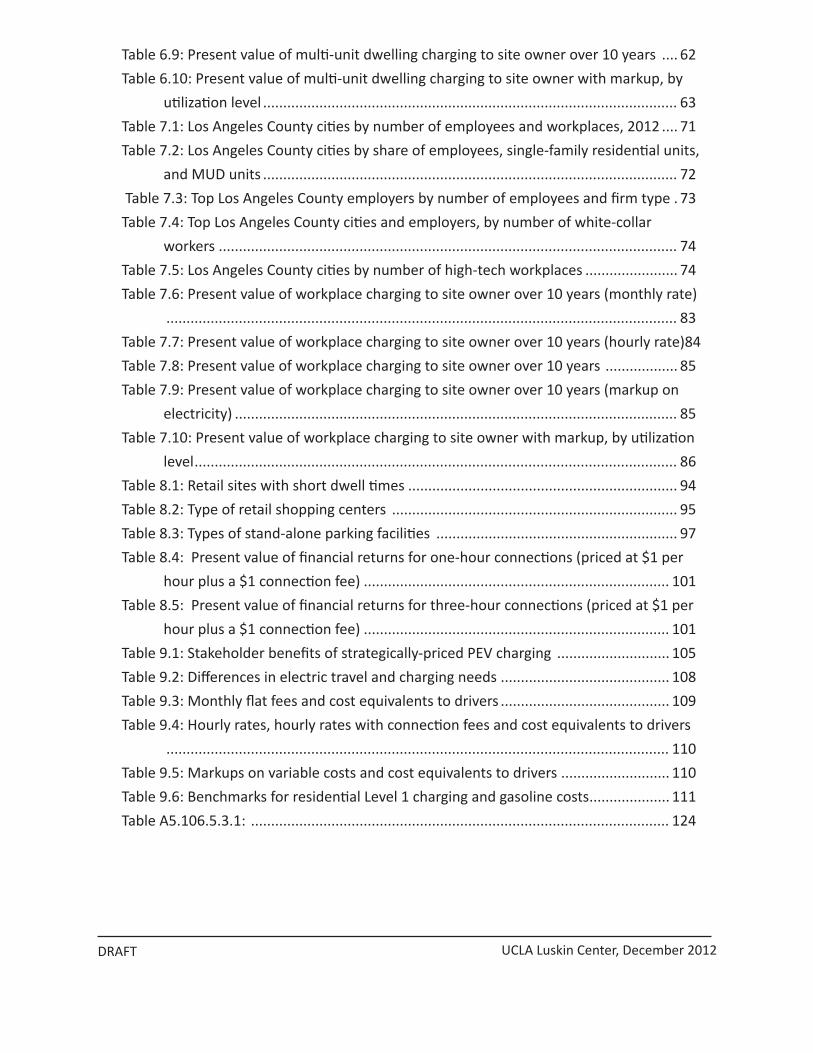
Table 6.9: Present value of multi-unit dwelling charging to site owner over 10 years .... 62Table 6.10: Present value of multi-unit dwelling charging to site owner with markup, by
utilization level ....................................................................................................... 63Table 7.1: Los Angeles County cities by number of employees and workplaces, 2012 .... 71Table 7.2: Los Angeles County cities by share of employees, single-family residential units,
and MUD units ....................................................................................................... 72 Table 7.3: Top Los Angeles County employers by number of employees and firm type . 73Table 7.4: Top Los Angeles County cities and employers, by number of white-collar
workers .................................................................................................................. 74Table 7.5: Los Angeles County cities by number of high-tech workplaces ....................... 74Table 7.6: Present value of workplace charging to site owner over 10 years (monthly rate)
............................................................................................................................... 83Table 7.7: Present value of workplace charging to site owner over 10 years (hourly rate) 84Table 7.8: Present value of workplace charging to site owner over 10 years .................. 85Table 7.9: Present value of workplace charging to site owner over 10 years (markup on
electricity) .............................................................................................................. 85Table 7.10: Present value of workplace charging to site owner with markup, by utilization
level ........................................................................................................................ 86Table 8.1: Retail sites with short dwell times ................................................................... 94Table 8.2: Type of retail shopping centers ....................................................................... 95Table 8.3: Types of stand-alone parking facilities ............................................................ 97Table 8.4: Present value of financial returns for one-hour connections (priced at $1 per
hour plus a $1 connection fee) ............................................................................ 101Table 8.5: Present value of financial returns for three-hour connections (priced at $1 per
hour plus a $1 connection fee) ............................................................................ 101Table 9.1: Stakeholder benefits of strategically-priced PEV charging ............................ 105Table 9.2: Differences in electric travel and charging needs .......................................... 108Table 9.3: Monthly flat fees and cost equivalents to drivers .......................................... 109Table 9.4: Hourly rates, hourly rates with connection fees and cost equivalents to drivers
............................................................................................................................. 110Table 9.5: Markups on variable costs and cost equivalents to drivers ........................... 110Table 9.6: Benchmarks for residential Level 1 charging and gasoline costs .................... 111Table A5.106.5.3.1: ........................................................................................................ 124
UCLA Luskin Center, December 2012 DRAFT
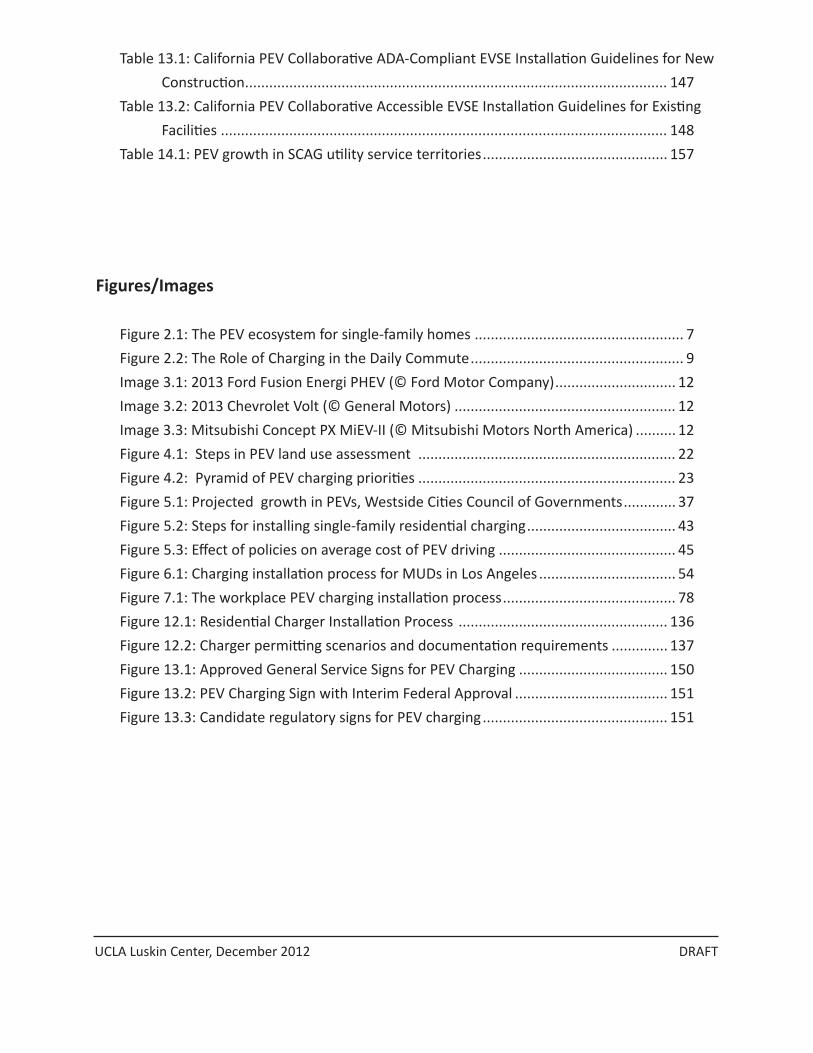
Figures/Images
Figure 2.1: The PEV ecosystem for single-family homes .................................................... 7Figure 2.2: The Role of Charging in the Daily Commute ..................................................... 9Image 3.1: 2013 Ford Fusion Energi PHEV (© Ford Motor Company) .............................. 12Image 3.2: 2013 Chevrolet Volt (© General Motors) ....................................................... 12Image 3.3: Mitsubishi Concept PX MiEV-II (© Mitsubishi Motors North America) .......... 12Figure 4.1: Steps in PEV land use assessment ................................................................ 22Figure 4.2: Pyramid of PEV charging priorities ................................................................ 23Figure 5.1: Projected growth in PEVs, Westside Cities Council of Governments ............. 37Figure 5.2: Steps for installing single-family residential charging ..................................... 43Figure 5.3: Effect of policies on average cost of PEV driving ............................................ 45Figure 6.1: Charging installation process for MUDs in Los Angeles .................................. 54Figure 7.1: The workplace PEV charging installation process ........................................... 78Figure 12.1: Residential Charger Installation Process .................................................... 136Figure 12.2: Charger permitting scenarios and documentation requirements .............. 137Figure 13.1: Approved General Service Signs for PEV Charging ..................................... 150Figure 13.2: PEV Charging Sign with Interim Federal Approval ...................................... 151Figure 13.3: Candidate regulatory signs for PEV charging .............................................. 151
Table 13.1: California PEV Collaborative ADA-Compliant EVSE Installation Guidelines for New Construction ......................................................................................................... 147
Table 13.2: California PEV Collaborative Accessible EVSE Installation Guidelines for Existing Facilities ............................................................................................................... 148
Table 14.1: PEV growth in SCAG utility service territories .............................................. 157
UCLA Luskin Center, December 2012DRAFT
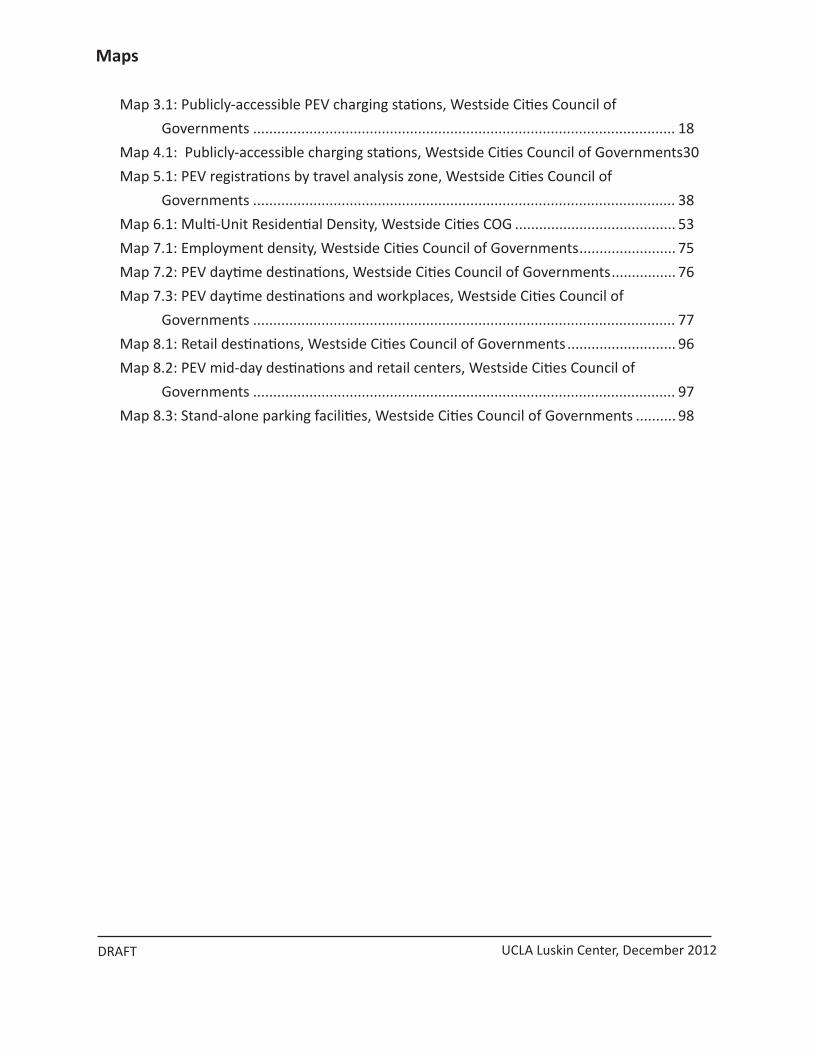
Maps
Map 3.1: Publicly-accessible PEV charging stations, Westside Cities Council of Governments ......................................................................................................... 18
Map 4.1: Publicly-accessible charging stations, Westside Cities Council of Governments 30Map 5.1: PEV registrations by travel analysis zone, Westside Cities Council of
Governments ......................................................................................................... 38Map 6.1: Multi-Unit Residential Density, Westside Cities COG ........................................ 53Map 7.1: Employment density, Westside Cities Council of Governments ........................ 75Map 7.2: PEV daytime destinations, Westside Cities Council of Governments ................ 76Map 7.3: PEV daytime destinations and workplaces, Westside Cities Council of
Governments ......................................................................................................... 77Map 8.1: Retail destinations, Westside Cities Council of Governments ........................... 96Map 8.2: PEV mid-day destinations and retail centers, Westside Cities Council of
Governments ......................................................................................................... 97Map 8.3: Stand-alone parking facilities, Westside Cities Council of Governments .......... 98
20 UCLA Luskin Center, December 2012DRAFT
4 Evaluating Land Use Opportunities and Existing Charge Stations
4.1 Introduction
Plug-in electric vehicles charge while parked. Parking spaces are distributed over local land uses such as single-family residential, multi-unit residential, workplaces, and retail establishments. The type and availability of parking spaces at these land uses will vary across municipalities. Variation in these parking resources will shape local PEV readiness efforts, by defining both the opportunities and the limits on where, how much and when PEV charging can occur locally. This chapter explains the role a parking assessment by land use should play in developing a local PEV readiness plan. It also illustrates some planning metrics that can be used to identify local land use opportunities and constraints that should guide the prioritization of local PEV charging strategies.
The second half of this chapter presents the location and level of service provided by existing publicly-accessible charge stations in the region. Such spatial information can be used by planners to better understand their current publicly-accessible charging resources. It can also be used to identify where there are gaps in meeting demand for charging as described in the chapters on charging at workplaces (Chapter 7), government properties and retail establishments (Chapter 8).
4.2 Identifying local land use priorities for PEV readiness
One goal of municipal PEV readiness planning is to expand PEV drivers’ access to charging opportunities. In pursuit of this goal, PEV planners would ideally like to know:
• How many parking spaces are there in my jurisdiction? • Where are the parking spaces on all parcels in my jurisdiction? • At what times of day and night do drivers use those spaces? • How long are cars typically parked in those spaces?
21 Evaluating Land Use Opportunities and Existing Charge Stations DRAFT
These characteristics of parking spaces determine both how long PEVs can charge and what the cost of electricity will be during the time that PEV reside in these spaces. Planners can acquire this information on parking utilization patterns by identifying the types of land uses (e.g., residential, workplace, retail) associated with the parcels that host these parking spaces. Knowing the distribution of land uses within a jurisdiction is also helpful because different land uses are also associated with distinctive parking, electrical, and building configurations which can greatly and systematically affect the cost of installing charging equipment on that parcel.
Understanding the distribution of parking spaces across land uses is the foundation for all subsequent municipal PEV planning. It enables planners to understand the number and type of potential charging sites within their jurisdiction. Planners are able to prioritize PEV planning for dominant local land uses. A parking-oriented land use analysis also enables them to anticipate when during the day or night PEV drivers charge at these different parcels. This will help utilities track changes in the electrical load over space and time as the PEV market grows. Finally, a land use analysis of parking enables planners to roughly anticipate where the high- and low-cost charging opportunities will be and how many of each type their jurisdiction is likely to have.
4.2.1 Steps and assumptions in land use/parking analysis
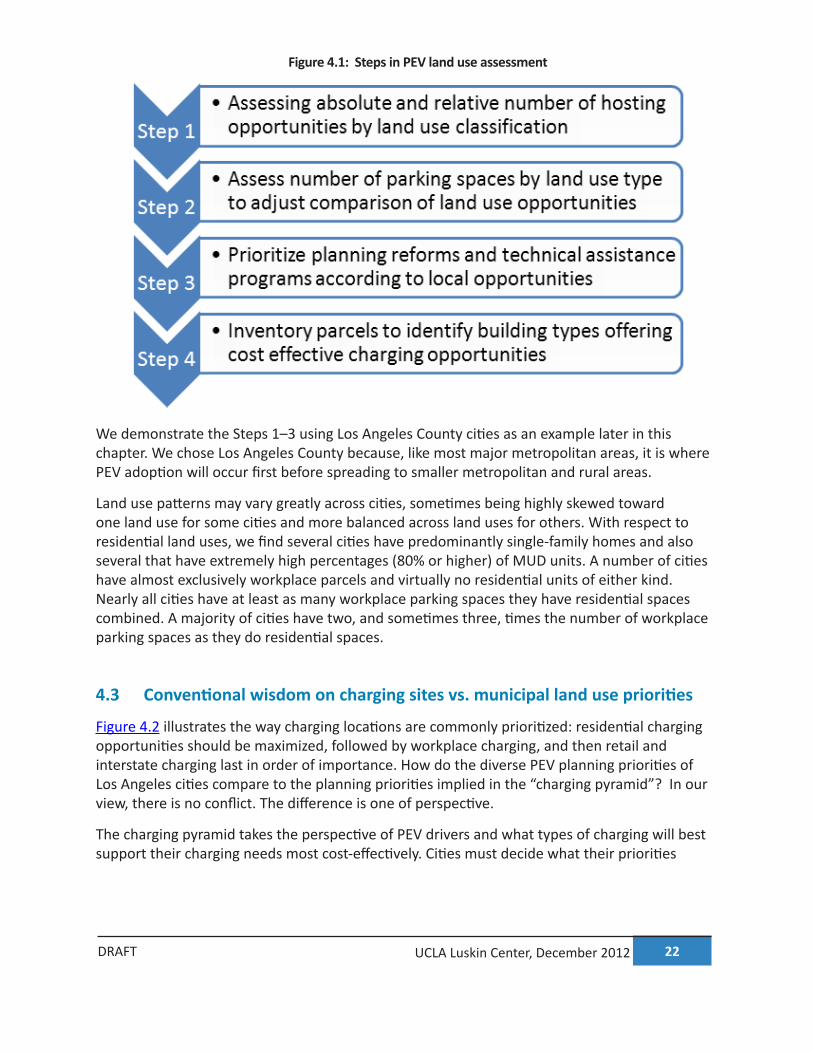
A central task within municipal PEV plans should be to identify and prioritize planning for those types of charging environments given the availability of local land use hosting opportunities. Figure 4.1 describes the steps involved in this planning process.
First, planners must identify the availability of types of residential, workplace, government-owned and retail parcels that could host charging infrastructure. This involves identifying the location and numbers parcels of different types.
Second, the number of potential parking spaces at each parcel must be estimated. Ideally this would be based on the knowledge of local zoning and building code history (or, even better, a field survey of parking at these parcels). However, in the absence of more refined information, we make the following simplified assumptions for the purposes of illustrating analysis:
• We assume that the number of residential units on a parcel is equal to the number of on-site parking spaces for both single-family and multi-unit dwellings (MUDs).
• We count MUDs in terms of individual units (i.e., apartments or condominiums), not buildings, because each unit represents at least one potential parking space. For MUDs that do not have parking, workplaces and publicly-accessible sites will become important charging options.
• We also assume that there is a parking space for every employee at a workplace.
The third step involves deciding which types of land use and parking resources should be targeted and in which order. The fourth step, which involves evaluating and targeting specific parcels within a land use category, will not be discussed in this chapter but an example of it can be found in the chapter on workplace charging (Chapter 7).
22 UCLA Luskin Center, December 2012DRAFT
Figure 4.1: Steps in PEV land use assessment
We demonstrate the Steps 1–3 using Los Angeles County cities as an example later in this chapter. We chose Los Angeles County because, like most major metropolitan areas, it is where PEV adoption will occur first before spreading to smaller metropolitan and rural areas.
Land use patterns may vary greatly across cities, sometimes being highly skewed toward one land use for some cities and more balanced across land uses for others. With respect to residential land uses, we find several cities have predominantly single-family homes and also several that have extremely high percentages (80% or higher) of MUD units. A number of cities have almost exclusively workplace parcels and virtually no residential units of either kind. Nearly all cities have at least as many workplace parking spaces they have residential spaces combined. A majority of cities have two, and sometimes three, times the number of workplace parking spaces as they do residential spaces.
4.3 Conventional wisdom on charging sites vs. municipal land use priorities
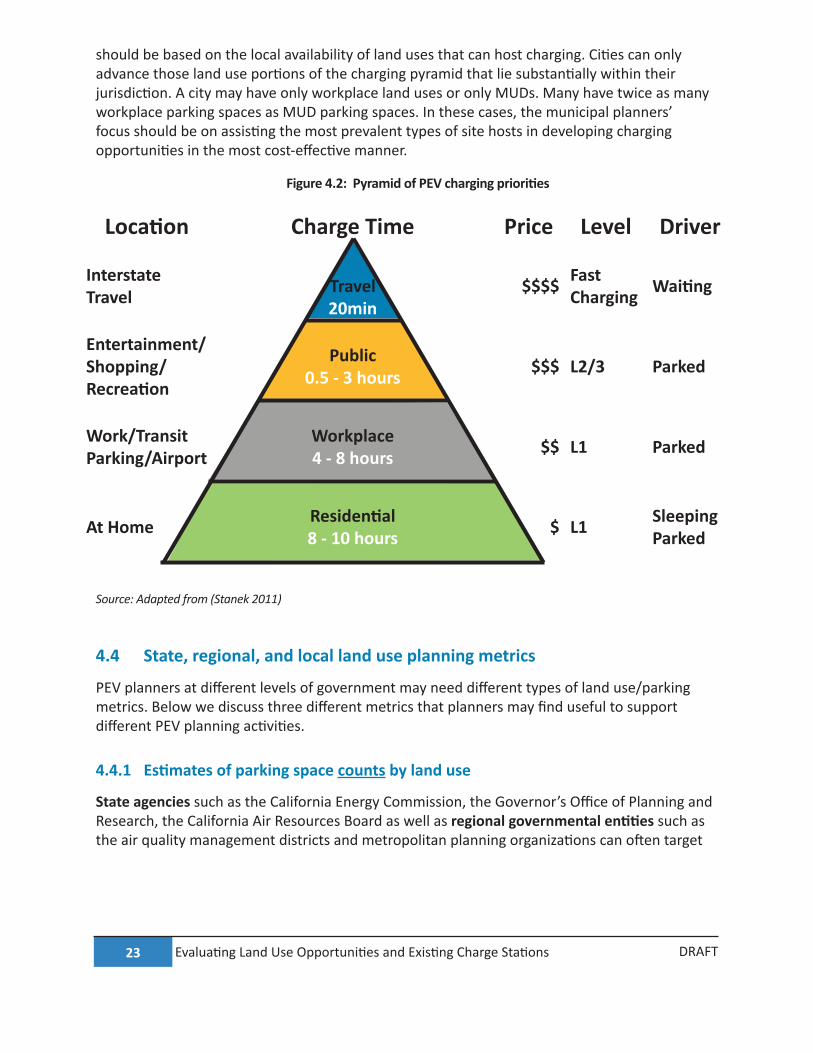
Figure 4.2 illustrates the way charging locations are commonly prioritized: residential charging opportunities should be maximized, followed by workplace charging, and then retail and interstate charging last in order of importance. How do the diverse PEV planning priorities of Los Angeles cities compare to the planning priorities implied in the “charging pyramid”? In our view, there is no conflict. The difference is one of perspective.
The charging pyramid takes the perspective of PEV drivers and what types of charging will best support their charging needs most cost-effectively. Cities must decide what their priorities
23 Evaluating Land Use Opportunities and Existing Charge Stations DRAFT
should be based on the local availability of land uses that can host charging. Cities can only advance those land use portions of the charging pyramid that lie substantially within their jurisdiction. A city may have only workplace land uses or only MUDs. Many have twice as many workplace parking spaces as MUD parking spaces. In these cases, the municipal planners’ focus should be on assisting the most prevalent types of site hosts in developing charging opportunities in the most cost-effective manner.
Figure 4.2: Pyramid of PEV charging priorities
Location Charge Time Price Level Driver
Interstate Travel Travel
20min$$$$ Fast
Charging Waiting
Entertainment/Shopping/ Recreation
Public0.5 - 3 hours $$$ L2/3 Parked
Work/Transit Parking/Airport
Workplace4 - 8 hours $$ L1 Parked
At Home Residential8 - 10 hours $ L1 Sleeping
Parked
Source: Adapted from (Stanek 2011)
4.4 State, regional, and local land use planning metrics
PEV planners at different levels of government may need different types of land use/parking metrics. Below we discuss three different metrics that planners may find useful to support different PEV planning activities.
4.4.1 Estimates of parking space counts by land use
State agencies such as the California Energy Commission, the Governor’s Office of Planning and Research, the California Air Resources Board as well as regional governmental entities such as the air quality management districts and metropolitan planning organizations can often target

24 UCLA Luskin Center, December 2012DRAFT
and support local municipal PEV planning reforms. Often these state and regional planners must decide which municipalities to prioritize for outreach because they have limited resources. For example, consider a state or regional planner who wants to only target a limited number of municipalities for the PEV planning reforms discussed in Chapter 10 through Chapter 13. These state and regional planners will maximize the effectiveness of their resources by prioritizing reforms in jurisdictions with the largest numbers of the targeted site hosts and/or drivers. In doing so, the policy reforms that are implemented will affect the largest absolute number of prospective charge station site hosts and/or drivers. In order to know which municipalities to target, state and regional planners will need to know how many parking spaces are located at different land uses across municipalities.
4.4.2 Estimating shares of parking spaces by land use
Municipal planners may wish to know what share of parking in their jurisdictions is tied to each land use in order to prioritize PEV planning around those most frequently-encountered land uses. These planning metrics will enable them to assess the relative importance of different land uses within their local PEV readiness plan. For example, a municipality such as Vernon will prioritize workplace charging because this is where nearly 99% of all of its parking spaces are by land use. The municipality of West Hollywood will prioritize MUD charging because nearly all of its residential housing is MUD, representing nearly 43% of all parking spaces by land use. While parking space counts can describe the size of each individual land use opportunity, only data on the shares of land uses can assist the planner in identifying the relative importance of specific land uses.
In the next section, we present both counts and shares of parking by land use within municipalities since these metrics will support both state/regional as well as local PEV planning activities.
4.4.3 Spatial density of parking spaces by land use
A metric that may be useful to electrical utility planners is the spatial density of parking spaces at land uses. This is because utilities must plan for future electrical loads for substation areas. Thus, knowing where there will be spatially concentrated growth in loads would be helpful. As we show in the Southern California PEV Atlas, both workplaces and MUDs tend to be spatially concentrated and they could both experience rapid growth in charging equipment installations. This metric is discussed further in the Chapter 7.
4.5 The base of the pyramid: assessing residential potential
In this and the following sections, we provide state, regional and local planners with an example of the type of PEV planning metrics they may wish to develop to more fully understand their local parking and land use resources that could be developed to support PEV charging. As an
25 Evaluating Land Use Opportunities and Existing Charge Stations DRAFT
example, we begin with a Los Angeles County-wide assessment of the base of the charging pyramid by focusing on the spatial distribution of single family and multi-unit residential housing. For the purposes of this analysis, condominiums are considered MUDs even though they are individually owned because the physical and institutional challenges of charging in condominiums are similar to those of apartment buildings.
4.5.1 Single-family homes in Los Angeles County
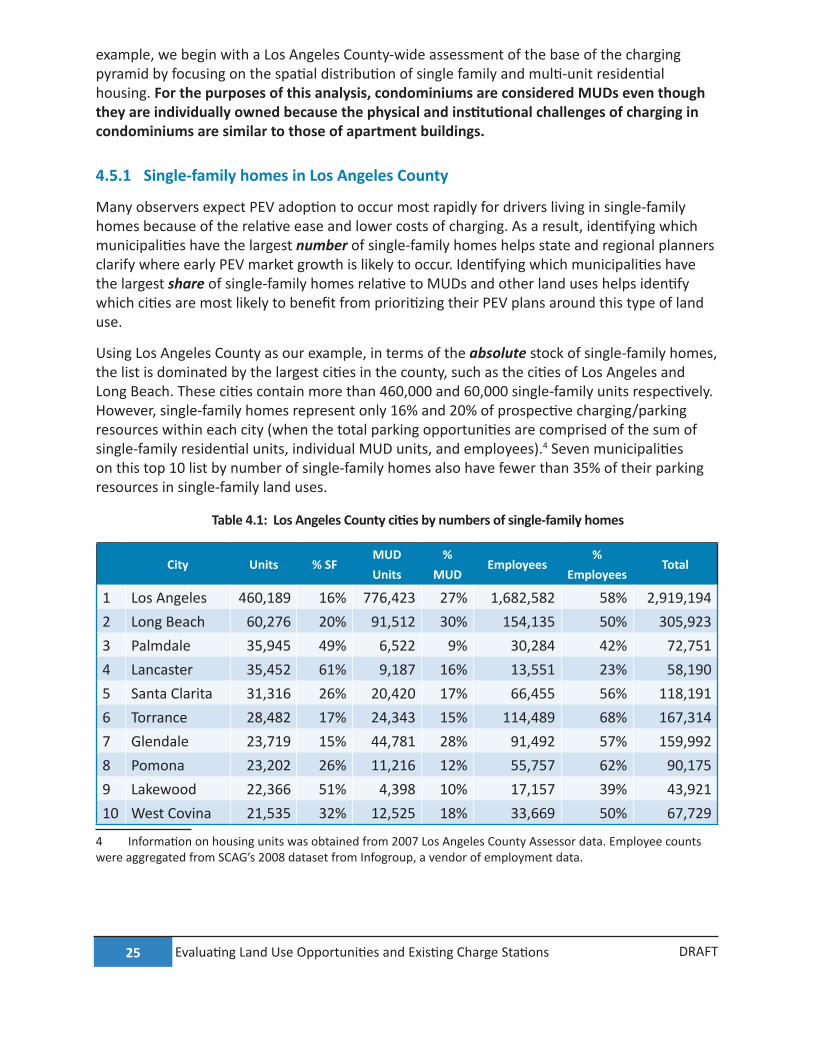
Many observers expect PEV adoption to occur most rapidly for drivers living in single-family homes because of the relative ease and lower costs of charging. As a result, identifying which municipalities have the largest number of single-family homes helps state and regional planners clarify where early PEV market growth is likely to occur. Identifying which municipalities have the largest share of single-family homes relative to MUDs and other land uses helps identify which cities are most likely to benefit from prioritizing their PEV plans around this type of land use.
Using Los Angeles County as our example, in terms of the absolute stock of single-family homes, the list is dominated by the largest cities in the county, such as the cities of Los Angeles and Long Beach. These cities contain more than 460,000 and 60,000 single-family units respectively. However, single-family homes represent only 16% and 20% of prospective charging/parking resources within each city (when the total parking opportunities are comprised of the sum of single-family residential units, individual MUD units, and employees).4 Seven municipalities on this top 10 list by number of single-family homes also have fewer than 35% of their parking resources in single-family land uses.
Table 4.1: Los Angeles County cities by numbers of single-family homes
City Units % SFMUD Units
% MUD
Employees%
EmployeesTotal
1 Los Angeles 460,189 16% 776,423 27% 1,682,582 58% 2,919,1942 Long Beach 60,276 20% 91,512 30% 154,135 50% 305,9233 Palmdale 35,945 49% 6,522 9% 30,284 42% 72,7514 Lancaster 35,452 61% 9,187 16% 13,551 23% 58,1905 Santa Clarita 31,316 26% 20,420 17% 66,455 56% 118,1916 Torrance 28,482 17% 24,343 15% 114,489 68% 167,3147 Glendale 23,719 15% 44,781 28% 91,492 57% 159,9928 Pomona 23,202 26% 11,216 12% 55,757 62% 90,1759 Lakewood 22,366 51% 4,398 10% 17,157 39% 43,92110 West Covina 21,535 32% 12,525 18% 33,669 50% 67,729
4 Information on housing units was obtained from 2007 Los Angeles County Assessor data. Employee counts were aggregated from SCAG’s 2008 dataset from Infogroup, a vendor of employment data.
26 UCLA Luskin Center, December 2012DRAFT
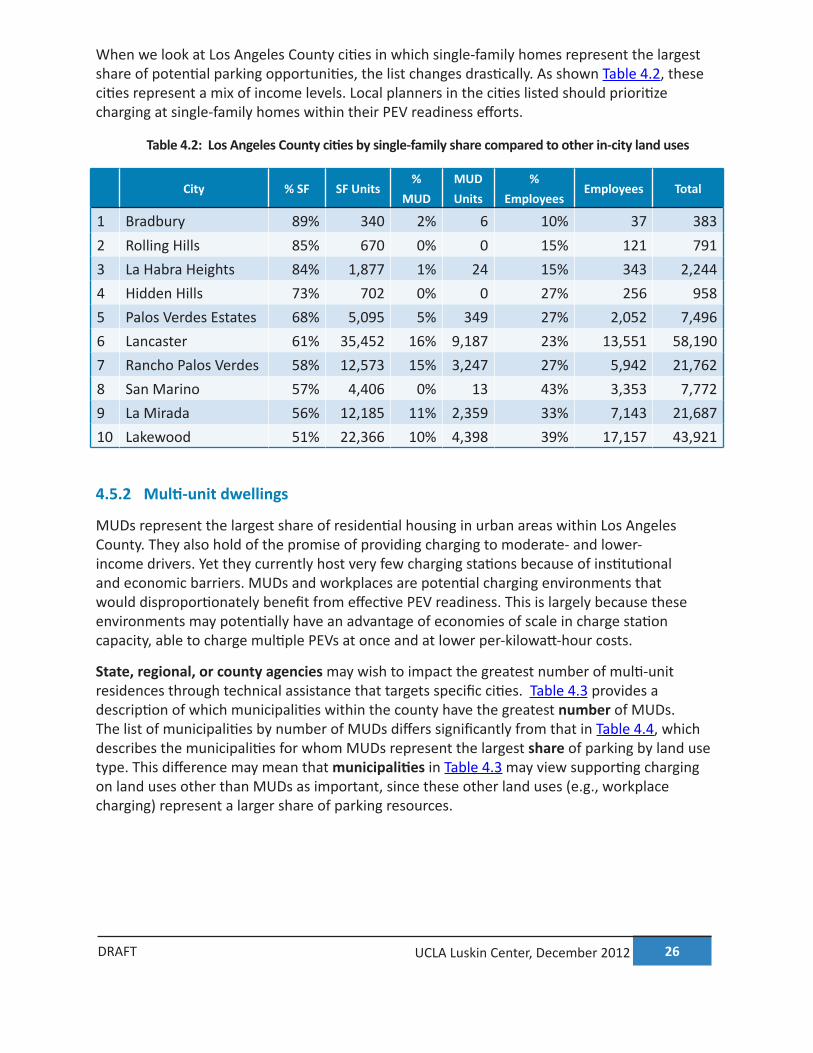
When we look at Los Angeles County cities in which single-family homes represent the largest share of potential parking opportunities, the list changes drastically. As shown Table 4.2, these cities represent a mix of income levels. Local planners in the cities listed should prioritize charging at single-family homes within their PEV readiness efforts.
Table 4.2: Los Angeles County cities by single-family share compared to other in-city land uses
City % SF SF Units%
MUDMUD Units
% Employees
Employees Total
1 Bradbury 89% 340 2% 6 10% 37 3832 Rolling Hills 85% 670 0% 0 15% 121 7913 La Habra Heights 84% 1,877 1% 24 15% 343 2,2444 Hidden Hills 73% 702 0% 0 27% 256 9585 Palos Verdes Estates 68% 5,095 5% 349 27% 2,052 7,4966 Lancaster 61% 35,452 16% 9,187 23% 13,551 58,1907 Rancho Palos Verdes 58% 12,573 15% 3,247 27% 5,942 21,7628 San Marino 57% 4,406 0% 13 43% 3,353 7,7729 La Mirada 56% 12,185 11% 2,359 33% 7,143 21,68710 Lakewood 51% 22,366 10% 4,398 39% 17,157 43,921
4.5.2 Multi-unit dwellings
MUDs represent the largest share of residential housing in urban areas within Los Angeles County. They also hold of the promise of providing charging to moderate- and lower-income drivers. Yet they currently host very few charging stations because of institutional and economic barriers. MUDs and workplaces are potential charging environments that would disproportionately benefit from effective PEV readiness. This is largely because these environments may potentially have an advantage of economies of scale in charge station capacity, able to charge multiple PEVs at once and at lower per-kilowatt-hour costs.
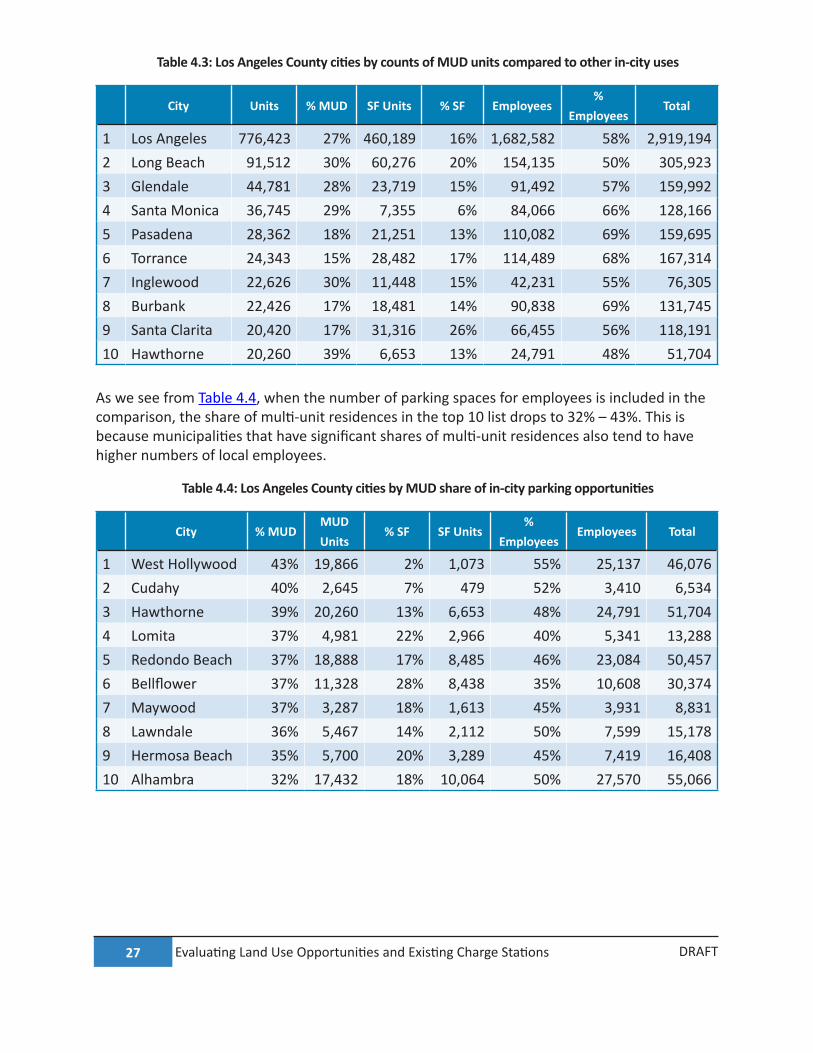
State, regional, or county agencies may wish to impact the greatest number of multi-unit residences through technical assistance that targets specific cities. Table 4.3 provides a description of which municipalities within the county have the greatest number of MUDs. The list of municipalities by number of MUDs differs significantly from that in Table 4.4, which describes the municipalities for whom MUDs represent the largest share of parking by land use type. This difference may mean that municipalities in Table 4.3 may view supporting charging on land uses other than MUDs as important, since these other land uses (e.g., workplace charging) represent a larger share of parking resources.
27 Evaluating Land Use Opportunities and Existing Charge Stations DRAFT
Table 4.3: Los Angeles County cities by counts of MUD units compared to other in-city uses
City Units % MUD SF Units % SF Employees%
EmployeesTotal
1 Los Angeles 776,423 27% 460,189 16% 1,682,582 58% 2,919,1942 Long Beach 91,512 30% 60,276 20% 154,135 50% 305,9233 Glendale 44,781 28% 23,719 15% 91,492 57% 159,9924 Santa Monica 36,745 29% 7,355 6% 84,066 66% 128,1665 Pasadena 28,362 18% 21,251 13% 110,082 69% 159,6956 Torrance 24,343 15% 28,482 17% 114,489 68% 167,3147 Inglewood 22,626 30% 11,448 15% 42,231 55% 76,3058 Burbank 22,426 17% 18,481 14% 90,838 69% 131,7459 Santa Clarita 20,420 17% 31,316 26% 66,455 56% 118,19110 Hawthorne 20,260 39% 6,653 13% 24,791 48% 51,704
As we see from Table 4.4, when the number of parking spaces for employees is included in the comparison, the share of multi-unit residences in the top 10 list drops to 32% – 43%. This is because municipalities that have significant shares of multi-unit residences also tend to have higher numbers of local employees.
Table 4.4: Los Angeles County cities by MUD share of in-city parking opportunities
City % MUDMUD Units
% SF SF Units%
EmployeesEmployees Total
1 West Hollywood 43% 19,866 2% 1,073 55% 25,137 46,0762 Cudahy 40% 2,645 7% 479 52% 3,410 6,5343 Hawthorne 39% 20,260 13% 6,653 48% 24,791 51,7044 Lomita 37% 4,981 22% 2,966 40% 5,341 13,2885 Redondo Beach 37% 18,888 17% 8,485 46% 23,084 50,4576 Bellflower 37% 11,328 28% 8,438 35% 10,608 30,3747 Maywood 37% 3,287 18% 1,613 45% 3,931 8,8318 Lawndale 36% 5,467 14% 2,112 50% 7,599 15,1789 Hermosa Beach 35% 5,700 20% 3,289 45% 7,419 16,40810 Alhambra 32% 17,432 18% 10,064 50% 27,570 55,066
28 UCLA Luskin Center, December 2012DRAFT
4.6 Workplace charging in the parking/land use assessment
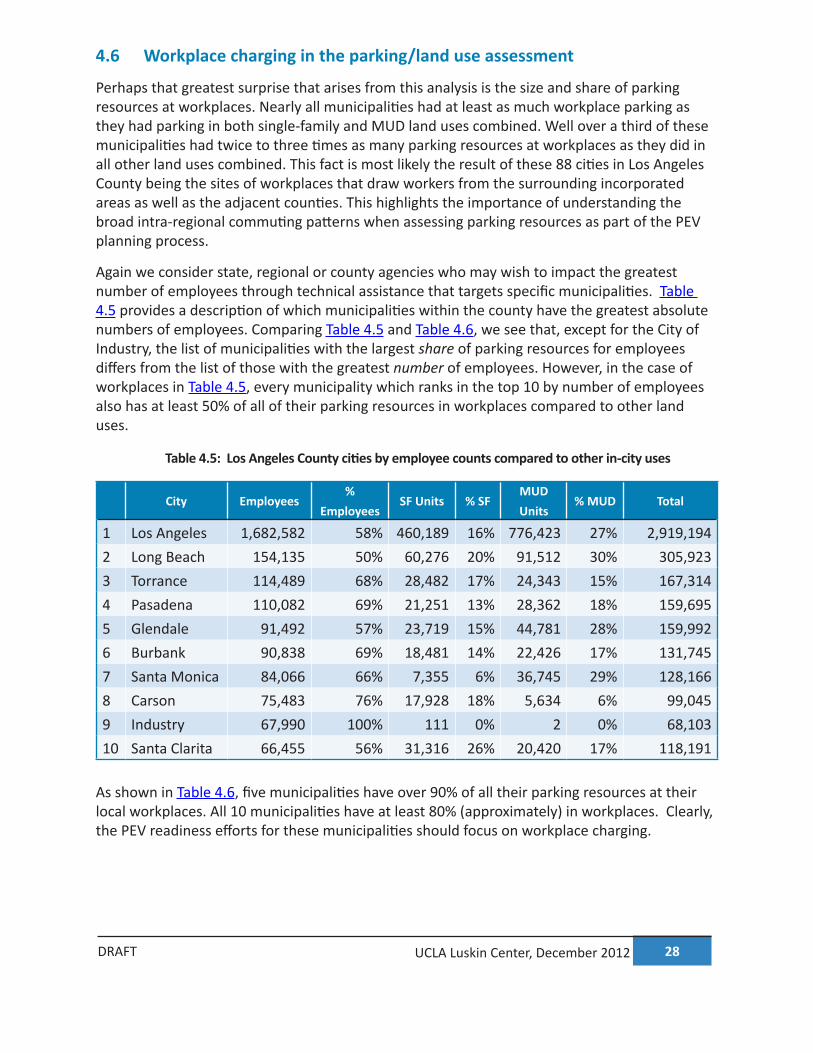
Perhaps that greatest surprise that arises from this analysis is the size and share of parking resources at workplaces. Nearly all municipalities had at least as much workplace parking as they had parking in both single-family and MUD land uses combined. Well over a third of these municipalities had twice to three times as many parking resources at workplaces as they did in all other land uses combined. This fact is most likely the result of these 88 cities in Los Angeles County being the sites of workplaces that draw workers from the surrounding incorporated areas as well as the adjacent counties. This highlights the importance of understanding the broad intra-regional commuting patterns when assessing parking resources as part of the PEV planning process.
Again we consider state, regional or county agencies who may wish to impact the greatest number of employees through technical assistance that targets specific municipalities. Table 4.5 provides a description of which municipalities within the county have the greatest absolute numbers of employees. Comparing Table 4.5 and Table 4.6, we see that, except for the City of Industry, the list of municipalities with the largest share of parking resources for employees differs from the list of those with the greatest number of employees. However, in the case of workplaces in Table 4.5, every municipality which ranks in the top 10 by number of employees also has at least 50% of all of their parking resources in workplaces compared to other land uses.
Table 4.5: Los Angeles County cities by employee counts compared to other in-city uses
City Employees%
EmployeesSF Units % SF
MUD Units
% MUD Total
1 Los Angeles 1,682,582 58% 460,189 16% 776,423 27% 2,919,1942 Long Beach 154,135 50% 60,276 20% 91,512 30% 305,9233 Torrance 114,489 68% 28,482 17% 24,343 15% 167,3144 Pasadena 110,082 69% 21,251 13% 28,362 18% 159,6955 Glendale 91,492 57% 23,719 15% 44,781 28% 159,9926 Burbank 90,838 69% 18,481 14% 22,426 17% 131,7457 Santa Monica 84,066 66% 7,355 6% 36,745 29% 128,1668 Carson 75,483 76% 17,928 18% 5,634 6% 99,0459 Industry 67,990 100% 111 0% 2 0% 68,10310 Santa Clarita 66,455 56% 31,316 26% 20,420 17% 118,191
As shown in Table 4.6, five municipalities have over 90% of all their parking resources at their local workplaces. All 10 municipalities have at least 80% (approximately) in workplaces. Clearly, the PEV readiness efforts for these municipalities should focus on workplace charging.
29 Evaluating Land Use Opportunities and Existing Charge Stations DRAFT
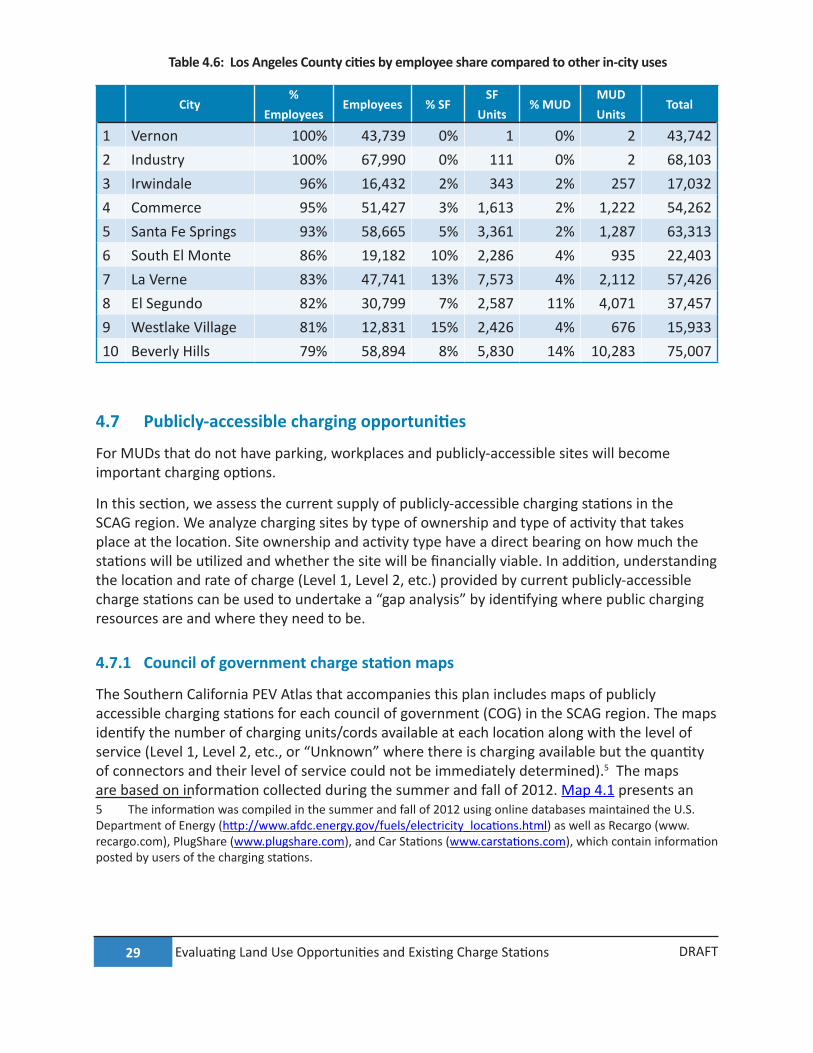
Table 4.6: Los Angeles County cities by employee share compared to other in-city uses
City%
EmployeesEmployees % SF
SF Units
% MUDMUD Units
Total
1 Vernon 100% 43,739 0% 1 0% 2 43,7422 Industry 100% 67,990 0% 111 0% 2 68,1033 Irwindale 96% 16,432 2% 343 2% 257 17,0324 Commerce 95% 51,427 3% 1,613 2% 1,222 54,2625 Santa Fe Springs 93% 58,665 5% 3,361 2% 1,287 63,3136 South El Monte 86% 19,182 10% 2,286 4% 935 22,4037 La Verne 83% 47,741 13% 7,573 4% 2,112 57,4268 El Segundo 82% 30,799 7% 2,587 11% 4,071 37,4579 Westlake Village 81% 12,831 15% 2,426 4% 676 15,93310 Beverly Hills 79% 58,894 8% 5,830 14% 10,283 75,007
4.7 Publicly-accessible charging opportunities
For MUDs that do not have parking, workplaces and publicly-accessible sites will become important charging options.
In this section, we assess the current supply of publicly-accessible charging stations in the SCAG region. We analyze charging sites by type of ownership and type of activity that takes place at the location. Site ownership and activity type have a direct bearing on how much the stations will be utilized and whether the site will be financially viable. In addition, understanding the location and rate of charge (Level 1, Level 2, etc.) provided by current publicly-accessible charge stations can be used to undertake a “gap analysis” by identifying where public charging resources are and where they need to be.
4.7.1 Council of government charge station maps
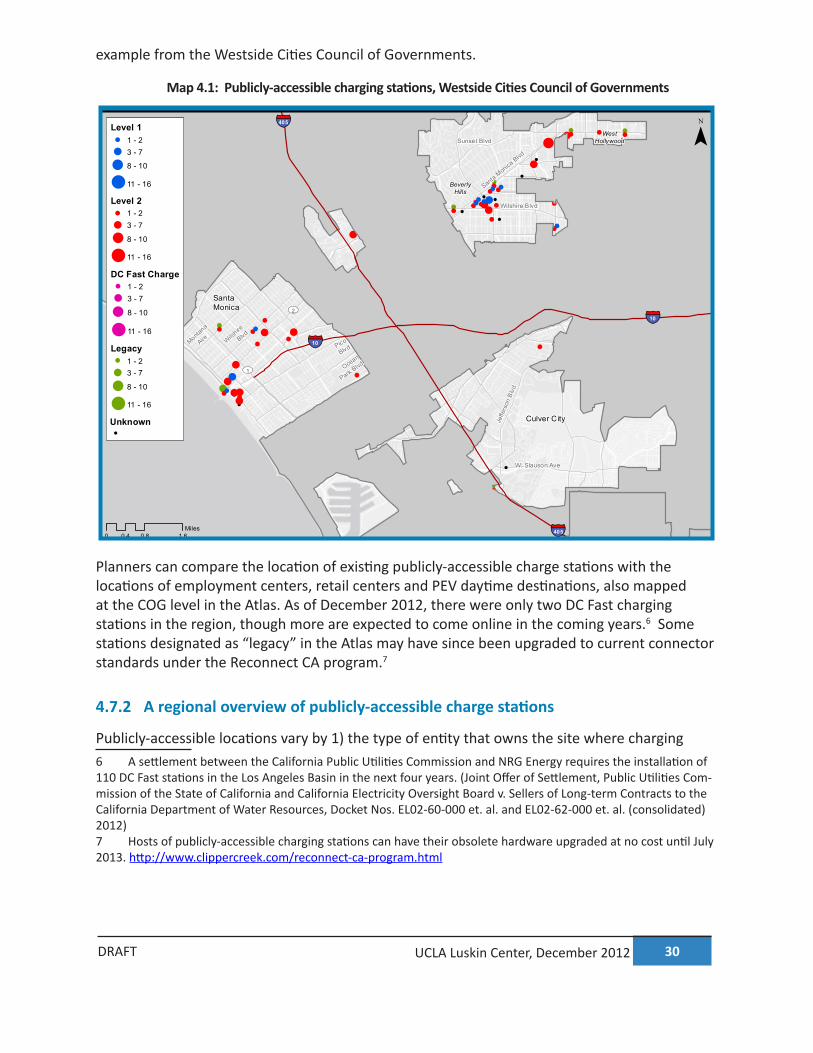
The Southern California PEV Atlas that accompanies this plan includes maps of publicly accessible charging stations for each council of government (COG) in the SCAG region. The maps identify the number of charging units/cords available at each location along with the level of service (Level 1, Level 2, etc., or “Unknown” where there is charging available but the quantity of connectors and their level of service could not be immediately determined).5 The maps are based on information collected during the summer and fall of 2012. Map 4.1 presents an 5 The information was compiled in the summer and fall of 2012 using online databases maintained the U.S. Department of Energy (http://www.afdc.energy.gov/fuels/electricity_locations.html) as well as Recargo (www.recargo.com), PlugShare (www.plugshare.com), and Car Stations (www.carstations.com), which contain information posted by users of the charging stations.
30 UCLA Luskin Center, December 2012DRAFT
example from the Westside Cities Council of Governments.
Map 4.1: Publicly-accessible charging stations, Westside Cities Council of Governments!
!
!
!
!
!!
!
!
!
!
!
!
!
!
!
!
!
!
!
!
!
!
!!
!
!
!
!
!
!
!
!
!
!
!
!
!
!
!
!
!
!
!
!
!
!
!
!
!
!
!
!!
!!
!
!
!
!
!
!
!
!
!
!!
!
!
!
!
!
! !
!
!
!
!
!
!
!
!
!
!
!
!
!
!
!
!
!
!
!
!
!
!
!
!
!
!
! !
!
!
!
!!
!
!
!
!
!
!
!
!
!
!
UV1
UV2
Pico
Blvd
Ocean
Park Blvd
Montana
Ave Wilshire
Blvd
§̈¦10
§̈¦405
§̈¦405
§̈¦10
SantaMonica
UCLA Luskin Center for InnovationUCLA Lewis Center for Regional Policy Studies
0 0.8 1.60.4Miles
Level 1! 1 - 2! 3 - 7
! 8 - 10
! 11 - 16
Level 2! 1 - 2! 3 - 7
! 8 - 10
! 11 - 16
DC Fast Charge! 1 - 2! 3 - 7
! 8 - 10
! 11 - 16
Legacy! 1 - 2! 3 - 7
! 8 - 10
! 11 - 16
Unknown!
Map Prepared By Norman WongDecember 2012
¯
Charging StationsWestside
Sunset Blvd
Santa Monica
Blvd
Jeffe
rson
Blv
d
Culver City
BeverlyHills
W. Slauson Ave
WestHollywood
Wilshire Blvd
Planners can compare the location of existing publicly-accessible charge stations with the locations of employment centers, retail centers and PEV daytime destinations, also mapped at the COG level in the Atlas. As of December 2012, there were only two DC Fast charging stations in the region, though more are expected to come online in the coming years.6 Some stations designated as “legacy” in the Atlas may have since been upgraded to current connector standards under the Reconnect CA program.7
4.7.2 A regional overview of publicly-accessible charge stations
Publicly-accessible locations vary by 1) the type of entity that owns the site where charging 6 A settlement between the California Public Utilities Commission and NRG Energy requires the installation of 110 DC Fast stations in the Los Angeles Basin in the next four years. (Joint Offer of Settlement, Public Utilities Com-mission of the State of California and California Electricity Oversight Board v. Sellers of Long-term Contracts to the California Department of Water Resources, Docket Nos. EL02-60-000 et. al. and EL02-62-000 et. al. (consolidated) 2012)7 Hosts of publicly-accessible charging stations can have their obsolete hardware upgraded at no cost until July 2013. http://www.clippercreek.com/reconnect-ca-program.html
31 Evaluating Land Use Opportunities and Existing Charge Stations DRAFT
takes place; and 2) the type of activity that takes place on the site.
4.7.3 Types of charging site owners
Charging site hosts (owners) can generally be classified as public (government-owned), private (e.g., a store or business), non-profit (e.g., a house of worship), or utility. Site ownership will help determine the extent of access to the charging unit (for example, all PEV drivers or customers only; 24-hour access, or business hours only). Site ownership also figures into the value proposition for prospective site hosts. Government and non-profit charging sites may only want to cover their costs or some portion, while private businesses may want to profit from charging or attract customers.
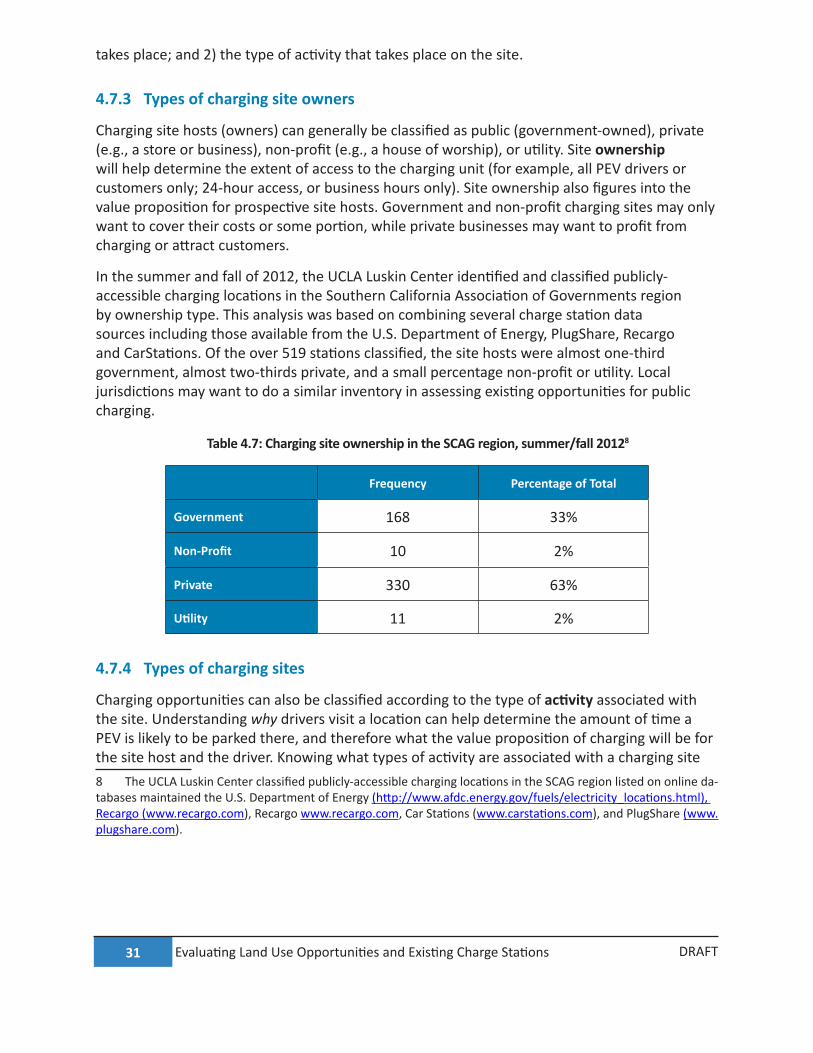
In the summer and fall of 2012, the UCLA Luskin Center identified and classified publicly-accessible charging locations in the Southern California Association of Governments region by ownership type. This analysis was based on combining several charge station data sources including those available from the U.S. Department of Energy, PlugShare, Recargo and CarStations. Of the over 519 stations classified, the site hosts were almost one-third government, almost two-thirds private, and a small percentage non-profit or utility. Local jurisdictions may want to do a similar inventory in assessing existing opportunities for public charging.
Table 4.7: Charging site ownership in the SCAG region, summer/fall 20128
Frequency Percentage of Total
Government 168 33%
Non-Profit 10 2%
Private 330 63%
Utility 11 2%
4.7.4 Types of charging sites
Charging opportunities can also be classified according to the type of activity associated with the site. Understanding why drivers visit a location can help determine the amount of time a PEV is likely to be parked there, and therefore what the value proposition of charging will be for the site host and the driver. Knowing what types of activity are associated with a charging site 8 The UCLA Luskin Center classified publicly-accessible charging locations in the SCAG region listed on online da-tabases maintained the U.S. Department of Energy (http://www.afdc.energy.gov/fuels/electricity_locations.html), Recargo (www.recargo.com), Recargo www.recargo.com, Car Stations (www.carstations.com), and PlugShare (www.plugshare.com).
32 UCLA Luskin Center, December 2012DRAFT
will also help planners anticipate the demand for charging at the location.
Understanding the value of a charging site is crucial in siting publicly-accessible stations. To date, most publicly-accessible charging stations have been placed where it is convenient to do so, either because the site is public property or because the site owner wants to take advantage of a time-limited subsidy for charging equipment or installation. As a result, existing publicly-accessible charging has not been placed in the lowest-cost, highest-demand locations, such as workplaces.
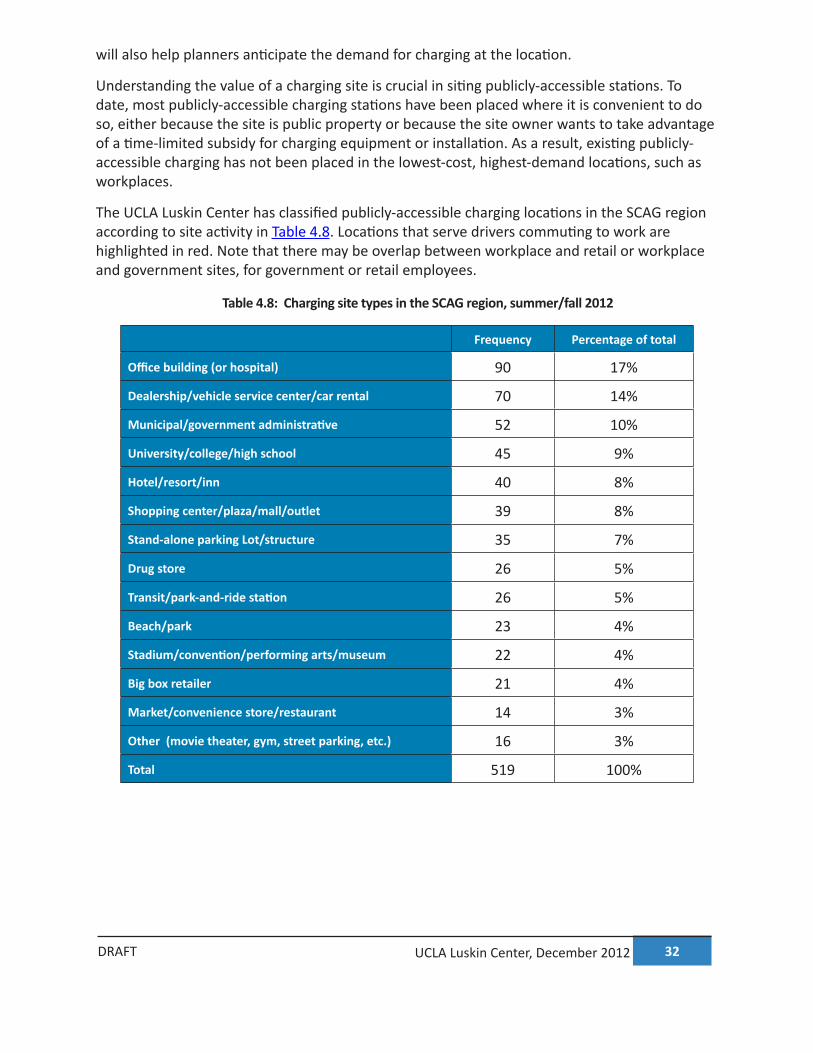
The UCLA Luskin Center has classified publicly-accessible charging locations in the SCAG region according to site activity in Table 4.8. Locations that serve drivers commuting to work are highlighted in red. Note that there may be overlap between workplace and retail or workplace and government sites, for government or retail employees.
Table 4.8: Charging site types in the SCAG region, summer/fall 2012
Frequency Percentage of total
Office building (or hospital) 90 17%
Dealership/vehicle service center/car rental 70 14%
Municipal/government administrative 52 10%
University/college/high school 45 9%
Hotel/resort/inn 40 8%
Shopping center/plaza/mall/outlet 39 8%
Stand-alone parking Lot/structure 35 7%
Drug store 26 5%
Transit/park-and-ride station 26 5%
Beach/park 23 4%
Stadium/convention/performing arts/museum 22 4%
Big box retailer 21 4%
Market/convenience store/restaurant 14 3%
Other (movie theater, gym, street parking, etc.) 16 3%
Total 519 100%
33 Evaluating Land Use Opportunities and Existing Charge Stations DRAFT
4.8 Charging locations for long-distance travel
At the top of the charging pyramid in Figure 4.2 lies interstate travel. DC fast charging will eventually facilitate interregional and interstate PEV travel along major highway corridors. Such long-distance transportation planning is primarily the purview of state and federal planners. Since the Southern California PEV Readiness Plan is intended to help local and regional planners support PEV charging in the daily commute, a discussion of interregional and interstate planning is beyond the scope of this document. The California Energy Commission is in the process of developing a statewide PEV readiness plan, part of which will develop inter-regional charging.
4.9 Recommendations
Planners should consult other chapters in this document for specific recommendations on facilitating charging in land uses that are locally important. These include single-family charging (Chapter 5), MUDs (Chapter 6), workplaces (Chapter 7), retail and public-sector locations (Chapter 8). The following recommendations summarize the guidance provided in this chapter on assessing local land use opportunities and existing publicly-accessible charging stations.
1. Cities should target their PEV readiness efforts by assessing their land uses and the relative shares of parking supply that are accounted for by single-family homes, MUDs, and workplaces.
2. Regions and COGs should target PEV technical assistance to cities by assessing counts of parking by land use in absolute numbers or by the relative dominance of particular land uses within each city (i.e., target technical assistance on workplace charging to cities that either have the highest employee counts or the highest concentrations of employee parking relative to parking for other purposes).
3. Local, subregional and regional planners should assess their existing supply of charging stations and their dominant land uses to understand where gaps may need to be filled and where obsolete hardware may need to be replaced or removed. The Southern California PEV Atlas that accompanies this document provides COG-level maps of existing charging stations as well as PEV registrations and PEV travel destinations, employment and retail centers, MUDs and stand-alone parking facilities.
4.10 References
Joint Offer of Settlement, Public Utilities Commission of the State of California and California Electricity Oversight Board v. Sellers of Long-term Contracts to the California Department of Water Resources, Docket Nos. EL02-60-000 et. al. and EL02-62-000 et. al. (consolidated). 2012. http://www.cpuc.ca.gov/NR/rdonlyres/CD5E3578-5EAD-47BA-BC5A-B6BD398CCBF6/0/JointOfferofSettlement.pdf.
Stanek, Mary Beth. 2011. Electric Vehicle Forum, Metropolitan Washington Council of Governments.
34 UCLA Luskin Center, December 2012DRAFT
5 Demand-driven PEV Planning and Single-Family Residential Charging
5.1 Introduction
Single-family homeowners have represented the largest source of demand for PEVs to date (California Center for Sustainable Energy 2012). This is because charging in single-family homes presents the fewest physical and institutional barriers relative to other charging environments (Williams and Kurani 2006). Attached garages often have household outlets that can be used for overnight charging instead of buying special equipment. The cars may be parked a relatively short distance to an electrical panel, eliminating the need for trenching or lengthy conduit. Unlike condominium owners or apartment tenants, single-family homeowners have sole authority over their property and parking spaces, so they need not obtain permission from a landlord or homeowner association to install charging. They can install second meters so the utility can track their PEV charging or place their whole home on a special discounted rate, which they pay directly. In these ways, the hard and soft costs of charging are lowest in single-family homes.
For these reasons, planners should view residential charging, particularly in single-family homes, as critical to PEV adoption in the near term. Many cities have taken measures to require PEV-ready wiring in new residential construction and to streamline the permitting and inspection process. Reducing the upfront costs of charging in single-family homes is the “low-hanging fruit” of PEV planning. It is also the most effective way to increase the overall value of driving electric miles, regardless of the battery capacity of the PEVs being driven.
This chapter will describe how planners can use the maps and projections provided in the Southern California PEV Atlas as well as their own land use metrics to assess potential for single-family residential charging in their jurisdictions. It will conclude with a discussion of measures that planners can take to reduce the upfront costs of this type of charging as well as a demonstration of the cost savings offered by such measures.
35 DRAFT
5.2 Assessing the single-family home charging opportunity
To determine the level of readiness efforts a city, council of governments (COG) or county should take to accommodate single-family home charging, planners must first measure the potential demand for such charging in their jurisdictions. The tools in this section will help answer the following questions:
• Where will PEVs be parked overnight? Knowing how many PEVs are currently registered in a given area will indicate the location of current and near-future demand for residential charging. By extension, this information can help planners and utilities anticipate locations that will carry additional nighttime electrical load.
• Where will PEVs be parked during the day? The answer will reveal the workplaces and retail locations that will experience strongest demand for PEV charging. Planners and utilities can use this information to anticipate locations that will carry additional daytime electrical load.
• How significant a land use are single-family homes in my jurisdiction? Understanding how much of the land use mix is made up of single-family homes will help planners understand the overall importance of charging in this housing type in a given area.
5.3 Where will PEVs be parked overnight?
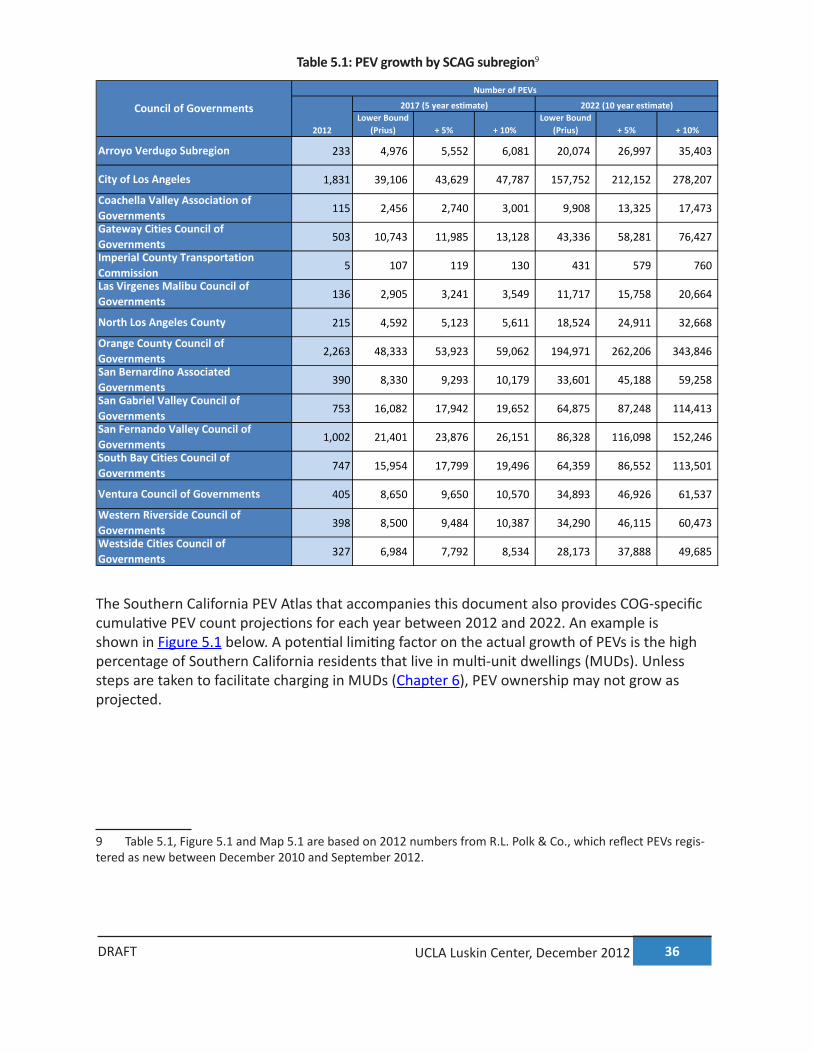
Table 5.1 shows the numbers of PEVs currently registered in each council of government (COG) in the Southern California Association of Governments (SCAG) region, calculated from recent disaggregated registration data purchased from R.L. Polk & Co., an automotive data vendor. The tables reflect the current number of PEVs in each COG, followed by growth projections over the next five and ten years.
The current counts reflect vehicles newly registered in each COG from December 2010, when the Chevrolet Volt and Nissan LEAF were introduced, through September 2012. Given that PEV consumer studies to date have shown PEV buyers residing almost exclusively in single-family homes, it can be assumed that the current counts largely reflect PEVs charging overnight in this housing type.
The baseline growth estimate is based on the annual U.S. growth rate of standard Toyota Prius hybrid sales beginning in 2000. This growth rate is the baseline because standard hybrids, a product type dominated early on by the Toyota Prius, can be considered parallel in many ways to plug-in hybrid electric vehicles (PHEVs). PHEVs, which comprise 70% of the PEVs newly registered in the SCAG region since December 2010 according to data from R.L. Polk & Co., are essentially standard Toyota Prius hybrids with a plug-in battery. The ability to recharge from the grid represents the potential for significant fuel cost savings above a standard hybrid. The baseline growth rate is a conservative estimate because PEVs are available in many more models than were standard hybrids in the first years after introduction. Because many more PEV models will become available in the coming years, we also present alternative scenarios in which this growth rate is exceeded by 5% and 10%.
36 UCLA Luskin Center, December 2012DRAFT
Table 5.1: PEV growth by SCAG subregion9
Lower Bound (Prius) + 5% + 10%
Lower Bound (Prius) + 5% + 10%
233 4,976 5,552 6,081 20,074 26,997 35,403
1,831 39,106 43,629 47,787 157,752 212,152 278,207
115 2,456 2,740 3,001 9,908 13,325 17,473
503 10,743 11,985 13,128 43,336 58,281 76,427
5 107 119 130 431 579 760
136 2,905 3,241 3,549 11,717 15,758 20,664
215 4,592 5,123 5,611 18,524 24,911 32,668
2,263 48,333 53,923 59,062 194,971 262,206 343,846
390 8,330 9,293 10,179 33,601 45,188 59,258
753 16,082 17,942 19,652 64,875 87,248 114,413
1,002 21,401 23,876 26,151 86,328 116,098 152,246
747 15,954 17,799 19,496 64,359 86,552 113,501
405 8,650 9,650 10,570 34,893 46,926 61,537
398 8,500 9,484 10,387 34,290 46,115 60,473
327 6,984 7,792 8,534 28,173 37,888 49,685
North Los Angeles County
Orange County Council of Governments San Bernardino Associated Governments San Gabriel Valley Council of GovernmentsSan Fernando Valley Council of Governments South Bay Cities Council of Governments
Ventura Council of Governments
Western Riverside Council of Governments Westside Cities Council of Governments
Las Virgenes Malibu Council of Governments
Number of PEVs
2012
2017 (5 year estimate) 2022 (10 year estimate)
Arroyo Verdugo Subregion
City of Los Angeles
Coachella Valley Association of Governments Gateway Cities Council of GovernmentsImperial County Transportation Commission
Council of Governments
The Southern California PEV Atlas that accompanies this document also provides COG-specific cumulative PEV count projections for each year between 2012 and 2022. An example is shown in Figure 5.1 below. A potential limiting factor on the actual growth of PEVs is the high percentage of Southern California residents that live in multi-unit dwellings (MUDs). Unless steps are taken to facilitate charging in MUDs (Chapter 6), PEV ownership may not grow as projected.
9 Table 5.1, Figure 5.1 and Map 5.1 are based on 2012 numbers from R.L. Polk & Co., which reflect PEVs regis-tered as new between December 2010 and September 2012.
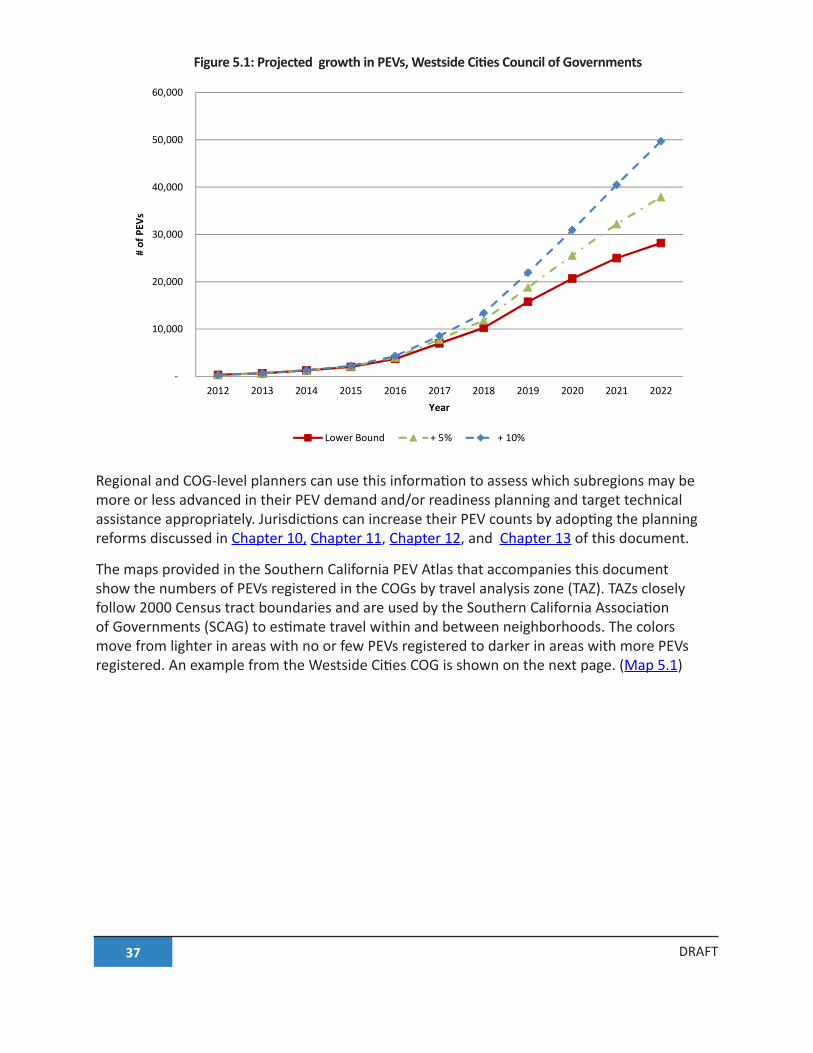
37 DRAFT
Figure 5.1: Projected growth in PEVs, Westside Cities Council of Governments
‐
10,000
20,000
30,000
40,000
50,000
60,000
2012 2013 2014 2015 2016 2017 2018 2019 2020 2021 2022
# of PEV
s
Year
Lower Bound + 5% + 10%
Regional and COG-level planners can use this information to assess which subregions may be more or less advanced in their PEV demand and/or readiness planning and target technical assistance appropriately. Jurisdictions can increase their PEV counts by adopting the planning reforms discussed in Chapter 10, Chapter 11, Chapter 12, and Chapter 13 of this document.
The maps provided in the Southern California PEV Atlas that accompanies this document show the numbers of PEVs registered in the COGs by travel analysis zone (TAZ). TAZs closely follow 2000 Census tract boundaries and are used by the Southern California Association of Governments (SCAG) to estimate travel within and between neighborhoods. The colors move from lighter in areas with no or few PEVs registered to darker in areas with more PEVs registered. An example from the Westside Cities COG is shown on the next page. (Map 5.1)
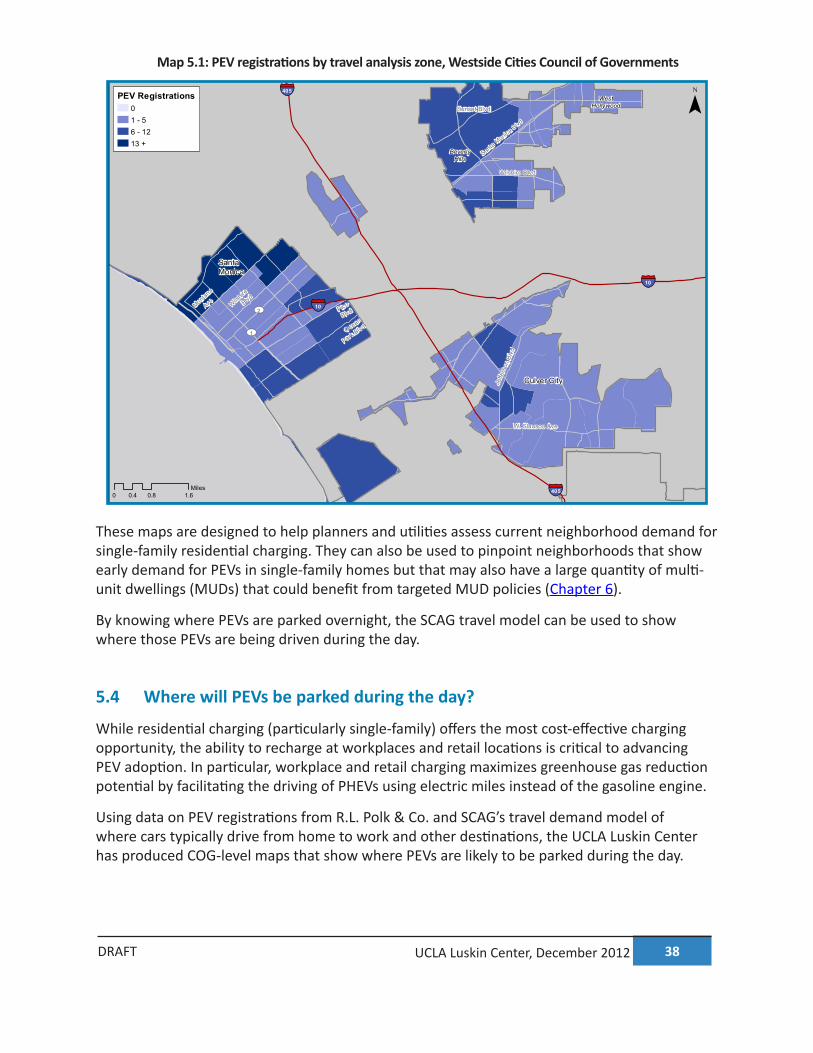
38 UCLA Luskin Center, December 2012DRAFT
Map 5.1: PEV registrations by travel analysis zone, Westside Cities Council of Governments
UV1
UV2 Pico
Blvd
Ocean
Park Blvd
Montana
Ave Wilshire
Blvd
§̈¦10
§̈¦405
§̈¦405
§̈¦10
SantaMonica
UCLA Luskin Center for InnovationUCLA Lewis Center for Regional Policy Studies
0 0.8 1.60.4Miles
PEV Registrations01 - 56 - 1213 +
Map Prepared By Norman WongDecember 2012
¯
PEV RegistrationWestside
Sunset Blvd
Santa Monica
Blvd
Jeffe
rson
Blv
d
Culver City
BeverlyHills
W. Slauson Ave
WestHollywood
Wilshire Blvd
These maps are designed to help planners and utilities assess current neighborhood demand for single-family residential charging. They can also be used to pinpoint neighborhoods that show early demand for PEVs in single-family homes but that may also have a large quantity of multi-unit dwellings (MUDs) that could benefit from targeted MUD policies (Chapter 6).
By knowing where PEVs are parked overnight, the SCAG travel model can be used to show where those PEVs are being driven during the day.
5.4 Where will PEVs be parked during the day?
While residential charging (particularly single-family) offers the most cost-effective charging opportunity, the ability to recharge at workplaces and retail locations is critical to advancing PEV adoption. In particular, workplace and retail charging maximizes greenhouse gas reduction potential by facilitating the driving of PHEVs using electric miles instead of the gasoline engine.
Using data on PEV registrations from R.L. Polk & Co. and SCAG’s travel demand model of where cars typically drive from home to work and other destinations, the UCLA Luskin Center has produced COG-level maps that show where PEVs are likely to be parked during the day.

39 DRAFT
These maps are layered with workplaces and retail destinations that are likely to experience the highest demand for daytime PEV charging. Please refer to Chapter 7 for a discussion of measures to facilitate workplace charging and Chapter 8 for a discussion of retail charging opportunities.
5.5 How significant a land use are single-family homes in my jurisdiction?
Planners can use a number of metrics to measure single-family charging potential at the COG or city level.
At the COG level, planners may find it helpful to know: • Which cities have the highest numbers of single-family homes in absolute terms? This
will allow the COG to decide where its resources will be most effective in advancing single-family residential PEV readiness for the subregion.
• Which cities have the highest shares of single-family homes relative to other land uses? This will indicate areas that may not have the largest impact on the COG in terms of PEV readiness, but would benefit from targeted technical assistance.
The following sections provide examples of how to gauge single-family PEV charging potential among cities at the Los Angeles County level. Planners in COGs and cities can use these methods to prioritize cities, land uses and parcels within their jurisdictions for PEV readiness actions.
5.5.1 Ranking cities by single-family residential counts
Planners at the COG level can assess single-family charging potential by ranking their member cities in order of total number of single-family homes. This simple ranking will show relative single-family charging potential within the COG in terms of sheer numbers. Examples on the county level are shown in Table 5.2.
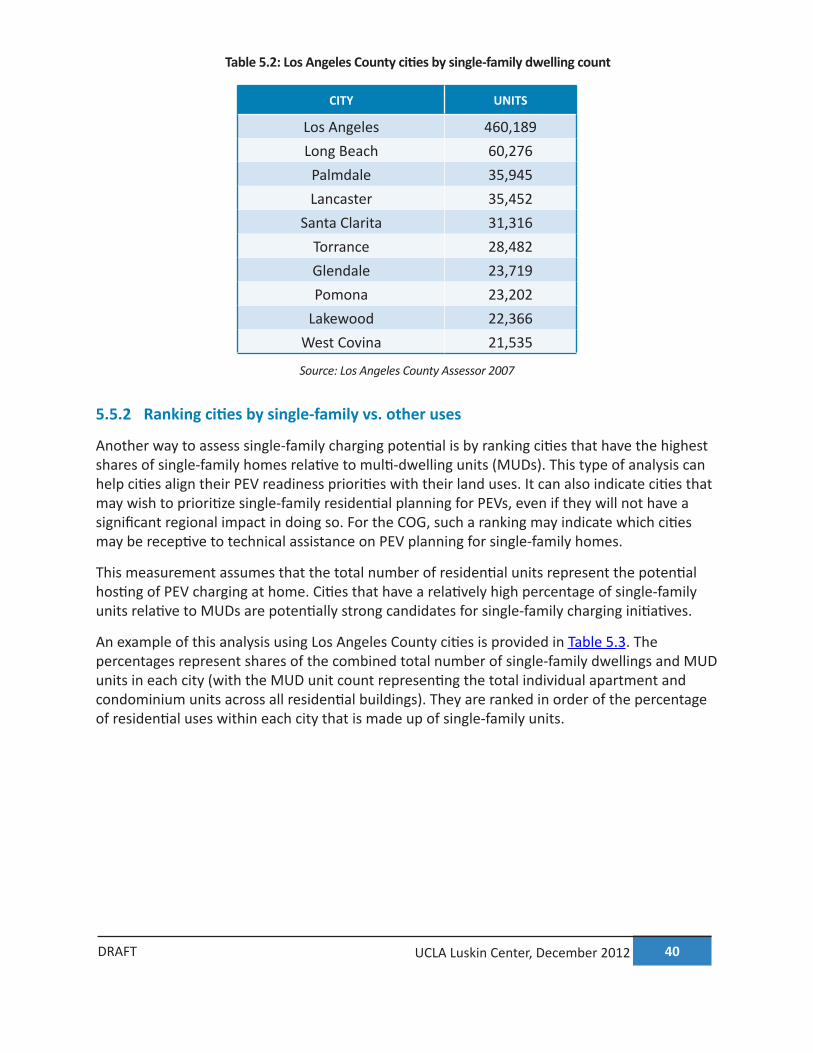
40 UCLA Luskin Center, December 2012DRAFT
Table 5.2: Los Angeles County cities by single-family dwelling count
CITY UNITS
Los Angeles 460,189Long Beach 60,276
Palmdale 35,945Lancaster 35,452
Santa Clarita 31,316Torrance 28,482Glendale 23,719Pomona 23,202
Lakewood 22,366West Covina 21,535
Source: Los Angeles County Assessor 2007
5.5.2 Ranking cities by single-family vs. other uses
Another way to assess single-family charging potential is by ranking cities that have the highest shares of single-family homes relative to multi-dwelling units (MUDs). This type of analysis can help cities align their PEV readiness priorities with their land uses. It can also indicate cities that may wish to prioritize single-family residential planning for PEVs, even if they will not have a significant regional impact in doing so. For the COG, such a ranking may indicate which cities may be receptive to technical assistance on PEV planning for single-family homes.
This measurement assumes that the total number of residential units represent the potential hosting of PEV charging at home. Cities that have a relatively high percentage of single-family units relative to MUDs are potentially strong candidates for single-family charging initiatives.
An example of this analysis using Los Angeles County cities is provided in Table 5.3. The percentages represent shares of the combined total number of single-family dwellings and MUD units in each city (with the MUD unit count representing the total individual apartment and condominium units across all residential buildings). They are ranked in order of the percentage of residential uses within each city that is made up of single-family units.
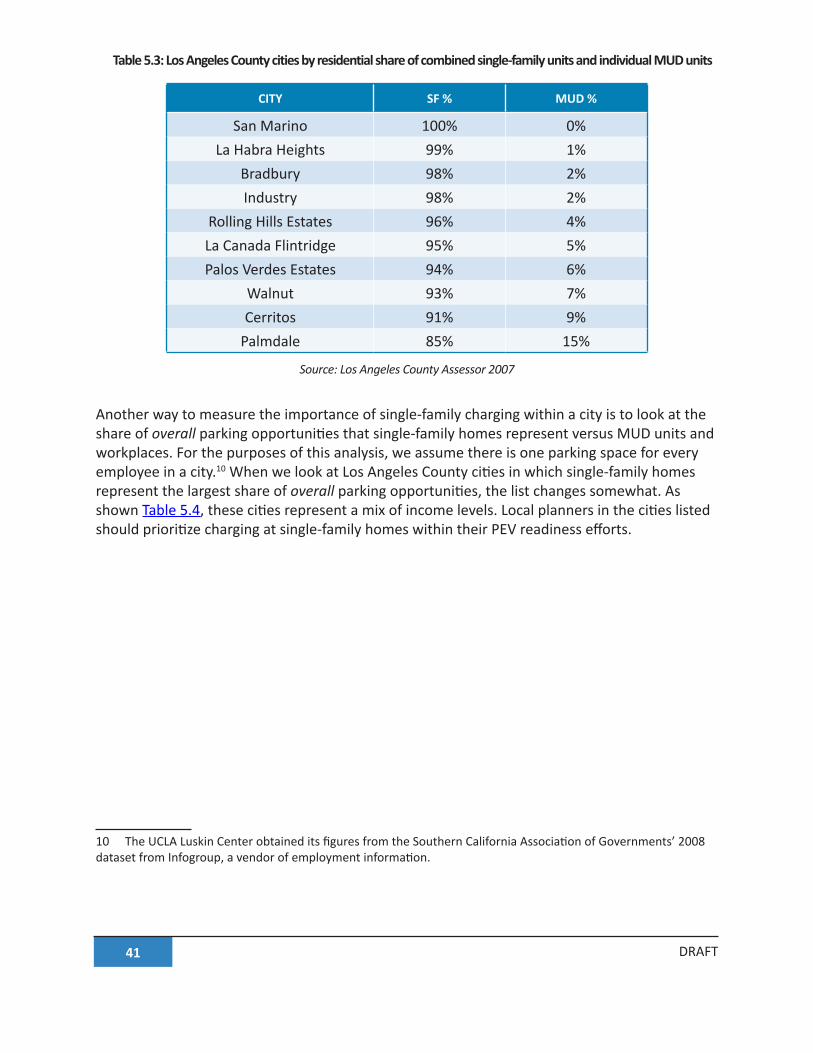
41 DRAFT
Table 5.3: Los Angeles County cities by residential share of combined single-family units and individual MUD units
CITY SF % MUD %
San Marino 100% 0%La Habra Heights 99% 1%
Bradbury 98% 2%Industry 98% 2%
Rolling Hills Estates 96% 4%La Canada Flintridge 95% 5%Palos Verdes Estates 94% 6%
Walnut 93% 7%Cerritos 91% 9%
Palmdale 85% 15%
Source: Los Angeles County Assessor 2007
Another way to measure the importance of single-family charging within a city is to look at the share of overall parking opportunities that single-family homes represent versus MUD units and workplaces. For the purposes of this analysis, we assume there is one parking space for every employee in a city.10 When we look at Los Angeles County cities in which single-family homes represent the largest share of overall parking opportunities, the list changes somewhat. As shown Table 5.4, these cities represent a mix of income levels. Local planners in the cities listed should prioritize charging at single-family homes within their PEV readiness efforts.
10 The UCLA Luskin Center obtained its figures from the Southern California Association of Governments’ 2008 dataset from Infogroup, a vendor of employment information.
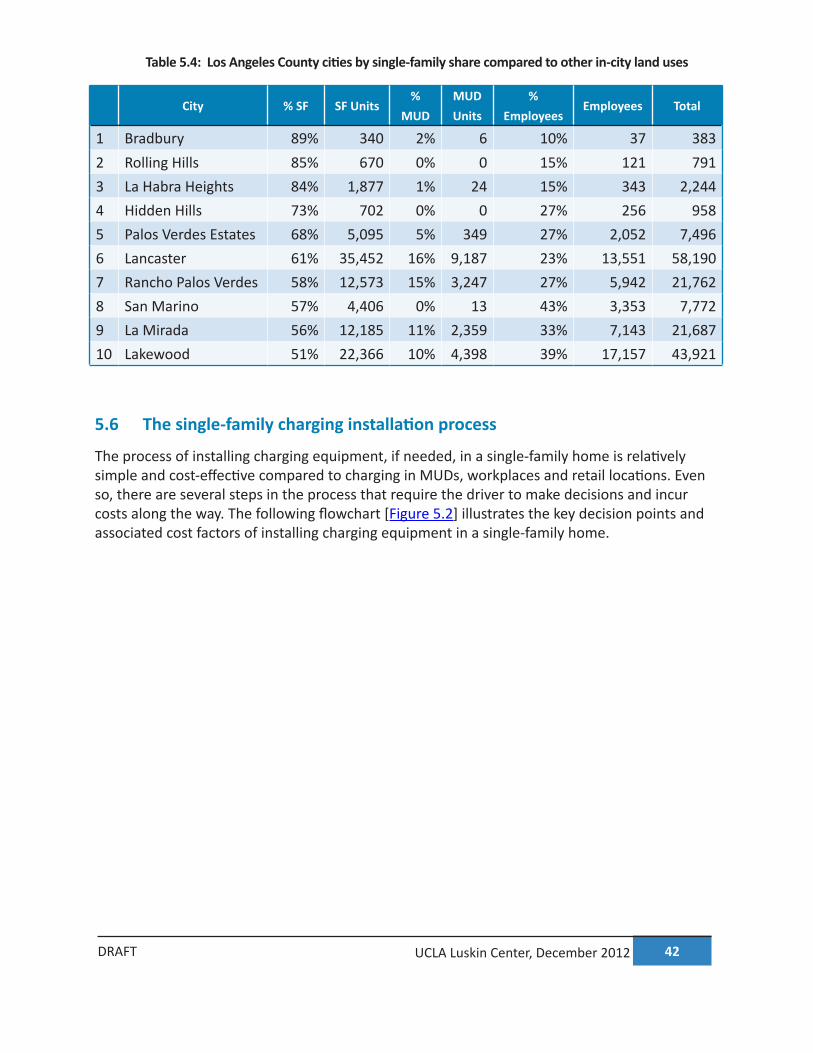
42 UCLA Luskin Center, December 2012DRAFT
Table 5.4: Los Angeles County cities by single-family share compared to other in-city land uses
City % SF SF Units%
MUDMUD Units
% Employees
Employees Total
1 Bradbury 89% 340 2% 6 10% 37 3832 Rolling Hills 85% 670 0% 0 15% 121 7913 La Habra Heights 84% 1,877 1% 24 15% 343 2,2444 Hidden Hills 73% 702 0% 0 27% 256 9585 Palos Verdes Estates 68% 5,095 5% 349 27% 2,052 7,4966 Lancaster 61% 35,452 16% 9,187 23% 13,551 58,1907 Rancho Palos Verdes 58% 12,573 15% 3,247 27% 5,942 21,7628 San Marino 57% 4,406 0% 13 43% 3,353 7,7729 La Mirada 56% 12,185 11% 2,359 33% 7,143 21,68710 Lakewood 51% 22,366 10% 4,398 39% 17,157 43,921
5.6 The single-family charging installation process
The process of installing charging equipment, if needed, in a single-family home is relatively simple and cost-effective compared to charging in MUDs, workplaces and retail locations. Even so, there are several steps in the process that require the driver to make decisions and incur costs along the way. The following flowchart [Figure 5.2] illustrates the key decision points and associated cost factors of installing charging equipment in a single-family home.
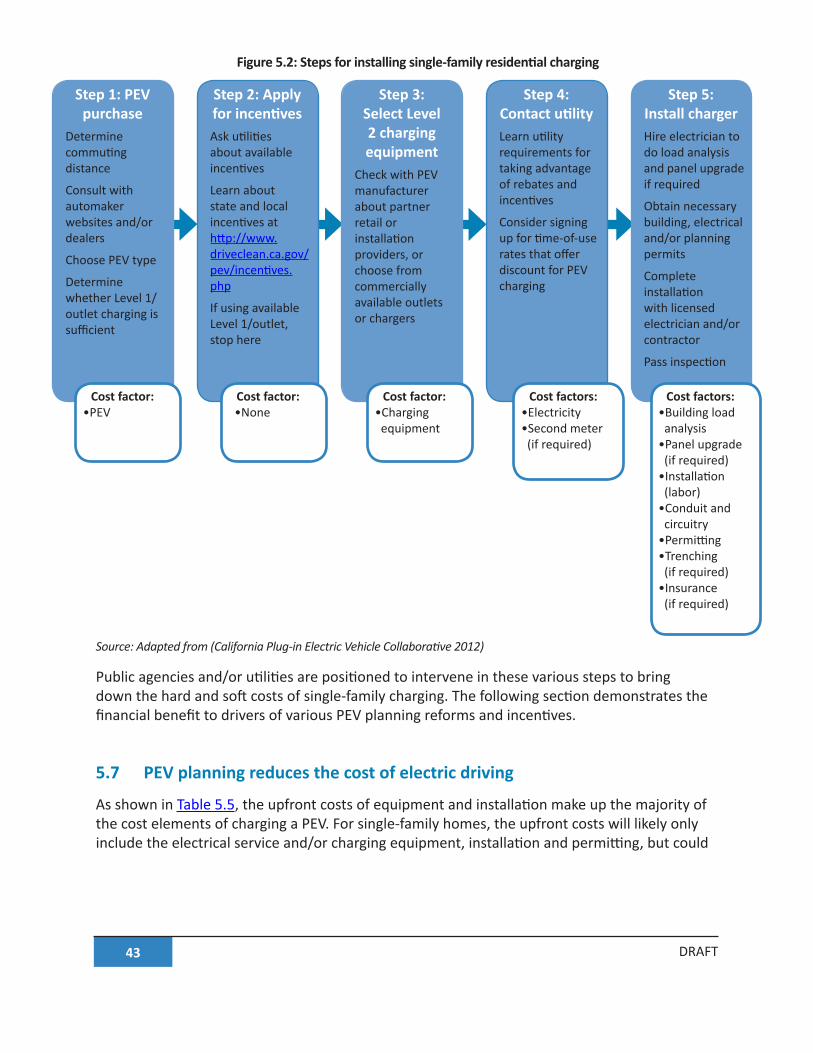
43 DRAFT
Figure 5.2: Steps for installing single-family residential charging
Step 1: PEV purchase
Determine commuting distance
Consult with automaker websites and/or dealers
Choose PEV type
Determine whether Level 1/outlet charging is sufficient
Step 2: Apply for incentivesAsk utilities about available incentives
Learn about state and local incentives at http://www.driveclean.ca.gov/pev/incentives.php
If using available Level 1/outlet, stop here
Step 3: Select Level 2 charging equipment
Check with PEV manufacturer about partner retail or installation providers, or choose from commercially available outlets or chargers
Step 4: Contact utilityLearn utility requirements for taking advantage of rebates and incentives
Consider signing up for time-of-use rates that offer discount for PEV charging
Step 5: Install chargerHire electrician to do load analysis and panel upgrade if required
Obtain necessary building, electrical and/or planning permits
Complete installation with licensed electrician and/or contractor
Pass inspection
Cost factor:•PEV
Cost factor: •None
Cost factor:•Charging equipment
Cost factors:•Electricity•Second meter (if required)
Cost factors:•Building load analysis•Panel upgrade (if required)•Installation (labor)
•Conduit and circuitry
•Permitting•Trenching (if required)•Insurance (if required)
Source: Adapted from (California Plug-in Electric Vehicle Collaborative 2012)
Public agencies and/or utilities are positioned to intervene in these various steps to bring down the hard and soft costs of single-family charging. The following section demonstrates the financial benefit to drivers of various PEV planning reforms and incentives.
5.7 PEV planning reduces the cost of electric driving
As shown in Table 5.5, the upfront costs of equipment and installation make up the majority of the cost elements of charging a PEV. For single-family homes, the upfront costs will likely only include the electrical service and/or charging equipment, installation and permitting, but could
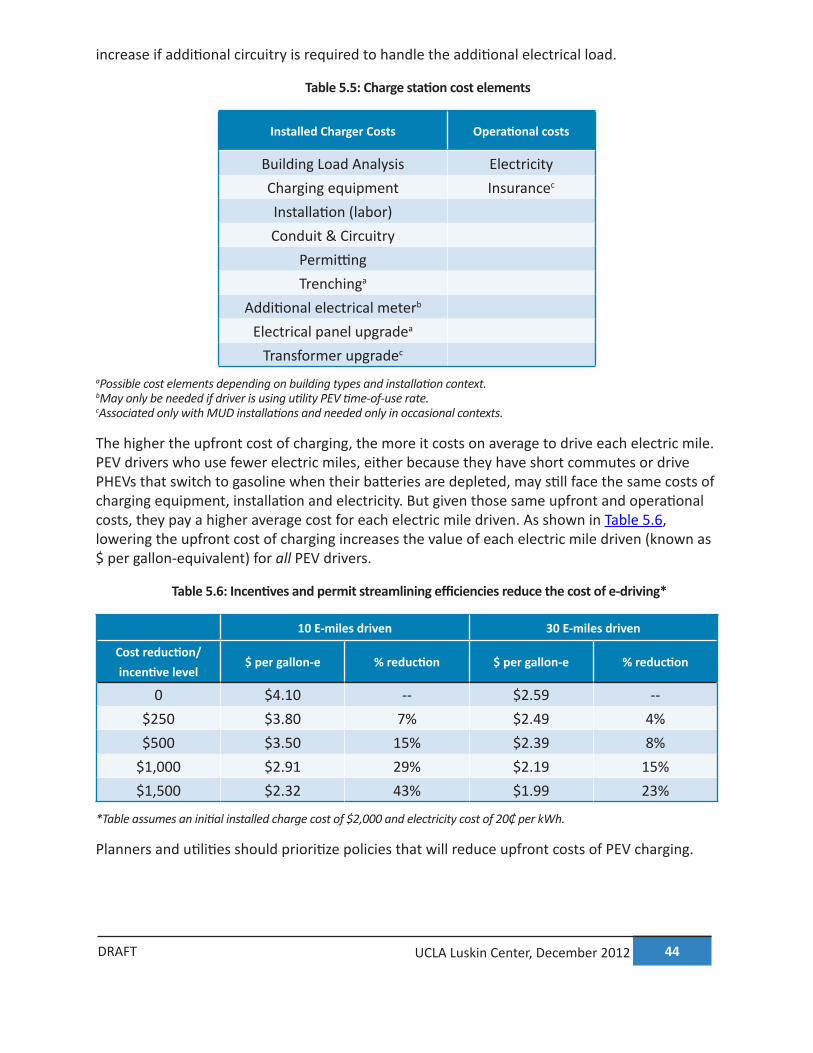
44 UCLA Luskin Center, December 2012DRAFT
increase if additional circuitry is required to handle the additional electrical load.
Table 5.5: Charge station cost elements
Installed Charger Costs Operational costs
Building Load Analysis ElectricityCharging equipment Insurancec
Installation (labor)Conduit & Circuitry
PermittingTrenchinga
Additional electrical meterb
Electrical panel upgradea
Transformer upgradec
aPossible cost elements depending on building types and installation context.bMay only be needed if driver is using utility PEV time-of-use rate. cAssociated only with MUD installations and needed only in occasional contexts.
The higher the upfront cost of charging, the more it costs on average to drive each electric mile. PEV drivers who use fewer electric miles, either because they have short commutes or drive PHEVs that switch to gasoline when their batteries are depleted, may still face the same costs of charging equipment, installation and electricity. But given those same upfront and operational costs, they pay a higher average cost for each electric mile driven. As shown in Table 5.6, lowering the upfront cost of charging increases the value of each electric mile driven (known as $ per gallon-equivalent) for all PEV drivers.
Table 5.6: Incentives and permit streamlining efficiencies reduce the cost of e-driving*
10 E-miles driven 30 E-miles driven
Cost reduction/incentive level
$ per gallon-e % reduction $ per gallon-e % reduction
0 $4.10 -- $2.59 --$250 $3.80 7% $2.49 4%$500 $3.50 15% $2.39 8%
$1,000 $2.91 29% $2.19 15%$1,500 $2.32 43% $1.99 23%
*Table assumes an initial installed charge cost of $2,000 and electricity cost of 20₵ per kWh.
Planners and utilities should prioritize policies that will reduce upfront costs of PEV charging.
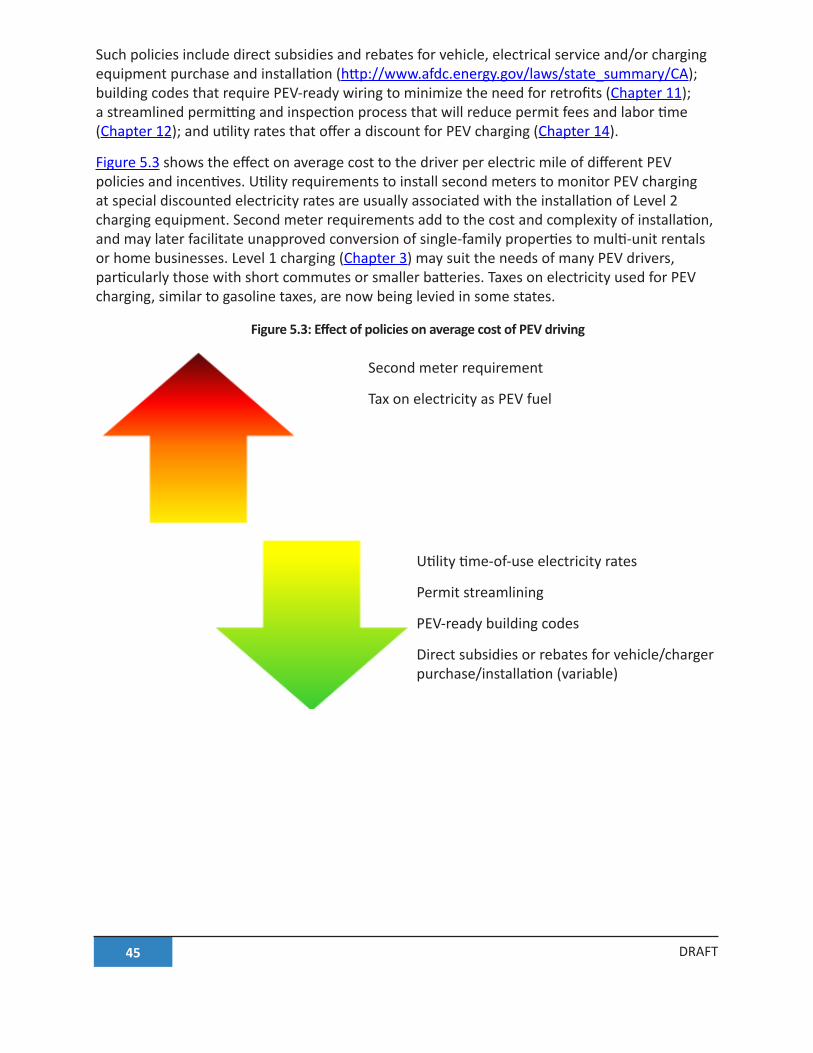
45 DRAFT
Such policies include direct subsidies and rebates for vehicle, electrical service and/or charging equipment purchase and installation (http://www.afdc.energy.gov/laws/state_summary/CA); building codes that require PEV-ready wiring to minimize the need for retrofits (Chapter 11); a streamlined permitting and inspection process that will reduce permit fees and labor time (Chapter 12); and utility rates that offer a discount for PEV charging (Chapter 14).
Figure 5.3 shows the effect on average cost to the driver per electric mile of different PEV policies and incentives. Utility requirements to install second meters to monitor PEV charging at special discounted electricity rates are usually associated with the installation of Level 2 charging equipment. Second meter requirements add to the cost and complexity of installation, and may later facilitate unapproved conversion of single-family properties to multi-unit rentals or home businesses. Level 1 charging (Chapter 3) may suit the needs of many PEV drivers, particularly those with short commutes or smaller batteries. Taxes on electricity used for PEV charging, similar to gasoline taxes, are now being levied in some states.
Figure 5.3: Effect of policies on average cost of PEV driving
Second meter requirement
Tax on electricity as PEV fuel
Utility time-of-use electricity rates
Permit streamlining
PEV-ready building codes
Direct subsidies or rebates for vehicle/charger purchase/installation (variable)
46 UCLA Luskin Center, December 2012DRAFT
5.8 References
Assessment of Plug-in Electric Vehicle Integration with ISO/RTO Systems. 2010. http://www.isorto.org/atf/cf/%7B5B4E85C6-7EAC-40A0-8DC3-003829518EBD%7D/IRC_Report_Assessment_of_Plug-in_Electric_Vehicle_Integration_with_ISO-RTO_Systems_03232010.pdf.
California Center for Sustainable Energy. 2012. California Plug-in Electric Vehicle Owner Survey. http://energycenter.org/index.php/incentive-programs/self-generation-incentive-program/sgip-documents/doc_download/1140-pev-owner-survey-result.
California Plug-in Electric Vehicle Collaborative. 2012. PEV Charging: Where and When? Communication Guide 3. http://www.pevcollaborative.org/sites/all/themes/pev/files/Comm_guide3_122308.pdf.
Williams, Brett D., and Kenneth S. Kurani. 2006. Estimating the early household market for light-duty hydrogen-fuel-cell vehicles and other “Mobile Energy” innovations in California: A constraints analysis. Journal of Power Sources 160 (1):446-453. http://www.sciencedirect.com/science/article/pii/S0378775306003612.
90 UCLA Luskin Center, December 2012DRAFT
8 Planning for Retail and Public Sector Charging
8.1 Introduction
Most plug-in electric vehicle (PEV) charging occurs at home, followed by charging at the workplace. However, the proliferation of plug-in hybrid electric vehicles (PHEVs) has increased the demand for more sporadic charging outside of home or work. To maximize their electric miles driven, many PHEV drivers find it valuable to charge when visiting retail and government-owned destinations.
Whether charging at public-sector and retail sites is cost-effective for PEV drivers and financially viable for charge station operators will depend upon several factors. These include where stations are located, how much demand there is for charging, and how much it costs to use or own the charge station. This chapter describes the site criteria that should be considered in the selection of public-sector23 and retail charging stations. It also describes how demand for charging in afternoon and evening can vary across neighborhoods within the region using the Southern California Association of Governments (SCAG) regional travel model. Finally, this chapter notes the challenges associated with pricing charging at some retail destinations.
8.2 Evaluative criteria for the selection of public-sector and retail charging sites
Planners will want to consider a variety of criteria when prioritizing a site or group of sites. Many of these criteria relate to a site’s potential demand for charging or its relative cost-effectiveness in hosting a station. These factors include:
• Potential demand for PEV charging • Frequency of visits per week • Time of day when charging
23 “Public sector” here refers to sites owned by the public sector and used by both public-sector employee per-sonal cars (not fleet vehicles) and/or by the general public.

91 Planning for Retail and Public Sector Charging DRAFT
• How long cars are parked (a.k.a. “dwell time”) • Cost of electricity (and demand charges) • The value of non-PEV parking spaces to the site host • Driver’s cost of waiting • “Green” reputation for site host
8.2.1 Sites and areas with high potential demand for charging
One of the most important criteria is that the site be a place where PEVs are or will be parked. Several types of current driver-specific, site-specific, and neighborhood-specific criteria can be used to assess current- and near-term potential demand for charging. The most reliable evidence on potential charge station utilization comes from those drivers currently using parking at a site. Indeed, the best site- specific evidence is the actual presence of PEVs parked on or adjacent to the site. Customer surveys (or driver surveys in the case of public-sector sites) of PEV ownership and the intent to purchase a PEV can also be a good predictor. Future demand for PEVs is often associated with the current ownership of hybrids, so a higher-than-average concentration of hybrids in a parking lot may be a good predictor. Planners could also use demographics associated with early-market PEV adopters. These characteristics include customers with higher educational achievement, moderate to higher incomes, willingness to innovate, and often attitudes that are pro-environment or pro-oil independence (California Center for Sustainable Energy; Landy 2011; Nixon and Saphores 2011).
The frequency and total level of visitation to a site can also be an important factor. Planners might also ask where the site supports parking for 1) routine daily travel (work, school, gyms, etc.), 2) routine weekly travel (stadiums, theaters, churches, etc.) or 3) occasional travel (hotels, major vacation destination charging or freeway-adjacent stations). We discuss specific site types in greater detail in the following sections.
Other site-specific characteristics, such as size and location, may be useful but should be used to make a choice between competing sites that have been prioritized based customer- or driver-specific evidence of potential demand. With all else equal, sites with larger parking capacity are more likely to host PEVs. Similarly, prioritizing sites near high-volume freeways or arterials might incrementally increase site utilization.
Planners may also use regional travel demand models to predict areas where PEV density will be highest at different times of the day. We have done this for travel analysis zones in the SCAG regions. Such zones are about the same size as, and often coincide with, Census tracts across the SCAG region. Using such models, planners can predict areas in which different numbers of PEVs will be parked during different periods of the day and night. See the chapters on single-family (Chapter 5) and workplace charging (Chapter 7) in this plan as well as the retail charging spatial analysis later in this chapter. While this neighborhood-scale analysis not a site-specific analysis, it can be used to complement site analysis by targeting those high-demand areas

92 UCLA Luskin Center, December 2012DRAFT
within which sites can then be effectively prioritized.
8.2.2 Criteria for selecting cost-effective charge sites
Selecting sites that offer the lowest possible cost of charging will benefit not only the site host (by increasing utilization rates) but also PEV drivers (who will pay lower prices for charging). Sites that provide the lowest possible cost per kilowatt-hour (kWh) to PEVs will typically have the following features:
•• Sites on which PEVs are parked for longer periods of time (longer “dwell times”) enable slower rates of charging, which may enable the use of less costly Level 1 charging rather than more costly Level 2 or fast charging. The longer the dwell time, the more miles of electric range can be added. At Level 1, an hour of charge can add five to 10 miles of range, depending on the capacity of the vehicle’s onboard charger. At Level 2, an hour of charge adds between 10 to 20 miles of range, depending on the capacity of the vehicle’s onboard charger. Longer PEV dwell times also enable multi-armed smart chargers to deliver lower costs per kWh delivered over a larger numbers of vehicles. Slower charging, enabled by long dwell times, may also help site owners to avoid electricity demand charges.
Planners may also want to balance factors like average trip distance and frequency of travel to a site with the dwell time for each particular site type. While routine destinations may see greater use, shorter trips may benefit less from charging than would longer trips with longer dwell times.
• A feature related to the land use or type of site is time of PEV arrival at the site, which determines the time of day when charging would occur. Charging that occurs before 12:00 p.m. and after 9:00 p.m. will enable most site hosts to provide lower-cost electricity to PEVs because of electricity rates that are lower during these periods. Charging between 12:00 p.m. and 9:00 p.m. is not only the most expensive, but more likely to incur demand charges for the site host24. The arrival times at government-owned sites can vary greatly throughout the day. Unfortunately, many types of retail sites are only open between 10:00 a.m. and 9:00 p.m., which is the period when electricity costs are highest and demand charges are most likely. In addition, dwell times are often the lowest for many types of retail destinations, making them the least cost-effective type of land use to host charging.
• The value of regular parking spaces to the site host is another factor to consider. For many sites, there is no value lost by replacing a regular parking space with a charging space, because most sites have many unused parking spaces. On sites where there is a shortage of parking, charging stations can also be located in places within parking facilities that are the last to fill up in order to avoid the appearance (to the other
24 Demand charges are added to the electricity bills of non-residential customers to reflect the additional cost of delivering power to them during the customer’s peak usage times.
93 Planning for Retail and Public Sector Charging DRAFT
employees or customers) of displacement.25 Sites can also experiment with dual-use and time-of-day split use of spaces for both parking and charging. For example, charging spaces intended for government employees during the day can be made available to the general public at night.
•• The second type of cost that may vary across public-sector and retail sites is the driver’s time while charging. In most instances, PEV drivers will not choose to charge at a site unless there is no additional time associated with charging. Planners should expect the PEV driver will be busy with whatever motivated his or her visit to that destination. Only in the rare case that a PEV driver is in danger of running out fuel are they likely to be willing to spend time refueling, and then they are likely to choose to refuel quickly with gasoline if they own a PHEV. Chargers should be located at sites where drivers would normally stop for at least 1 to 2 hours or more unless they are refueling along interstate corridors during inter-regional travel.
8.2.3 Retail site characteristics that affect benefits
Two other factors may affect the value proposition of hosting a charge station at retail sites. The first is that, for a few types of retail sites that price charging lower than what drivers would pay at home, charging stations may attract customers that would have otherwise gone to another retail site. (See Chapter 5 on residential charging for more information.) Second, some site hosts want to support or be associated with “green” values or energy independence. These are likely to be retail establishments that incorporate these values into the corporate brand identities.
8.2.4 Types of publicly-owned and retail sites
Based on the above criteria, we identify several broad categories of sites. We use an analysis of 2009 National Household Transportation Survey data (Krumm 2012) to common travel destinations that tend to require at least moderate travel distance. Based on this analysis, the list below features some examples of publicly-owned site types where vehicles tend to be parked for about two hours on average:
• Government workplaces • Transportation stations
o Airports, light rail/subway, bus, ship/ferry terminals • Public parking facilities • Public recreational/natural/cultural facilities
o Football, baseball, basketball, soccer, tennis, pool facilitieso Parks, beaches and playgrounds
25 Placement of the first charging space may be constrained by disabled access requirements. See Chapter 13 for a discussion of charging space compliance with the Americans with Disabilities Act.
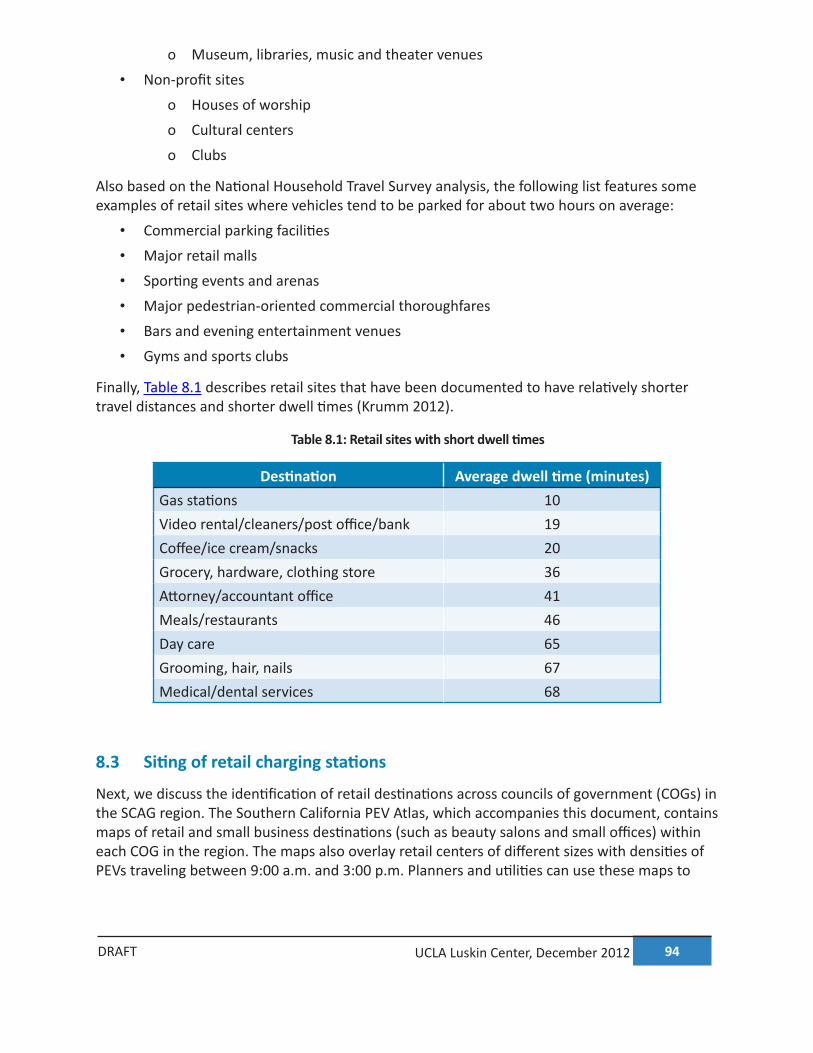
94 UCLA Luskin Center, December 2012DRAFT
o Museum, libraries, music and theater venues • Non-profit sites
o Houses of worship o Cultural centerso Clubs
Also based on the National Household Travel Survey analysis, the following list features some examples of retail sites where vehicles tend to be parked for about two hours on average:
• Commercial parking facilities • Major retail malls • Sporting events and arenas • Major pedestrian-oriented commercial thoroughfares • Bars and evening entertainment venues • Gyms and sports clubs
Finally, Table 8.1 describes retail sites that have been documented to have relatively shorter travel distances and shorter dwell times (Krumm 2012).
Table 8.1: Retail sites with short dwell times
Destination Average dwell time (minutes)Gas stations 10Video rental/cleaners/post office/bank 19Coffee/ice cream/snacks 20Grocery, hardware, clothing store 36Attorney/accountant office 41Meals/restaurants 46Day care 65Grooming, hair, nails 67Medical/dental services 68
8.3 Siting of retail charging stations
Next, we discuss the identification of retail destinations across councils of government (COGs) in the SCAG region. The Southern California PEV Atlas, which accompanies this document, contains maps of retail and small business destinations (such as beauty salons and small offices) within each COG in the region. The maps also overlay retail centers of different sizes with densities of PEVs traveling between 9:00 a.m. and 3:00 p.m. Planners and utilities can use these maps to

95 Planning for Retail and Public Sector Charging DRAFT
compare the spatial distribution of retail centers and mid-day travel destinations for PEVs.
After locating general categories of retail charging opportunities on the map, planners can turn to the analysis of the National Household Travel Survey referenced above26 for more detailed descriptions of how long cars are typically parked at specific types of retail destinations. Understanding the “dwell time” associated with specific types of retail locations will help planners and prospective site hosts prioritize retail charging opportunities that are likely to be higher-demand and more financially viable.
The COG-level maps in the Southern California PEV Atlas display retail destinations according to density classifications from SCAG. They highlight four types of retail centers that are likely to attract many of the non-work related vehicular trips. These four categories presented in Table 8.2.
Table 8.2: Type of retail shopping centers
Description Key Attribute
Regional Shopping Center Department store with surrounding parking
Retail Centers (Non-Strip With Contiguous Interconnected Off-Street Parking) Magnet store with in-front parking
Modern Strip Development Small businesses with parking on-street and on one side
Older Strip Development Small businesses with on-street parking
Source: (Southern California Association of Governments 2002)
An example retail destination map from the Westside Cities Council of Governments is provided below (Map 8.1). Planners should consult the Southern California PEV Atlas for all COG-level maps.
26 http://research.microsoft.com/en-us/um/people/jckrumm/Publications%202012/2012-01-0489%20SAE%20published.pdf
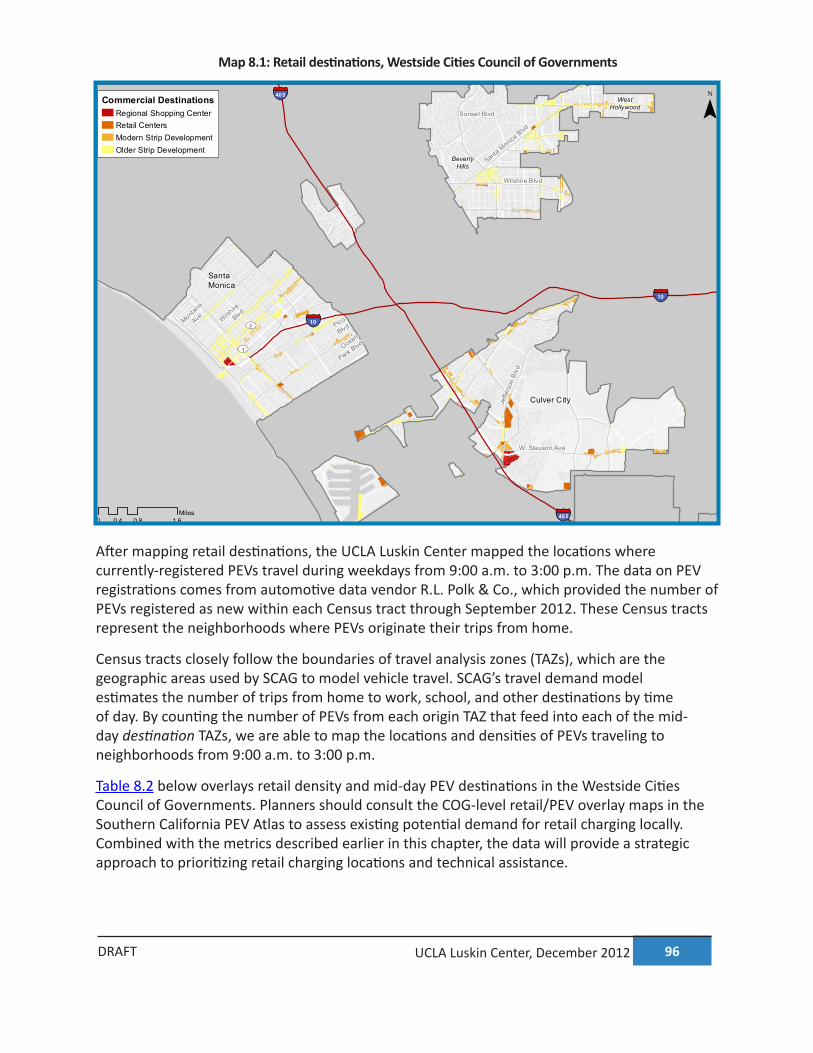
96 UCLA Luskin Center, December 2012DRAFT
Map 8.1: Retail destinations, Westside Cities Council of Governments
UV1
UV2 Pico
Blvd
Ocean
Park Blvd
Montana
Ave Wilshire
Blvd
§̈¦10
§̈¦405
§̈¦405
§̈¦10
SantaMonica
UCLA Luskin Center for InnovationUCLA Lewis Center for Regional Policy Studies
0 0.8 1.60.4Miles
Commercial DestinationsRegional Shopping CenterRetail CentersModern Strip DevelopmentOlder Strip Development
Map Prepared By Norman WongDecember 2012
¯
CommercialWestside
Sunset Blvd
Santa Monica
Blvd
Jeffe
rson
Blv
d
Culver City
BeverlyHills
W. Slauson Ave
WestHollywood
Wilshire Blvd
After mapping retail destinations, the UCLA Luskin Center mapped the locations where currently-registered PEVs travel during weekdays from 9:00 a.m. to 3:00 p.m. The data on PEV registrations comes from automotive data vendor R.L. Polk & Co., which provided the number of PEVs registered as new within each Census tract through September 2012. These Census tracts represent the neighborhoods where PEVs originate their trips from home.
Census tracts closely follow the boundaries of travel analysis zones (TAZs), which are the geographic areas used by SCAG to model vehicle travel. SCAG’s travel demand model estimates the number of trips from home to work, school, and other destinations by time of day. By counting the number of PEVs from each origin TAZ that feed into each of the mid-day destination TAZs, we are able to map the locations and densities of PEVs traveling to neighborhoods from 9:00 a.m. to 3:00 p.m.
Table 8.2 below overlays retail density and mid-day PEV destinations in the Westside Cities Council of Governments. Planners should consult the COG-level retail/PEV overlay maps in the Southern California PEV Atlas to assess existing potential demand for retail charging locally. Combined with the metrics described earlier in this chapter, the data will provide a strategic approach to prioritizing retail charging locations and technical assistance.
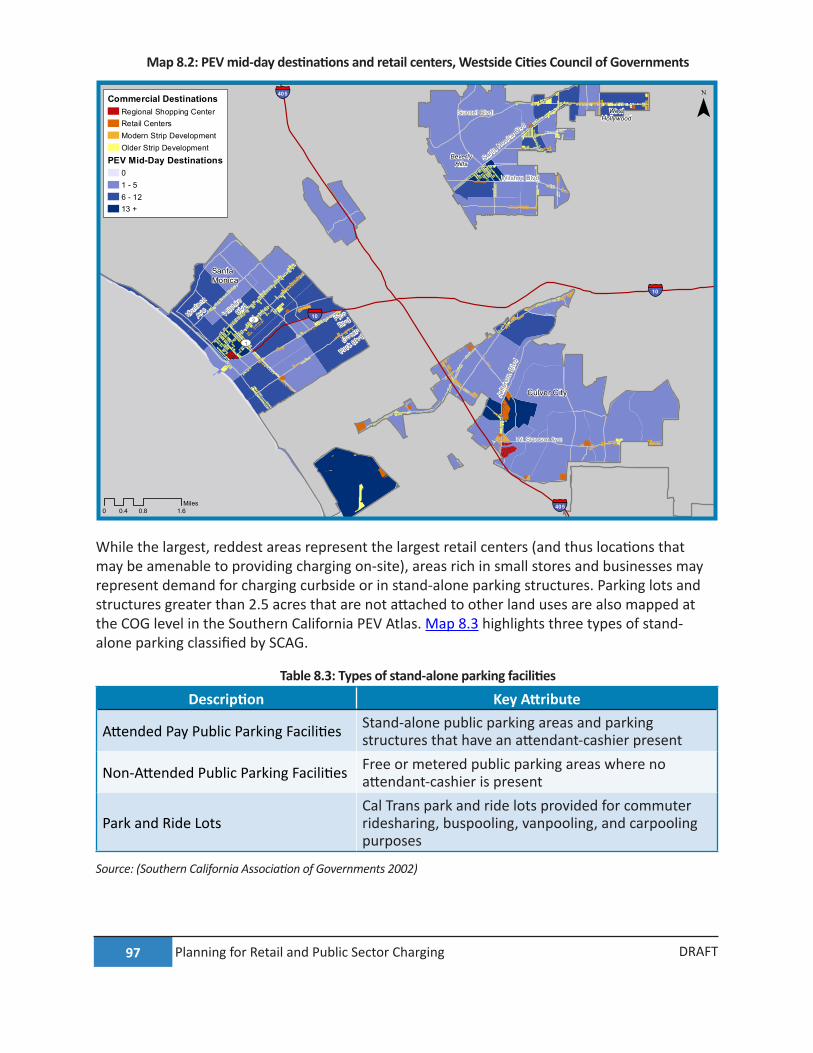
97 Planning for Retail and Public Sector Charging DRAFT
Map 8.2: PEV mid-day destinations and retail centers, Westside Cities Council of Governments
UV1
UV2 Pico
Blvd
Ocean
Park Blvd
Montana
Ave Wilshire
Blvd
§̈¦10
§̈¦405
§̈¦405
§̈¦10
SantaMonica
UCLA Luskin Center for InnovationUCLA Lewis Center for Regional Policy Studies
0 0.8 1.60.4Miles
Commercial DestinationsRegional Shopping CenterRetail CentersModern Strip DevelopmentOlder Strip Development
PEV Mid-Day Destinations01 - 56 - 1213 +
Map Prepared By Norman WongDecember 2012
¯
PEV + CommercialWestside
Sunset Blvd
Santa Monica
Blvd
Jeffe
rson
Blv
d
Culver City
BeverlyHills
W. Slauson Ave
WestHollywood
Wilshire Blvd
While the largest, reddest areas represent the largest retail centers (and thus locations that may be amenable to providing charging on-site), areas rich in small stores and businesses may represent demand for charging curbside or in stand-alone parking structures. Parking lots and structures greater than 2.5 acres that are not attached to other land uses are also mapped at the COG level in the Southern California PEV Atlas. Map 8.3 highlights three types of stand-alone parking classified by SCAG.
Table 8.3: Types of stand-alone parking facilities
Description Key Attribute
Attended Pay Public Parking Facilities Stand-alone public parking areas and parking structures that have an attendant-cashier present
Non-Attended Public Parking Facilities Free or metered public parking areas where no attendant-cashier is present
Park and Ride LotsCal Trans park and ride lots provided for commuter ridesharing, buspooling, vanpooling, and carpooling purposes
Source: (Southern California Association of Governments 2002)
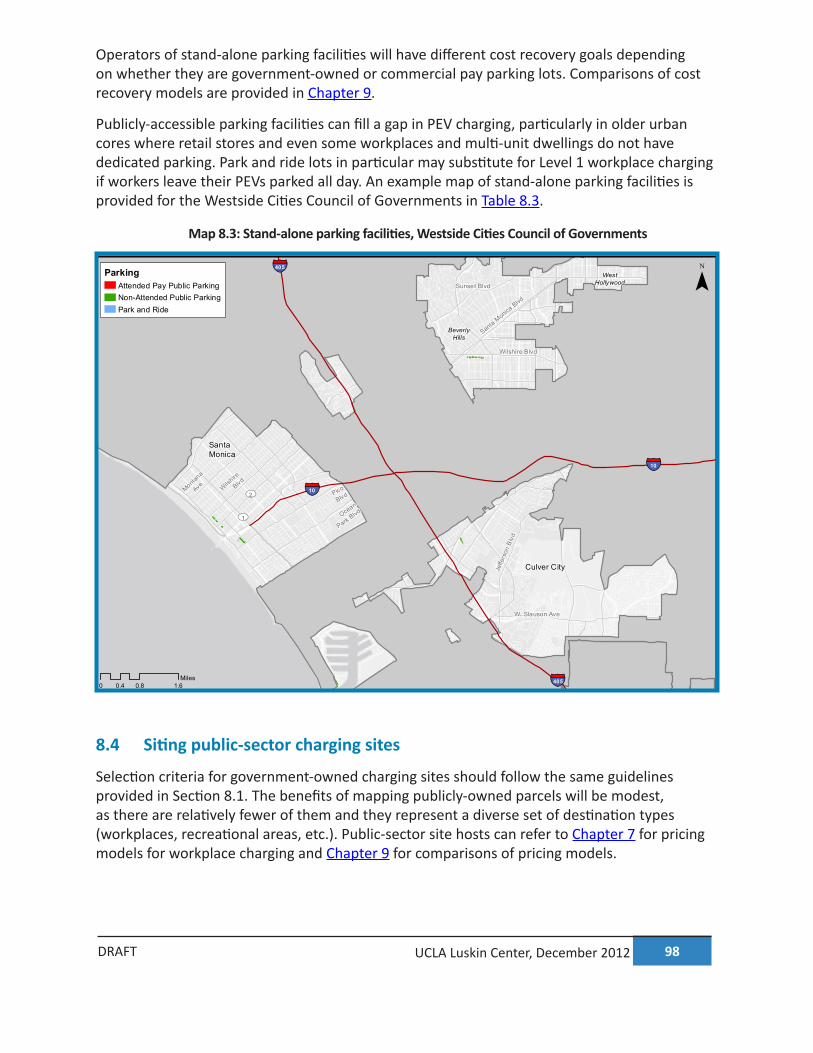
98 UCLA Luskin Center, December 2012DRAFT
Operators of stand-alone parking facilities will have different cost recovery goals depending on whether they are government-owned or commercial pay parking lots. Comparisons of cost recovery models are provided in Chapter 9.
Publicly-accessible parking facilities can fill a gap in PEV charging, particularly in older urban cores where retail stores and even some workplaces and multi-unit dwellings do not have dedicated parking. Park and ride lots in particular may substitute for Level 1 workplace charging if workers leave their PEVs parked all day. An example map of stand-alone parking facilities is provided for the Westside Cities Council of Governments in Table 8.3.
Map 8.3: Stand-alone parking facilities, Westside Cities Council of Governments
UV1
UV2 Pico
Blvd
Ocean
Park Blvd
Montana
Ave Wilshire
Blvd
§̈¦10
§̈¦405
§̈¦405
§̈¦10
SantaMonica
UCLA Luskin Center for InnovationUCLA Lewis Center for Regional Policy Studies
0 0.8 1.60.4Miles
ParkingAttended Pay Public ParkingNon-Attended Public ParkingPark and Ride
Map Prepared By Norman WongDecember 2012
¯
ParkingWestside
Sunset Blvd
Santa Monica
Blvd
Jeffe
rson
Blv
d
Culver City
BeverlyHills
W. Slauson Ave
WestHollywood
Wilshire Blvd
8.4 Siting public-sector charging sites
Selection criteria for government-owned charging sites should follow the same guidelines provided in Section 8.1. The benefits of mapping publicly-owned parcels will be modest, as there are relatively fewer of them and they represent a diverse set of destination types (workplaces, recreational areas, etc.). Public-sector site hosts can refer to Chapter 7 for pricing models for workplace charging and Chapter 9 for comparisons of pricing models.
99 Planning for Retail and Public Sector Charging DRAFT
8.5 Pricing, utilization and the financial viability of retail charging
A central concern of most retailers is whether retail charging will be financially viable. They want to know whether they can at least break even on their investment. In this section, we first present a set of questions facing retailers who wish to make well-informed investments in charging equipment. We conclude that only with longer dwell times and well-designed pricing policies will retail charging be both financially viable for retailers and cost-effective for PEV drivers.
Planners who wish to advise retailers on other pricing alternatives should also see Chapter 9.
8.5.1 How much customer demand will there be for PEV charging?
In order to assess customer demand for PEV charging, retailers will want to know: • How many customers are currently driving PEVs to their retail establishment? • How will this number grow over time? • Will they charge at a retail establishment if equipment is available?
Some customers may not need to charge at retail establishments in order to complete their daily commute on electric miles. Most customers are likely to make this decision by comparing the costs of charging at retail establishments with their costs of refueling elsewhere such as charging at home or filling up with gasoline if they drive a PHEV.
8.5.2 How should the retailer price PEV charging?
Once the retailer estimates the demand for retail charging, he or she must decide how to price the service. Understanding potential demand will help the retailer determine how much electricity customers will consume for PEV charging and what revenues will be generated by pricing use of the equipment.
Retailers risk pricing the use of charging equipment higher than what customers pay at home or at work. In this case, customers with PEVs may not choose to charge at retail establishments and the retailer will fail to generate the expected revenue. Retailers also run the risk of pricing the use of charging equipment at levels too low to cover the retailer’s costs. In our analysis below, we consider both of these possible errors when evaluating the financial viability of workplace charging scenarios.
8.5.3 How much charging capacity should the retailer provide?
Capacity refers to the number of cords of each level (1, 2, or fast charging) provided at the location. Currently, single-cord Level 2 chargers are popular. But this may not necessarily be the best capacity for retailers to choose. If the retailer expects multiple customers (or employees) to adopt PEVs, then multiple-cord (or multiplex) charging units with different levels of service (1
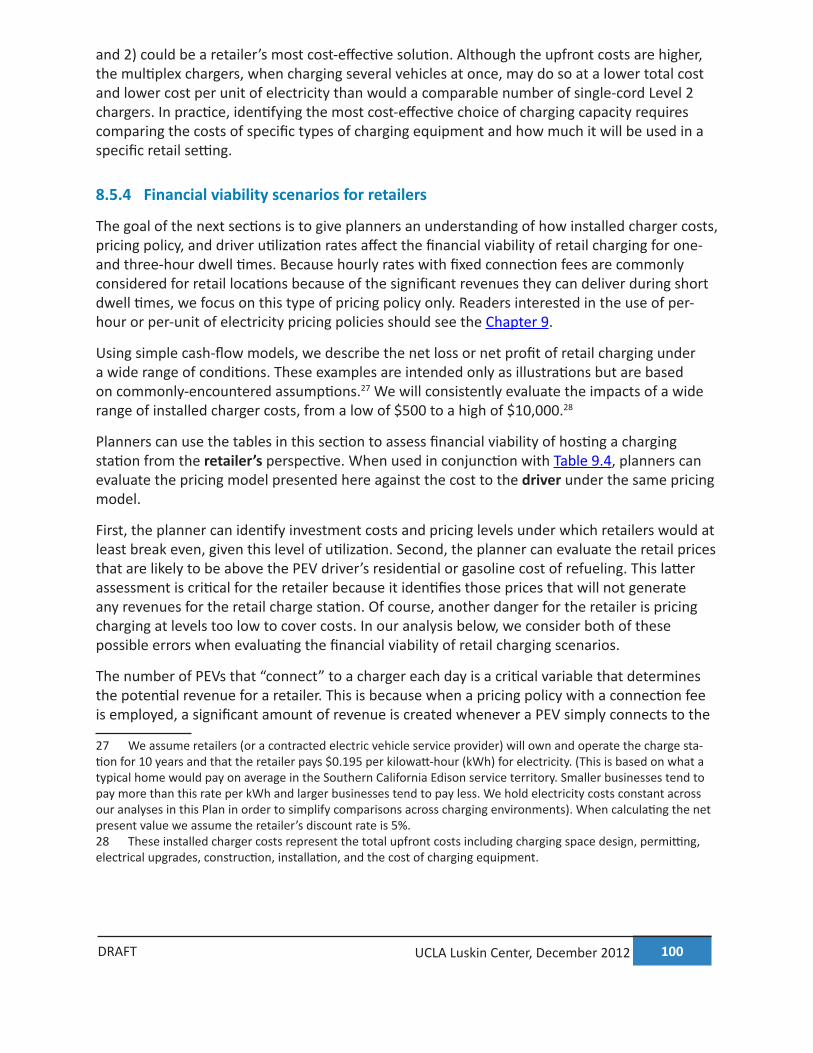
100 UCLA Luskin Center, December 2012DRAFT
and 2) could be a retailer’s most cost-effective solution. Although the upfront costs are higher, the multiplex chargers, when charging several vehicles at once, may do so at a lower total cost and lower cost per unit of electricity than would a comparable number of single-cord Level 2 chargers. In practice, identifying the most cost-effective choice of charging capacity requires comparing the costs of specific types of charging equipment and how much it will be used in a specific retail setting.
8.5.4 Financial viability scenarios for retailers
The goal of the next sections is to give planners an understanding of how installed charger costs, pricing policy, and driver utilization rates affect the financial viability of retail charging for one- and three-hour dwell times. Because hourly rates with fixed connection fees are commonly considered for retail locations because of the significant revenues they can deliver during short dwell times, we focus on this type of pricing policy only. Readers interested in the use of per-hour or per-unit of electricity pricing policies should see the Chapter 9.
Using simple cash-flow models, we describe the net loss or net profit of retail charging under a wide range of conditions. These examples are intended only as illustrations but are based on commonly-encountered assumptions.27 We will consistently evaluate the impacts of a wide range of installed charger costs, from a low of $500 to a high of $10,000.28
Planners can use the tables in this section to assess financial viability of hosting a charging station from the retailer’s perspective. When used in conjunction with Table 9.4, planners can evaluate the pricing model presented here against the cost to the driver under the same pricing model.
First, the planner can identify investment costs and pricing levels under which retailers would at least break even, given this level of utilization. Second, the planner can evaluate the retail prices that are likely to be above the PEV driver’s residential or gasoline cost of refueling. This latter assessment is critical for the retailer because it identifies those prices that will not generate any revenues for the retail charge station. Of course, another danger for the retailer is pricing charging at levels too low to cover costs. In our analysis below, we consider both of these possible errors when evaluating the financial viability of retail charging scenarios.
The number of PEVs that “connect” to a charger each day is a critical variable that determines the potential revenue for a retailer. This is because when a pricing policy with a connection fee is employed, a significant amount of revenue is created whenever a PEV simply connects to the
27 We assume retailers (or a contracted electric vehicle service provider) will own and operate the charge sta-tion for 10 years and that the retailer pays $0.195 per kilowatt-hour (kWh) for electricity. (This is based on what a typical home would pay on average in the Southern California Edison service territory. Smaller businesses tend to pay more than this rate per kWh and larger businesses tend to pay less. We hold electricity costs constant across our analyses in this Plan in order to simplify comparisons across charging environments). When calculating the net present value we assume the retailer’s discount rate is 5%. 28 These installed charger costs represent the total upfront costs including charging space design, permitting, electrical upgrades, construction, installation, and the cost of charging equipment.
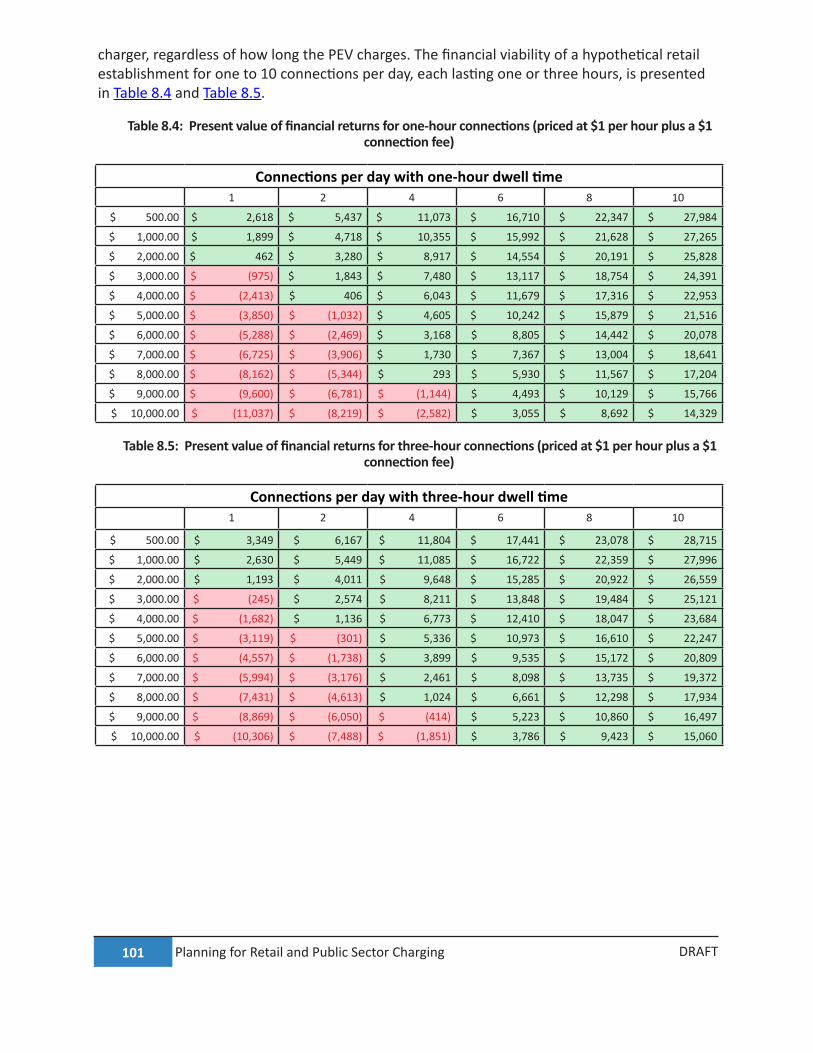
101 Planning for Retail and Public Sector Charging DRAFT
charger, regardless of how long the PEV charges. The financial viability of a hypothetical retail establishment for one to 10 connections per day, each lasting one or three hours, is presented in Table 8.4 and Table 8.5.
Table 8.4: Present value of financial returns for one-hour connections (priced at $1 per hour plus a $1 connection fee)
Connections per day with one-hour dwell time1 2 4 6 8 10
$ 500.00 $ 2,618 $ 5,437 $ 11,073 $ 16,710 $ 22,347 $ 27,984
$ 1,000.00 $ 1,899 $ 4,718 $ 10,355 $ 15,992 $ 21,628 $ 27,265
$ 2,000.00 $ 462 $ 3,280 $ 8,917 $ 14,554 $ 20,191 $ 25,828
$ 3,000.00 $ (975) $ 1,843 $ 7,480 $ 13,117 $ 18,754 $ 24,391
$ 4,000.00 $ (2,413) $ 406 $ 6,043 $ 11,679 $ 17,316 $ 22,953
$ 5,000.00 $ (3,850) $ (1,032) $ 4,605 $ 10,242 $ 15,879 $ 21,516
$ 6,000.00 $ (5,288) $ (2,469) $ 3,168 $ 8,805 $ 14,442 $ 20,078
$ 7,000.00 $ (6,725) $ (3,906) $ 1,730 $ 7,367 $ 13,004 $ 18,641
$ 8,000.00 $ (8,162) $ (5,344) $ 293 $ 5,930 $ 11,567 $ 17,204
$ 9,000.00 $ (9,600) $ (6,781) $ (1,144) $ 4,493 $ 10,129 $ 15,766
$ 10,000.00 $ (11,037) $ (8,219) $ (2,582) $ 3,055 $ 8,692 $ 14,329
Table 8.5: Present value of financial returns for three-hour connections (priced at $1 per hour plus a $1 connection fee)
Connections per day with three-hour dwell time1 2 4 6 8 10
$ 500.00 $ 3,349 $ 6,167 $ 11,804 $ 17,441 $ 23,078 $ 28,715
$ 1,000.00 $ 2,630 $ 5,449 $ 11,085 $ 16,722 $ 22,359 $ 27,996
$ 2,000.00 $ 1,193 $ 4,011 $ 9,648 $ 15,285 $ 20,922 $ 26,559
$ 3,000.00 $ (245) $ 2,574 $ 8,211 $ 13,848 $ 19,484 $ 25,121
$ 4,000.00 $ (1,682) $ 1,136 $ 6,773 $ 12,410 $ 18,047 $ 23,684
$ 5,000.00 $ (3,119) $ (301) $ 5,336 $ 10,973 $ 16,610 $ 22,247
$ 6,000.00 $ (4,557) $ (1,738) $ 3,899 $ 9,535 $ 15,172 $ 20,809
$ 7,000.00 $ (5,994) $ (3,176) $ 2,461 $ 8,098 $ 13,735 $ 19,372
$ 8,000.00 $ (7,431) $ (4,613) $ 1,024 $ 6,661 $ 12,298 $ 17,934
$ 9,000.00 $ (8,869) $ (6,050) $ (414) $ 5,223 $ 10,860 $ 16,497
$ 10,000.00 $ (10,306) $ (7,488) $ (1,851) $ 3,786 $ 9,423 $ 15,060
102 UCLA Luskin Center, December 2012DRAFT
8.6 References
California Center for Sustainable Energy. California Plug-in Electric Vehicle Owner Survey. http://energycenter.org/index.php/incentive-programs/self-generation-incentive-program/sgip-documents/doc_download/1140-pev-owner-survey-result.
Krumm, John. 2012. How People Use Their Vehicles: Statistics from the 2009 National Household Travel Survey. SAE International, http://research.microsoft.com/en-us/um/people/jckrumm/Publications%202012/2012-01-0489%20SAE%20published.pdf.
Landy, Cristi. 2011. The Customer Experience: What We Have Learned... Automotive News Green Car Conference, http://www.autonews.com/assets/html/green-car-conference/2011/_pdf/Cristi-Landy-Presentation.pdf.
Nixon, Hilary, and Jean-Daniel Saphores. 2011. Understanding Household Preferences for Alternative-Fuel Vehicle Technologies. (MTI Report 10-11), http://ntl.bts.gov/lib/45000/45400/45419/2809-Alternative-Fuel-Vehicle-Technologies.pdf.
Southern California Association of Governments. 2002. Southern California 1990 Aerial Land Use Study: Land Use Code Descriptions and Key Signatures, Level III/IV.
113 DRAFT
10 Zoning Policies for PEV Readiness
10.1 Introduction
Zoning codes regulate what types of land uses and densities are appropriate for different neighborhoods. As such, zoning codes are the most powerful tool cities have to incentivize certain types of development, including placement of charging stations. The goal of zoning for PEVs should be to ensure that charging is an allowed land use in as many types of zoning districts as possible, either as an accessory or principal use as appropriate. Planners should also consider reducing parking requirements in exchange for installation of charging units or allowing PEV charging spaces to count towards minimum parking requirements.
Another reason to consider zoning for PEVs is to make zoning ordinances compatible with PEV-ready building codes. Many cities have begun to adopt building codes that require PEV-ready wiring in new construction, but their zoning ordinances may not even list PEV charging as a use.
What follows is a discussion of the two main zoning levers for PEV charging: designation as a permitted land use, and incentives for developers to install charging equipment and/or designated PEV parking spaces. Designating PEV charging as a principal or accessory land use will help ensure that different charging levels carry the appropriate type of planning review for the zones in which they are located. Developers can be encouraged to incorporate PEV charging units by allowing the spaces to count towards minimum parking requirements, by reducing the parking requirements, or by allowing spaces for neighborhood electric vehicles (NEVs) to count towards parking requirements.
Zoning generally determines the number of parking spaces required for a certain land use, though some cities have used building codes to specify the number of spaces that need to have PEV-ready wiring in new construction. Further guidance on building codes is provided in Chapter 11.
114 UCLA Luskin Center, December 2012DRAFT
10.2 Charging as an allowed use
PEV charging should be widely allowed in different zoning districts because it is compatible and complementary to many land uses. With the exception of stand-alone fast charging, PEV fueling does not fundamentally alter the purpose or interfere with the use of a land parcel. PEV charging complements existing land uses in that it facilitates transportation modes that were previously not accommodated by those land uses.
If a property is to be used in a way that is not specified as an allowed use in a certain zone, some cities may require the property owner to apply for a use permit. Uses are generally classified as a principal use or an accessory use. Principal uses describe the basic purpose of a site—for example, a bookstore. Accessory uses, such as a small café within a bookstore, are subordinate to the primary use of a site. The designation as an accessory use is intended to circumvent the need for additional parking requirements and review. Many cities will require a simple planning clearance for an accessory use to verify that it is indeed not the dominant use of the site.
Some cities may not see a need to specify PEV charging as either a principal or accessory use in any of their zoning districts. They may view Level 1 and Level 2 charging as an accessory use by default and only require a plan check and electrical permit. Other cities may wish to clarify that charging is an accessory or outright permitted use because unless stated otherwise, planners may interpret this to mean that some sort of use permit is required. Different use permits are subject to different fees and levels of review, which may require the individual planner to make a determination. Eliminating a requirement for a separate planning permit for PEV charging in addition to a building and/or electrical permit can reduce the time and cost of installing chargers. Alternatively, listing PEV charging as a principal or accessory use will guide planners in how to process planning permits if they are required.
Cities should examine their land use mix and determine which zoning districts, if any, to prioritize for explicit permission in the zoning ordinance for different types of charging. Cities may want to do this as part of a general land use or zoning ordinance update. For example, Ready, Set, Charge, California! suggests Level 1, Level 2 and DC Fast charging be considered an outright permitted use in commercial, industrial and institutional zoning districts and as accessory uses in low-density residential districts (Ready, Set, Charge, California! A Guide to EV-Ready Communities 2011). Some cities may only need to clarify charging as an accessory use in non-residential settings to ensure that the principal use of the site is not changed and that traffic flows are not affected by drivers coming to the site solely for PEV charging. Please see Chapter 3 for a discussion of the power requirements for different charging levels and Chapter 8 for a discussion of the lengths of time that cars are typically parked and able to charge at various location types. These factors will help cities and utilities tailor permitted levels of charging to zones with sufficient electrical capacity.
Local jurisdictions should also tailor any conditions attached to charging as a permitted use to the type of construction or level of access that will accompany charging. For example, it may not
115 DRAFT
be necessary to require signage as a condition of charging being allowed as a permitted use if the charging is intended for single-family use.
Zoning ordinances from the City of San Jacinto and the City of Lancaster are excerpted below. San Jacinto’s proposed ordinance specifies which charge levels are allowed in which zones, while Lancaster’s does not. Lancaster’s industrial and recreational park zones are governed by the same language used for commercial zones in specifying PEV charging as an accessory use.
10.2.1 San Jacinto (proposed)
1. Level 1 and 2 electric vehicle charging stations are an allowed use in all zones.
2. Level 3 electric vehicle charging stations are an allowed use in Commercial and Office Zones, Industrial Zones and Special Purpose Zones, as defined in Article 2 (Zones, Allowable Land Uses, and Zone-Specific Standards). (San Jacinto Development Code 2012)
10.2.2 Lancaster
An electric vehicle charging station (EVCS) shall be allowed within any legal single-family or multiple-family residential garage or carport subject to all applicable city code requirements in addition to the following:
a. The EVCS shall be protected as necessary to prevent damage by automobiles; and
b. The EVCS shall be designed to:
Be safe for use during inclement weather, and
Be tamper-resistant to prevent injury particularly to children, and
Be resistant to potential damage by vandalism,
Be equipped with a mechanism to prevent the theft of electricity by an unauthorized user;
c. The EVCS shall have complete instructions and appropriate warnings posted in an unobstructed location next to each EVCS.
An electric vehicle charging station (EVCS) shall be permitted as an accessory use within any existing legal single-family or multiple-family residential garage or carport, or within any existing legal commercial parking space in a parking lot or in a parking garage, subject to all applicable city code requirements and the following:
1. Electric vehicle charging stations (EVCS) for public use shall be subject to the following requirements:
a. The EVCSs shall be located in a manner which will be easily seen by the public for
116 UCLA Luskin Center, December 2012DRAFT
informational and security purposes and shall be illuminated during evening business hours; and
b. Be located in desirable and convenient parking locations which will serve as an incentive for the use of electric vehicles; and
c. The EVCS pedestals shall be protected as necessary to prevent damage by automobiles; and
d. The EVCS pedestals shall be designed to minimize potential damage by vandalism and to be safe for use in inclement weather; and
e. Complete instructions and appropriate warnings concerning the use of the EVCS shall be posted on a sign in a prominent location on each station for use by the operator; and
f. One standard non-illuminated sign, not to exceed 4 square feet in area and 10 feet in height, may be posted for the purpose of identifying the location of each cluster of EVCSs; and
g. The EVCS may be on a timer that limits the use of the station to the normal business hours of the use(s) which it serves to preclude unauthorized use after business hours.
2. Electric vehicle charging stations for private use shall:
a. Be located in a manner which will not allow public access to the charging station; and
b. Comply with subsections G.1.c., d. and e. of this section. (Lancaster Municipal Code)
10.3 Development incentives
PEV charging provides many public benefits, including reductions in greenhouse gas emissions, improvements in neighborhood air quality, and reductions in noise pollution. Planners should consider these benefits when negotiating with developers who want to build more densely on a site than the zoning code would normally allow. Cities often use density bonuses to obtain public benefits such as contributions to parks, open space, or affordable housing. Cities may consider including PEV-ready wiring or charging units as an option for obtaining a density bonus.
Zoning codes specify the minimum number of parking spaces that must be provided for different land uses. Complying with minimum parking requirements can be a challenge for business owners and developers. In a commercial building with many different businesses and shared parking, a business owner applying for a development or use permit may have to demonstrate that there are a sufficient number of existing spaces to serve his or her customers. For developers, the construction of new parking spaces can add significant costs and/or reduce the amount of leasable or sellable floor area.
Business owners and developers may be encouraged to install PEV charging units if they count
117 DRAFT
towards minimum parking requirements. An example of proposed code language from the City of San Jacinto is excerpted below:
10.3.1 San Jacinto (proposed)
The parking spaces associated with the electric vehicle charging stations located within parking lots or garages may be included in meeting the calculation of the minimum parking spaces required in compliance with Chapter 17.330 (Off-Street Parking and Loading Standards).
Small-battery, low-speed neighborhood electric vehicles, or NEVs, are being explored as alternatives to mass transit in suburban areas. Similar in appearance to golf carts, these vehicles have rechargeable batteries and are intended to reduce emissions from short local trips. Zoning codes can encourage NEV use by allowing smaller-than-standard parking spaces to count toward minimum parking requirements. The following ordinance from the City of San Clemente applies to NEVs in its North Beach Parking Overlay district.
10.3.2 San Clemente
Parking for Neighborhood Electric Vehicles (NEV), as defined in Vehicle Code Section 385.5, may be applied toward the total required parking at a maximum of 4% and not more than 8 spaces of the required number of parking spaces for a project through the approval of a Site Plan Permit. Additional NEV spaces can be provided however those spaces will not apply to the required parking. NEV spaces shall be located in areas of parking lots that cannot accommodate a standard parking space, unless the required number of standard spaces has been satisfied. (San Clemente Municipal Code)
Local jurisdictions can also allow a reduced number of required parking spaces in exchange for the installation of charging units. Business and property owners, developers, and local planners will have to consider the impact of reduced parking on tenants, customers, and the surrounding neighborhood. In jurisdictions that also require PEV-ready wiring for a minimum number of parking spaces in new construction, allowing the site host to install charging units in exchange for providing fewer parking spaces may reduce the overall number of PEV-ready spaces. While this may further encourage the installation of charging units in the short term, it may reduce the number of PEV-ready spaces in the longer term.
Ready, Set, Charge, California! suggests reducing required parking in downtown cores or job centers “where new housing developments could rely on both car-sharing programs and shared parking agreements with existing public or private parking facility owners for nighttime and weekend use.” PEV car-share parking could allow the developer or property owner to receive parking requirement reductions in exchange for providing charging on site (Ready, Set, Charge, California! A Guide to EV-Ready Communities 2011).
Chapter 11 provides guidance on requiring a minimum percentage of parking spaces in new construction to be made PEV-ready with appropriate conduit and/or wiring. Requiring existing
118 UCLA Luskin Center, December 2012DRAFT
parking areas to be retrofitted with PEV wiring and/or charging units could be costly. As noted in Ready, Set, Charge, California!, the State of Hawaii requires such retrofitting for large existing parking facilities. However, the state allows owners of multiple parking lots within a jurisdiction to meet the total number of required PEV spaces across their parking lots, even if one or more of the properties has fewer such spaces than would normally be required. Hawaii’s statute is excerpted below.
10.3.3 Hawaii
All public, private, and government parking facilities that are available for use by the general public and have at least one hundred parking spaces shall designate one per cent of parking spaces exclusively for electric vehicles by December 31, 2011, provided that at least one of the parking spaces designated for electric vehicles is located near the building entrance and is equipped with an electric vehicle charging unit. Spaces shall be designated, clearly marked, and the exclusive designation enforced. The electric vehicle charging units shall meet recognized standards, including SAE J1772 of the Society of Automotive Engineers. Owners of multiple parking lots within the State may designate and electrify fewer parking spaces than required in one or more of their owned properties as long as the scheduled requirement is met for the total number of aggregate spaces on all of their owned properties.
When the number of registered electric vehicles in the State reaches five thousand, the spaces designated for electric vehicles shall increase to two per cent of parking spaces. The number of spaces designated for electric vehicles shall continue to increase by one per cent for each additional five thousand electric vehicles registered in the State until the percentage reaches ten per cent of parking spaces.
For the purposes of this section, “electric vehicle” means an electric vehicle or neighborhood electric vehicle with an electric vehicle license plate. (Hawaii Revised Statutes)
10.4 Recommendations
The following recommendations are intended to facilitate PEV charging through zoning and parking policies. These recommendations are intended to be adapted to reflect local land use priorities for PEV charging and anticipated PEV demand, which may vary greatly among cities. Additional resources on building codes and parking policies are provided in Chapter 11 and Chapter 13 of this document. Local jurisdictions should consult the Southern California PEV Atlas that accompanies this document for local PEV demand projections.
1. Cities should allow charging as an accessory use that does not require more than a simple planning clearance, as long as charging is not the primary purpose of the site.
2. Installation of chargers should be allowed as an outright permitted or accessory use as appropriate in zones that present the most significant local opportunities for PEV charging.
119 DRAFT
3. Charging spaces designated for PEVs or NEVs should be able to meet the minimum parking requirements for business owners and developers. Planners should consider reducing parking requirements in exchange for the site host providing PEV charging spaces.
4. Cities should require a minimum percentage of parking spaces in new construction be PEV-ready based on current and anticipated PEV demand.
5. Zoning ordinances that allow charging as a permitted or accessory use should tailor any additional conditions of installation to the type of building specified in the ordinance. For example, it may not be necessary to require signage and protection against damage to the charging unit as a condition of permitting charging in single-family zones.
10.5 Additional resources
The Bay Area Climate Collaborative’s Ready, Set, Charge, California! A Guide to EV-Ready Communities (2011) provides sample zoning code and minimum parking requirement provisions for PEV charging.
http://www.baclimate.org/images/stories/actionareas/ev/guidelines/readysetcharge_evguidelines.pdf
• Section 2.2 (Community-wide programs, policies and incentives) • Section 3.2.1 (Sample zoning code provisions)
10.6 References
Hawaii Revised Statutes. Part IV, Chapter 291-71. http://www.capitol.hawaii.gov/hrscurrent/Vol05_Ch0261-0319/HRS0291/HRS_0291-0071.htm.
Lancaster Municipal Code. Section 17.08.050. http://library.municode.com/HTML/16042/level3/TIT17ZO_CH17.08REZO_ARTIINOURMEHIDEREZO.html#TIT17ZO_CH17.08REZO_ARTIINOURMEHIDEREZO_17.08.050ACTEUS.
———. Section 17.12.050. http://library.municode.com/HTML/16042/level3/TIT17ZO_CH17.12COZO_ARTIIGECOCZO.html#TIT17ZO_CH17.12COZO_ARTIIGECOCZO_17.12.050ACUS.
Ready, Set, Charge, California! A Guide to EV-Ready Communities. 2011. http://www.baclimate.org/images/stories/actionareas/ev/readysetcharge_evguidelines.pdf.
San Clemente Municipal Code. Section 17.56.080. http://library.municode.com/HTML/16606/level2/TIT17ZO_CH17.56OVDIST.html#TIT17ZO_CH17.56OVDIST_17.56.080NOBEPAOVP.

120 UCLA Luskin Center, December 2012DRAFT
San Jacinto Development Code. 2012. Errata Sheet, Item A-4. http://sanjacintoca.us/sirepub/cache/2/ij2om0ersj3anlvmh2rcyo55/3746110182012113208313.PDF.
121 Building Codes for PEV Readiness DRAFT
11 Building Codes for PEV Readiness
11.1 Introduction
Cities can use building codes to advance PEV adoption in a way that ensures safe, cost-effective installation of charging equipment. By updating building codes to require PEV-ready wiring in new construction, cities can help meet future demand for charging and reduce or eliminate the costs associated with later retrofitting. In addition to these benefits, PEV building readiness codes advance equity by ensuring access to charging for multi-family building residents and the disabled. Building codes related to PEVs can also provide guidance on a number of issues including (California Plug-in Electric Vehicle Collaborative 2012; Advanced Energy 2011):
• The number of circuits needed and service panel requirements • Placement of electric meters • Sourcing of electricity for on-street and lot parking • The impact of charging infrastructure on building electrical loads and local electrical
distribution • Allocation and sizing of parking spaces to accommodate charging infrastructure • Compliance with the Americans with Disabilities Act (ADA)
About two-thirds of local government agencies and utilities surveyed by the California Plug-in Electric Vehicle Collaborative have not adopted building code requirements for EVSE installations (California Plug-in Electric Vehicle Collaborative 2012). Of those that do have building code requirements for EVSE installations, 92% do not have unique code requirements for new construction in addition to requirements for pre-existing buildings.33
Codes provide construction standards according to building uses. These uses can be classified as residential or non-residential. Residential buildings are often classified into two categories: one- or two-family homes and townhouses, and multi-family (also called multi-unit) dwellings. Non-
33 California Plug-in Electric Vehicle Readiness Survey results reported as of September 4, 2012. Response rates to these questions ranged from 29–37%.
122 UCLA Luskin Center, December 2012DRAFT
residential buildings can include business, industrial, institutional and mercantile (retail) uses. The types of building codes a city will need to prepare for PEV infrastructure will depend in part on the kinds of land uses and occupancies that are most commonly found in that city.
A building code’s applicability generally falls along a continuum of scope and cost-effectiveness. The continuum ranges from new construction (the narrowest scope and the most cost-effective), to remodels involving a certain percentage of a structure, and finally to retrofits (the widest scope and potentially most costly, because it applies to existing buildings as well as new construction).
Planning for PEVs is an inherently uncertain exercise. The number of PEVs on the road in the future, their battery sizes and charging requirements, and the timeframe in which they will become more ubiquitous is difficult to predict with certainty. Vehicle and charging technology will evolve more quickly than the average lifespan of a building. What follows is a discussion of California’s voluntary building code governing electric vehicle charging infrastructure and some examples of how cities have tailored this standard or strengthened it at the local level.
11.2 CALGreen
California’s green building code provides guidance on voluntary measures municipalities can adopt if they want to require PEV charging readiness in newly-constructed buildings. A limitation of CALGreen is that its residential measures only apply to low-rise residential buildings of three stories or fewer. The California Department of Housing and Community Development has proposed extending CALGreen’s provisions to cover high-rise as well as low-rise residential construction beginning in 2014. (California Department of Housing and Community Development 2012). Cities can adopt the measures in CALGreen or adapt them to reflect local priorities. For example, the City of Santa Monica has adopted the measures in CALGreen and has redefined “low-rise residential” to mean buildings of six stories or less (Santa Monica Municipal Code 2010).
For one- and two-family dwellings, the code calls for installation of a raceway34 to accommodate a dedicated branch circuit. For multifamily residential dwellings of three stories or less, CALGreen also calls for a minimum number of parking spaces to be capable of supporting PEV charging. The CALGreen code language is excerpted below (California Building Standards Commission 2012 Supplement):
• A4.106.6.1 One-and two-family dwellings. Install a listed raceway to accommodate a dedicated branch circuit. The raceway shall not be less than trade size 1. The raceway shall be securely fastened at the main service or subpanel and shall terminate in close proximity to the proposed location of the charging system into a listed cabinet, box or
34 The term “raceway” is sometimes used interchangeably with “conduit.” A raceway is a channel, often a rectangular wall-mounted tubular casing, designed expressly for holding wires or cables and protecting them from damage.(Davis 1998-2012)
123 Building Codes for PEV Readiness DRAFT
enclosure. Raceways are required to be continuous at enclosed or concealed areas and spaces. A raceway may terminate in an attic or other approved location when it can be demonstrated that the area is accessible and no removal of materials is necessary to complete the final installation.
• A4.106.6.2 Multifamily dwellings. At least 3 percent of the total parking spaces, but not less than one, shall be capable of supporting future electric vehicle supply equipment (EVSE).35
o A4.106.6.2.1 Single charging space required. When only a single charging space is required, install a listed raceway capable of accommodating a dedicated branch circuit. The raceway shall not be less than trade size 1. The raceway shall be securely fastened at the main service or subpanel and shall terminate in close proximity to the proposed location of the charging system into a listed cabinet, box or enclosure.
o A4.106.6.2.2 Multiple charging spaces required. When multiple charging spaces are required, plans shall include the location(s) and type of the EVSE, raceway method(s), wiring schematics and electrical calculations to verify that the electrical system has sufficient capacity to simultaneously charge all the electrical vehicles at all designated EV charging spaces at their full rated amperage. Plan design shall be based upon Level 236 EVSE at its maximum operating ampacity. Only underground raceways and related underground equipment are required to be installed at the time of construction.
CALGreen also offers municipalities a voluntary standard for PEV charging at commercial, retail and other non-residential locations, as excerpted here (California Building Standards Commission 2012 Supplement):
• A5.106.5.3 Electric vehicle charging. Provide facilities meeting Section 406.7 (Electric Vehicle) of the California Building Code and as follows:
o A5.106.5.3.1 Electric vehicle supply wiring. For each space required in Table A5.106.5.3.1, provide panel capacity and dedicated conduit for one 208/240V 40 amp circuit terminating within 5 feet of the midline of each parking space.
35 Electric vehicle supply equipment may refer to charging stations, cords, or building wiring intended to power electric vehicles. The California Electrical Code defines EVSE as “conductors…and the electric vehicle connectors, attachment plugs, and all other fittings, devices, power outlets, or apparatus installed specifically for the purpose of delivering energy from the premises wiring to the electric vehicle.”36 Charging levels refer to the voltage provided by charging unit. The higher the voltage, the more quickly a battery can be powered. Level 1 charging uses 120 volts to provide at least 12 amperes of current and 1.44-1.92 kilowatts of power. Level 1 charging is available through a standard household outlet. Level 2 charging uses 240 volts (or 208 volts in commercial locations) to provide up to 80 amperes of current and 19.2 kilowatts of power for battery use (U.S. Department of Energy 2012). Typical amperages for Level 2 current range from 15-40A. See Chap-ter 3 for a more detailed description of charging levels.
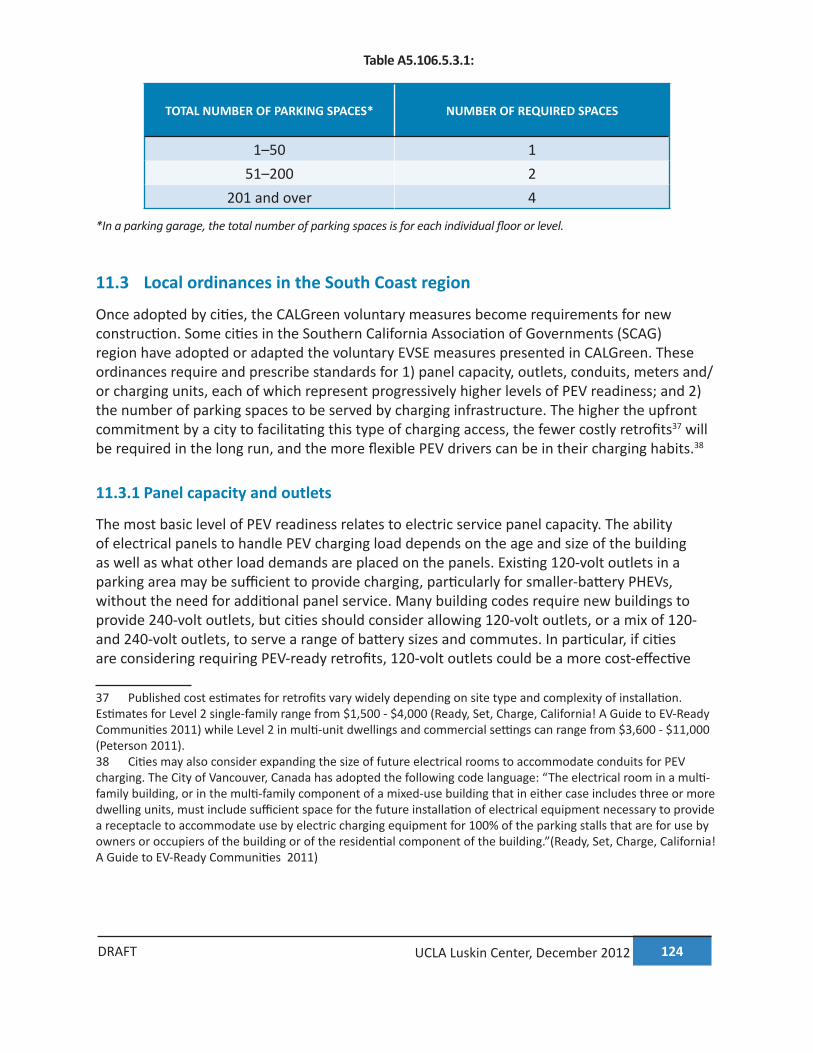
124 UCLA Luskin Center, December 2012DRAFT
Table A5.106.5.3.1:
TOTAL NUMBER OF PARKING SPACES* NUMBER OF REQUIRED SPACES
1–50 151–200 2
201 and over 4
*In a parking garage, the total number of parking spaces is for each individual floor or level.
11.3 Local ordinances in the South Coast region
Once adopted by cities, the CALGreen voluntary measures become requirements for new construction. Some cities in the Southern California Association of Governments (SCAG) region have adopted or adapted the voluntary EVSE measures presented in CALGreen. These ordinances require and prescribe standards for 1) panel capacity, outlets, conduits, meters and/or charging units, each of which represent progressively higher levels of PEV readiness; and 2) the number of parking spaces to be served by charging infrastructure. The higher the upfront commitment by a city to facilitating this type of charging access, the fewer costly retrofits37 will be required in the long run, and the more flexible PEV drivers can be in their charging habits.38
11.3.1 Panel capacity and outlets
The most basic level of PEV readiness relates to electric service panel capacity. The ability of electrical panels to handle PEV charging load depends on the age and size of the building as well as what other load demands are placed on the panels. Existing 120-volt outlets in a parking area may be sufficient to provide charging, particularly for smaller-battery PHEVs, without the need for additional panel service. Many building codes require new buildings to provide 240-volt outlets, but cities should consider allowing 120-volt outlets, or a mix of 120- and 240-volt outlets, to serve a range of battery sizes and commutes. In particular, if cities are considering requiring PEV-ready retrofits, 120-volt outlets could be a more cost-effective
37 Published cost estimates for retrofits vary widely depending on site type and complexity of installation. Estimates for Level 2 single-family range from $1,500 - $4,000 (Ready, Set, Charge, California! A Guide to EV-Ready Communities 2011) while Level 2 in multi-unit dwellings and commercial settings can range from $3,600 - $11,000 (Peterson 2011). 38 Cities may also consider expanding the size of future electrical rooms to accommodate conduits for PEV charging. The City of Vancouver, Canada has adopted the following code language: “The electrical room in a multi-family building, or in the multi-family component of a mixed-use building that in either case includes three or more dwelling units, must include sufficient space for the future installation of electrical equipment necessary to provide a receptacle to accommodate use by electric charging equipment for 100% of the parking stalls that are for use by owners or occupiers of the building or of the residential component of the building.”(Ready, Set, Charge, California! A Guide to EV-Ready Communities 2011)
125 Building Codes for PEV Readiness DRAFT
option. Incorporating more opportunities for 120-volt charging would also reduce the need for special 240-volt charging units, since 120-volt outlets can be used with the cords that currently come with PEVs. The lower voltage would allow for more outlets to be installed using the same amount of power (Balmin, Bonett, and Kirkeby 2012).
Alternatively, property owners can evaluate whether lower-cost charging can be provided through multiplex or multi-arm stations that can charge more than one car simultaneously, or in a programmed queue. While such solutions may present a higher upfront cost, the unit cost per driver is much lower.
The need to upgrade electrical panels in existing buildings may be reduced by the use of energy management software, which can balance the additional load brought by PEV charging. The National Electrical Code required electrical capacity for charging equipment to reflect the full load charging capability of the equipment, plus an additional 25% capacity buffer, in order to prevent circuit overload (National Fire Protection Association 2011). However, a tentative interim amendment to the code allows the maximum electric vehicle supply equipment load on a service panel or feeder to reflect the maximum load permitted by an automatic load management system (National Fire Protection Association 2011). Cities should consider updating local electrical codes to allow this potentially lower-cost alternative to adding capacity.
New construction provides an opportunity to examine the building’s total projected load from PEVs and other sources and to offset this load with energy efficiency upgrades. Panel capacity can also be made available for PEVs by installing energy-efficient lighting and HVAC systems. A qualified electrical contractor should be retained to assess sites and calculate electrical loads, particularly for more complex installations that serve multiple vehicles in MUDs or commercial buildings. (Biddick et al. 2012; California Plug-in Electric Vehicle Collaborative 2012; Ready, Set, Charge, California! A Guide to EV-Ready Communities 2011)
11.3.2 Conduits and meters
The laying of conduit capable of carrying future wires or cables from the electrical room to the charging unit represents the next step in PEV building readiness. Codes requiring 120-volt outlets into which PEVs can plug in directly, or 240-volt outlets to connect Level 2 chargers to wiring and conduits, will bring buildings even closer to PEV readiness. Providing space in the electrical room for additional future meters will help multi-unit dwellers can take advantage of special utility rates for PEV charging. However, requiring additional meters at single-family homes can have unintended consequences, as they may enable conversion of properties to unapproved multi-family rentals or home businesses. Utilities are exploring the use of software that allows sub-metering of PEV charging on one meter.
11.3.3 Charging units
The City of Lancaster’s code is notable in that it requires not only PEV-ready wiring in new construction, but even requires the installation of some ready-to-use charge stations. Cities may
126 UCLA Luskin Center, December 2012DRAFT
wish to consider whether to require ready-to-use charge stations, when to require them, or how many to require. In doing so, they should strive to minimize cost and ensure that stations are not underused. They should consider evolving technology as well as current demand (see the Southern California PEV Atlas that accompanies this document for COG-level PEV projections).
Excerpted below are local building codes from the SCAG region that are mostly related to PEV readiness in wiring and parking space allocation. Los Angeles’ code requires PEV-ready wiring for new single- and multifamily buildings and charging capacity for at least 5% of parking spaces (for multifamily buildings). Rolling Hills Estates’ EVSE requirement nominally applies to all new residential units, but in practice was intended for single-family homes and townhouses with attached garages. The city of Temecula’s ordinance is also intended for PEV conduits in single-family homes. Other considerations that may relate to building codes, such as PEV parking space design, signage, and ADA compliance, are reviewed in other chapters of this document.
11.3.4 Beverly Hills
Provide facilities meeting section 406.7 (Electric Vehicle) of the California building code and as follows:
One 120 VAC 20 amp and one 208/240V 40 amp, grounded AC outlets or panel capacity for one 120 VAC 20 amp and one 208/240V 40 amp, grounded AC outlet and conduit installed for future outlets for each dwelling unit. Electric vehicle supply shall be provided and may be installed in a stall provided to comply with the code minimum parking requirements. Dwelling unit shall be defined by the California building code.
Exception: Apartment buildings and apartment units. (Beverly Hills Municipal Code 2011)
11.3.5 Lancaster
New residential development shall provide for EVCS in the manner prescribed as follows:
1. Garages serving each new single-family residence and each unit of a duplex shall be constructed with a gang box39 (4 inches by 4 inches) connected to a conduit linking the garage to the electrical service, in a manner approved by the building and safety official, to allow for the future installation of electric vehicle supply equipment to provide an EVCS for use by the resident.
2. In new multiple-family projects of 10 dwelling units or less, 20% of the total parking spaces required (all of the 20% shall be located within the required covered parking) shall be provided with a gang box (4 inches by 4 inches) connected to a conduit linking the covered parking spaces or garages with the electrical service, in a manner approved by the building and safety official, to allow for the future installation of electric vehicle supply equipment to provide EVCSs at such time as it is needed for use by residents.
39 The term “gang box” also refers to an electrical box, which “enclose(s) wire connections for applications such as a light switch, electrical outlet or light fixture” (The Home Depot).

127 Building Codes for PEV Readiness DRAFT
EVCSs shall be provided in disabled person parking spaces in accordance with state requirements.
3. In new multiple-family projects of more than 10 dwelling units, 10% of the total parking spaces required (all of the 10% shall be located within the required covered parking) shall be provided with a gang box (4 inches by 4 inches) connected to a conduit linking the covered parking spaces or garages with the electrical service, in a manner approved by the building and safety official. Of the total gang boxes provided, 50% shall have the necessary electric vehicle supply equipment installed to provide active EVCSs ready for use by residents. The remainder shall be installed at such time as they are needed for use by residents. EVCSs shall be provided in disabled person parking spaces in accordance with state requirements. (Lancaster Municipal Code)
New commercial development shall provide for electric vehicle charging stations in the manner prescribed as follows:
a) New residential uses shall provide EVCSs in accordance with Section 17.08.150T.
b) New commercial, industrial, and other uses with the building or land area, capacity, or numbers of employees listed herein shall provide the electrical service capacity necessary and all conduits and related equipment necessary to ultimately serve 2% of the total parking spaces with EVCSs in a manner approved by the building and safety official. Of these parking spaces, 1/2 shall initially be provided with the electric vehicle supply equipment necessary to function as on-line EVCSs upon completion of the project. The remainder shall be installed at such time as they are needed for use by customers, employees or other users. EVCSs shall be provided in disabled person parking spaces in accordance with state requirements.
1. Construction of a hospital of 500 or more beds, or expansion of a hospital of that size by 20% or more.
2. Construction of a post-secondary school (college), public or private, for 3,000 or more students, or expansion of an existing facility having a capacity of 3,000 or more students by an addition of at least 20%.
3. Hotels or motels with 500 or more rooms.
4. Industrial, manufacturing, or processing plants or industrial parks that employ more than 1,000 persons, occupy more than 40 acres of land, or contain more than 650,000 square feet of gross floor area.
5. Office buildings or office parks that employ more than 1,000 persons or contain more than 250,000 square feet of gross floor area.
6. Shopping centers or trade centers that employ 1,000 or more persons or contain 500,000 square feet of gross floor area.
128 UCLA Luskin Center, December 2012DRAFT
7. Sports, entertainment, or recreation facilities that accommodate at least 4,000 persons per performance or that contain 1,500 or more fixed seats.
8. Transit projects (including but not limited to transit stations and park and ride lots). (Lancaster Municipal Code)
11.3.6 City of Los Angeles
1. For one- or two- family dwellings and townhouses, provide a minimum of:
a) One 208/240 V 40 amp, grounded AC outlet, for each dwelling unit or
b) Panel capacity and conduit for the future installation of a 208/240 V 40 amp, grounded AC outlet, for each dwelling unit.
The electrical outlet or conduit termination shall be located adjacent to the parking area.
2. For other residential occupancies where there is a common parking area, provide one of the following:
a) A minimum number of 208/240 V 40 amp, grounded AC outlets equal to 5 percent of the total number of parking spaces. The outlets shall be located within the parking area or
b) Panel capacity and conduit for future installation of electrical outlets. The panel capacity and conduit size shall be designed to accommodate the future installation, and allow the simultaneous charging, of a minimum number of 208/240 V 40 amp, grounded AC outlets, that is equal to 5 percent of the total number of parking spaces. The conduit shall terminate within the parking area; or
c) Additional service capacity, space for future meters, and conduit for future installation of electrical outlets. The service capacity and conduit size shall be designed to accommodate the future installation, and allow the simultaneous charging, of a minimum number of 208/240 V 40 amp, grounded AC outlets, that is equal to 5 percent of the total number of parking spaces. The conduit shall terminate within the parking area.
When the application of the 5 percent results in a fractional space, round up to the next whole number. (Los Angeles Municipal Code 2010)
11.3.7 Rolling Hills Estates
Any new residential construction, including an addition to a residential structure of greater than fifty percent of the existing floor area, including the primary garage, and/or any demolition of greater than fifty percent of the lineal walls of a residential structure within a twelve-month period, shall require the installation of a two hundred twenty volt dedicated electrical outlet in
129 Building Codes for PEV Readiness DRAFT
the garage for the purposes of charging an electric vehicle. (Rolling Hills Estates Municipal Code)
11.3.8 Temecula
Circuits for electric vehicle charging stations shall meet all the requirements of California Electrical Code Article 62540. Residential garages shall have a minimum three quarter (3/4) inch metal flex conduit ran from meter box to the garage fire wall and terminated in a metal box at forty-two (42) inches above finished floor for future electric vehicle charging station. (Temecula Municipal Code)
11.3.9 Torrance (proposed) • That all new residential units shall be equipped with the required electrical conduit to
accommodate at least one Level 2 electric vehicle charging capability within designated parking areas for said unit(s). [Community Development Department staff requested that the Planning Commission also consider the CALGreen 3% requirement to avoid new findings, public noticing and additional local amendment proceedings].
Residential parking development standards: • Charging units located with residentially developed properties must either be provided
within an enclosed structure, affixed to a permitted structure or located adjacent to a required parking space, provided exterior charging units do not encroach into any required setback by more than 12 inches.
Commercial industrial parking regulations: • an EV parking space requirement for new construction or properties significantly
remodeled…and which provide 50 or more parking spaces, shall be required to provide and maintain at least 2% of available parking spaces as electric vehicle parking spaces equipped with either Level 2 or [higher] charging infrastructure.
• Required signage specifications for electric vehicle parking spaces, to clearly mark spaces as electric vehicle parking, contact information for charging station (Community Development Department Recommendations to the Torrance Planning Commission, June 6, 2012, Agenda Item No. 15A, Case No. LUS12-00001).
11.4 Conclusion
The building codes we present in this chapter reflect early attempts to support PEV readiness. The steps taken by these municipalities to date reflect the impracticality, due to cost recovery
40 For the model California Electrical Code language on PEV charging, see http://rrdocs.nfpa.org/rrserver/browser?title=/NFPACA/CaliforniaElectricalCode2010
130 UCLA Luskin Center, December 2012DRAFT
and implementation issues, of mandating charging equipment installation in existing residential buildings. These codes will need to evolve over time and adapt to market conditions.
11.5 Recommendations
The following recommendations are intended to facilitate PEV charging through building codes. These recommendations should be adapted to reflect local land use opportunities for PEV charging and anticipated PEV demand, which may vary greatly among cities. Guidance on assessing local land use opportunities is provided in Chapter 4, Chapter 5, Chapter 6, Chapter 7, and Chapter 8. Additional resources on zoning and parking policies are provided in Chapter 10 and Chapter 13 of this document. Local jurisdictions should consult the Southern California PEV Atlas that accompanies this document for local PEV demand projections and maps of employment and commercial density.
1. Consider expanding the range of new buildings to which PEV readiness codes apply beyond CalGreen’s low-rise designation.
2. Allow Level 1 or Level 2 charging capability to satisfy PEV readiness requirements in building codes.
3. Require the laying of conduit capable of carrying future wires or cables from the electrical room to the charging unit in new construction.
4. Consider present PEV charging demand in determining whether to require installation of ready-to-use charging stations in addition to PEV-ready wiring for new single and multi-unit dwellings.
5. Require a certain minimum percentage of parking spaces in new construction be wired to be PEV-ready for single-family homes or MUDs, if these land uses present significant opportunities locally.
6. Require a certain minimum percentage of parking spaces in new construction be wired to be PEV-ready in commercial or industrial buildings, if these opportunities represent significant opportunities locally.
7. Consider updating electrical codes to allow the sizing of electrical service to charging systems to reflect the load permitted by an automated energy management system.
11.6 Additional resources
There are many resources available for planners seeking detailed implementation guidance for PEV-ready buildings, including:
131 Building Codes for PEV Readiness DRAFT
Ready, Set, Charge, California! A Guide to EV-Ready Communities (2011). http://www.baclimate.org/images/stories/actionareas/ev/guidelines/readysetcharge_evguidelines.pdf
• Section 3.5 (Building and Electrical Code Guidance) • Section 3.6 (Signage) • Section 5.3 (Electrical Requirements)
Building codes specify whether pre-wiring or installation of electric vehicle supply equipment (EVSE) is required for new construction or existing buildings. If cities decide to require EVSE readiness, they should do so in compliance with the standards specified in the California Electrical Code.
California Electrical Code (2010). http://rrdocs.nfpa.org/rrserver/browser?title=/NFPACA/CaliforniaElectricalCode2010
• Article 625, Electric Vehicle Charging System • Article 626, Electrified Truck Parking Spaces
11.7 References
Advanced Energy. 2011. Community Planning Guide for Plug-In Electric Vehicles. http://www.advancedenergy.org/transportation/resources/Community%20Planning%20Guide.pdf.
Balmin, Judith, Greg Bonett, and Megan Kirkeby. 2012. Increasing Electric Vehicle Charging Access in Multi-Unit Dwellings in Los Angeles. http://luskin.ucla.edu/sites/default/files/EV%20Charging%20in%20LA%20MUDs.pdf.
Beverly Hills Municipal Code. 2011. Amendments to the California Green Building Code, Section 9-1-1102. http://www.sterlingcodifiers.com/codebook/getBookData.php?section_id=706047.
Biddick, Geoff, Fabien Heitz, Mohit Khanna, Terang Kim, Allison Silvers, and Nicholas Zheng. 2012. Electric Vehicle Charging Infrastructure Installation in Multi-Unit Dwellings. UCLA Anderson School of Management; UCLA Luskin Center for Innovation.
California Building Standards Commission. 2012 Supplement. 2010 California Green Building Standards Code. California Code of Regulations, http://www.iccsafe.org/cs/codes/Errata/State/CA/5570S1002.pdf.
California Department of Housing and Community Development. 2012. Express Terms for Proposed Building Standards of the Department of Housing and Community Development Regarding the 2013 California Green Building Standards Code (CALGreen), California Code of Regulations, Title 24, Part 11. http://www.documents.dgs.ca.gov/bsc/prpsd_chngs/2012/2nd-45Day/HCD-04-12-PT11/HCD-04-12-ET-Pt11-45Day.PDF.
132 UCLA Luskin Center, December 2012DRAFT
California Plug-in Electric Vehicle Collaborative. 2012. A Community Toolkit for Plug-in Electric Vehicle Readiness: A Resource for Local Officials. http://www.evcollaborative.org/sites/all/themes/pev/files/PEV_readiness_toolkit_v1.pdf.
———. 2012. California Plug-in Electric Vehicle Readiness Survey. http://www.surveymonkey.com/sr.aspx?sm=liSrdDLXrgyjR80UILTSJBOLy5ylb3zy2cFXwK3AmaE_3d.
Community Development Department Recommendations to the Torrance Planning Commission, June 6, 2012, Agenda Item No. 15A, Case No. LUS12-00001.
Davis, Leroy. Electronic Engineering Dictionary 1998-2012 [cited September 14, 2012]. Available from http://www.interfacebus.com/Glossary-of-Terms_R.html.
Lancaster Municipal Code. Section 17.08.150. http://library.municode.com/HTML/16042/level3/TIT17ZO_CH17.08REZO_ARTIINOURMEHIDEREZO.html#TIT17ZO_CH17.08REZO_ARTIINOURMEHIDEREZO_17.08.150DEPEST.
———. Section 17.12.230. http://library.municode.com/HTML/16042/level3/TIT17ZO_CH17.12COZO_ARTIIGECOCZO.html#TIT17ZO_CH17.12COZO_ARTIIGECOCZO_17.12.230DERE.
Los Angeles Municipal Code. 2010. Mandatory Measures for Newly Constructed Low-Rise Residential Buildings, Section 99.04.106.6. http://www.amlegal.com/nxt/gateway.dll?f=templates&fn=default.htm&vid=amlegal:lamc_ca.
National Fire Protection Association. 2011. National Electrical Code Tentative Interim Amendment 11-3. http://www.nfpa.org/Assets/files/AboutTheCodes/70/TIA70-11-3.pdf.
———. 2011. NFPA 70-2011, National Electrical Code Tentative Interim Amendment Log No. 1038. http://www.nfpa.org/Assets/files/AboutTheCodes/70/ProposedTIA1038_NFPA70.pdf.
Peterson, David. 2011. Addressing Challenges to Electric Vehicle Charging in Multifamily Residential Buildings. http://luskin.ucla.edu/sites/default/files/EV_Multifamily_Report_10_2011.pdf.
Ready, Set, Charge, California! A Guide to EV-Ready Communities. 2011. http://www.rmi.org/Content/Files/Readysetcharge.pdf.
Rolling Hills Estates Municipal Code. 2011. Section 15.04.090. http://library.municode.com/HTML/16587/level2/TIT15BUCO_CH15.04BUCO.html#TIT15BUCO_CH15.04BUCO_15.04.090MIBUCORE.
Santa Monica Municipal Code. 2010. Section 8.106.040. http://www.qcode.us/codes/santamonica/view.php?topic=8-8_106-8_106_040&frames=off.
Temecula Municipal Code. 2010. Section 15.04.040B. http://qcode.us/codes/temecula/.

133 Building Codes for PEV Readiness DRAFT
The Home Depot. Buying Guide: Electrical Boxes. http://www.homedepot.com/webapp/catalog/servlet/ContentView?pn=Boxes_Covers_Fittings&storeId=10051&langId=-1&catalogId=10053.
U.S. Department of Energy. 2012. Plug-In Electric Vehicle Handbook for Public Charging Station Hosts. (DOE/GO-102012-3275), http://www.afdc.energy.gov/pdfs/51227.pdf.
134 UCLA Luskin Center, December 2012DRAFT
12 Permits and Inspections for PEV Readiness
12.1 Introduction
Local jurisdictions are instrumental in reducing the cost, time and uncertainty associated with installing PEV charging equipment. The first opportunity to encourage charging is through the permitting and inspection process, as these are typically the first steps initiated by drivers after buying a PEV and by site hosts that want to install charging systems. The permitting and inspection process allows local jurisdictions to make sure that charging systems are installed safely and that service panels can handle PEV loads. Utilities also want to ensure that the combined load from multiple high-voltage chargers in the same neighborhood will not overload transformers and disrupt service (City of Riverside Building and Safety Division 2012). By streamlining the permitting and inspection process, cities can facilitate access to a variety of refueling opportunities—particularly at home, where PEV buyers will need to be able to charge soon after buying the vehicle.
Cities vary greatly in their demand for PEV charging. Some cities have already made significant progress in streamlining the permitting and inspection process based on existing demand. The recommendations referenced in this document seek to minimize redundant or unnecessary levels of review and notification wherever possible, as each level of complexity increases the time and cost of charging installation (California Plug-in Electric Vehicle Collaborative 2012). A streamlined permitting and inspection process can reduce the overall cost of installation; clearly communicate procedures to city staff, electrical contractors, drivers and/or charge station hosts; and encourage compliance with safe permitting and installation procedures (California Plug-in Electric Vehicle Collaborative 2012). Jurisdictions should take advantage of the opportunity to troubleshoot the streamlining process while their caseloads of charging permits and inspections are still relatively low (Advanced Energy 2011).
Permit and inspection streamlining for PEVs requires a coordinated effort between multiple stakeholders. In addition to the driver or site owner, these include electricians who perform the charging installation; the local jurisdiction, which issues building permits and conducts inspections; and the local utility, which approves and installs dedicated meters that allow
135 Permits and Inspections for PEV Readiness DRAFT
customers to take advantage of lower electricity rates for PEV charging (California Plug-in Electric Vehicle Collaborative 2012).
Permit and inspection streamlining should also include educating drivers about how to evaluate their charging needs and options before applying for charging equipment permits. Many PEV drivers with short commutes or small PEV batteries may be able to satisfy their charging needs with an existing Level 1 (120-volt) household outlet. If the driver wishes to use an existing 120-volt outlet, the only equipment he or she may want to install is a dedicated electricity meter. Alternatively, drivers may be able to avoid a panel upgrade for Level 2 charging by using an unused 240-volt dryer circuit in the garage, or by switching to a gas dryer to free up the 240-volt circuit for the charging system (Ready, Set, Charge, California! A Guide to EV-Ready Communities 2011). Informing PEV drivers in this way about their charging options can help avoid additional permit applications and inspection requests.
The following sections review the installation process and recommendations for streamlining permits and inspections. We then present examples from the SCAG region of streamlining efforts by local jurisdictions.
12.2 The Installation Process
As Figure 12.1 illustrates, the process for permitting, installing and inspecting a home charging unit can involve multiple trips by the electrician, inspector and utility. Each visit to the charging site and to the permit counter adds time and cost to the installation. Lengthy inspection windows and code compliance reviews, as well as confusion by inspectors over how to apply existing electrical codes, further delay completion of the installation. While the diagram below illustrates the process for residential installation, the same basic process would hold for owners of workplace or retail charge sites, although the possible trenching and other site work involved could add more time, complexity and cost.
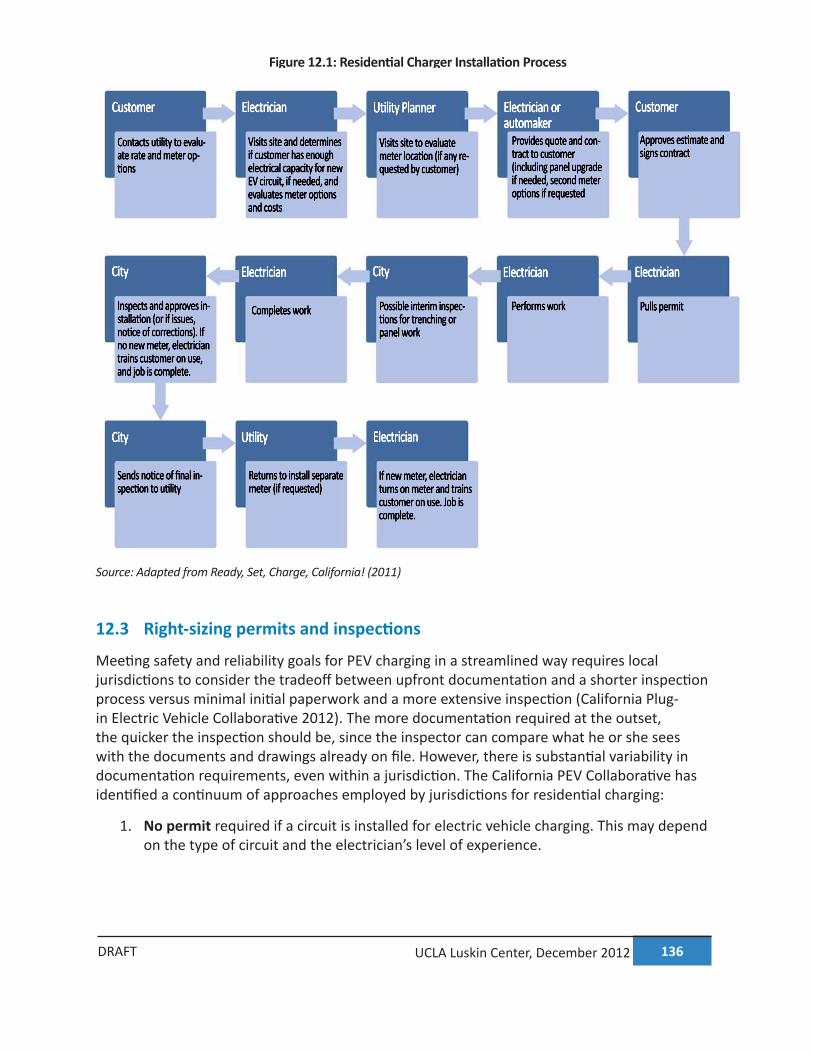
136 UCLA Luskin Center, December 2012DRAFT
Figure 12.1: Residential Charger Installation Process
Customer
Contacts utility to evalu-ate rate and meter op-tions
Provides quote and con-tract to customer (including panel upgrade if needed, second meter options if requested
Approves estimate and signs contract
Pulls permitPerforms workPossible interim inspec-tions for trenching or panel work
Completes workInspects and approves in-stallation (or if issues, notice of corrections). If no new meter, electrician trains customer on use, and job is complete.
Sends notice of final in-spection to utility
Returns to install separate meter (if requested)
If new meter, electrician turns on meter and trains customer on use. Job is complete.
Visits site to evaluate meter location (if any re-quested by customer)
Electrician
Electrician
Visits site and determines if customer has enough electrical capacity for new EV circuit, if needed, and evaluates meter options and costs
Utility
City Electrician City Electrician Electrician
Electrician or automaker
CustomerUtility Planner
City
Source: Adapted from Ready, Set, Charge, California! (2011)
12.3 Right-sizing permits and inspections
Meeting safety and reliability goals for PEV charging in a streamlined way requires local jurisdictions to consider the tradeoff between upfront documentation and a shorter inspection process versus minimal initial paperwork and a more extensive inspection (California Plug-in Electric Vehicle Collaborative 2012). The more documentation required at the outset, the quicker the inspection should be, since the inspector can compare what he or she sees with the documents and drawings already on file. However, there is substantial variability in documentation requirements, even within a jurisdiction. The California PEV Collaborative has identified a continuum of approaches employed by jurisdictions for residential charging:
1. No permit required if a circuit is installed for electric vehicle charging. This may depend on the type of circuit and the electrician’s level of experience.
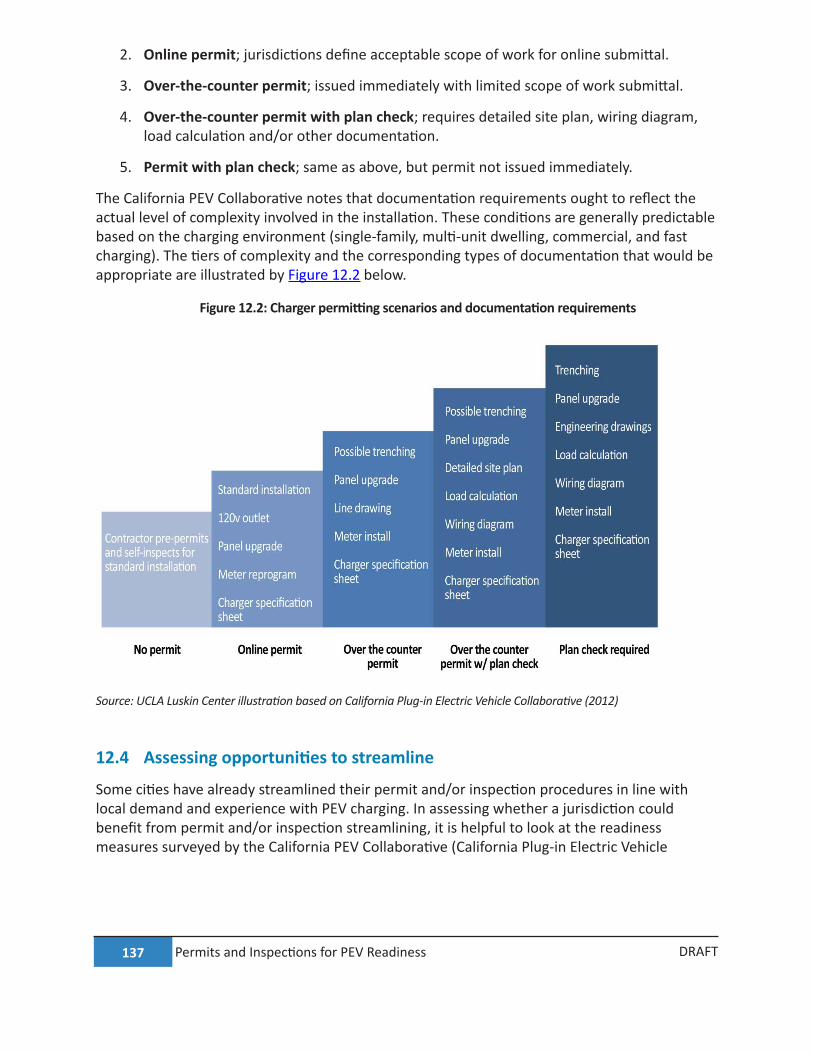
137 Permits and Inspections for PEV Readiness DRAFT
2. Online permit; jurisdictions define acceptable scope of work for online submittal.
3. Over-the-counter permit; issued immediately with limited scope of work submittal.
4. Over-the-counter permit with plan check; requires detailed site plan, wiring diagram, load calculation and/or other documentation.
5. Permit with plan check; same as above, but permit not issued immediately.
The California PEV Collaborative notes that documentation requirements ought to reflect the actual level of complexity involved in the installation. These conditions are generally predictable based on the charging environment (single-family, multi-unit dwelling, commercial, and fast charging). The tiers of complexity and the corresponding types of documentation that would be appropriate are illustrated by Figure 12.2 below.
Figure 12.2: Charger permitting scenarios and documentation requirements
Source: UCLA Luskin Center illustration based on California Plug-in Electric Vehicle Collaborative (2012)
12.4 Assessing opportunities to streamline
Some cities have already streamlined their permit and/or inspection procedures in line with local demand and experience with PEV charging. In assessing whether a jurisdiction could benefit from permit and/or inspection streamlining, it is helpful to look at the readiness measures surveyed by the California PEV Collaborative (California Plug-in Electric Vehicle
138 UCLA Luskin Center, December 2012DRAFT
Collaborative 2012). The organization’s statewide survey of local jurisdictions and utilities focused on possible areas for improvement, including:
• The number and type of permits needed for a charger installation (building only, electrical only, both building and electrical, and/or planning entitlement)
• Whether additional permits are required for trenching and compliance with the Americans with Disabilities Act
• The number of business days between permit request and issuance, and between inspection request and inspection
• Whether inspectors have a checklist for charging installations
These areas exemplify the key principles of reducing the time and cost of permitting and inspections. The following section largely reproduces and summarizes recommendations presented by the California PEV Collaborative’s Streamlining the Permitting and Inspection Process for Plug-in Electric Vehicle Home Charger Installations (2012) and the Bay Area Climate Collaborative’s Ready, Set, Charge, California! (2011).
12.5 Recommendations
These recommendations apply mainly to single-family residential permits, though every effort should be made to streamline the process for more complicated installations. Please see Chapter 6 for additional recommendations for multi-unit dwellings and Chapter 7 for recommendations for enabling workplace charging.
1. Establish a unique charging equipment permit. Even if it is equivalent to the permit for a 240-volt circuit installation, identifying a distinct permit for electric vehicle charging will communicate the requirements clearly. See examples from the City of Irvine http://www.cityofirvine.org/civica/filebank/blobdload.asp?BlobID=17661 and the Department of Energy http://www.afdc.energy.gov/pdfs/EV_charging_template.pdf.
2. Make available online or over-the-counter permitting for most installations. If feasible, applicants should also be able to check the status of their permits and schedule inspections online. Reducing the need for multiple visits to the permitting counter can reduce costs. A simple scope of work and equipment specification sheet should suffice for a standard charging installation. For example, the City of Beverly Hills offers online permitting for charging equipment in single-family residences: http://www.beverlyhills.org/business/constructionlanduse/singlefamilyresidences/electricvehiclecharging/
3. Use template-based forms. If a jurisdiction requires further documentation, standard forms will clearly present the requirements and necessary information to electricians, planners and inspectors. This can eliminate extra labor charges that may be incurred for follow-up visits to the permitting counter or charger site. A checklist should explain submittal requirements, which may include simple site plans and line drawings, an

139 Permits and Inspections for PEV Readiness DRAFT
equipment specification sheet and load calculation. The City of Riverside’s residential EV charger guidelines are a good example of a template: http://www.riversideca.gov/building/pdf/handouts/EV-Charger-Guidelines.pdf
4. Create a unique permit fee for charging units. A flat fee that recovers local jurisdiction costs, rather than a fee based on a percentage of the installation cost, would be predictable and transparent for the site owner and electrician without penalizing owners of more costly installations. Alternatively, cities could create flat fees for different categories of installation complexity.
5. Avoid requiring the electrician to be present during inspection. Inspectors should be able to compare the documentation submitted with the work that has been performed without causing the site owner to incur further labor charges from the electrician.
6. Train staff and other stakeholders in application of electrical codes, charging types, and the installation process. Such training can help prevent permitting delays caused by inspectors’ unfamiliarity with PEVs and charging infrastructure. A list of charging equipment certified by a Nationally Recognized Testing Laboratory such as Underwriters Laboratory or Edison Testing Laboratory could be provided to permit officials (Plug-in America). Participants in training sessions could include permitting staff, local electricians, and charging station providers. The California PEV Collaborative recommends local jurisdictions pool together resources for training sessions, for example those provided by the Electric Vehicle Infrastructure Training Program, coordinated by IBEW/NECA and the Department of Energy: http://www1.eere.energy.gov/cleancities/toolbox/pdfs/electric_vehicle_infrastructure_training.pdf. Training is also offered by CVTIP, a consortium of local colleges (College of the Desert, Long Beach City College, Rio Hondo College, and Cerritos College).
7. Expedite PEV permitting. Rather than requiring drivers and charging hosts to request permit expediting, cities should consider automatically expediting charger permit applications. In the City of Los Angeles, single-family residential charger installations (including equipment, service upgrade, receptacles and associated wiring) up to 400 amps are automatically expedited with no plan check required. http://ladbs.org/LADBSWeb/LADBS_Forms/InformationBulletins/IB-P-GI2011-003ExpressPermits.pdf
8. Waive plan check requirements for installations that do not require rewiring or panel upgrades. Local jurisdictions should articulate the types of installations for which a plan check waiver would be appropriate. Oregon’s Building Codes Division even allows registered, licensed and screened electricians to self-certify minor electrical work as code-compliant. They do so by pre-purchasing minor installation “labels,” or permits, of which 10% receive an inspection by the local building department. http://bcd.oregon.gov/programs/minorlabel/minor_label_programs.html#ml
9. Shorten inspection windows and eliminate interim inspections. Charger installations that do not require panel upgrades or trenching may not require interim inspections while installation is underway.
140 UCLA Luskin Center, December 2012DRAFT
10. Unify building and utility inspection. Municipally-owned utilities are well-suited to coordinate a permitting and inspection process with their local building departments. Los Angeles’ Department of Building and Safety has a dedicated charging inspection unit. http://www.afdc.energy.gov/case/1002
11. Inform the local utility of Level 2 or DC fast charger installations as sites apply for permits. This can provide an opportunity for utilities to inform residential or business customers of special rebates or rate structures that could apply to them.
12. Eliminate or simplify the requirement for a separate planning entitlement for most PEV charging except for stand-alone fast charging stations. The California PEV Collaborative survey found that planning entitlements were required by nearly 12% of jurisdictions for commercial and multi-family installations, 15% of them required planning entitlements for PEV charging in open parking lots, and nearly 18% required them for on-street parking (California Plug-in Electric Vehicle Collaborative 2012). The justification for a planning or use permit for charging should be re-evaluated, particularly for commercial and multi-family installations, since charging is likely not the primary use of the site.
12.6 References
Advanced Energy. 2011. Charging Station Installation Handbook for Electric Contractors and Inspectors. http://www.advancedenergy.org/transportation/evse/Charging%20Handbook.pdf.
California Plug-in Electric Vehicle Collaborative. 2012. A Community Toolkit for Plug-in Electric Vehicle Readiness: A Resource for Local Officials. http://www.evcollaborative.org/sites/all/themes/pev/files/PEV_readiness_toolkit_v1.pdf.
———. 2012. California Plug-in Electric Vehicle Readiness Survey. http://www.surveymonkey.com/sr.aspx?sm=liSrdDLXrgyjR80UILTSJBOLy5ylb3zy2cFXwK3AmaE_3d.
———. 2012. Streamlining the Permitting and Inspection Process for Plug-in Electric Vehicle Home Charger Installations. http://www.evcollaborative.org/sites/all/themes/pev/files/PEV_Permitting_InspectionReport.pdf.
City of Riverside Building and Safety Division. 2012. Electric Vehicle (EV) Charger Guidelines. http://www.riversideca.gov/building/pdf/handouts/EV-Charger-Guidelines.pdf.
Plug-in America. How Will You Charge Your Ride?. Available from http://www.pluginamerica.org/accessory-tracker?type=All&level=2&nrtl=yes.
Ready, Set, Charge, California! A Guide to EV-Ready Communities. 2011. http://www.baclimate.org/images/stories/actionareas/ev/readysetcharge_evguidelines.pdf.

141 Permits and Inspections for PEV Readiness DRAFT
U.S. Department of Energy, Alternative Fuels Data Center. Los Angeles’ Plug-in Vehicle Activities and Processes. Available from http://www.afdc.energy.gov/case/1002.
142 UCLA Luskin Center, December 2012DRAFT
13 Parking Guidelines for PEV Readiness
13.1 Introduction
As with any vehicle, electric vehicles will be parked most of the time, whether or not they are plugged in or actively drawing power from a charging source. But unlike conventional vehicles, PEV fueling opportunities are possible almost everywhere within the parking environment: in residential garages, at curbsides, and in both workplace and retail parking lots.
Given the interest by local governments in policies that encourage PEV adoption, parking policies and guidelines will underlie every aspect of PEV planning. Such policies can assist with cost recovery, accessibility to disabled drivers, facilitating turnover at charging stations, and making stations more visible and easy to locate. In particular, clear and visible messaging on PEV directional and regulatory signs can raise the profile of PEVs and signal the advantages of these vehicles to the public (California Plug-in Electric Vehicle Collaborative 2012)
PEV parking policies and guidelines cover a wide range of issues, including: • Location and number of charging spaces • Design of PEV charging spaces in compliance with the Americans with Disabilities Act
(ADA) • Managing access to PEV parking • Whether and how to price parking for PEVs • Design of PEV signage in compliance with federal and state standards
There are currently no regional or state ordinances that standardize implementation of these PEV readiness measures. Local jurisdictions have leeway in determining signage on surface streets, providing for a certain number of PEV-ready parking spaces, and ensuring disabled access in new and existing construction. However, only 14% of agencies and utilities surveyed by the California Plug-in Electric Vehicle Collaborative have established specific zoning and parking ordinances for EVSE installations (California Plug-in Electric Vehicle Collaborative 2012). Consistent installation and signage standards across jurisdictions will lay the groundwork for
143 Parking Guidelines for PEV Readiness DRAFT
future state or regional ordinances, facilitate PEV readiness by eliminating the burden of local regulation development, and clearly communicate to the public how PEV infrastructure should be used.
The California Plug-in Electric Vehicle Collaborative has incorporated PEV charging stall design and signage guidelines from a variety of sources into a set of uniform accessibility and signage standards (California Plug-in Electric Vehicle Collaborative 2012). The standards recommended by the California PEV Collaborative comply with the ADA and California Building Code and will be presented later in this chapter.
What follows are considerations that should be kept in mind when designing and regulating PEV parking and/or charging spaces.
13.2 Location and number of charging spaces
Before deciding whether and where to mandate PEV parking, cities should understand what their likely demand for PEVs will be and whether charging demand can best be satisfied by residential, workplace or publicly accessible charging. The Southern California Regional PEV Readiness Plan will include maps for the region’s nearly 200 cities that will reveal projected demand for PEVs as well as multi-family, workplace, and retail charging opportunities.
The Bay Area Climate Collaborative’s Ready, Set, Charge, California! identifies a number of parking area features that should be considered when placing charging units, including:
• The source of electricity and electrical panels/circuits • Whether there is enough electrical power capacity beyond existing loads • Whether to make lighting, shelter, signage and pedestrian improvements with charging
units • The location of existing disabled-accessible parking spaces and the location of accessible
charging units • Whether cables will infringe on walkways or high pedestrian-traffic areas
13.3 Designing ADA-compliant PEV charging spaces
Interpretation of disabled access requirements for electric vehicle charging stations is evolving. Local jurisdictions have some discretion in how they interpret PEV charging accessibility requirements. California’s green building code (CALGreen) provides voluntary measures for cities to adopt if they wish to require a minimum number of charger-ready spaces in new construction. CALGreen does not stipulate how many of those spaces must be disabled-accessible.
Reflecting the historical separation of parking and fueling into different land uses, the California
144 UCLA Luskin Center, December 2012DRAFT
Building Code provides one set of standards for disabled parking accessibility and another for disabled fueling accessibility, including for electricity (California Plug-in Electric Vehicle Collaborative 2012). Some cities may wish to encourage PEV adoption by providing preferential parking spaces for PEVs, with or without charging equipment. When no charging equipment is provided, parking spaces designated for PEVs need only follow the standards for disabled parking stall allocation and design as described in the Americans with Disabilities Act, California Building Code and local ordinances. When both parking and charging are provided, accessibility standards for both must be applied. However, the two standards may conflict, as PEV charging cords may impede the disabled-accessible path of travel to a building. In such cases, charging equipment should not be provided in a space intended for disabled-accessible PEV parking (California Plug-in Electric Vehicle Collaborative 2012).41
To date, the only official state guidance on accessibility requirements for PEV charging spaces is a set of interim guidelines developed by the Division of the State Architect in 1997. The California PEV Collaborative developed its own set of guidelines in 2012 that distinguish between curbside and offstreet parking, and public and restricted access. Yet another set of guidelines is available in Ready, Set, Charge, California! Section 3.5.2.
The Division of the State Architect and California PEV Collaborative guidelines are provided below. Local jurisdictions should consider which guidelines (if any) may be appropriate for them to codify, as doing so may provide additional clarity on enforcement matters.
13.3.1 Division of the State Architect Interim Disabled Access Guidelines for Electrical Vehicle Charging Stations
This set of guidelines was developed in 1997 to govern accessibility to charging stations on state-funded properties. However, local jurisdictions can adopt similar guidelines for code enforcement. While these state guidelines identify PEV charging as a public accommodation, local jurisdictions must determine whether they want to apply the guidelines to multi-unit dwellings.
The goal of ensuring disabled access to PEV charging may be complicated by the cost considerations involved in retrofits or the need to give up adjoining spaces to provide an accessible path of travel. There is an exception in these guidelines for providing the accessible path of travel to restrooms and other facilities from the charger if the cost of doing so exceeds 20% of the cost of charger installation. Note that under these guidelines, charging spaces should be accessible to those with disabilities, but need not be reserved exclusively for use by persons with disabilities.
The following questions and answers are excerpted from the Division of the State Architect’s Access Compliance Policies:
41 In other words, the PEV parking space could be situated as close as possible to the building entrance to accommodate a disabled PEV driver, but he or she may have to charge elsewhere. A potential solution involves overhead supports from which charging cords can hang above the vehicle (eTec 2010).
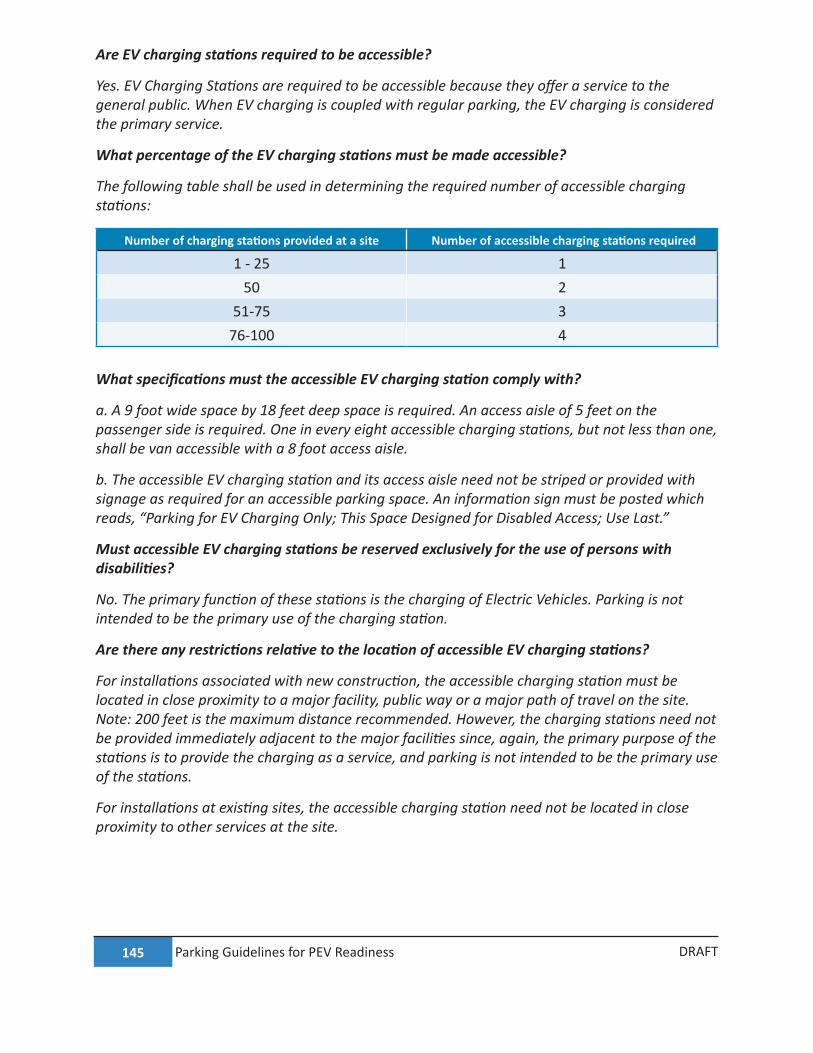
145 Parking Guidelines for PEV Readiness DRAFT
Are EV charging stations required to be accessible?
Yes. EV Charging Stations are required to be accessible because they offer a service to the general public. When EV charging is coupled with regular parking, the EV charging is considered the primary service.
What percentage of the EV charging stations must be made accessible?
The following table shall be used in determining the required number of accessible charging stations:
Number of charging stations provided at a site Number of accessible charging stations required
1 - 25 150 2
51-75 376-100 4
What specifications must the accessible EV charging station comply with?
a. A 9 foot wide space by 18 feet deep space is required. An access aisle of 5 feet on the passenger side is required. One in every eight accessible charging stations, but not less than one, shall be van accessible with a 8 foot access aisle.
b. The accessible EV charging station and its access aisle need not be striped or provided with signage as required for an accessible parking space. An information sign must be posted which reads, “Parking for EV Charging Only; This Space Designed for Disabled Access; Use Last.”
Must accessible EV charging stations be reserved exclusively for the use of persons with disabilities?
No. The primary function of these stations is the charging of Electric Vehicles. Parking is not intended to be the primary use of the charging station.
Are there any restrictions relative to the location of accessible EV charging stations?
For installations associated with new construction, the accessible charging station must be located in close proximity to a major facility, public way or a major path of travel on the site.Note: 200 feet is the maximum distance recommended. However, the charging stations need not be provided immediately adjacent to the major facilities since, again, the primary purpose of the stations is to provide the charging as a service, and parking is not intended to be the primary use of the stations.
For installations at existing sites, the accessible charging station need not be located in close proximity to other services at the site.
146 UCLA Luskin Center, December 2012DRAFT
Is an accessible path of travel required from the accessible EV charging station to other services provided at the site?
Yes, for installations associated with new construction. As for other facilities on the site, an accessible path of travel is required between facilities.
For installation at an existing site, an accessible path of travel is required to the extent that the cost of providing such path does not exceed 20% of the cost of the EV equipment and installation of all EV charging stations at the site, when such valuation does not exceed the threshold amount referenced in Exception 1 of Section 1134 of Title 24. The accessible path of travel shall connect to a major facility, public way or major path of travel on the site.
What specifications must the charging equipment meet?
The charging equipment must meet all applicable reach range provisions of Section 1118B of Title 24. A clear path of travel measuring 36 inches in clear width to the charging equipment is required.
Does the installation of charging stations at an existing site trigger path of travel improvements such as primary entrance to other facilities, restrooms, telephones, or drinking fountains?
No, unless the above features are located in the parking lot, are accessed directly from the parking lot and designed for use with the parking lot.
How does the three-year valuation accumulation apply to these installations?
The valuation of other improvements at the site over the last three years need not be added to the cost of the installation to determine application of the exception referenced in item VI above. The cost of installation of other EV charging stations at the site over a three-year period must be used in determining compliance with the exception.
13.3.2 California PEV Collaborative Accessibility Guidelines
The California PEV Collaborative provides guidelines on disabled accessibility and sample drawings for public- and restricted-access charging spaces in both new construction and existing facilities. These guidelines, summarized in Figure 13.1 and Table 13.2 below, also include standards for card readers at charging stations, which also must be disabled-accessible per the California Building Code (California Building Standards Commission).
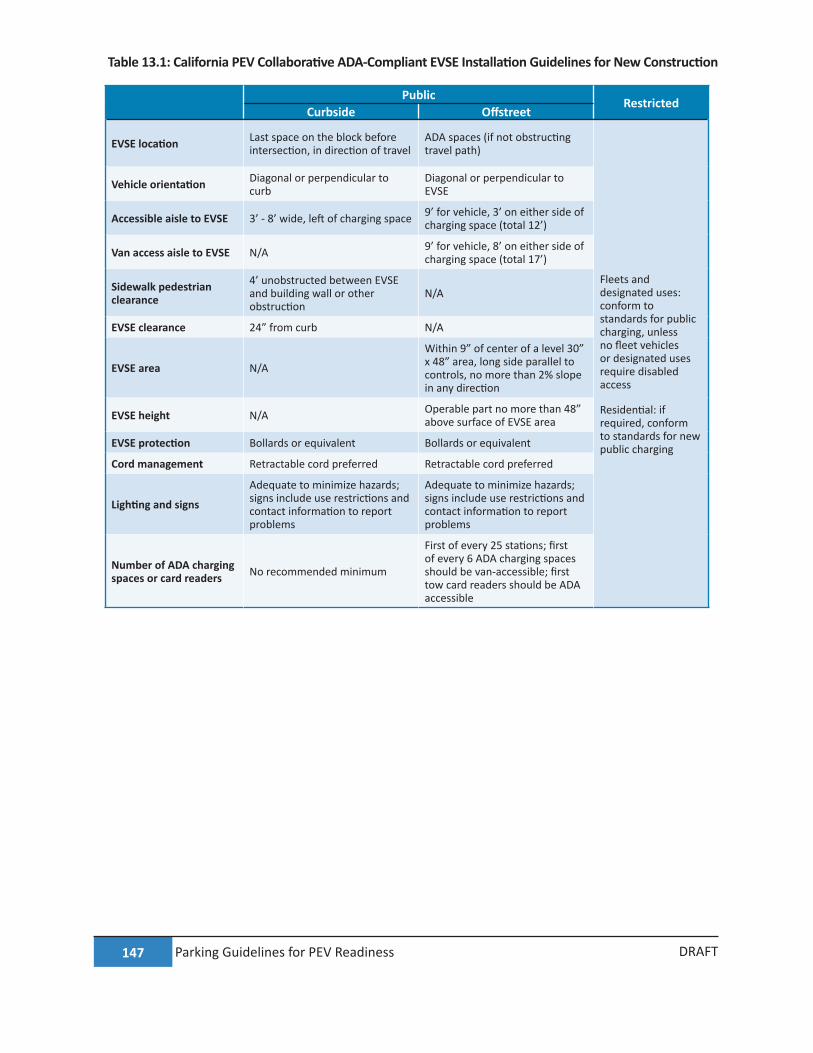
147 Parking Guidelines for PEV Readiness DRAFT
Table 13.1: California PEV Collaborative ADA-Compliant EVSE Installation Guidelines for New Construction
Public RestrictedCurbside Offstreet
EVSE location Last space on the block before intersection, in direction of travel
ADA spaces (if not obstructing travel path)
Fleets and designated uses: conform to standards for public charging, unless no fleet vehicles or designated uses require disabled access
Residential: if required, conform to standards for new public charging
Vehicle orientation Diagonal or perpendicular to curb
Diagonal or perpendicular to EVSE
Accessible aisle to EVSE 3’ - 8’ wide, left of charging space 9’ for vehicle, 3’ on either side of charging space (total 12’)
Van access aisle to EVSE N/A 9’ for vehicle, 8’ on either side of charging space (total 17’)
Sidewalk pedestrian clearance
4’ unobstructed between EVSE and building wall or other obstruction
N/A
EVSE clearance 24” from curb N/A
EVSE area N/A
Within 9” of center of a level 30” x 48” area, long side parallel to controls, no more than 2% slope in any direction
EVSE height N/A Operable part no more than 48” above surface of EVSE area
EVSE protection Bollards or equivalent Bollards or equivalent
Cord management Retractable cord preferred Retractable cord preferred
Lighting and signs
Adequate to minimize hazards; signs include use restrictions and contact information to report problems
Adequate to minimize hazards; signs include use restrictions and contact information to report problems
Number of ADA charging spaces or card readers No recommended minimum
First of every 25 stations; first of every 6 ADA charging spaces should be van-accessible; first tow card readers should be ADA accessible
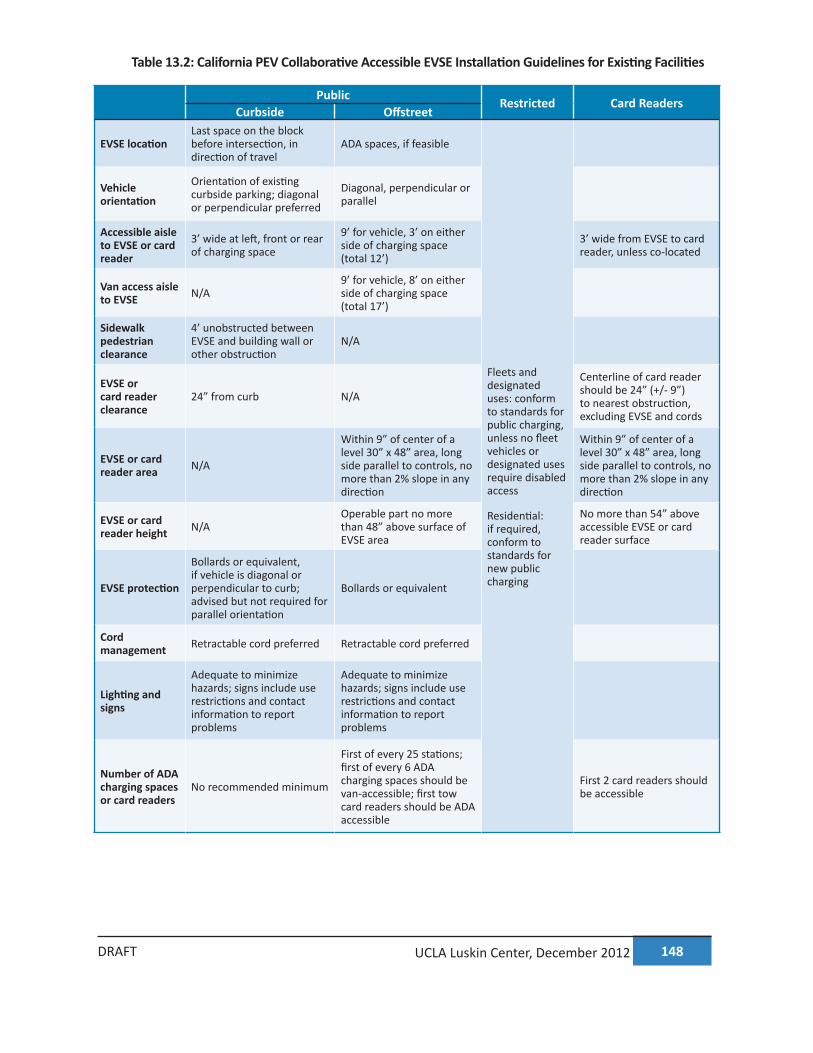
148 UCLA Luskin Center, December 2012DRAFT
Table 13.2: California PEV Collaborative Accessible EVSE Installation Guidelines for Existing Facilities
Public Restricted Card ReadersCurbside Offstreet
EVSE locationLast space on the block before intersection, in direction of travel
ADA spaces, if feasible
Fleets and designated uses: conform to standards for public charging, unless no fleet vehicles or designated uses require disabled access
Residential: if required, conform to standards for new public charging
Vehicle orientation
Orientation of existing curbside parking; diagonal or perpendicular preferred
Diagonal, perpendicular or parallel
Accessible aisle to EVSE or card reader
3’ wide at left, front or rear of charging space
9’ for vehicle, 3’ on either side of charging space (total 12’)
3’ wide from EVSE to card reader, unless co-located
Van access aisle to EVSE N/A
9’ for vehicle, 8’ on either side of charging space (total 17’)
Sidewalk pedestrian clearance
4’ unobstructed between EVSE and building wall or other obstruction
N/A
EVSE or card reader clearance
24” from curb N/A
Centerline of card reader should be 24” (+/- 9”) to nearest obstruction, excluding EVSE and cords
EVSE or card reader area N/A
Within 9” of center of a level 30” x 48” area, long side parallel to controls, no more than 2% slope in any direction
Within 9” of center of a level 30” x 48” area, long side parallel to controls, no more than 2% slope in any direction
EVSE or card reader height N/A
Operable part no more than 48” above surface of EVSE area
No more than 54” above accessible EVSE or card reader surface
EVSE protection
Bollards or equivalent, if vehicle is diagonal or perpendicular to curb; advised but not required for parallel orientation
Bollards or equivalent
Cord management Retractable cord preferred Retractable cord preferred
Lighting and signs
Adequate to minimize hazards; signs include use restrictions and contact information to report problems
Adequate to minimize hazards; signs include use restrictions and contact information to report problems
Number of ADA charging spaces or card readers
No recommended minimum
First of every 25 stations; first of every 6 ADA charging spaces should be van-accessible; first tow card readers should be ADA accessible
First 2 card readers should be accessible
149 Parking Guidelines for PEV Readiness DRAFT
13.4 Managing access to charging spaces
In addition to determining standards for PEV charging space design, local jurisdictions can designate spaces that are only for PEV charging and/or parking. Spaces designated for this purpose, along with the appropriate signage, will discourage non-PEV drivers from using these spaces and support their availability for PEV drivers. The California Vehicle Code prohibits any vehicle from parking in a space intended for PEV charging unless it is connected to EVSE, but the law does not specify whether the vehicle must be actively drawing power (2012 California Vehicle Code, Section 22511.1). The law also authorizes local authorities and private parking facility owners to tow vehicles in charging spaces that are not connected to EVSE, as long as proper signage is in place to warn drivers (2012 California Vehicle Code, Section 22511).
The following is an example of a local ordinance on designating PEV-only spaces:
13.4.1 Santa Monica (2012)
The Director of Planning and Community Development, or his or her designee, is authorized to designate parking spaces or stalls in an off-street parking facility owned and operated by the City of Santa Monica or the Parking Authority of the City of Santa Monica for the exclusive purpose of charging and parking a vehicle that is connected for electric charging purposes.(Santa Monica Municipal Code, Ordinance 2403, Section 29 2012)
13.5 Pricing PEV parking
Local governments and private property owners should also consider how much drivers should pay for charging and/or PEV parking. Such decisions should balance cost recovery considerations with the need to both incentivize PEV use and possibly discourage drivers from leaving their PEVs parked in charging spaces after they have refueled.
The pricing decision involves some combination of free or priced parking and free or priced charging. For example, site owners can provide free parking for PEVs but require payment for using the charging equipment. Alternatively, they can require payment for parking and offer charging for free. Yet another strategy would involve requiring payment for both PEV parking and charging, or offering both for free. Detailed guidance on cost recovery scenarios, both break-even and for-profit, are presented in Chapter 9. Pricing guidance for charging in multi-unit dwellings (Chapter 6), workplaces (Chapter 7) and retail (Chapter 8) is available elsewhere in this document.
Cities may want to initially encourage PEV use by offering free or discounted parking while PEVs are charging, and then begin charging full price for parking after the vehicle has fueled. This would encourage drivers to move their cars and allow other PEV drivers to use the charging space, but would not penalize drivers who do not move their cars in a timely fashion. As PEVs become more ubiquitous and demand grows for charging spaces, cities should consider
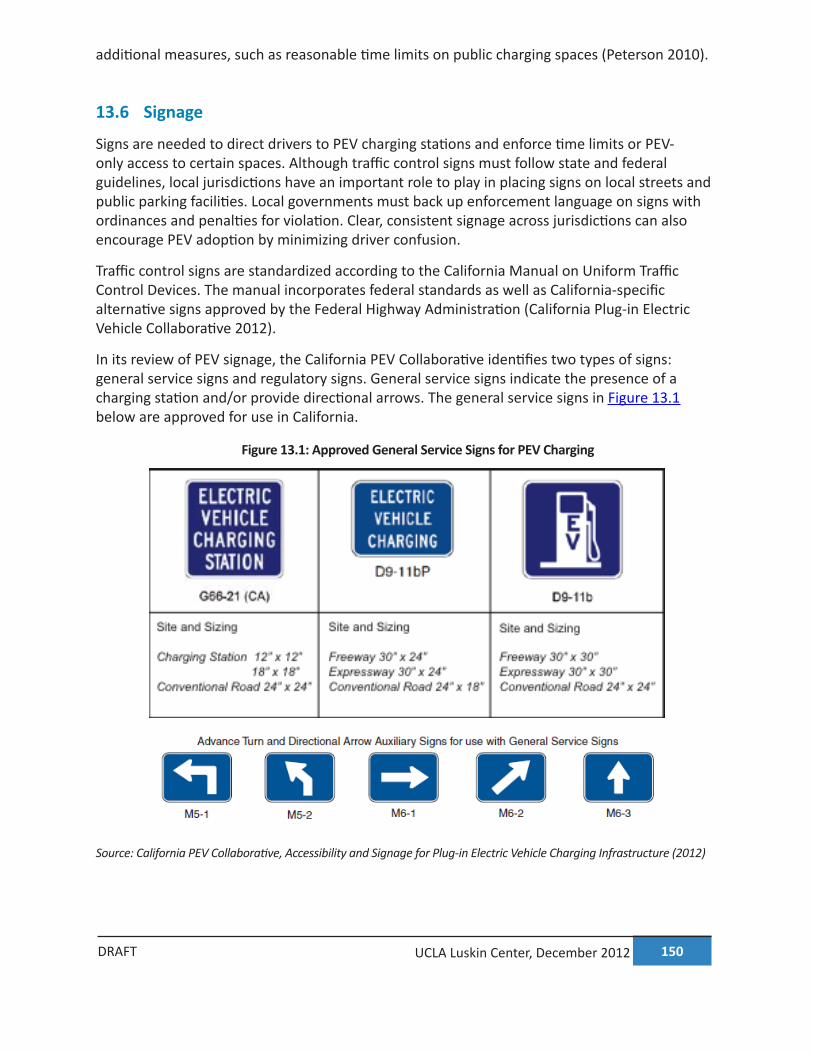
150 UCLA Luskin Center, December 2012DRAFT
additional measures, such as reasonable time limits on public charging spaces (Peterson 2010).
13.6 Signage
Signs are needed to direct drivers to PEV charging stations and enforce time limits or PEV-only access to certain spaces. Although traffic control signs must follow state and federal guidelines, local jurisdictions have an important role to play in placing signs on local streets and public parking facilities. Local governments must back up enforcement language on signs with ordinances and penalties for violation. Clear, consistent signage across jurisdictions can also encourage PEV adoption by minimizing driver confusion.
Traffic control signs are standardized according to the California Manual on Uniform Traffic Control Devices. The manual incorporates federal standards as well as California-specific alternative signs approved by the Federal Highway Administration (California Plug-in Electric Vehicle Collaborative 2012).
In its review of PEV signage, the California PEV Collaborative identifies two types of signs: general service signs and regulatory signs. General service signs indicate the presence of a charging station and/or provide directional arrows. The general service signs in Figure 13.1 below are approved for use in California.
Figure 13.1: Approved General Service Signs for PEV Charging
Source: California PEV Collaborative, Accessibility and Signage for Plug-in Electric Vehicle Charging Infrastructure (2012)
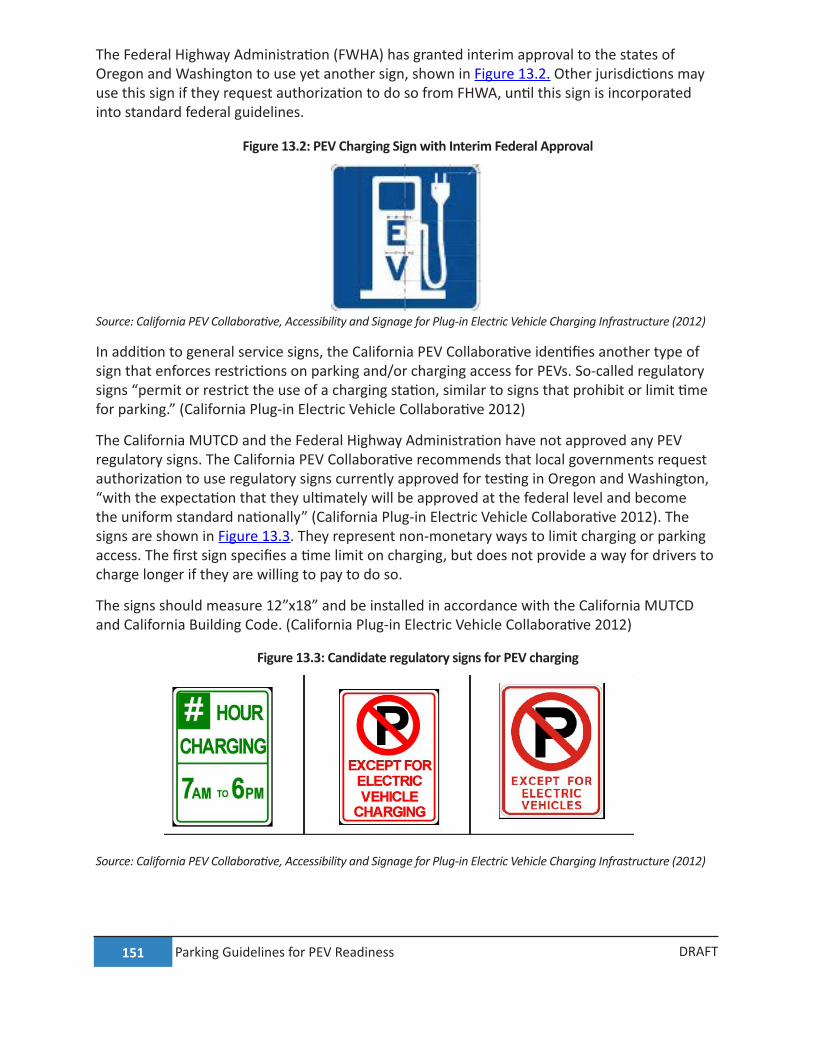
151 Parking Guidelines for PEV Readiness DRAFT
The Federal Highway Administration (FWHA) has granted interim approval to the states of Oregon and Washington to use yet another sign, shown in Figure 13.2. Other jurisdictions may use this sign if they request authorization to do so from FHWA, until this sign is incorporated into standard federal guidelines.
Figure 13.2: PEV Charging Sign with Interim Federal Approval
Source: California PEV Collaborative, Accessibility and Signage for Plug-in Electric Vehicle Charging Infrastructure (2012)
In addition to general service signs, the California PEV Collaborative identifies another type of sign that enforces restrictions on parking and/or charging access for PEVs. So-called regulatory signs “permit or restrict the use of a charging station, similar to signs that prohibit or limit time for parking.” (California Plug-in Electric Vehicle Collaborative 2012)
The California MUTCD and the Federal Highway Administration have not approved any PEV regulatory signs. The California PEV Collaborative recommends that local governments request authorization to use regulatory signs currently approved for testing in Oregon and Washington, “with the expectation that they ultimately will be approved at the federal level and become the uniform standard nationally” (California Plug-in Electric Vehicle Collaborative 2012). The signs are shown in Figure 13.3. They represent non-monetary ways to limit charging or parking access. The first sign specifies a time limit on charging, but does not provide a way for drivers to charge longer if they are willing to pay to do so.
The signs should measure 12”x18” and be installed in accordance with the California MUTCD and California Building Code. (California Plug-in Electric Vehicle Collaborative 2012)
Figure 13.3: Candidate regulatory signs for PEV charging
Source: California PEV Collaborative, Accessibility and Signage for Plug-in Electric Vehicle Charging Infrastructure (2012)
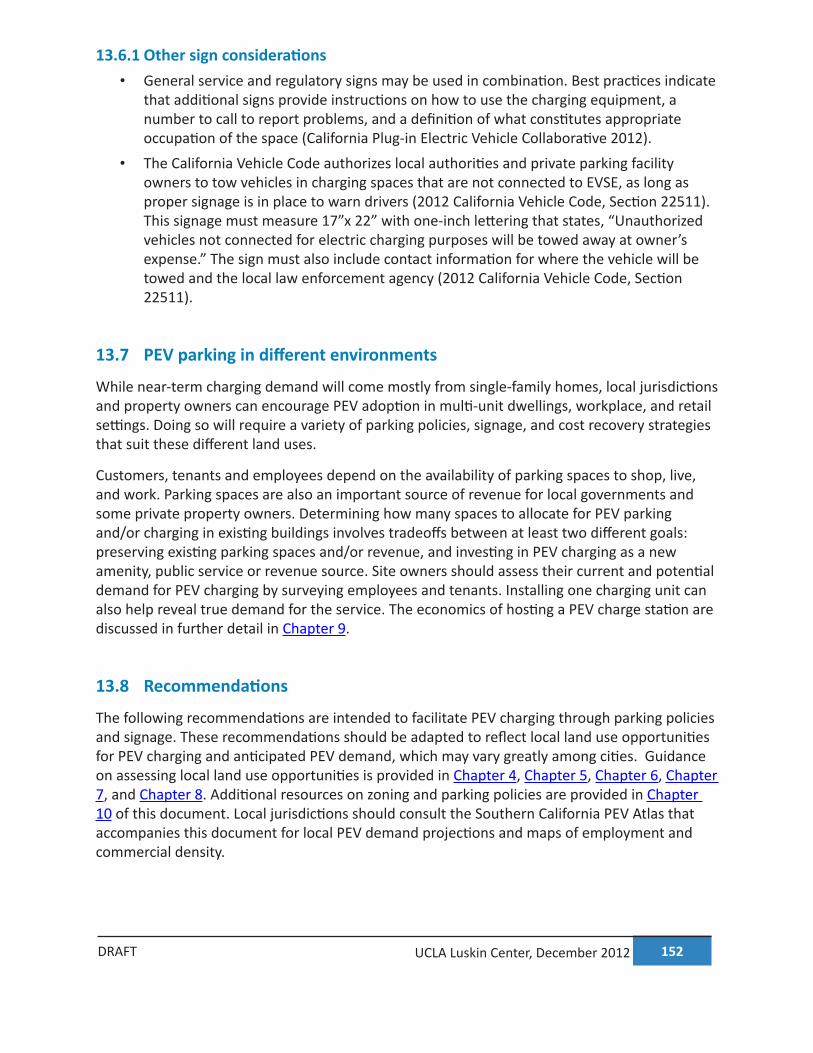
152 UCLA Luskin Center, December 2012DRAFT
13.6.1 Other sign considerations • General service and regulatory signs may be used in combination. Best practices indicate
that additional signs provide instructions on how to use the charging equipment, a number to call to report problems, and a definition of what constitutes appropriate occupation of the space (California Plug-in Electric Vehicle Collaborative 2012).
• The California Vehicle Code authorizes local authorities and private parking facility owners to tow vehicles in charging spaces that are not connected to EVSE, as long as proper signage is in place to warn drivers (2012 California Vehicle Code, Section 22511). This signage must measure 17”x 22” with one-inch lettering that states, “Unauthorized vehicles not connected for electric charging purposes will be towed away at owner’s expense.” The sign must also include contact information for where the vehicle will be towed and the local law enforcement agency (2012 California Vehicle Code, Section 22511).
13.7 PEV parking in different environments
While near-term charging demand will come mostly from single-family homes, local jurisdictions and property owners can encourage PEV adoption in multi-unit dwellings, workplace, and retail settings. Doing so will require a variety of parking policies, signage, and cost recovery strategies that suit these different land uses.
Customers, tenants and employees depend on the availability of parking spaces to shop, live, and work. Parking spaces are also an important source of revenue for local governments and some private property owners. Determining how many spaces to allocate for PEV parking and/or charging in existing buildings involves tradeoffs between at least two different goals: preserving existing parking spaces and/or revenue, and investing in PEV charging as a new amenity, public service or revenue source. Site owners should assess their current and potential demand for PEV charging by surveying employees and tenants. Installing one charging unit can also help reveal true demand for the service. The economics of hosting a PEV charge station are discussed in further detail in Chapter 9.
13.8 Recommendations
The following recommendations are intended to facilitate PEV charging through parking policies and signage. These recommendations should be adapted to reflect local land use opportunities for PEV charging and anticipated PEV demand, which may vary greatly among cities. Guidance on assessing local land use opportunities is provided in Chapter 4, Chapter 5, Chapter 6, Chapter 7, and Chapter 8. Additional resources on zoning and parking policies are provided in Chapter 10 of this document. Local jurisdictions should consult the Southern California PEV Atlas that accompanies this document for local PEV demand projections and maps of employment and commercial density.
153 Parking Guidelines for PEV Readiness DRAFT
1. Codify guidelines for disabled access to PEV charging spaces.
2. Adopt policies that facilitate the placement of signage on public property by non-city charging site owners (e.g. on sidewalks or public streets).
3. If demand for charging exceeds available charging capacity, consider measures to facilitate turnover at PEV charging spaces. Measures can include one or more of the following:
o Clarify California Vehicle Code to require that PEVs parked in a charging space be connected to an EVSE and actively drawing power.
o Post signage with chargers that cites relevant California vehicle code in order to be able to enforce towing of vehicles if they are not PEVs, connected to EVSE, and/or actively drawing power.
o Charge for parking if PEVs are still parked but not actively drawing power. o Impose time limits on charging to allow other PEVs to use limited charging spots.
4. Use a single general service sign (accompanied with standard directional signage) for PEV charging as shown in Figure 13.1 or as shown in Figure 13.2 with interim FHWA approval. Local governments can request approval to use the general service sign with interim federal approval until a national standard is available.
13.9 Additional resources
The California PEV Collaborative’s Accessibility and Signage for Plug-in Electric Vehicle Charging Infrastructure (2012) recommends a uniform set of accessibility standards that comply with the ADA and California Building Code, as well as signs that comply with federal and state guidelines, or that have been submitted for federal or state approval. http://www.pevcollaborative.org/sites/all/themes/pev/files/PEV_Accessibility_120827.pdf
The Bay Area Climate Collaborative’s Ready, Set, Charge, California! A Guide to EV-Ready Communities (2011) provides sample code language for reserving public parking spaces for PEVs, as well as design and installation guidelines for both on- and off-street charging stations.
http://www.baclimate.org/images/stories/actionareas/ev/guidelines/readysetcharge_evguidelines.pdf
• Section 3.2.1 (Sample zoning code provisions) • Section 3.3 (Vehicles and traffic) • Section 3.4.1 (On-street electric vehicle charging stations) • Section 3.4.2 (Off-street electric vehicle charging stations) • Section 3.5.2 (ADA and reasonable accomodations)
154 UCLA Luskin Center, December 2012DRAFT
• Section 3.6 (Signage)
13.10 References
2012 California Vehicle Code, Section 22511. http://www.dmv.ca.gov/pubs/vctop/d11/vc22511.htm.
2012 California Vehicle Code, Section 22511.1. http://www.dmv.ca.gov/pubs/vctop/d11/vc22511_1.htm.
California Building Standards Commission. 2010 California Building Code, Chapter 11C. http://publicecodes.cyberregs.com/st/ca/st/b200v10/st_ca_st_b200v10_11c_section.htm.
California Department of General Services, Division of the State Architect. 2011. Access Policy Update, Policy 97-03, Interim Disabled Access Guidelines for Electrical Vehicle Charging Stations. http://www.documents.dgs.ca.gov/dsa/pubs/policies_rev_01-01-11.pdf.
California Plug-in Electric Vehicle Collaborative. 2012. A Community Toolkit for Plug-in Electric Vehicle Readiness: A Resource for Local Officials. http://www.evcollaborative.org/sites/all/themes/pev/files/PEV_readiness_toolkit_v1.pdf.
———. 2012. Accessibility and Signage for Plug-in Electric Vehicle Charging Infrastructure. http://www.evcollaborative.org/sites/all/themes/pev/files/AccessibilityReport-4%2726%20final.pdf.
———. 2012. California Plug-in Electric Vehicle Readiness Survey. http://www.surveymonkey.com/sr.aspx?sm=liSrdDLXrgyjR80UILTSJBOLy5ylb3zy2cFXwK3AmaE_3d.
eTec. 2010. Electric Vehicle Charging Infrastructure Deployment Guidelines for the Central Puget Sound Area. http://www.theevproject.com/downloads/documents/Electric%20Vehicle%20Charging%20Infrastructure%20Deployment%20Guidelines%20for%20the%20Central%20Puget%20Sound%20Area%20Ver%203.2.pdf.
Peterson, David. 2010. Electric Vehicles and Subsidized Parking: Policy Brief for City of Los Angeles City Council (Executive Summary). http://luskin.ucla.edu/content/pev-readiness.
Ready, Set, Charge, California! A Guide to EV-Ready Communities. 2011. Association of Bay Area Governments; Bay Area Climate Collaborative; Clean Fuel Connection; EV Communities Alliance; LightMoves Consulting. http://www.baclimate.org/images/stories/actionareas/ev/guidelines/readysetcharge_evguidelines.pdf.
Santa Monica Municipal Code, Ordinance 2403, Section 29. 2012. http://qcode.us/codes/santamonica/revisions/2403.pdf.
164 UCLA Luskin Center, December 2012DRAFT
15 Developing PEV Outreach Campaigns
15.1 Introduction
Getting local stakeholders involved in PEV readiness will be crucial to successful PEV deployment. Planners may want to know whether they should conduct outreach in the community, and if so, what level of engagement will be appropriate. This chapter will help planners develop answers to the following questions:
• Why develop an outreach plan? Drivers and other potential charging site hosts need help understanding the technical aspects of PEV charging, the economic value proposition that PEV driving and/or charging holds for them, and the installation process for PEV charging.
• What stakeholders should be the target of outreach efforts? Drivers in single-family homes and multi-unit dwellings (MUDs) have different opportunities and barriers to PEV charging and should receive targeted outreach. Site hosts—employers and owners of commercial, industrial and MUD properties—are also key stakeholders.
• How should stakeholders be engaged? Outreach should be tailored to the level of PEV charging demand in the community. Too little engagement may slow the growth of PEV adoption and may lead to missed opportunities for charging. High-profile campaigns that are not preceded by basic PEV readiness efforts (such as permit streamlining and building code updates) may be a waste of resources and lead to frustration. Outreach efforts can be conducted along a “ladder of engagement,” starting with more passive efforts that grow into more active projects:
Step 1: Informational support. This serves stakeholders that are already interested in purchasing PEVs or installing charging equipment. Local jurisdictions can provide information on vehicle types, potential cost savings from PEV driving, electrical service, and the charging equipment installation process through passive means such as a website and/or handouts from utilities and the Building Department. This would be general information or resources for all PEV stakeholders.
165 Developing PEV Outreach Campaigns DRAFT
Step 2: Workshops. Local jurisdictions can host workshops for general or targeted audiences such as drivers, homeowner associations (HOAs), property owners/managers, and renters for residential charging; or for employees, employers, or fleet managers for workplace charging.
Step 3: Targeted technical assistance and outreach. Planners may want to approach high-value stakeholders who may be less aware of the technical or procedural aspects of installing charging and using PEVs or who may require more detailed decision support. Actively engaging large employers or property owners in the decision-making process or providing information specific to their needs can facilitate the installation of charging and use of PEVs at their site.
Step 4: Demonstration projects. Public agencies and utilities can partner up to install charging equpment via demonstration projects in particularly challenging areas such as multi-unit dwellings.
PEV outreach efforts that have been conducted in Southern California at various levels of engagement, ranging from passive to active.
15.1.1 Local marketing and outreach efforts to date
Regional organizations offer a wide variety of programs around which cities can develop outreach campaigns. The South Coast Air Quality Management District (SCAQMD) has been actively supporting PEV readiness initiatives since 2009, and is involved in several marketing and outreach efforts as part of PEV readiness planning efforts funded by the U.S. Department of Energy (DOE) and California Energy Commission (CEC). A DOE grant supported the creation of six California regional PEV readiness plans, PEV readiness guidelines and toolkit, and a series of regional PEV readiness outreach workshops to assist municipalities to deploy PEV infrastructure in their communities. The CEC is funding sub-regional PEV readiness studies including market needs assessments and analyses of barriers to PEV readiness.
These outreach efforts have included information on PEVs and infrastructure, local utility rate programs and support services, and available incentives for PEV owners (vehicle purchase rebates, residential infrastructure rebates, rebates or reductions in state or local toll access charges, preferred parking spaces or single-rider access to HOV lanes, reduced or free charging at select locations, etc.).
Outreach efforts in the South Coast region have consisted of EV101 workshops for local governments, utilities, and residents; workplace charging workshops; local council of government workshops; utility rebate programs; promotional events; and AQMD’s own marketing and outreach efforts.
Outreach efforts can target specific sectors of charging, including single-family residences, multi-unit dwellings, workplace, and commercial/retail/public locations.

166 UCLA Luskin Center, December 2012DRAFT
15.2 Single-family residential charging
Installation of charging in single-family residences is the most critical sector in which to have charging and typically the least challenging sector for installations. Additional guidance on single-family home charging is provided in Chapter 5 of this document. The Southern California PEV Atlas that accompanies this document provides maps of PEVs registered with the Department of Motor Vehicles. Planners can use these guides to prioritize neighborhoods for single-family residential charging.
15.2.1 What stakeholders should be the target of outreach efforts? • Neighborhood associations are an efficient way to reach groups of residents in single-
family homes that may be inclined to purchase a PEV. • PEV dealers have a vested interest in the popularity of PEVs in the community and may
be interested in participating in ride-and-drive or vehicle loan events. They are also the referral point in many cases for charging equipment installers.
• Installers of charging equipment. Installers and electricians often interact directly with planners in the permitting and inspection process and should be aware of local documentation requirements.
• Public officials and/or their staff may be called upon to assist constituents who are PEV owners. Public officials who drive city-owned PEVs can also serve as visible advocates for PEV adoption.
15.2.2 How should stakeholders be engaged?
Marketing and outreach at the level of Step 1 (informational support) also work well for single-family residential installations.
• The California PEV Collaborative has an excellent website of online resources targeted to several audiences, including PEV owners. The website features communication guides on PEV charging and the benefits of owning a PEV. http://www.pevcollaborative.org
• SCAQMD has a Clean Air Choices program website which has a clean vehicle savings calculator and available incentives. http://www.aqmd.gov/CleanAirChoices/index.html
• The California Air Resources Board has a DriveClean California website which provides information on vehicle technologies and searchable PEV incentives. http://www.driveclean.ca.gov/
• Local utility agencies have also provided extensive information on utility rates and rebate programs for PEVs or infrastructure on their websites.
o Los Angeles Department of Water and Power https://www.ladwp.com/ladwp/faces/ladwp/residential/r-gogreen/r-gg-driveelectric?_adf.ctrl-state=10i5arr6ih_4&_afrLoop=118205602113000
167 Developing PEV Outreach Campaigns DRAFT
o Riverside Public Utilities http://www.greenriverside.com/Go-Green-2/Electric-Vehicles-197
o Southern California Edison http://www.sce.com/info/electric-car/default.htm?from=residentialrate
Marketing and outreach efforts for general audiences at the level of Step 2 (workshops) can also address issues concerning charging installation at single-family homes.
• Types of PEVs and charging technologies • Incentives available for purchases of PEVs, electricity and charging equipment
installation • Navigating the permitting and inspection process
Other Step 2 efforts include vehicle loan programs by automakers, California Air Resources Board’s Clean Vehicle Rebate Project workshops, National Plug-in Day, and Santa Monica Alt Car Expo, which provide information on technologies, utility rate and incentive programs, ride and drive experiences, and panels in which PEV drivers share their insights on owning PEVs.
Workshops for local government planners and officials have raised awareness about the need to streamline permitting to facilitate charging at single-family homes. These have included local council of government (COG) workshops and those conducted by the California Center for Sustainable Energy. The California PEV Collaborative has also conducted workshops addressing all of the major PEV readiness elements such as permitting and inspection, zoning and parking, and building codes.
15.3 Multi-unit dwelling charging
Installation of charging infrastructure in MUDs is another critical sector and one of the most challenging ones. Additional guidance on MUD charging is provided in Chapter 6 of this document. The Southern California PEV Atlas that accompanies this document provides maps of MUDs that planners can use to prioritize locations for MUD charging support.
15.3.1 What stakeholders should be the target of outreach efforts? • Property owners of residential MUDs include landlords and homeowner associations,
whose cooperation is key in securing approval for MUD charging. • MUD residents include individual rental tenants and condo owners, who must
understand their rights and responsibilities around PEV charging in MUDs. • Developers of MUD properties, who may consider installing chargers or PEV-ready
wiring in exchange for density bonuses or other benefits.
168 UCLA Luskin Center, December 2012DRAFT
15.3.2 How should stakeholders be engaged?
Marketing and outreach efforts for general audiences at the level of Step 1 (informational support) and Step 2 (workshops) outlined in the single-family residential charging section provide familiarity with vehicle and charging technology and utility rate impacts. However, they are not sufficient on their own to meet the needs of MUD charging. The challenges of MUD installations require Step 3 (targeted technical assistance) and Step 4 (demonstration projects) that go beyond what is currently being done.
Specific MUD issues that can be addressed include: • “EV rights” in MUDs. California law prohibits HOAs from unreasonably preventing
the installation of PEV charging equipment. However, PEV drivers must meet certain conditions if the equipment is installed for their exclusive use in a common area. Further guidance on “EV rights” in MUDs is provided in Chapter 6.
• Incentives for charging equipment installation and special discounts on electricity used for charging in MUDs that are similar to commercial PEV charging rates.
• Economies of scale in MUD charging. HOAs and landlords can lower their unit costs of providing charging equipment by using machines that can charge multiple cars simultaneously or in an automated queue.
Best practices for marketing and outreach to promote MUD charging underscore the need for marketing and outreach with greater levels of engagement, and include:
• Informational support and workshops (same as for single-family, but tailored to MUDs) • Targeted technical assistance
o COGs present information to their member cities and counties on vehicle and charging technologies and changing local codes to expedite more complicated installations. For example, this could include code language for cities and counties to consider adopting that would categorize MUD installations as residential rather than commercial installations. This could also include incentives to MUD owners, HOAs, and property managers to install Level 1 or Level 2 infrastructure in existing buildings, and require PEV-ready electrical service and infrastructure in new construction.
o COGs identify in which types of buildings equipment installation would be easier and more cost-effective. They could also identify ways of reducing costs for more complicated installations.
• Demonstration projects. These are appropriate for stakeholders with low levels of knowledge and many specific questions about MUD charging.
o Federal, state or locally-funded demonstration or incentive programs for installation of infrastructure in MUDs in early adopter, environmental justice, or other types of communities. These could be targeted to areas of high concentrations of both MUDs and PEVs.
169 Developing PEV Outreach Campaigns DRAFT
15.4 Workplace charging
After residential charging, workplaces are the second highest priority for charging, particularly for PEV owners who have long commuting distances or live in MUDs where they are unable to charge at home.
Additional guidance on workplace charging is provided in Chapter 7 of this document. The Southern California PEV Atlas that accompanies this document provides maps that layer workplaces with daytime PEV destinations. Planners can use these guides to prioritize support for workplace charging.
15.4.1 What stakeholders should be the target of outreach efforts? • Chambers of commerce, business groups, and trade associations, particularly those that
represent white-collar, high-tech employers, and/or other segments with high potential of adopting PEVs
• Labor unions that may be interested in installation work for their members • High-value or large employers, such as hospitals or educational institutions • Commercial property owners with employer tenants • Parking management companies that operate workplace parking areas
15.4.2 How should stakeholders be engaged?
Marketing and outreach efforts for general audiences at the level of Step 1 (informational support) and Step 2 (workshops) provide familiarity with vehicle and charging technology and utility rate impacts, but are not sufficient to address the needs of workplace charging. The challenges of workplace installations require Step 3 (targeted technical assistance) and Step 4 (demonstrations) that go beyond what is currently being done.
Specific workplace-charging issues that can be addressed include: • Whether Level 1 or Level 2 charging can meet the needs of employee PEVs • How employers or commercial property owners might price charging services to recover
costs • Access control and payment systems • Maximizing the use of charging equipment (for example, powering fleet or public PEVs
when not powering employee PEVs) • Issues of equity and access where employee, fleet, and public vehicles need to share and
coordinate limited charging resources • Tax implications if charging is provided for free and only employees with PEVs can
benefit
170 UCLA Luskin Center, December 2012DRAFT
Best practices for marketing and outreach to promote workplace charging underscore the need for marketing and outreach with greater levels of engagement, and include:
• Informational support (tailored to workplace charging)o Workshops for specific audiences for workplace charging (employees, employers,
fleet managers, commercial property owners) • Targeted technical assistance
o COGs present information to their member cities on vehicle and charging technologies and changing city and county codes to expedite more complicated installations. This could include code language for cities and counties to consider adopting that simplifies permitting, inspection, zoning, and parking requirements for commercial installations.
o Codes or incentives to employers or property owners supporting installation of infrastructure in existing buildings, and requiring PEV-ready electrical service and infrastructure in new construction.
o Workplace demonstration programs which identify at which types of locations it would be easier and more cost effective to install infrastructure and identify ways of reducing costs for more complicated installations
• Demonstration projectso Federal, state or locally-funded demonstration or incentive programs for
installation of workplace infrastructure in early adopter, environmental justice, or other types of communities with large numbers of employees (to satisfy SCAQMD Rule 220250 or rideshare program requirements), high concentrations of PEVs, or low concentrations of public infrastructure
15.5 Retail charging
Retail charging is the third priority for infrastructure installation, after residential and workplace. Retail installations are generally considered as amenities to drive traffic to destination locations or as stops between home and work during peak commute hours. Several supermarkets and national chains such as Ralphs, Albertsons, Kohls, and Walgreens have installed Level 2 or DC fast chargers. PEV manufacturers such as Nissan, BMW, and General Motors have installed Level 2 or DC fast chargers at their dealerships as a convenience to PEV buyers.
Outreach efforts for general audiences at the level of Step 1 (informational support) and Step 2 (workshops) do provide familiarity with vehicle and charging technology and utility rate impacts, but are not sufficient on their own to address the challenges associated with retail installations. The challenges of retail installations require Step 3 (targeted technical assistance)
50 Rule 2202 requires employers of at least 250 employees at a work site to participate in an emissions reduc-tion program to offset commute-related pollution.
171 Developing PEV Outreach Campaigns DRAFT
and Step 4 (demonstration projects) that go beyond what is currently being done.
Additional guidance on retail charging is provided in Chapter 8 of this document. The COG-level maps in the Southern California PEV Atlas that accompanies this document layer commercial destinations with daytime PEV destinations. Planners can use these guides to prioritize locations for retail charging.
15.5.1 What stakeholders should be the target of outreach efforts? • Chambers of commerce and retail associations whose members may be inclined to
individually provide PEV charging as an amenity to customers • Business improvement districts whose members may be inclined to collectively pay for
PEV charging to attract customers • Owners of retail properties, particularly major malls where vehicles are parked for long
periods of time • Developers of retail properties, who may consider installing chargers or PEV-ready
wiring in exchange for density bonuses or other benefits
15.5.2 How should stakeholders be engaged?
Best practices for marketing and outreach to promote retail charging underscore the need for marketing and outreach with greater levels of engagement, and include:
• Informational support (tailored to retail charging) • Workshops for specific audiences for commercial charging • Targeted technical assistance
o COGs present information to their member cities on vehicle and charging technologies and changing city and county codes to expedite more complicated installations. This could include code language that simplifies permitting, inspection, zoning, and parking requirements for commercial installations. These could also include requirements for PEV-ready electrical service and infrastructure in new construction.

3323 SCHOOL OF PUBLIC AFFAIRSBOX 951656, LOS ANGELES, CA 90095-1656310-267-5435 TEL • 310-267-5443 FAX
LUSKIN.UCLA.EDU