Embed Size (px)
Citation preview

South–South migration and the labor market:
Evidence from South Africa*
Costanza Biavaschi�, Giovanni Facchini�, Anna Maria Mayda§, Mariapia Mendola¶
February 15, 2018
Abstract
Using census data for 1996, 2001 and 2007 we study the labor market effect of immigrationto South Africa. We exploit the variation – both at the district and at the national level –in the share of foreign–born male workers across schooling and experience groups over time.In addition, we use an instrumental variable empirical strategy to estimate the causal effectof immigration on the local labor market. At the district level, we show that increasedimmigration has a negative and significant effect on natives’ employment rates but not ontotal income. At the national level, we find that increased immigration has a negative andsignificant effect on natives’ total income but not on employment rates. Our results areconsistent with outflows of natives to other districts as a consequence of migration, as inBorjas (2006).
JEL classification numbers: F22, J61Keywords: Immigration, Labor market effects, South Africa.
*The authors are most indebted to the Multi-Donor Trust Fund (MDTF) for generously funding the Grant:“Labor Markets, Job Creation, and Economic Growth: Migration and Labor Market Outcomes in Sending andSouthern Receiving Countries” which made this paper possible. We would also like to thank Frederic Docquier,Caglar Ozden, Giovanni Peri and Hiller Rapoport and seminar audiences at Georgetown SFS–Q, the World Bank,the EIIT Conference at Purdue University, the IZA Annual Migration Meeting, the IZA–World Bank Conferenceson Employment and Development in Cape Town and Mexico City, the Conference on Global Migration: Economics,Politics, Policy (Tulane University), the NORFACE Workshop in London, the CEPR PEGGED Conference in Turinon the “Economics and Politics of Immigration”, and the PEGGED Conference in Brussels for providing usefulcomments.
�University of Reading and IZA; email: [email protected].�The University of Nottingham, Universita degli Studi di Milano, Centro Studi Luca d’Agliano, CEPR and
CES–Ifo; email: [email protected].§Georgetown University, Centro Studi Luca d’Agliano, CEPR and IZA; email: [email protected].¶Universita degli Studi di Milano Bicocca, Centro Studi Luca d’Agliano and IZA; email: mari-
1

“...They come from all over, and they are of all sorts, the new African migrants. There
are the professionals – the doctors and academics, highly educated and hoping that in
this country their skills can at last earn them a living wage. There are the traders,
buying up what the shopping malls have to offer, and traveling home twice a month
with bulging suitcases... There are the hawkers and the hustlers, who travel south out
of desperation... And then there are the criminals; the drug dealers, the pimps and
fraudsters.” (Phillips 2002)
1 Introduction
Recent evidence suggests that South–South migration is a sizeable phenomenon. For instance,
Ratha and Shaw (2007) estimate that 74 million, or nearly half, of the migrants from developing
countries live and work in other developing countries. In other words, South–South migration
is almost as important as South-North migration. As a result, it is likely to have a substantial
impact on the economies of these low and middle income destination countries. However, most
likely due to data unavailability, there are almost no systematic studies of the impact of South–
South migration (Hatton and Williamson 2005).1 In this paper we contribute to this literature by
analyzing the specific case of South Africa, which is an important destination of migrants in the
developing world and, in particular, in Sub–Saharan Africa (Ratha and Shaw 2007). We first show
that migration flows to South Africa are substantial and increasing, especially from neighboring
African countries. Next, we analyze the impact of migrant flows on South Africans’ labor market
opportunities.
Following the demise of the Apartheid regime, important political changes have swept South
Africa, leading to the 1994 election of a democratic government. At the same time, the coun-
try’s position as a regional economic superpower has made it an attractive destination for migrant
workers from surrounding areas in search of new employment opportunities. Until 2002, migra-
tion to South Africa was disciplined by the “Aliens Control Act” of 1991, a piece of legislation
which was rooted in the “control and expulsion” mentality of the Apartheid era, inspired by a
fundamentally racist perspective (Peberdy and Crush 1998). After 2002, with the introduction
of the new Immigration Act (Act 13), and its subsequent amendment in 2004, the policy stance
changed substantially. Today the South African government sees the inflow of foreign workers
(and especially of skilled ones) as a tool for economic growth. This is a significant break from the
control–oriented framework of the past.
Still, xenophobic episodes against immigrants are common place (McDonald 2000 and Friebel,
1Two interesting exceptions are the study by Gindling (2009) of the effect of Nicaraguan migration to CostaRica in the early years of this century and the study by Ozden and Wagner (2018) of the effects of immigration onthe Malaysian labor market between 1990-2010.
1

Gallego, and Mendola 2013) suggesting that natives often perceive immigrants as a threat. While
several studies have provided a qualitative assessment of recent migration to South Africa, re-
markably little systematic evidence exists on the labor market effect of foreign immigration to the
country. The purpose of this paper is to shed light on this question and provide what is – to the
best of our knowledge – the first systematic study of the labor market effect of immigration to this
country.2 In carrying out our analysis, we use three large datasets provided by Statistics South
Africa covering 1996, 2001 and 2007.We start by documenting the patterns of immigration. First,
we find that the number of foreigners has increased substantially over the period we are consid-
ering. In 1996, about 2.1 percent of the population (or 5.1 percent of the male labor force) was
made up by migrants, and that share had grown to 2.7 percent of the population (or 6.1 percent of
the male labor force) in 2007. Second, and contrary to beliefs widely held in the country, foreign
male workers in South Africa are relatively highly educated.3 In particular, as of 2007, they are
approximately four times more likely than native workers to have attained a college degree. The
importance of foreign workers is even higher when we look at individuals at the very top of our skill
classification, i.e. individuals who are not only highly educated, but also have a long labor market
experience. Third, we find that other African countries are becoming an increasingly important
source of immigrants to South Africa.
We next turn to the analysis of natives’ labor market outcomes. We first follow an approach
that exploits the variation in the distribution of immigrants of different skills across geographic
sub-units within the country and over the three years of our sample. Our rich dataset allows us
to identify 56 districts. We follow Borjas (2003) and define a skill level as being characterized by
both educational achievement and labor market experience. We use an empirical specification that
accounts for fixed effects along the three main dimensions of the analysis (skill, district and time) as
well as all pairwise interaction terms. In these district-level regressions we find that immigration
has, on average, no effect on natives’ employment rates and income. One important caveat in
interpreting the latter findings, though, is that the fixed effects estimates might suffer from an
endogeneity bias. First, it is widely recognized that immigrants are not distributed randomly but
instead tend to cluster in specific (e.g. economically stronger) locations. This reverse causality
creates an upward bias in both employment–rates and total–income regressions. Alternatively, it
might be that endogeneity arises because migration is itself caused by employed natives’ outflows
– due to better-paid labor market opportunities in other districts or abroad. In that case foreign
2See Crush and Williams (2010) and Landau and Segatti (2009) for a broad overview of the phenomenon, andMcDonald (2000) for an insightful collection of essays looking at the evolution of migration in the early post–Apartheid era. Bhorat, Meyer, and Mlatsheni (2002) provides instead evidence on emigration of skilled workersfrom the Southern African region.
3In fact, as pointed out by Crush and Williams (2010), page 14, recent inflows of highly skilled workers fromother African countries played an important role. In particular “The growing number and proportion of Africanimmigrants suggest the beginning of a skills brain drain to South Africa, which could accelerate in the future.”
2

workers would be hired to fill up vacancies left open by natives in the South African labor market.
This reverse causality creates a downward bias in the employment–rates regressions.
Thus, to obtain unbiased estimates and uncover causal effects, we implement an instrumental
variable strategy. In particular, we follow Card (2001) and create a shift-share instrument which
uses data on the distribution of immigrants across districts, by country of origin, during Apartheid
(this data is from the 1991 South African Census). The instrument is based on evidence that net-
works are important determinants of migrants’ location decisions (Munshi 2003). In addition, in
the case of South Africa the exclusion restriction is likely to be satisfied for the following two rea-
sons. First, black workers’ movements were highly regulated by the government during Apartheid.
Before 1994, black migrant workers were not free to choose, according to economic incentives,
where to locate within South Africa. Historical evidence shows that the government’s choice of
locations where black migrants were allowed to live was in general driven by political/racial as op-
posed to economic determinants. Second, since the end of Apartheid implied a structural break in
the economy of the country, the pattern of economic activity across districts changed substantially
after 1994.Thus the pattern of migration in the Apartheid period is unlikely to be correlated with
post-Apartheid economic conditions. The district-level IV estimates indicate a large and negative
effect of immigration on natives’ employment rates. Our preferred specification indicates that a
ten percentage points increase in the share of migrants of a skill group in a given district leads to a
4.7 percentage points decrease in natives’ employment rate. For example, the average percentage
point increase – between 1996 and 2007 – in migration rates of university–educated migrants with
more than 30 years of labor market experience, which is equal to approximately seven percentage
points, implies a 3.2 percentage points decline in natives’ employment rates. Thus, reverse causal-
ity and endogeneity appear to give rise to a bias towards zero in the fixed effects estimates of the
employment–rates regressions. Finally, in the district-level IV regressions, we still find no effect of
immigration on income.
Given the long history of ethnically/racially segmented labor markets in South Africa, and the
substantial heterogeneity of immigration to South Africa both in terms of the migrants’ ethnic
background and skill level, we further investigate whether the IV findings are robust along these
two dimensions. To this end we repeat our district-level analysis focusing, respectively, on three
broad ethnic backgrounds and four separate education groups. We find that the negative causal
impact of immigration on natives’ employment persists across racial and skill groups.
There are several possible channels through which immigration may exert its causal impact
on natives’ employment rates at the district level. First, the impact of immigration on natives’
employment rates may be direct, i.e. the arrival and hiring of immigrants may lead natives to
lose their jobs. Alternatively, immigration may affect natives’ employment rates indirectly. For
example, immigration may have an impact on natives’ formal labor–market participation (i.e.,
3

immigration may lead South African workers to move to the informal labor market which would
amount to a decline in natives’ formal employment rates). Another indirect channel is through
the impact of immigration on natives’ location within the country (i.e., immigration may induce
natives’ outflows to other districts and, to the extent that employed natives are more likely to
leave than unemployed ones, this amounts to a decline in natives’ employment rates in the district
considered). Fourth, immigration could encourage native workers to leave South Africa and relocate
abroad (i.e., immigration may give rise to emigration to other countries which would amount to
a decline in natives’ employment rates in South African districts – to the extent that employed
natives are more likely to leave the country than unemployed ones). A priori all these mechanisms
are consistent with our main findings.
To gain insights on which channels are at work, we carry out a national-level analysis a la
Borjas (2003). We find, on average, no impact at the national level of immigration on natives’ total
employment rates and a negative and significant effect on total income. We also find heterogenous
results for immigration across different types of workers (i.e. employees vs. self-employed): The
impact of immigration on natives’ self–employment rates – which was insignificant in the district-
level OLS and IV regressions – is positive and significant in the national-level regressions. This
findings can be interpreted in the light of the theoretical framework developed by Borjas (2006)
to understand the link between the so called “spatial correlation” approach and “national level”
studies of the impact of international migration. Building on the insight that natives react to
the inflow of foreign workers in the local labor market where they reside by relocating to other
regions of the country, he shows that the spatial correlation between native employment and the
immigrant stock “...will be more negative when the model is estimated using geographically smaller
labor markets, and that the spatial correlation between the wage and the immigrant stock will be
more negative for larger labor markets.” Our results thus provide evidence consistent with the
adjustment mechanism studied by Borjas (2006) also in the context of a middle–income country,
and are reinforced by the implementation of an instrumental variable strategy.
The remainder of the paper is organized as follows. Section 2 discusses the South African
migration history, whereas section 3 introduces the data. Sections 4, 5 and 6 contain our empirical
analysis, whereas section 7 concludes the paper.
2 Migration to South Africa
South Africa has been the destination of large cross border labor flows at least since the mid of the
nineteenth century, when migrants from Lesotho, Malawi, Mozambique and Zimbabwe came to
work in the sugar cane fields of Natal and the recently opened diamond mines in Kimberly (Crush
2000).
4

In the last two decades of the Apartheid regime, growing racial tensions, coupled with a more
active role played by labor unions in the domestic labor market, led the South African government
to perceive black migration as a source of political threat. As a result, starting from the early
seventies, black immigration – both legal and illegal – decreased substantially, thanks both to a
reduction in the demand for foreign workers by domestic businesses and also to the stricter border
enforcement policies, which were put in place by the government (Crush 2000). At the same
time, up until the end of Apartheid, white immigrants have been welcome to the country, and
policies have even been put in place to facilitate their arrival (for instance, free passage was offered
to European immigrants during the sixties and seventies). Finally, the general stance towards
refugees has been one of limited tolerance, especially in the case of the Mozambicans, who fled
their country in large numbers following the civil conflict which saw South Africa as one of the
main players.
In the post 1994 period, census data show that migration to South Africa has been characterized
by a steady increase in the number of foreign residents in the country and by a change in the
composition by source country. Interestingly, the flow of foreign workers has been remarkably
less volatile than in other parts of the continent (Lucas 2006), even though in many cases it
has remained temporary in nature. According to our data, over the period 1996-2007 the overall
number of foreign born in South Africa has grown from approximately 830 thousand to 1.2 million,
i.e. an increase of approximately 45 percent. As a result, in 1996 migrants represented 2.1 percent
of the total population, whereas in 2007 they made up 2.7 percent of the total (see Figure 1). The
importance of foreign workers is even greater. If we focus on males in the labor force (i.e. those
who are either working or seeking work), the share of immigrants over the period grew from 5.1
percent in 1996 to 6.1 percent in 2007 (see Figure 2). Finally, note that these average figures hide
substantial variation in the migration share across different locations within the country.
Table 1 uses information on country of birth of migrants, which was collected in the 1996 and
2001 censuses (unfortunately the same information is not available for 2007), to produce a picture
of the evolution of the sources of South African migrants. What is immediately apparent is the
growing importance of Africa. Between 1996 and 2001 the share of foreigners originating in the
continent increased by 6.4 percentage points, from 64.6 to 71 percent of the total, with Mozambique
and Zimbabwe being the main origin countries. Similar patterns can be observed also when we
restrict our attention to males in the labor force: by 2001 almost four out of five migrant males in
the labor force were born in other African countries.
The second element which emerges from Table 1 is the decline in the importance of Europe
as a source. In 1996, individuals born in the European continent represented approximately 26
percent of the total migrants, whereas by 2001 that share had declined to 22 percent. Looking at
the male labor force, the importance of European migrants declines even more, and by 2001 they
5

represented only 15.9% of foreign male workers. Interestingly, there has been a significant decline
in the relative importance of the UK as a source country.
This trend has resulted in important changes in the racial composition of the immigrant pop-
ulation relative to the native one. As shown in Table 2, in 1996 83.9 percent of the working age
natives in the labor force were Blacks or Coloured, 12.4 percent were Whites, and only 2.9 percent
Asians. Whites were substantially over-represented among immigrants, making up approximately
38 percent of the total. Blacks or Coloured were clearly under-represented at 58.8 percent of the
total, whereas the share of Asians were remarkably low, at only 2.0. In 2007, in the presence of an
essentially stable racial composition of the native population, the share of whites in the immigrant
population declined substantially, to approximately 26.3 percent of the total – a reduction of 12.1
percentage points – whereas the share of Blacks or Coloured people increased to 69.4 percent –
an increase of 10.6 percentage points. The share of Asians among migrants also saw a steep rise,
more than doubling to 4.3 percent of the total.
It is not clear how much of the evolution of South African migration by size, source country
and racial composition is due to changes in migration policy. As has been argued by many ob-
servers, even in the aftermath of Apartheid’s demise, the South African migration policy stance
has continued to be rather restrictive (Peberdy 2001). In fact the 1991 Aliens Control Act, which
has been nicknamed ‘Apartheid’s last act’ (Landau and Segatti 2009), remained the cornerstone of
South African immigration policy throughout the nineties. Drafted to simplify all the previous im-
migration laws enacted after 1937, the Aliens Control Act became increasingly controversial after
the transition to the democratic regime, and was ultimately declared unconstitutional. Following
this decision, a lengthy process was started to substantially reform the existing policy framework,
which culminated in the Immigration Act of 2002 and in the subsequent Immigration Amendment
Act of 2004. The two pieces of legislation are oriented towards favoring highly skilled immigration
and investors. The initial quota allocation, as presented in February 2003, allowed for approxi-
mately 740,000 yearly permits. Since then, there has been a dramatic revision of the system and, in
2011, only 35,000 work permits were allocated through the quota system, covering 53 occupations
(skills) deemed ‘scarce and critical’.
This new policy led to a significant increase in the skill profile of immigrants to South Africa,
and as pointed out by Crush and Williams (2010), “The growing number and proportion of African
immigrants suggests the beginning of a skills brain drain to South Africa which could accelerate
in the future.”
6

3 Data
For our main analysis we use three surveys carried out by the Statistical Office of the Republic of
South Africa, which are available through the International IPUMS website.4 The 1996 and 2001
data are a ten percent sample from the population census and cover approximately 3.6 and 3.7 mil-
lion individuals, respectively.5 The 2007 data are instead taken from the South African Community
Survey, and cover approximately 2.2 percent of the population or 1.1 million individuals.
In collecting information for the South African Census and Community survey, an effort is made
to cover also undocumented residents (i.e. illegal immigrants) (Statistics South Africa 2012), and
in particular, no question is asked to elicit legal status. Existing estimates indicate that by the mid
90’s the country harbored approximately 500,000 illegal immigrants (South African Department
of Labour 2007 and Crush (1999)), and while it is likely that illegal immigrants will be under–
represented in our data, the undercount rates that can be obtained from the Census indicate that
Statistics South Africa attempts to correct for this.6 Moreover, we address this concern in a series
of robustness checks carried out in Section 5.
A wealth of information is collected in these data sets, including labor market outcomes and
important individual-level characteristics. We restrict our analysis to men in the 16-65 age group,
who participate in the civilian labor force (i.e., are not studying and are either working or seeking
work).7 Furthermore, the large size of the samples allows us to fully exploit the spatial dimension
of migration, taking advantage of the heterogeneity in the distribution of foreign workers across
localities. In particular, we are able to use information at the district level (there are 56 districts
in South Africa). An individual is defined to be an immigrant if he is foreign born.
As for measures of labor market outcomes, we have information on each individual’s employ-
ment status (i.e., whether he is working or seeking work in the week when the census was carried
out), type of employment (i.e., whether a person is self-employed or works for someone else)8 and
total income. The latter is defined as the total personal income in local currency (Rand) from all
4See https://international.ipums.org/international/.5The 1996 and 2001 census data undercount the total population by, respectively, 10.7 percent and 18
percent. Statistics South Africa and the IPUMS project provide a weight variable that is explicitly de-signed to adjust for the undercount. Naturally, we have used this weighting factor throughout our analy-sis. For more details about the data construction, see the working paper version of this article available fromhttp://faculty.georgetown.edu/amm223/papers.htm.
6For example, considering different groups of origin countries, the implied undercount in the 1996 census was8.78% for Asia, 8.93% for Europe, and 11.89% for the countries bordering South Africa, which are the most likelyorigins of illegal immigrants.
7One reason we exclude women from the sample is that there is more uncertainty for women on the time theyenter and exit the labor market, thus our measure of labor-market experience would be very noisy.
8According to the classification adopted by Statistics South Africa, an “employee” is defined as a “person whoworks for someone else or a company for a wage or salary, or for commissions from sales or bonuses, or for paymentin kind such as food, housing or training”, whereas “self-employed” is a “person who has his or her own businessor enterprise but does not employ other persons except for unpaid family workers”.
7

sources in the previous twelve months, and is reported in broad brackets. In all the three samples,
the data on income are recoded to the midpoints of the broad intervals given in the original data,
and suffer from the standard “top coding” problem, as the top interval is coded to its lowest pos-
sible value (e.g, code 360,001 for 360,001+).9 Unfortunately the data do not allow us to measure
labor income separately from other sources of income, nor wages separately from the number of
hours worked. Bearing in mind these limitations of our data, we have verified, using the Labor
Force Survey (LFS), which in 2001 contains information on both monthly wages and total income,
that the correlation between these two measures is positive and strongly significant for the total
sample and also for the subsamples where the main earners are respectively employees and self
employed individuals.10
One of the individual-level characteristics we consider to define the relevant unit of analysis is
educational attainment, which is measured according to the following four categories: less than
primary (the individual has completed less than 5 years of primary education), less than secondary
(the individual has received between 5 and 11 years of education), secondary completed plus some
college (the individual has at least 12 years of education, but has not completed college) and
college completed (the individual has at least completed 16 years of education).We can compare
the percentages of native and immigrant men, in the labor force, in each education category for the
three years in our sample. Several interesting patterns emerge. First, the share of individuals who
have not completed a primary education has fallen for both groups: for natives, from 27 percent in
1996 to 15.8 percent in 2007, whereas for immigrants the decline has been from 32.7 percent in 1996
to 21.1 percent in 2007. Second, highly skilled workers are becoming more common both among
foreign born and natives. Among natives, between 1996 and 2007 the share of males in the labor
force with a college degree has increased from 2.4 percent to 4.9 percent. Among the foreign born,
the increase has been even more substantial: from 5.8 percent to 11.8 percent. In other words,
in 2007 more than one out of ten foreign born males in the labor force had a college education,
compared to one out of twenty natives. Interestingly, this pattern emerges while considering all
groups of countries of origin (see Figure A1). Considering also the intermediate categories, the
pattern that emerges from the data is one in which on average today’s South African immigrants
are at least as educated as their domestic counterparts, and their presence is particularly strong
9More precisely, in 1996 there are 14 brackets, starting at “No income” and reaching R 360,001+. For 2001 and2007 information is instead reported using 12 brackets, starting again at “No income” and reaching R 2,457,601+.See Appendix Table A1 for more details.
10We cannot use the LFS for our baseline analysis because it does not contain information on the country ofbirth of the respondent. We have also investigated the relationship between total income and wages exploiting thevariation at the province/skill level. In particular, we have used the 2001 and 2007 rounds of the LFS to construct ameasure of average annual salary at the province/skill level. We have merged the latter variable with a measure oftotal income at the same level of aggregation constructed from the IPUMS data. Regression results show that salaryand total income are strongly and significantly correlated also at the province/skill level. This evidence suggeststhat total income is likely to be a good proxy for the behavior of wages in South Africa. See Tables A2-A4 in theAppendix.
8
at the very top of the educational attainment scale (see Table A5).
As has been forcefully argued by Borjas (2003) and Borjas (2006), skills are acquired both before
and after an individual enters the labor market and, as a result, workers who have the same level
of education, but different levels of experience, are imperfect substitutes in production.11 For this
reason, to be able to assess the impact of foreign workers on natives’ labor market opportunities,
we need to take into account not only the formal schooling received by them, but also how long
these workers have been active in the labor market.
To do this, we follow Borjas (2003) and define a skill group in terms of both schooling and
labor market experience. The latter is identified as the number of years that have elapsed since
the individual has completed school. We assume that the age of entry into the labor force is 16
for a worker in the “less than primary completed” category and 17 for a worker in the “less than
secondary completed” category. We assume instead that the typical individual with a high school
education or some college enters the labor force at 21, whereas the typical college graduate enters
the labor force at 23.12 Our measure is necessarily rough, though, as individuals might take for
instance longer than the statutory number of years (we use four) to complete a college education or
might decide not to immediately enter the labor market. Furthermore, this measure is particularly
problematic for immigrants as it does not distinguish between experience which has been acquired
working in the destination country and experience which has been acquired elsewhere.
To carry out our analysis, we assume that the maximum number of years of labor market
experience is 40, and we follow the literature and create broad categories of labor market experience,
based on five–year intervals.13 Table 3 report summary statistics on the share of immigrants in
each skill category. What is immediately apparent is that in all the three years in our sample,
immigrants are over–represented at the very top of the skill distribution. For instance, while in 1996
only 5.86 per cent of the immigrants have less than primary education and 1-5 years of experience,
in the same year as many as 14.78% have a college degree and 31-40 years of experience. These
numbers also highlight that immigrants are more likely than natives to be at the top of the skill
distribution. For instance, in 1996, an immigrant is 3.2 times as likely as a native to have a college
degree and 31-40 years of labor market experience. In 2007, this likelihood has further increased to
4.1 times.14 Immigrants are only slightly more likely than natives to be at the bottom of the skill
11See also Ottaviano and Peri (2012) for an even finer distinction.12This definition reflects the assumption that individuals enter the South African labor force at the legal working
age of 15 years old and there is possibly a one year lag between the end of school and the entry into the labor force.13The last category includes individuals with 31 to 40 years of labor market experience. This choice is driven by
the low life expectancy in South Africa (56 years) compared to developed countries and enables us to have a largeenough sample in all cells. Borjas (2006) has showed that using alternative intervals to define experience does notqualitatively affect the results.
14These numbers are calculated as the share of migrants in each cell (shown in Table 3) divided by the share ofimmigrants in the population, times the share of natives in the population divided by the share of natives in thecell. For instance, in 2007 that is 0.2113/0.061 times (1-0.061)/ (1-0.2113).
9

distribution, i.e. not to have completed a primary education and have very limited labor market
experience. These results reinforce our initial findings that today’s educated immigrants are an
important component of South Africa’s foreign workers population, and that immigrants play a
particularly important role in the supply of very high skills.
Our empirical analysis will exploit differential time variation in immigration across districts.15
For example, the City of Johannesburg metropolitan municipality in Gauteng has seen the number
of foreign born male workers almost treble between 1996 and 2007 from 53 thousand to 134
thousand and, as of 2007, immigrants made up 12.8% of the total. The immigration dynamic in
the Lejweleputsa district in the Free State has been instead more volatile, mirroring the fortunes
and the demand for foreign workers of the dominant mining sector. In 1996 there were almost 40
thousand male foreign born workers in the province, representing about 20% of the total. The
number had decreased to approximately 11 thousand in 2001, whereas by 2007 it had edged back to
approximately 20 thousand, or 14.2% of the total. Finally, the Ehlanzeni district in Mpumalanga,
at the border with Mozambique’s Limpopo province, has seen its immigrant population peak in
2001 at approximately 24 thousand (14% of the total), whereas by 2007 it had declined to 19
thousand or 10.7% of the total.
We will exploit this rich variation in the data to carry out our empirical analysis. Our main
measure of immigration in local labor markets is given by pijt, i.e. the share of foreign born in the
male labor force of a particular skill group i in district j at time t, which is defined as:
pijt = Mijt/(Mijt +Nijt)
where Mijt is the number of male foreign born workers in skill group i in district j at time t and
Nijt represents the corresponding number of natives.
We can examine the general patterns in the data in Figure 3, which presents two scatter plots
linking the inter-censual change in the immigrant share and the changes in native individuals’
employment rateand (log) income. Both pictures suggest that natives’ labor market outcomes in
a given cell (defined as a skill profile in a given district) are uncorrelated with changes in the
immigrant share in that cell. However, the figures do not control for important observable and
non–observable characteristics. We will do so in the analysis carried out in the next section.
15As administrative boundaries have changed over the sample period included in our study, we have put specialcare to insure that the geographic area included in each district is kept constant over time by using informationcollected for finer geographical partitions.
10
4 Empirical specification
In the first part of our empirical analysis, we assess the labor market effect of immigration in
South Africa exploiting the variation in the distribution of foreign workers – of different skill levels
– across local labor markets within South Africa and over time. Following the literature (Borjas
2006), we estimate the following specification:
Lijt = si + rj + qt + (si ∗ rj) + (si ∗ qt) + (qt ∗ rj) + βppijt + εijt (1)
where the dependent variable Lijt is a labor market outcome for male native workers in skill
group i (28 education by experience groups), district j (56 districts), and Census year t (3 years);
pijt is the main variable of interest. Controls include a vector of fixed effects si, indicating the skill
level; a vector of fixed effects rj indicating the district of residence, and a vector of fixed effects qt
indicating the time of the observation. These fixed effects control for differences in labor market
outcomes across skill groups, local labor markets and over time. The interaction terms si ∗ qt and
qt∗rj control, respectively, for changes in the labor market outcomes of each skill group and of each
district over the period we are considering in our sample, i.e. 1996-2007. The interaction si ∗ rjindicates instead that we are identifying the coefficient of interest, βp, from changes in natives’
labor market outcomes and immigration rates that occur over time within a district/skill cell.
We carry out two sets of regressions, focusing on men in the working age group (16-65) in
the labor force. The first examines the effect of immigration on native workers’ employment rate.
The second considers instead the effect of immigration on native workers’ total income. In all our
specifications, standard errors are clustered at the skill-district level.
The results are reported in Table 4, where we consider three different measures of natives’
employment: the total employment rate,16 the share of employees in the labor force and the
share of self employed in the labor force. We find that immigration has no significant impact on
natives’ total employment rate, and both on the share of employees and self employed in the labor
force. For instance, in column 1 we present the estimate of the impact of immigration on natives’
total employment rate. The estimated coefficient βp is 0.02, with a standard error of 0.043, i.e.
statistically insignificant at all conventional levels and economically small. In columns (2) and
(3) we look instead at the share of employees and self-employed in the labor force. We do so in
order to explore whether the labor market impact of immigration is heterogenous across types
of employment that entail a different degree of formality. In particular, according to the survey
definition of self-employment, we use the latter as a proxy for informal employment.17 The results
16Defined as the sum of employees and self employed in the labor force.17In the survey, a self-employed individual is defined as a person who “works for him/herself without employing
anyone else”. While not all self-employed, especially in developed countries, are likely to work in the informal sector,existing evidence suggests that rates of tax and social security evasion among the self-employed in developing or
11

suggest that there is no effect of immigration on the total employment rate, and across different
types of employment.
In columns (4) to (7) we turn to consider the effect of immigration on natives’ income levels.
Measurement error is likely to be a concern, given how income is reported in our data and as a
result, our estimates should be taken with due caution.18 Furthermore, as we pointed before, our
data only provides information on individuals’ total personal income from all sources. As a result,
it is not possible for us to disentangle changes in labor earnings from changes in other sources of
income and, within labor earnings, changes in wages from changes in the number of hours worked.19
We start by examining the impact on the total income earned by male workers in the labor force
(column 4), whereas in columns 5-7 we consider different subgroups of employed natives, i.e. all
those in employment (column 5), the employees (column 6), and the self–employed (column 7).
As can be seen from columns 4 and 5, the effect of immigration on the total income of individuals
in the labor force and on employed individuals is not significant. The same holds true when we
only consider the employees in column 6 and the self employed in column 7.
Summarizing, our fixed effect estimations highlight that immigration has no effect on natives’
employment rate and total income.
5 IV results
So far our results have highlighted the absence of a correlation, at the district-skill-year level,
between the share of immigrants in the male labor force and natives’ employment rate. To establish
whether this relationship is causal, we employ an instrumental–variable methodology based on
Card (2001).
It is well known that immigrants tend to settle in geographic areas where earlier migrants from
the same origin country have established themselves (Bartel 1989). Assume that the total number
of immigrants in South Africa from a given origin country is independent from the labor–demand
conditions prevailing in any particular district of the country. Then we can decompose the actual
inflow of immigrants from a given source country to a given district into an exogenous supply
component – based on the total number of immigrants in South Africa from the given source
country and the share of earlier immigrants from that country that live in that district – and a
middle-income countries are much higher than for employees (e.g. ILO 2002).18The number of observations across specifications changes when we consider the effect of migration on income.
There are two possible reasons for that. First, we might be simply missing information for income; second, theentire cell might be missing, for example because in a given magisterial district there are no native individualswho have achieved a certain level of education and a certain number of years of labor market experience. In thelatter case, while the employment rate is zero, income is not defined. Thus, while we retain the information in theemployment regressions, we drop this observation in the specifications with income.
19Notice though that total income and wages are highly correlated in South Africa both at the household level,and across skills/districts. See footnote 17 and results in Tables A2-A4.
12
residual component – that reflects short term fluctuations from the long term patterns. Card’s
shift-share instrument is based on the idea that the exogenous supply component represents the
supply shifter that can be used as an instrumental variable. More precisely, let Mot20 be the
number of immigrants from source country o that are in South Africa at time t. Furthermore, let
λoj be the share of immigrants from country o who were observed living in district j in a previous
period. Finally, let τoit be the fraction of immigrants from origin country o that in year t belong
to skill group i. Our shift–share instrument is then defined as
SSijt =∑o
Motλojτoit (2)
To construct λoj we use information from the last population count conducted during the
Apartheid period, i.e. the 1991 Census. This data set is available from Statistics South Africa.21
Given the changes that have taken place in the administrative subdivision of the country after the
end of the Apartheid regime, we have devoted considerable effort to insure that the definition of
our geographic unit of reference is stable over time.
The validity of the exclusion restriction of our IV is based on the assumption that the pattern
of migration across districts in the Apartheid period (captured by the distribution of λoj) is not
correlated with post-Apartheid economic conditions. Two points seem to suggest that this is the
case. First, it is important to remember that, during the Apartheid period, the Group Areas Act of
1950 zoned the country into “white only” areas and “black” areas, and led to the forced relocation
of about 3.5 million individuals, mostly blacks, colored or asians, who happened to be living
in the “wrong” part of the country (Ross 2008). At the time, this represented approximately
10 percent of the total population, which often ended up carted off from city suburbs to the
adjacent Bantustans that had been recently established. Subsequent pieces of legislation22 also
20Depending on data availability, the literature has considered both the effect of recent immigrant arrivals onchanges in native’s outcomes in models including fixed effects (e.g. changes in native employment/wages in Card(2001), prices in Cortes (2008) etc.) and the effect of immigrant stocks on native outcome levels (e.g. Mitaritonna,Orefice, and Peri (2017), Barone, D’Ignazio, De Blasio, and Naticchioni (2016), Giuntella and Mazzonna (2015)).Correspondingly the instruments have been constructed using national level recent immigrant arrivals or stocks.In the case of South Africa, we do not have information on immigrant recent arrivals. Note also that, followingCortes and Pan (2013) – to address the possible concern that the total number of immigrants (from a given source)may be correlated with local conditions at the district level – we have also replicated our analysis by omitting thecontribution of district j to the the total number of immigrants from a given source in each time period whenconstructing the instrument for that district. The results are unaffected.
21See http://interactive.statssa.gov.za:8282/webview/. The 1991 Census covered the main territory of the Re-public of South Africa, while the “homelands” of Transkei, Bophuthatswana, Venda and Ciskei have been surveyedseparately. The dataset we have used for the construction of our instrument is the result of the merger of the maindata covering South Africa with the files for Bophuthatswana, Venda and Ciskei. Since Statistics South Africa doesnot make the data file for the Transkei available, we imputed data for this district.
22In particular the “Abolition of Passes and Consolidation of Documents Act” and the “Native Laws AmendmentAct” of 1952. See also footnote 25 for more details.
13

severely limited the ability of non–whites to relocate from the rural areas to the cities to look for
employment, and these measures continued to be enforced until the very end of the Apartheid
period. Thus, under the Apartheid regime, (black) migrant workers were not free to choose,
according to economic incentives, where to locate within South Africa. Historical evidence also
shows that the government’s choice of locations where non-whites were allowed to live was in general
driven by political/racial as opposed to economic determinants. Second, the end of Apartheid
marked a sharp discontinuity not only in terms of social institutions, but also in terms of the
performance of the South African economy.23 As argued by Du Plessis and Smit (2009), in the
decade before the end of the Apartheid regime (1985-1994) per capita GDP in South Africa shrank
at an annual rate of 1.3 percent, whereas in the decade that followed the end of Apartheid (1995-
2004) it grew at an annual rate of 1.1 percent. Furthermore, real GDP per capita shrank by over
3.5 percent in 1991, while it grew by about 2 percent in 1996. In their analysis of the geographic
distribution of economic activities in the post-1994 period, Bosker and Krugell (2008) emphasize
the presence of a “heavily diverging regional income distribution...” (page 517) in South Africa in
that period. Thus, the evidence from the literature seems to suggest that the end of Apartheid
implied a structural break in the economy of the country and that the pattern of economic activity
across districts changed substantially after 1994. Finally, to further assess the validity of our
exclusion restriction, we have also directly used the information available in the Census data,
looking at the male employment rate in 1991, 1996 and 2001 at the district level. We find evidence
of little correlation over time. More specifically, running a simple linear regression we find that
the correlation between employment in, respectively, 1991 and 1996 (or, between employment in
1991 and 2001) equals 0.003 (0.000) and is not statistically significant. All this evidence makes
us confident that the distribution of migrants in South Africa’s districts in 1991 is not correlated
with the economic conditions prevailing in those districts in 1996 or 2001.
We extend the analysis of Table 4 by implementing the IV strategy. Note that the construction
of both Mot and τoit requires information on the country of origin of the immigrant, which in our
data is only available for 1996 and 2001. This forced us to restrict our IV analysis to only these
two years.24 The first column of Table 5 presents the first-stage regression and shows that the
shift-share instrument is a strongly significant predictor of the distribution of immigrants across
South African districts in 1996 and 2001. The F-statistic is 24 and suggests that the instrument
is strong. Regressions (1) through (3) of Table 5 report the second-stage results for the effect of
immigration on natives’ employment rates, whereas columns (4) to (7) contain the findings for
23See for instance the essays in Aron, Kahn, and Kingdon (2009).24We first replicated the fixed effects estimates but using only the two years of data, i.e. 1996 and 2001. We did
so to have a benchmark for the IV estimates. We could see that the sign, significance levels and actual magnitudesof the estimated impact of immigration on native employment and income, respectively, were hardly affected whenwe focus on only two years of data, rather than on the full sample. Results are available upon request.
14

income.
We find that immigration has a negative and significant impact on natives’ total employment
rate and that this effect is driven by the impact on the share of employees, whereas the effect on
the share of self–employed is not significant. As for the impact on total employment, our results
in column (1) indicate that an increase by 10 percentage points in the labor supply of a skill
group, brought about by immigration in a given district, leads to a 4.7 percentage points decrease
in natives’ employment rate. For example, the average percentage point increase – between 1996
and 2007 – in migration rates of university–educated migrants with 31–40 years of labor market
experience, which is equal to approximately seven percentage points, implies a 3.2 percentage points
decline in natives’ employment rate. Overall, the IV estimates for the impact of immigration on
employment rates are larger in absolute value than the fixed effect ones (compare regressions in
Table 5 to regressions in Table 4), suggesting that the fixed-effects estimates are biased towards
zero. The direction of the bias is therefore consistent with the idea that immigrants cluster in
economically stronger locations. In columns (4) to (7) we run the analysis for income. The results
confirm what we have already identified in the fixed effect estimations: there is no statistically
significant effect of immigration on income.
Before discussing the possible mechanisms behind the IV result, we further explore the impact of
immigration on native employment by considering subsamples of the data built along two important
dimensions. This allows us to examine weather there are heterogenous effects of immigration on
natives across different groups and to highlight the robustness of our findings in Table 5.
First, we investigate whether immigration had a different impact on different racial groups
of natives. Ethnicity and race have played an important role in South African history and, in
particular, in the functioning of the country’s labor market, at least since the introduction in the
early fifties of measures that formally limited the ability of non-white citizens to move freely across
the country in search for employment.25 The fall of Apartheid and the subsequent introduction
of affirmative action measures – contained in the Black Economic Empowerment (BEE) Laws
promoted by the Mandela government – completely changed the opportunities of the different
racial groups within the labor market. In addition, the racial composition in South Africa has
been affected by immigration since immigrants and natives differ substantially from a racial point
of view. In particular, the growing attractiveness of post Apartheid South Africa as a destination
for South–South migrants has led to a substantial decline in the relative importance of whites
among the foreign born. For all these reasons we focus our analysis on different racial groups
25The two most important measures are the cynically entitled “Abolition of Passes and Consolidation of Docu-ments Act” of 1952 and the “Native Laws Amendment Act” of the same year. To enjoy the right of permanentresidence in a city – the notorious Section 10 right – a man had to have been born in the town or have workedcontinuously for the same employer for the past ten years, or for different employers for the past fifteen years. Thosewho violated this measure could be “endorsed out” of the urban area to the reserves which had been designated forthem by court order. See Ross (2008).
15

of natives. Second, since the skill distribution of immigrants differs substantially from that of
natives (see section 3), it is interesting to study whether the labor market effects of immigration
are heterogeneous across different skill groups.
We start by investigating whether the impact of immigration varies when we focus on different
racial groups. We classify native born workers to be White, Black/Coloured or Asian.26 Our
results are reported in Tables 6. The specifications in this table use the same observations as in
our main regressions except for the fact that the value of the dependent variable is different, since
it now captures race-specific employment rates or income for natives.27 In particular, in the first
panel of Table 6 we look at the effect of immigration on race-specific employment rates, whereas
in the second panel of Table 6 we focus on race-specific total income. Our findings in Table 6
suggest that immigration has a negative effect on Whites and Blacks/Coloured employment rates,
whereas there is no effect on the Asian subgroup. However, for the Asian subsample we cannot
draw strong conclusions since the F-statistic of that regression is very low (6.956).28 The results in
the second panel confirm that, at the district level, immigration does not have a significant effect
on natives’ incomes for any of the South African racial groups.
Last, we investigate the role of immigration on different skill groups of natives. In Table 7,
we use the same observations as in columns (1)-(3) of Table 5, but we consider four subsamples,
corresponding to each of the four education levels. In column 1 we focus on natives with less than
primary education completed, whereas in columns 2–4 we look at those who have completed, re-
spectively, less than a secondary education, a secondary education plus some college or a university
degree and above. The pattern that emerges from the Table is that the average effect of immi-
gration on the employment rate of natives is driven by unskilled and skilled workers, on which
immigrants have statistically similar effects. On the other subgroups the effect is insignificant,
although for individuals with less than secondary education completed we cannot draw strong
conclusions since the F-statistic of that regression is very low (2.480).29 In the second panel of
Table 7 we explore whether there is instead a heterogeneous effect of immigration on the total
income of natives of different education levels. As for all our results, we do not find a significant
impact of immigration on natives’ total income levels, no matter what educational segment of the
26This ethnic classification, based on race, is inherited from the Apartheid era and has been retained by the SouthAfrican Statistical Office for historical comparison purposes. Yet, the reader should be aware that South Africa isa setting with a more complex social cleavage structure that goes beyond racial traits.
27Compared to our main regressions, the number of observations is now lower because not in all skill/district cellswe observe all the different racial groups. Skill/district cells in which a specific group does not exist will not enterour sample.
28Note though that the three coefficients are not statistically different from each other. In particular, a t-test fordifference in coefficients between the White and Black/Coloured subsamples gives a p-value = 0.314; a t-test fordifference in coefficients between the White and the Asian subsamples gives a p-value = 0.231; a t-test for differencein coefficients between the Black/Coloured and the Asian subsamples gives a p-value = 0.382.
29In particular, a t-test for difference in coefficients in the less than primary and college education gives a p-value= 0.297.
16

labor market we consider.
Before concluding, we have taken a series of steps to address the potential undercount of illegal
migrants, which for a developing country like South Africa, might be a concern. First, the estimates
obtained above while focusing on skilled migration are especially comforting since they show that
a negative and significant effect of migration takes place in a sample where illegal migration, and
thus measurement error, is unlikely to be a concern. Second, to provide additional evidence that
our results are not qualitatively affected by the potential undercount of illegal migrants, we run
a specification which excludes from the sample all those districts at the border with Botswana,
Mozambique, Namibia, Swaziland, Zimbabwe and Lesotho, which are more likely to be affected by
the presence of illegal immigrants. Table ?? reports the results. Across all models, our findings
are consistent with results reported in our benchmark specification of Table 5. Additionally, all
the estimates are both statistically and economically similar to the benchmark analysis. While we
cannot exclude that illegal immigration is present in our data, the evidence presented in Table ??
suggests that the undercount of illegal migrants is unlikely to affect our main conclusions.30
The main message that emerges from the IV analysis is that at the district level immigration
has a negative and significant effect on natives’ employment rates, whereas there is no impact
of immigration on income. Moreover, the average negative effect on natives’ employment rates
is driven by a reduction in share of employees in total employment, whereas the share of self-
employed natives is not significantly affected by immigration. Additionally, these findings highlight
similarities in the labor market adjustment process across different race and education groups.
6 Estimates at the national-level
The analysis we have carried out so far does not allow us to disentangle the channel through which
natives react to the arrival of immigrants. First, the impact of immigration on natives’ employment
rates may be direct, i.e. the arrival and hiring of immigrants may lead natives to lose their jobs. A
second possible mechanism is represented by the indirect effect of immigration on native workers’
employment rate through their displacement from the formal to the informal labor market. A third
possibility is represented by the indirect effect of immigration through the relocation of natives
from high-immigration districts to low-immigration ones: To the extent that employed natives are
more likely to leave than unemployed ones, natives’ outflows reduce natives’ employment rates.
Another explanation would suggest instead that immigration causes native workers to leave South
30As pointed out by a referee, an additional source of concern is that young and low skilled immigrants mightbe undercounted in the South African census. To address this concern, we have run a series of robustness checks,in which we exclude from the sample those skill-district cells which are arguably more likely to be affected bymeasurement error. In particular, we dropped from the analysis very low skilled individuals, i.e. those with lessthan primary education and less than 5 years of experience. Our findings are qualitatively consistent with thebenchmark results, and are available from upon request from the authors.
17

Africa, and relocate abroad. A priori all these mechanisms are consistent with our main findings.
In order to shed light on the several possible channels, we use the theoretical framework recently
developed by Borjas (2006) to link the local and national labor market effects of immigration. The
goal of his analysis is to investigate whether the reaction of natives to the arrival of immigrants in
a local labor market can explain the contrasting results which have been obtained in the literature,
namely that the wage effect of immigration is very small or nil in most spatial correlation studies,
whereas in several national-level analyses these effects have been found to be negative and signif-
icant. The main idea of the model is that, by depressing local wages, the arrival of immigrants
in a particular labor market will induce an outflow of native workers to other labor markets, less
affected by the phenomenon. In what follows we will summarize the main building blocs of Borjas’
analysis, and refer the reader to the original paper for the details of the derivations.
Formally, consider a local labor market j, in which individuals characterized by a skill level i
operate at time t. Labor demand is given by a simple constant elasticity function with a factor
price elasticity η < 0. Let Nijt be the number of native workers active in that labor market at
time t and consider a scenario in which at each time period t, a cell ij receives a migrant influx
Mijt = Mij, which is assumed to continue to occur in every subsequent period t. Following the
arrival of immigrants in a given labor market, the local wage will decline instantaneously, and
differences in wages across local labor markets will lead to native internal migration. The native’s
reaction to factor price differences across local labor markets occurs with a one period delay, and
the native labor supply elasticity is given by σ > 0.31 Solving the model, and in particular taking
into account the dynamic response of employment and wages to the shocks, leads to the two key
equations describing respectively the (log) stock of native workers employed in the cell and the
corresponding (log) wage, i.e.:
logNijt = logNij,−1 + [(1 + ησ)t+1 − 1]λij (3)
+
[t
t+ 1+
(1 + ησ)
ησ
1− (1 + ησ)t
(t+ 1)
]mit
−[
t
t+ 1+
(1 + ησ)
ησ
1− (1 + ησ)t
(t+ 1)
]mijt
where λij = log(
Nij,−1
N∗i
), N∗
i is the number of native workers in skill group i that would live in
each region in the long run equilibrium, mit = (t+1)mi, mijt = (t+1)mij, mij =Mij
Nij,−1, mi = Mi
Ni,−1
and
logwijt = logwij,−1 + η[(1 + ησ)t+1 − 1]λij (4)
+ η
[t
t+ 1+
(1 + ησ)
ησ
1− (1 + ησ)t
(t+ 1)
]mit
31See Borjas (2006) for additional details.
18

+ η
[1
t+ 1+
(1 + ησ)
ησ
1− (1 + ησ)t
(t+ 1)
]mijt
The first two terms in each equation highlight the role of the initial conditions. The following
two lines show how native employment and wages adjust to the presence of immigrants. Consider
the impact of the region specific shock mijt. In the very long run (t → ∞) the coefficient in
the native employment equation converges to -1, whereas the coefficient in the wage equation
converges to 0. In other words, as time between the arrival of immigrants and the measurement of
the variables increases, native migration behavior tends to completely neutralize the local supply
shock brought about by immigration, and makes it less likely that the analysis based on spatial
correlations will be able to detect any effect on wages.
After simplifying the expressions (see Borjas (2006) for details) equations 3 and 4 can be
brought to the data as follows:
logNijt = logNij,−1 + ησλij + ησ(tλij)− ησmit + ησmijt (5)
logwijt = logwij,−1 + η2σλij + η2σ(tλij)− η2σmit + η2σmijt (6)
Remember that η < 0 and σ > 0, and assume as in Borjas (2006) that 0 < (1 + ησ) < 1. As
a result, the spatial correlation (i.e. the coefficient on mijt) estimated in the native employment
equation becomes more negative the higher is σ, whereas the spatial correlation in the wage
equation becomes instead less negative the higher is σ. Furthermore, assume that the supply
elasticity σ is larger when migration is less costly, i.e. when the labor market is geographically
small. It follows that the spatial correlation between native employment and the immigrant stock
variable “will be more negative when the model is estimated using geographically smaller labor
markets, and that the spatial correlation between the wage and immigrant stock variable will be
more negative for larger labor markets.” (Borjas (2006), page 229). This is the basic prediction
we assess in our analysis.
To this end, we have replicated the fixed effect estimates focusing on the national labor market.
Using three years, and retaining our definition of skill, we now have a total of 84 observations (3
x 28). The OLS national-level results on employment are reported in columns (1) to (3) of Table
8, whereas those on income appear in columns (4) to (7) of the same table. Since the national-
level estimates are not affected by the same source of endogeneity bias altering the district-level
ones, we compare the national-level results with the IV estimates at the district-level. By looking
at Table 5 and Table 8, we see that, while at the local level the impact of immigration on the
native employment rate and on share of employees is significant, this is no longer the case at the
national level. In addition, the estimated effect at the national level on the share of self employed
natives is significant but positive, while it was insignificant at the local level. Looking at the
19

effect of migration on income, we observe the opposite pattern: in our local level analysis, we
did not uncover a significant impact of immigration on incomes, whereas at the national level we
find a negative and significant effect (except for self-employed natives). While the former result
could be due to measurement error,32 the patterns we observe when moving to the national level
suggests that these findings are compatible with employed native workers reacting to the arrival
of immigrants in their district by moving into self-employment and to different geographic areas
less affected by the phenomenon, as predicted by Borjas’ (2006) model.
Additionally, we can directly explore the impact of immigration on natives’ outflows using as
the dependent variable the (log) size of the native population in a given cell (see also Borjas 2006)
– given that unfortunately we do not have information on previous location at the district level.
We find evidence consistent with natives’ outflows as a consequence of migration when we run
both OLS and IV district-level regressions (see column (1) in Table 9). In columns (2) and (3)
we investigate whether natives’ outflows due to migration are larger for employed vs. unemployed
individuals. We find that employed natives are more likely than unemployed ones to leave a high-
migration district, which is consistent with natives’ employment rates being reduced by migration.
Thus our main results - negative local employment effects and large national wage effects - can be
interpreted as being due to mostly employed natives leaving the cell. In other words, the local IV
employment effects reflect selection,33 specifically the natives who move out are a selected sample
of natives in the district. At the same time, the lack of an effect on the employment rate of natives
at the national level suggests that employed natives who leave the district find a job in another
district.
7 Conclusions
In this paper we carry out what is, to the best of our knowledge, the first systematic study
of the labor market effect of immigration to South Africa in the post–Apartheid era. We start
by documenting how immigration is becoming more and more important for the country and
highlight that, as a share of the population, immigration has increased by about 45% over the
period considered in our analysis. Next, we show that immigrants to South Africa are at least as
educated as natives and that highly educated foreign individuals are especially important at the
very top of the skill distribution.
We then study the labor market effect of immigration, looking at its impact on both natives’
employment rates and incomes. Our fixed effects, district–level, OLS analysis suggests that neither
the employment rates of natives nor income have been adversely affected by the arrival of foreign
32Remember that our income variable is measured in intervals.33We would like to thank one of the referees for suggesting this interpretation.
20

workers. As migration is likely to be endogenous, we take advantage of a quasi–experimental
setting brought about by the fall of the Apartheid regime to construct an instrument for migration
rates and show that our OLS estimates are biased. In the IV estimates we find that migration has
a negative and significant effect on employment rates - except on self-employment rates where the
estimate is insignificant - and no effect of income. Given the unique history of South Africa, we
also explore the effect of migration on different segments of the population, defined on the basis
of both skill and race. Our findings suggest that the negative impact of immigration on natives’
employment broadly persists across racial and skill groups.
To gain further insights on the various mechanisms through which natives react to immigrant
inflows, we have complemented our district level analysis with an investigation at the national
level. At the national level, we find on average no impact of immigration on natives’ employment
rates, and a negative and significant effect on total income. We also find heterogenous results
for immigration across different types of workers (i.e. employees vs. self-employed). The impact
of immigration on natives’ self–employment rates is positive and significant in the national-level
regressions. These results suggest that the observed reduction in natives’ employment rates at the
district level is likely to be the result of natives’ outflows from high-immigration to low-immigration
districts (as in Borjas 2006) and of the relocation of natives from the formal to the informal labor
market.
21

Figures
Figure 1: Stock of foreign born in the total population, 1996-2007
0
0
0.005
.005
.005.01
.01
.01.015
.015
.015.02
.02
.02.025
.025
.025.03
.03
.03.035
.035
.0350
0
0200
200
200400
400
400600
600
600800
800
8001000
1000
10001200
1200
12001996
1996
19962001
2001
20012007
2007
2007Total (in 1000)
Total (in 1000)
Total (in 1000)Share
Share
Share
Figure 2: Stock of foreign born in the male labor force, 1996-2007
0
.01
.02
.03
.04
.05
.06
.07
0
100
200
300
400
500
600
1996 2001 2007
Total (in 1000)Share
22

Figure 3: Scatter plots immigration and native’s labor market outcomes
-1
-.5
0
.5
1
-1 -.5 0 .5 1
Inter-censual Change in Immigrant Share
Inter-censual Change in the Employment RateFitted values
(a) Employment Rates
-.2
-.1
0
.1
.2
.3
-1 -.5 0 .5 1
Inter-censual Change in Immigrant Share
Inter-censual Change in (Log)IncomeFitted values
(b) Income (in logs)
23

Tables
Table 1: Migrants by country of origin
1996 2001
All migrants Male labor force All migrants Male labor force
Stock Rates Stock Rates Stock Rates Stock Rates
AFRICA 541,028 0.646 267,188 0.753 728,143 0.710 344,351 0.794
Eastern Africa 328,679 0.393 160,930 0.453 342,780 0.334 243,356 0.561
Malawi 11,409 0.010 5,227 0.015 26,662 0.030 14,584 0.034
Mozambique 206,707 0.250 112,695 0.318 269,872 0.260 155,156 0.357
Zambia 15,540 0.020 5,229 0.015 23,985 0.020 7,745 0.018
Zimbabwe 82,653 0.100 34,256 0.097 132,149 0.130 58,176 0.134
Middle Africa 13,160 0.016 4,047 0.011 156,709 0.153 9,238 0.021
Nothern Africa 2,116 0.003 628 0.002 4,015 0.004 1,409 0.003
Southern Africa 185,137 0.221 96,762 0.273 179,781 0.175 83,244 0.192
Botswana 11,897 0.010 6,951 0.020 18,022 0.020 6,245 0.014
Lesotho 114,933 0.140 68,967 0.194 116,354 0.110 50,487 0.116
Namibia 32,733 0.040 8,088 0.023 45,355 0.040 13,573 0.031
Swaziland 25,574 0.030 12,756 0.036 32,524 0.030 12,940 0.030
Western Afrcia 4,390 0.005 1,545 0.004 43,311 0.042 7,026 0.016
AMERICA 14,730 0.018 4,097 0.012 12,568 0.012 5,182 0.012
ASIA 29,083 0.035 8,435 0.024 48,496 0.047 15,152 0.035
EUROPE 216,234 0.258 63,736 0.180 226,838 0.221 68,913 0.159
United Kingdom 120,521 0.140 35,399 0.100 128,875 0.130 38,172 0.088
Germany 19,103 0.020 5,322 0.015 24,408 0.020 6,221 0.014
Portugal 14,488 0.020 5,678 0.016 19,513 0.020 7,372 0.017
OCEANIA 4,257 0.005 1,208 0.003 4,531 0.004 4,435 0.001
NS/NR 32,229 0.039 10,232 0.029 0 0.000 0 0.004
Source: Census data, 1996 and 2001.Male labor force includes only male migrants, 16-65 years old, in the labor force.Rates are calculated as the number of immigrants from each specific country/region, over the total numberof immigrants.
24

Table 2: Ethnic Composition
Natives Migrants
Total Men Women Total Men Women
Stock Rate Stock Rate Stock Rate Stock Rate Stock Rate Stock Rate
1996
White 1,733,793 12.41 979,277 13.33 754,516 11.39 211,625 38.43 123,693 31.07 87,932 57.63
Black/Coloured 11,716,448 83.86 6,050,250 82.37 5,666,199 85.52 323,716 58.78 263,184 66.10 60,532 39.67
Asian 412,073 2.95 258,710 3.52 153,363 2.31 10,836 1.97 7,885 1.98 2,951 1.93
Unknown 108,568 0.78 56,677 0.77 51,891 0.78 4,555 0.83 3,394 0.85 1,161 0.76
2001
White 1,798,264 10.13 995,084 10.93 803,179 9.29 227,165 33.4 131,446 28.10 95,719 45.08
Black/Coloured 15,478,997 87.2 7,820,187 85.89 7,658,811 88.54 435,229 64.0 322,969 69.03 112,260 52.87
Asian 477,451 2.69 289,201 3.18 188,250 2.18 17,758 2.61 13,424 2.87 4,333 2.04
2007
White 1,884,617 10.95 1,009,837 11.56 803,179 10.31 216,293 26.29 122,794 21.6 93,499 36.63
Black/Coloured 14,825,352 86.1 7,429,389 85.07 7,658,811 87.17 570,686 69.38 416,536 73.4 154,151 60.39
Asian 507,948 2.95 293,725 3.36 188,250 2.52 35,596 4.33 27,984 4.93 7,612 2.98
Note: the reference sample for calculating rates is the weighted working age population (16-65) in the labor force.Rates are calculated as the number of natives/immigrants by race, over the total number of natives/immigrants.
25

Table 3: Migration share by education and ex-perience (skill cell, 15-65 male lab force pop)
Education Years of
experience 1996 2001 2007
Less than primary 1 - 5 0.0586 0.0736 0.0691
6 - 10 0.0587 0.0893 0.1065
11 - 15 0.0576 0.0776 0.125
16 - 20 0.0563 0.0565 0.0945
21 - 25 0.0616 0.0522 0.0794
26 - 30 0.0656 0.0493 0.0743
31 - 40 0.0535 0.0459 0.0758
Primary completed 1 - 5 0.0496 0.0447 0.0406
6 - 10 0.0393 0.0571 0.0571
11 - 15 0.0415 0.0526 0.0692
16 - 20 0.0373 0.0462 0.0687
21 - 25 0.0356 0.0409 0.0638
26 - 30 0.0353 0.0368 0.0534
31 - 40 0.0332 0.0337 0.0489
Secondary completed 1 - 5 0.0227 0.0234 0.0252
6 - 10 0.0302 0.0327 0.0413
11 - 15 0.0448 0.0402 0.0457
16 - 20 0.0543 0.055 0.0451
21 - 25 0.0695 0.0632 0.0637
26 - 30 0.0987 0.0874 0.0695
31 - 40 0.1389 0.1563 0.1123
University completed 1 - 5 0.0719 0.0726 0.1037
6 - 10 0.0929 0.0927 0.1063
11 - 15 0.0946 0.127 0.1085
16 - 20 0.11 0.1416 0.1271
21 - 25 0.1256 0.1654 0.1435
26 - 30 0.1417 0.1852 0.1646
31 - 40 0.1478 0.2498 0.2113
Migration shares are calculated as the share of immigrants ineach skill group, over the total male population, age 15-65 inthe labor force.
26

Table 4: The labor market effect of immigration on natives employment and income (district level, 1996, 2001, 2007)
EMPLOYMENT INCOME
(1) (2) (3) (4) (5) (6) (7)
(E+SE+Oth)/LF E/LF SE/LFLog total income
(LF)Log tot income(E+SE+Oth)
Log tot income(E)
Log tot income(SE)
Migration share 0.0255 0.0648 –0.0004 –0.1496 –0.0716 –0.0611 0.1480
(0.0434) (0.0506) (0.0317) (0.1406) (0.1392) (0.1421) (0.4664)
Constant 0.7264*** 0.5725*** 0.0844*** 9.6146*** 9.6272*** 9.6345*** 9.6677***
(0.0026) (0.0028) (0.0017) (0.0074) (0.0074) (0.0076) (0.0246)
Skill, year and districtand any two-way in-teraction FE
Yes Yes Yes Yes Yes Yes Yes
R-squared 0.98 0.96 0.92 0.99 0.99 0.99 0.92
N 4681 4681 4681 4671 4671 4638 4239
Standard errors clustered at the skill-district level in parethesis. All regressions are weighted by the labor force population in each skill-districtgroup.Notes: The estimation sample includes the working age (16-65) male labor force population. E = employed natives in the cell, SE =self-employed natives in the cell, Oth = natives in the cell employed in other active catogories (unpaid/others), LF = natives in the laborforce in the cell. Hence, the dependent variable in column (1) measures the native employment rate; the dependent variable in column (2)measures the shares of native employees in the labor force; the dependent variable in column (3) measures the share of native self-employedin the labor force, and columns (4)-(7) capture average native household income for each of these groups.
27

Table 5: The labor market effect of immigration on natives employment and income, IV estimates (district level, 1996, 2001)
EMPLOYMENT INCOME
(1) (2) (3) (4) (5) (6) (7)
First stage (E+SE+Oth)/LF E/LF SE/LFLog total income
(LF)Log tot income(E+SE+Oth)
Log tot income(E)
Log tot income(SE)
Migration share –0.4738** –0.4632** –0.0455 –0.8809 –0.7024 –0.4879 –2.6052
(0.1843) (0.2018) (0.0759) (0.5738) (0.5721) (0.5613) (2.6629)
IV 0.2481***
(0.0499)
F-test instrument 24.695
p-value 0.000
Skill, year and districtand any two-way in-teraction FE
Yes Yes Yes Yes Yes Yes Yes Yes
N 3108 3108 3108 3108 3100 3100 3068 2804
Standard errors clustered at the skill-district level in parethesis. All regressions are weighted by the labor force population in each skill-district group.Notes: The estimation sample includes the working age (16-65) male labor force population. E = employed natives in the cell, SE = self-employednatives in the cell, Oth = natives in the cell employed in other active catogories (unpaid/others), LF = natives in the labor force in the cell. Hence, thedependent variable in column (1) measures the native employment rate; the dependent variable in column (2) measures the shares of native employeesin the labor force; the dependent variable in column (3) measures the share of native self-employed in the labor force, and columns (4)-(7) captureaverage native household income for each of these groups.
28

Table 6: The labor market effect of immigration on natives em-ployment and income by ethnicity, IV estimates years 1996-2007
EMPLOYMENT: (E+SE+Oth)/LF
White Black/Coloured Asian
Migration share –1.5735* –0.5933*** 1.4818(0.9494) (0.2130) (2.3658)
R-squared 0.09 0.80 0.27N 2378 2966 1070Education, experi-ence, year and anytwo-way interactionFE
Yes Yes Yes
INCOME: LF
White Black/Coloured Asian
Migration share –5.1284 –1.0266 –9.3044(6.7583) (0.6746) (11.2802)
R-squared 0.39 0.71 0.43N 2330 2954 1016Education, experi-ence, year and anytwo-way interactionFE
Yes Yes Yes
First stage
Instrument 0.2196*** 0.2420*** 0.2268***(0.0544) (0.0502) (0.0784)
F 1st stage 13.640 23.204 6.956R-squared 0.56 0.60 0.63N 2378 2966 1070
Standard errors clustered at the skill-district level in parethesis.All regressions are weighted by the labor force population in eachskill-district group.Notes: The estimation sample includes the working age (16-65)male labor force population. E = employed natives in the cell,SE = self-employed natives in the cell, Oth = natives in the cellemployed in other active catogories (unpaid/others), LF = nativesin the labor force in the cell. Hence, the dependent variable inthe first panel measures the native employment rate by race; thedependent variable in the second panel measures average householdincome of natives in the labor force by race.
29

Table 7: The labor market effect of immigration on natives employment and income by level of education, IV estimates(district level, 1996, 2001)
EMPLOYMENT: (E+SE+Oth)/LF
Less than primaryeducation
Less than secondaryeducation completed
Secondary educationcompleted
University education andabove
Migration share –0.4585*** –1.3289 0.4595 –0.2781**(0.1158) (1.1140) (0.4451) (0.1285)
R-squared 0.82 0.91 0.89 0.48N 784 784 784 756Education, experience,year and any two-wayinteraction FE
Yes Yes Yes Yes
INCOME: LF
Less than primaryeducation
Less than secondaryeducation completed
Secondary educationcompleted
University education andabove
Migration share –0.6502 –2.2375 0.8548 –0.8069(0.4597) (2.5692) (1.6930) (0.5796)
R-squared 0.80 0.84 0.85 0.84N 784 784 784 748Education, experience,year and any two-wayinteraction FE
Yes Yes Yes Yes
First stage
Instrument 0.3572*** 0.1526 0.3553*** 0.6543***(0.0479) (0.0969) (0.1041) (0.1436)
F 1st stage 55.679 2.480 11.658 20.735R-squared 0.81 0.80 0.46 0.54N 784 784 784 756
Standard errors clustered at the skill-district level in parethesis. All regressions are weighted by the labor force population in each skill-districtgroup.Notes: The estimation sample includes the working age (16-65) male labor force population. E = employed natives in the cell, SE = self-employed natives in the cell, Oth = natives in the cell employed in other active catogories (unpaid/others), LF = natives in the labor force inthe cell. Hence, the dependent variable in the first panel measures the native employment rate by education group; the dependent variable inthe second panel measures average household income of natives in the labor force by education group.
30

Table 8: The labor market effect of immigration on natives employment and income (national level) years 1996-2007
EMPLOYMENT INCOME
(1) (2) (3) (4) (5) (6) (7)
(E+SE+Oth)/LF E/LF SE/LFLog total income
(LF)Log tot income(E+SE+Oth)
Log tot income(E)
Log tot income(SE)
Migration share 0.3436 –0.0643 0.4030*** –2.5824** –2.5634** –2.5547*** –2.9809
(0.2055) (0.2032) (0.1383) (0.9853) (0.9536) (0.8523) (2.4239)
Constant 0.7093*** 0.5774*** 0.0646*** 9.7361*** 9.7504*** 9.7570*** 9.8197***
(0.0103) (0.0101) (0.0069) (0.0497) (0.0478) (0.0431) (0.1196)
Skill, year and districtand any two-way in-teraction FE
Yes Yes Yes Yes Yes Yes Yes
R-squared 1.00 1.00 0.99 1.00 1.00 1.00 1.00
N 84 84 84 84 84 84 84
Standard errors clustered at the skill-district level in parethesis. All regressions are weighted by the labor force population in each skill-districtgroup.Notes: The estimation sample includes the working age (16-65) male labor force population. E = employed natives in the cell, SE =self-employed natives in the cell, Oth = natives in the cell employed in other active catogories (unpaid/others), LF = natives in the laborforce in the cell. Hence, the dependent variable in column (1) measures the native employment rate; the dependent variable in column (2)measures the shares of native employees in the labor force; the dependent variable in column (3) measures the share of native self-employedin the labor force, and columns (4)-(7) capture average native household income for each of these groups.
31

Table 9: The effect of immigration on natives mobility years 1996-2007
(1) (2) (3)
LF (E+SE+Oth) U
PANEL A: OLS District Level
Migration share –0.7917*** –0.7569*** –0.6013*(0.1541) (0.1847) (0.3471)
Education, experi-ence, year and anytwo-way interactionFE
Yes Yes Yes
R-squared 0.99 0.99 0.98N 4683 4683 4683
PANEL B: IV District Level
Migration share –5.7238*** –6.2934*** –3.1083***(1.2543) (1.3021) (1.1970)
Education, experi-ence, year and anytwo-way interactionFE
Yes Yes Yes
R-squared 0.79 0.65 0.81N 3112 3112 3112
Standard errors clustered at the skill-district level in parethesis.All regressions at the district level are weighted by the labor forcepopulation in each skill-district group.Notes: The estimation sample includes the working age (16-65)male labor force population. E = employed natives in the cell,SE = self-employed natives in the cell, Oth = natives in the cellemployed in other active catogories (unpaid/others), LF = nativesin the labor force in the cell. Hence, the dependent variable incolumn (1) measures the stock of natives in the labor force in eachcell; the dependent variable in column (2) measures the stock ofactive natives in each cell; the dependent variable in column (3)measures the stock of unemployed natives in each cell.
32

References
Aron, J., B. Kahn, and G. Kingdon (Eds.) (2009). South African economic policy after democ-
racy. Oxford: Oxford University Press.
Barone, G., A. D’Ignazio, G. De Blasio, and P. Naticchioni (2016). Mr. Rosssi, Mr. Hu and
politics: The role of immigration in shaping natives’ voting behavior. Journal of Public
Economics 136, 1–16.
Bartel, A. P. (1989). Where do the new U.S. immigrants live? Journal of Labor Economics 7,
371–391.
Bhorat, H., J.-B. Meyer, and C. Mlatsheni (2002). Skilled labor migration from developing
countries: Study on South and Southern Africa. International Migration Papers 52.
Borjas, G. J. (2003). The labor demand curve is downward sloping: Reexamining the impact of
immigration on the labor market. The Quarterly Journal of Economics 40, 1335–1374.
Borjas, G. J. (2006). Native international migration and the labor market impact of immigration.
Journal of Human Resources 41, 221–258.
Bosker, M. and W. Krugell (2008). Regional income evolution in South Africa after Apartheid.
Journal of Regional Science 48, 493–523.
Card, D. (2001). Immigrant inflows, native outflows, and the local labor market impacts of
higher immigration. Journal of Labor Economics 19, 22–64.
Cortes, P. (2008). The effect of low skilled immigration on US prices: Evidence from CPI data.
Journal of Political Economy 116, 381–422.
Cortes, P. and J. Pan (2013). Foreign nurse importation and the supply of native nurses. mimeo,
Boston University.
Crush, J. (1999). The discourse and dimension of irregularity in post-Apartheid South Africa.
International Migration 37, 125–151.
Crush, J. (2000). Migrations past: An historical overview of cross–border movement in South-
ern Africa. In D. McDonald (Ed.), On borders: Perspectives on international migration in
southern Africa, pp. 12–24. New York: St. Martin’s Press.
Crush, J. and V. Williams (2010). Labor mmigration trends and policies in Southern Africa.
Policy Brief 23.
Department of Labour (2007). Labour migration and south africa: Towards a fairer deal for
migrants in the South African economy. Government Printer.
33

Du Plessis, S. and B. Smit (2009). South Arica growth revival after 1994. In J. Aron, B. Kahn,
and G. Kingdon (Eds.), South African economic policy after democracy, pp. 28–56. Oxford:
Oxford University Press.
Friebel, G., J. Gallego, and M. Mendola (2013). Xenophobic attacks, migration intentions and
networks: Evidence from the South of Africa. Journal of Population Economics 26, 555–591.
Gindling, T. (2009). South-South migration: The impact of Nicaraguan immigrants on earnings,
inequality and poverty in Costa Rica. World Development 37, 116–126.
Giuntella, O. and F. Mazzonna (2015). Do immigrants improve the health of natives? Journal
of Health Economics 43, 140–153.
Hatton, T. J. and J. Williamson (2005). What fundamentals drive world migration? In G. Borjas
and J. Crisp (Eds.), Poverty, International Migration and Asylulm, pp. 15–38. Hampshire,
United Kingdom: Palgrave–MacMillan.
ILO (2002). Women and men in the informal economy: a statistical picture. Geneva.
Landau, L. B. and A. W. K. Segatti (2009). Human development impacts of migration: South
Africa case study. Working Paper 2009/05.
Lucas, R. E. B. (2006). Migration and economic development in Africa: A review of evidence.
Journal of African Economies 15, 337–395.
McDonald, D. A. (2000). On borders. New York: St. Martin’s Press.
Mitaritonna, C., G. Orefice, and G. Peri (2017). Immigrants and firms’ outcomes: Evidence
from France. European Economic Review . forthcoming.
Munshi, K. (2003). Networks in the modern economy: Mexican migrants in the US labor market.
Quarterly Journal of Economics 118, 549–597.
Ottaviano, G. I. and G. Peri (2012). Rethinking the effects of immigration on wages. Journal of
the European Economic Association 10.
Ozden, C. and M. Wagner (2018). Immigrants versus natives? displacement and job creation.
mimeo, World Bank.
Peberdy, S. (2001). Imagining immigration: Inclusive identities and exclusive policies in post-
1994 South Africa. Africa Today 48, 15–32.
Peberdy, S. and J. Crush (1998). Rooted in racism: The origin of the Aliens Contriol Act. In
J. Crush (Ed.), Beyond control: Immigration and human rights in a democratic South Africa,
pp. 18–36. Cape Town: Idasa.
Phillips, B. (2002). Out of Lagos. In H. Holland and A. Roberts (Eds.), From Jo’Burg to Jozi,
Stories about Africa’s Infamous City, pp. 203–206. London: Penguin Books.
34

Ratha, D. and W. Shaw (2007). South–South migration and remittances. World Bank WP 102.
Ross, R. (2008). A Concise History of South Africa (Second ed.). Cambridge: Cambridge Uni-
versity Press.
Statistics South Africa (2012). Documented immigrants in South Africa. Discussion Document
D0351.4.
35
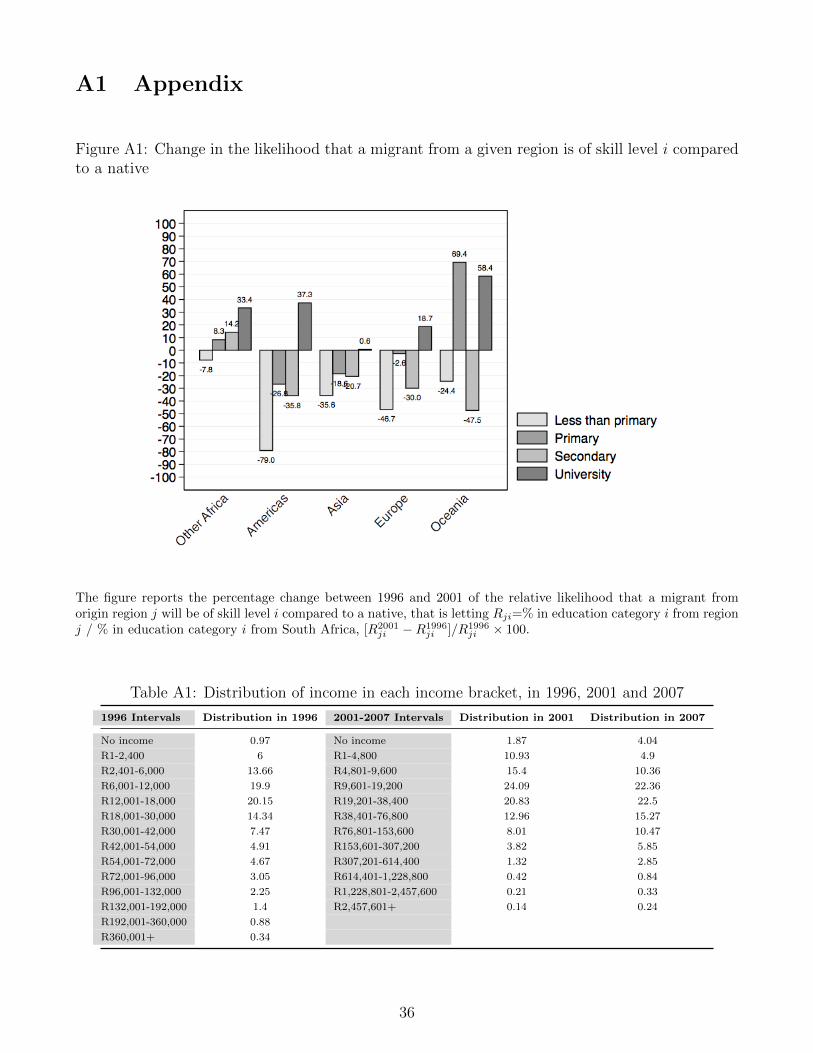
A1 Appendix
Figure A1: Change in the likelihood that a migrant from a given region is of skill level i comparedto a native
The figure reports the percentage change between 1996 and 2001 of the relative likelihood that a migrant fromorigin region j will be of skill level i compared to a native, that is letting Rji=% in education category i from regionj / % in education category i from South Africa, [R2001
ji −R1996ji ]/R1996
ji × 100.
Table A1: Distribution of income in each income bracket, in 1996, 2001 and 2007
1996 Intervals Distribution in 1996 2001-2007 Intervals Distribution in 2001 Distribution in 2007
No income 0.97 No income 1.87 4.04
R1-2,400 6 R1-4,800 10.93 4.9
R2,401-6,000 13.66 R4,801-9,600 15.4 10.36
R6,001-12,000 19.9 R9,601-19,200 24.09 22.36
R12,001-18,000 20.15 R19,201-38,400 20.83 22.5
R18,001-30,000 14.34 R38,401-76,800 12.96 15.27
R30,001-42,000 7.47 R76,801-153,600 8.01 10.47
R42,001-54,000 4.91 R153,601-307,200 3.82 5.85
R54,001-72,000 4.67 R307,201-614,400 1.32 2.85
R72,001-96,000 3.05 R614,401-1,228,800 0.42 0.84
R96,001-132,000 2.25 R1,228,801-2,457,600 0.21 0.33
R132,001-192,000 1.4 R2,457,601+ 0.14 0.24
R192,001-360,000 0.88
R360,001+ 0.34
36

Table A2: Summary Statistics: Household salary asa share of Tot. Income (LFS 2001)
Full Sample Employees Self-Employed
Mean 0.86 0.87 0.81
Median 0.95 0.96 0.93
N 10353 8225 1373
Table A3: Correlation between household salary and income (LFS2001)
INCOME
(1) (2) (3)
Full Sample Employees Self-Employed
Salary 0.994*** 0.992*** 0.994***
(0.001) (0.002) (0.002)
Constant 672.505*** 649.555*** 1028.47***
(28.938) (30.060) (119.042)
N 10353 8225 1373
Robust standard errors in parenthesis.Notes: The data is from the 2001 Labor Force Survey (LFS) andestimates are at the household level. The estimation sample includesall households (col. 1), households with an employee as the mainincome earner (col.2) and households with a self- employed as mainearner (col.3). The dependent variable is monthly household incomewhile the explanatory variable is monthly salary, both from the LFS.Province fixed effects are included as additional controls.
37

Table A4: Correlation between household salary and income at theskill/province level (IPUMS-LFS 2001, 2007)
INCOME
(1) (2) (3)
Full Sample Employees Self-Employed
Salary 0.741*** 0.934*** 0.266***
(0.023) (0.033) (0.020)
Constant 17009.170*** 7401.924*** 45822.73***
(4467.613) (5954.408) (6272.168 )
N 499 494 396
Robust standard errors in parenthesis.Notes: The data are from the 2001, 2007 Labor Force Survey (LFS)and IPUMS and estimates are at the skill/province level. The estimationsample includes all households (col. 1), househols with an employee asthe main income earner (col.2) and households with a self-employed asmain earner (col.3). The dependent variable is annual household incomefrom IPUMS while the explanatory variable is annual salary from theLFS. Province fixed effects are included as additional controls.
Table A5: Percentage of individuals in each education group, by nativity (1996, 2001, 2007)
1996 2001 2007
Natives Migrants Natives Migrants Natives Migrants
Less than Primary 27.08 32.67 23.51 25.96 15.8 21.08
Less than Secondary 47.05 38.01 43.17 37.43 42.4 39.27
Secondary completed (and some college) 23.44 23.49 30.02 26.73 36.89 27.86
College completed 2.43 5.82 3.3 9.88 4.92 11.79
Notes: The estimation sample includes the working age (16-65) male labor force population.
38

Table A6: The labor market effect of immigration on natives employment and income, IV estimates, escluding districts at the border (district level,1996, 2001)
EMPLOYMENT INCOME
(1) (2) (3) (4) (5) (6) (7)
First stage (E+SE+Oth)/LF E/LF SE/LFLog total income
(LF)Log tot income(E+SE+Oth)
Log tot income(E)
Log tot income(SE)
Migration share –0.4160** –0.4506** –0.0061 –0.3741 –0.2400 –0.1645 0.0854
(0.1960) (0.2123) (0.0837) (0.5503) (0.5540) (0.5493) (2.6831)
IV 0.2916***
(0.0555)
F-test instrument 27.653
p-value 0.000
Skill, year and districtand any two-way in-teraction FE
Yes Yes Yes Yes Yes Yes Yes Yes
N 1948 1948 1948 1948 1944 1944 1930 1784
Standard errors clustered at the skill-district level in parethesis. All regressions are weighted by the labor force population in each skill-district group.Notes: The estimation sample includes the working age (16-65) male labor force population. E = employed natives in the cell, SE = self-employednatives in the cell, Oth = natives in the cell employed in other active catogories (unpaid/others), LF = natives in the labor force in the cell. Hence, thedependent variable in column (1) measures the native employment rate; the dependent variable in column (2) measures the shares of native employeesin the labor force; the dependent variable in column (3) measures the share of native self-employed in the labor force, and columns (4)-(7) captureaverage native household income for each of these groups.
39