Embed Size (px)
Citation preview

Southwest Business ForumJanuary 9, 2009
Fort Lewis College’s 17th Annual Focus on Our Future:
Business and EconomicsSponsored by Wells Fargo

Investment Advice
If you had purchased $1,000 of AIG stock one year ago, you would have $42 left.
With Lehman, you would have $0.60 left.
With Fannie or Freddie, you would have less than $5 left.
But if you had purchased $1,000 worth of beer one year ago, drank all of the beer, then turned in the cans for the aluminum recycling REFUND, you would have had $214.
Based on the above, the best current investment advice is to drink heavily and recycle.
It is always nice to know some investments still hold their value over time.

Wall Street Sympathy
Back in the 1929 Financial Crash it was said that some Wall Street Stockbrokers and Bankers JUMPED from their office windows and committed suicide when confronted with the news of their firms and clients financial ruin . . .
Many people were said to feel sorry for them . . .
In 2008 the attitude has changed somewhat:

Beeeeep….
The Region 9 Economy

Region 9 Labor Force
Source: U.S. Census Bureau

Region 9 Labor Force Growth Rates
Source: U.S. Census Bureau

Region 9 Per Capita Income
Source: U.S. Department of Commerce, Bureau of Economic Analysis, Regional Economic Information System. Most recent data available.

Region 9 Per Capita Income: Percentage of Colorado
Source: U.S. Department of Commerce, Bureau of Economic Analysis, Regional Economic Information System. Most recent data available.

Region 9 Growth Per Capita Income
Source: U.S. Department of Commerce, Bureau of Economic Analysis, Regional Economic Information System. Most recent data available.

Region 9 Unemployment Rate
Source: U.S. Department of Commerce, Bureau of Economic Analysis, Regional Economic Information System. Most recent data available.

The La Plata County Economy

Tourism
Tourism Includes:1. Airport Passengers
2. Train Ridership
3. Mesa Verde Visitors
4. Lodger’s Tax Collected
5. Skier Boarder Visits

Airport Passenger Activity (enplanements)Percent Change By Year (1995-2008)
Source: Durango - La Plata County Airport
2%5%
4%
-11%-8%
1%
12%
-13%
8%6%
12%
2%
18%
-15%
-10%
-5%
0%
5%
10%
15%
20%
1995-1996
1996-1997
1997-1998
1998-1999
1999-2000
2000-2001
2001-2002
2002-2003
2003-2004
2004-2005
2005-2006
2006-2007
2007-2008P
erc
en
t Ch
an
ge
Year

Train Passenger Activity Percent Change By Year (2001-2008e)
Source: Durango & Silverton Narrow Gauge Railroad
e = estimate
-32.8
24.7
3.3
-1.2
0.5
-0.5-12.1
-40
-30
-20
-10
0
10
20
30
2001-2002 2002-2003 2003-2004 2004-2005 2005-2006 2006-2007 2007-2008
Pe
rce
nt C
ha
ng
e
Year

Mesa Verde Visitors Percent Change By Year (1995-2008e)
Source: National Park Service Public Use Statistics Office
e = estimate
-6.9
2.4
-3.9
5.2
-28
14
-22
9.6
2.1
10.6 11.8
-2.9
1
-35
-30
-25
-20
-15
-10
-5
0
5
10
15
20
1995-1996 1997-1998 1999-2000 2001-2002 2003-2004 2005-2006 2007-2008
Pe
rce
nt C
ha
ng
e
Year

Lodger’s Tax Revenue (Durango) Percent Change By Year (2003-2008e)
Sources: City of Durango (unadjusted numbers)
e = estimate
2003-2004 2004-2005 2005-2006 2006-2007 2007-20080.0
2.0
4.0
6.0
8.0
10.0
12.0
8.4
4.8
10.7
7.0 6.7
Year
Percent Change

Skier/Boarder Visits
Year United States(millions)
Purgatory (DMR)
2000/01 57.3 322,000
2001/02 54.4 251,000
2002/03 57.6 236,000
2003/04 57.1 268,000
2004/05 56.9 278,000
2005/06 58.8 211,000
2006/07 55.0 252,000
2007/08 60.5 278,000
Sources: National Ski Association and Annual Reports

Retail Sales(Adjusted for Inflation)
An indicator of tourism activity as well as population growth.

La Plata County Retail Sales (adjusted $s)Percent Change – Semi-Annual (2003-2008)
Source: Colorado Department of Revenue

2009 Tourism and Retail Outlook
Tourism: Dependent upon discretionary spending
Retail: Reflection of national economy

Agriculture
Includes Calf Prices and Alfalfa Hay Prices – adjusted for inflation.
A better measure would be sales, but these numbers are not available.

Alfalfa Hay PricesPercent Change By Year (1995-2008e)
-1.4
15.7
-13.2
-20.3-9.2
35.9
3.3
12.4
-0.3
12.3
2.8
16.9 18.5
-30
-20
-10
0
10
20
30
40
1995-1996
1996-1997
1997-1998
1998-1999
1999-2000
2000-2001
2001-2002
2002-2003
2003-2004
2004-2005
2005-2006
2006-2007
2007-2008
Pe
rce
nt C
ha
ng
e
Year
Source: U. S. Department of Agriculture - Economics, Statistics and Market Information System
e = estimate

Calf Prices, Adjusted Dollar Value per Cut WeightPercent Change By Year (1995-2008e)
-23
40.1
-5
5.712.7
-5.4 -14
12.418.3
9.8
-3.85 -9.9 -10.9
-30
-20
-10
0
10
20
30
40
50
1995-1996
1996-1997
1997-1998
1998-1999
1999-2000
2000-2001
2001-2002
2002-2003
2003-2004
2004-2005
2005-2006
2006-2007
2007-2008P
erc
en
t Ch
an
ge
Year
Source: U. S. Department of Agriculture - Economics, Statistics and Market Information System
e = estimate

2009 Agriculture Outlook
Higher volatility in commodity prices Hedge fund deleveraging Corn-based ethanol
Decreased prices in calf prices Not passing input costs to consumer Ranchers/farmers not buying calves with increased feed
costs

Industrial Kilowatt-Hours
Used as an indicator of industrial activity in the county.
Most industrial usage of electricity in the county is to compress natural gas for transmission through gas pipelines

Industrial Kilowatt HoursPercent Change By Year (1995-2008e)
9.16.6
50.9
-6.3
6.910.2
-7.3
6.5 7.0
-2.3
0.5
-2.3
2.0
-20.0
-10.0
0.0
10.0
20.0
30.0
40.0
50.0
60.0
1995-1996
1996-1997
1997-1998
1998-1999
1999-2000
2000-2001
2001-2002
2002-2003
2003-2004
2004-2005
2005-2006
2006-2007
2007-2008
Pe
rce
nt C
ha
ng
e
Year
Source: La Plata Electric Association Inc.
e = estimate

2008-2009 Observations for Oil & Gas
Given the current regulations in the oil & gas industry, the region is producing natural gas near full capacity
High political uncertainty

Fort Lewis College Enrollment
The college stabilizes the economy because of higher enrollment in the fall and winter months. This offsets some of the decline in tourism during this time period.
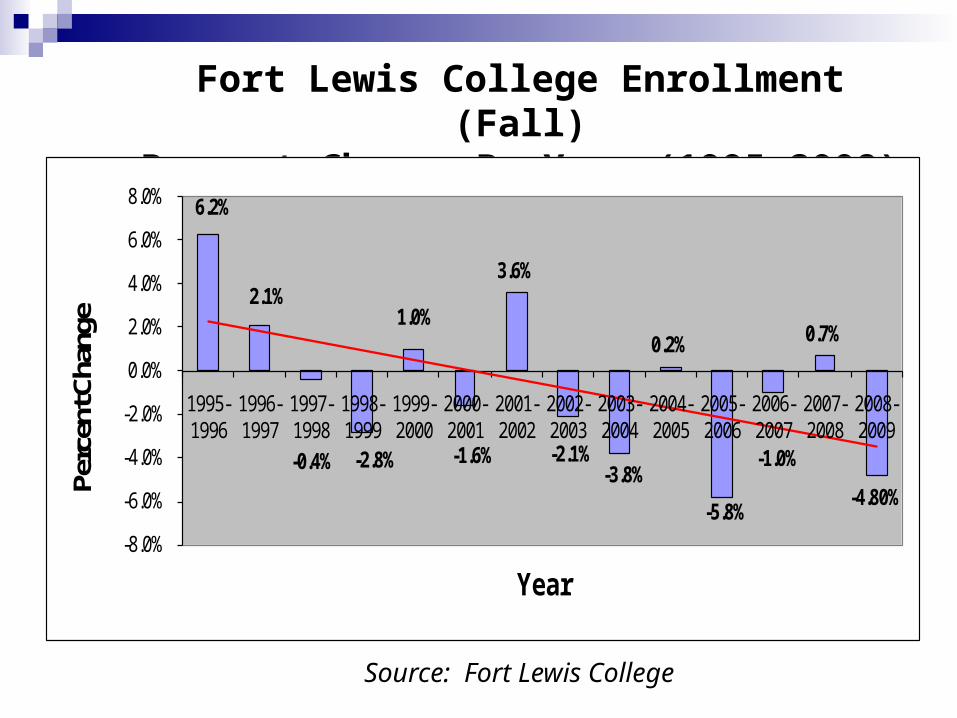
Fort Lewis College Enrollment (Fall)Percent Change By Year (1995-2008)
6.2%
2.1%
-0.4% -2.8%
1.0%
-1.6%
3.6%
-2.1%-3.8%
0.2%
-5.8%
-1.0%
0.7%
-4.80%
-8.0%
-6.0%
-4.0%
-2.0%
0.0%
2.0%
4.0%
6.0%
8.0%
1995-1996
1996-1997
1997-1998
1998-1999
1999-2000
2000-2001
2001-2002
2002-2003
2003-2004
2004-2005
2005-2006
2006-2007
2007-2008
2008-2009
Perc
ent C
hang
e
Year
Source: Fort Lewis College

2009 Fort Lewis College Outlook
Increased admission standards at FLC Comparable with UC-Boulder and CSU
Slight dip in enrollment last several years
Intermediate-term goal is 5,000 students
Increased number of applications and lower admission rate

Residential Real Estate

% Change in Median Price of Durango In-Town Single-Family Home

Average Days on Market & Number of Transactions In-Town Durango

Median Home Price of Condos/Town Homes In-Town Durango

Days on Market & Number of TransactionsCondos/Town Homes Durango In-Town

Building Permits
This indicator uses the adjusted dollar valuation of the properties for which permits were issued—thereby measuring the dollar value (as assessed) of new construction in La Plata County.
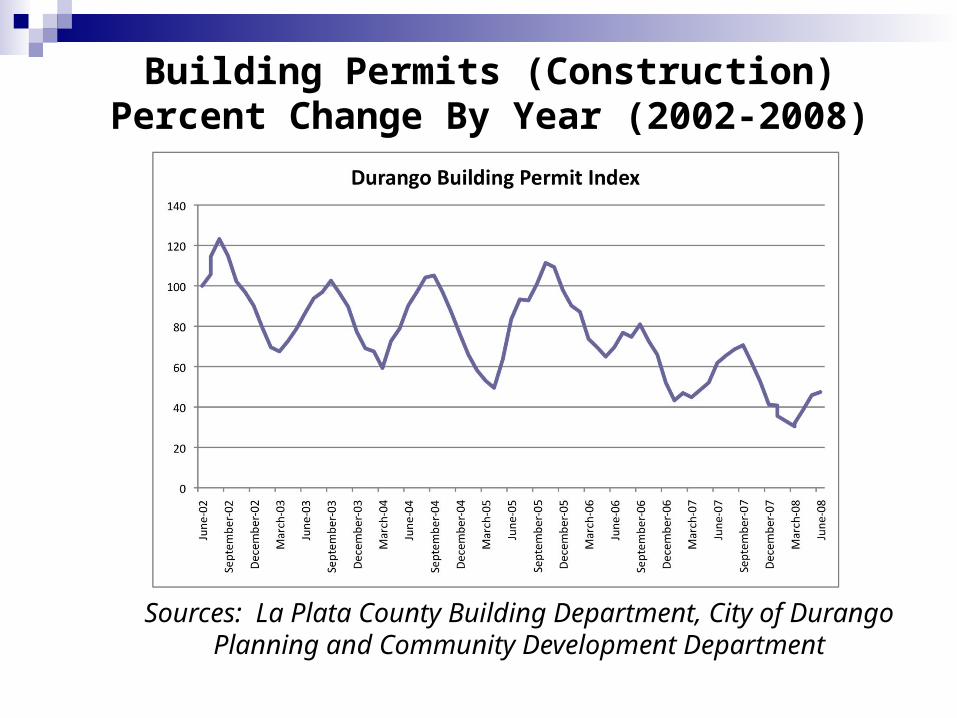
Building Permits (Construction)Percent Change By Year (2002-2008)
Sources: La Plata County Building Department, City of Durango Planning and Community Development Department

Building Permits (Construction Value)Percent Change By Year (2002-2008e)
Sources: La Plata County Building Department, City of Durango Planning and Community Development Department
e = estimate
28% 25%
-19%
-7%
-24%
-39.60%-50%
-40%
-30%
-20%
-10%
0%
10%
20%
30%
40%
2002-2003 2003-2004 2004-2005 2005-2006 2006-2007 2007-2008
Pe
rce
nt C
ha
ng
e
Year
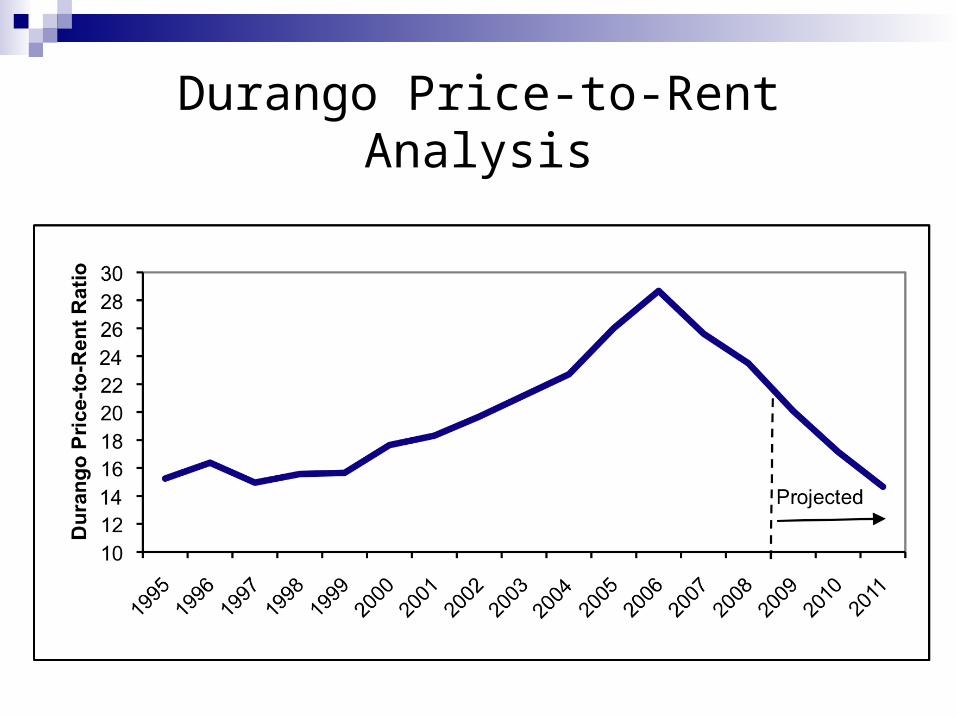
Durango Price-to-Rent Analysis
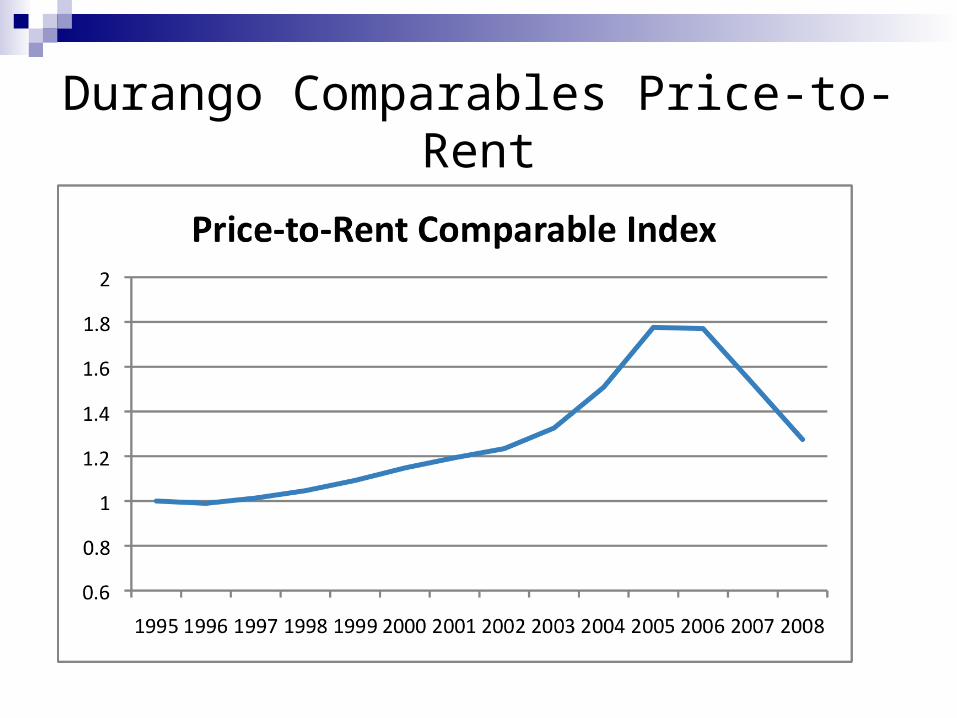
Durango Comparables Price-to-Rent

2009 Real Estate Outlook
Nation is absorbing the worst real estate correction since the Great Depression
National builders anticipate a bottom in early 2010 Single-family homes = healthy correction Condos/Town Homes = less healthy correction Building permits = significant decline

Bank Deposits
An important indicator of the economic health of the community.
Also an indicator of the ability of local banks to make loans to consumers and business borrowers.

Bank Deposits (Unadjusted)
Source: Federal Deposit Insurance Corporation
June 30th Deposits Year to Year % Change
2002 $615,000,000
2003 $702,000,000 +14.2
2004 $778,000,000 +10.8
2005 $874,000,000 +12.3
2006 $1,020,000,000 +16.7
2007 $1,034,000,000 +1.4
2008 $1,097,000,000 +6.0

InflationDurango Price Index (DPI)
Monitors the change in the price of goods and services in our region
Durango Price Index Adjust Denver CPI for Durango housing and
income levels Assumes similar other expenditure patterns as
Denver consumers

Durango Price Index versus Denver CPI
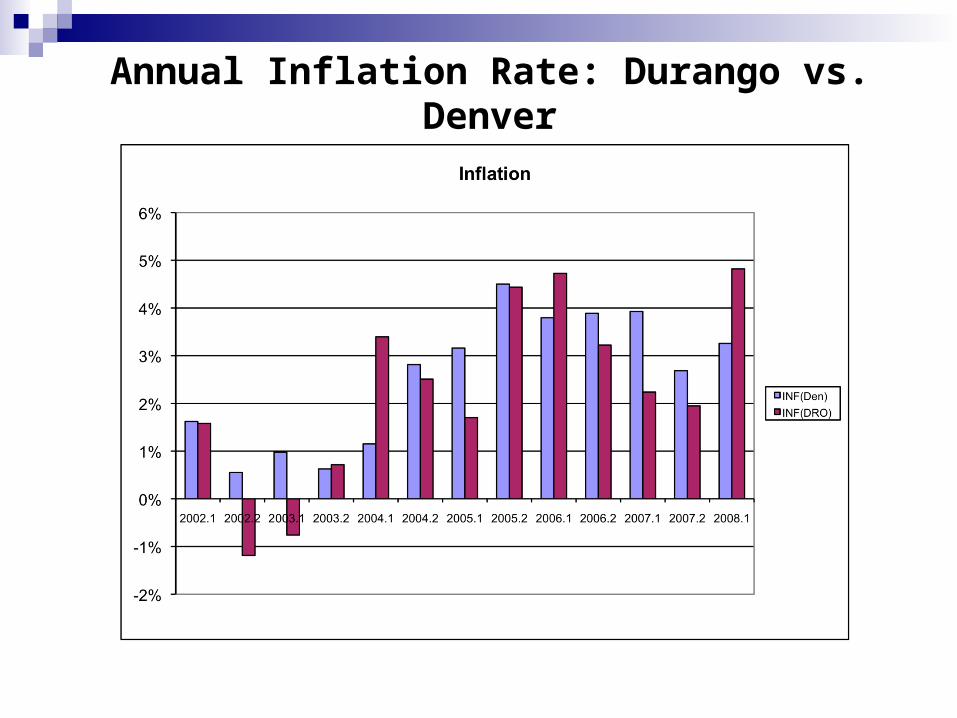
Annual Inflation Rate: Durango vs. Denver

2009 Inflation Outlook
Durango housing rents will continue to increase
Volatility in commodity prices
Decreased consumer spending

Our Web Address:
http://soba.fortlewis.edu/econoweb/

Thank You!