Embed Size (px)
Citation preview
.1M Oó9*'
Technical Bulletin No. 619
R E C 11 i VED
J^ JUL2 1938 ^
UNITED STATES DEPARTMENT OF AGRICULTURE WASHINGTON, D. C.
SOYBEANS IN THE UNITED STATES; RECENT TRENDS AND PRESENT ECONOMIC STATUS^
By ERNEST W. GROVE, assistant agricultural economist^ Bureau of Agricultural Economics ^
CONTENTS
Page Introduction 1 Development of soybean industry 3 Soybeans in the world market 4
Relation of United States to world market for soybeans 5
Soybean production in the United States 6 Soybeans used for crushing 11
Soybean oil 12 Soybean meal --- 16
Page Factors afEectmg the price of soybeans 17 Present economic position of the soybean and
its products 20 Soybean oil 22 Soybean meal 22 Elasticity of demand 23 Elasticity of supply 23 Soybean production 23
Selected list of references — 29
INTRODUCTION
Acreage of soybeans for all purposes in the United States has shown a marked and fairly continuous increase during the last 10 years, and the growth in bean production has been even more rapid than the expansion of acreage. But the increase in soybean crushings, most of which has taken place within the last 3 years, has been the chief factor in attracting popular interest to the soybean and its uses. Most of the increase in production has been in Illinois and other North Central States, and soybean-processing plants are largely concentrated in this area, at present.
Manchuria is the most important soybean-producmg country and the dominant factor in the world market. But with substantial duties on soybeans and soybean products imported into this country, and with domestic products entering foreign markets only in relatively small quantities, there has been httle direct competition between domestic and Manchurian soybeans. Consequently, pnces of soy- beans in this country have largely been determined by domestic supply and demand conditions, and have not been greatly influenced by prices of Manchurian soybeans. i TT •.. j ex x
As a large fraction of the soybeans produced m the United btates is sent to the crushing mills, prices paid to growers depend on the
the Bureau of Plant Industry, H. T. Herrick of the Bureau of Chemistry and Soils, and O. E. May of the RegionalTybea^^^^ Laboratory at Urbana, 111., for helpful suggestions and criticisms.
46509°—38^ 1 , • .;
2 TECHNICAL BULLETIN 619, U. S. DEPT. OF AGRICULTURE
value, at current prices, of the oil and meal produced. Because of the relatively low average oil yield of soybeans, the value of the meal produced usually exceeds that of the oil, and changes in the price of soybean meal consequently have a little more influence on prices of soybeans than changes in the price of soybean oil. Demand for use as seed is an additional element influencing the prices of soybeans in the spring and early summer months.
Soybean oil in its various uses competes directly with cottonseed, linseed, and other domestic or imported oils. It competes indirectly with lard, as it is one of a number of vegetable oils that are used in the manufacture of compounds and vegetable shortenings. As many of these competing oils have the same or overlapping uses, their prices, including that of soybean oil, are affected more by the total supply of fats and oils relative to demand in these uses than by the production or supply of the individual oil. This is particularly true of soybean oil, because its supply is ordinarily much smaller than are the supplies of its major competitors.
As most of the soybean meal produced is used as a feed, it competes with cottonseed meal, linseed meal, and other high-protein feeds. Prices of meal are also determined more by the total supply relative to the total demand than by the supply of any individual product. The production of cottonseed meal is the most important element in the total supply.
With prices of soybeans dependent on prices of soybean oil and meal, and these in turn dependent on general supply and demand conditions in two highly competitive fields, it is evident that the market for soybeans in any one year will be influenced by the production of cottonseed, flaxseed, lard, and other competing commodities, as well as by the size of the soybean crop in that year.
During the last 3 years, in which the greatest increases in the pro- duction and crushing of soybeans took place, prices of soybeans were well maintained because of reduced supplies of competing products. Relatively short supplies of lard caused an increase in the demand for lard substitutes, and at the same time smaller cotton crops were resulting in reduced supplies of cottonseed oil, the most important oil used in compounds and vegetable shortenings. This combination of circumstances brought about a marked increase in demand for other edible oils, and the larger supplies of soybean oil resulting from increased crushings found a ready market here.
Because of small domestic production of flaxseed and cottonseed, the total supply of high-protein feeds was reduced at a time when drought was causing some increased demand, and the increased pro- duction of soybean meal also found a good market during most of this period.
Conditions during recent years, therefore, have helped the soybean and its products to attain, in a comparatively short time, a place of some importance in many fields of consumption. Had these conditions not prevailed, it is probable that the development of the soybean crop in the United States would have been considerably slower. The question naturally arises whether the substantial foothold gained in the last few years can be improved or even maintained in the face of increasing supplies of competing products.
To that question no conclusive answer can be given now. Much depends on consumer attitudes. Soybean oil and meal were first intro-
SOYBEANS IN THE UNITED STATES 6
duced chiefly as substitutes in part to supplement or to replace other more generally utilized products. If consumers still regard them in that capacity then the prices of soybeans and their products will be depressed or their consumption will be reduced, or both, should sup- plies of competing products return to predepression levels. If, on the other hand, experience has persuaded consumers to accept the soybean and its products as independently essential, then increased production of competing products would tend to depress prices generally, unless this was offset by increased demand. In that case, soybeans would be affected no more than other products.
Experience has generally shown that soybean meal compares favor- ably with other protein concentrates. But, though soybean oil has been used for many purposes, it is still at some disadvantage as com- pared with more commonly used oils. Consequently much depends also upon whether research now in progress succeeds in overcoming the limitations in the use of the oil, and in developing new industrial uses for soybean meal. . • j •
Because of uncertain future demand some degree of caution is desir- able in considering an increased production of soybeans for crushing purposes. Further increase should occur only in response to sustained or increased demand. A marked or too rapid expansion appears inad- visable until there is greater certainty that the demand existing in recent years will be maintained.
DEVELOPMENT OF SOYBEAN INDUSTRY
For centuries the soybean has been a major crop in the Orient, and it has been known in the United States since early in the last century. But only since the World War has it achieved commercial importance in this country, and only in the last few years have its industrial uses received widespread recognition. ^ ,
Soybeans have probably received more attention and publicity m this country during recent years than any other crop of similar size a-nd farm value. Several factors have been responsible for this, including the many uses of the soybean as a feed crop, and its adaptability to crop rotations in the Corn Belt. The relative freedom of the soybean from the chinch bug and other pest hazards, and its ability to with- stand severe drought, have made it valuable in various emergency situations, particularly as a hay crop. Then there has been a marked increase in the use of soybeans in various soil-conserving and soil- building practices. . i •
All these factors have contributed to the increased interest m this comparatively new crop, but the most important factor in attracting popular interest has been the rapid expansion of the soybean-crushing industry. With increased supplies available for industrial purposes in the last few years, a futures market for soybeans was established at Chicago in October 1936.
Because of the rapid expansion of the soybean-crushing industry, and recent attempts to develop greater industrial markets for farm products in general, there has been a tendency to emphasize the indus- trial demand for soybeans and soybean products. This bulletin outlines briefly the recent economic developments in the soybean mar- ket, analyzes factors affecting farm prices of soybeans, and indicates the present economic position of the soybean, particularly in its rela- tion to industrial utilization.
4 TECHNICAL BULLETIISr 619, U. S. DEPT. OF AGRICULTURE
SOYBEANS IN THE WORLD MARKET
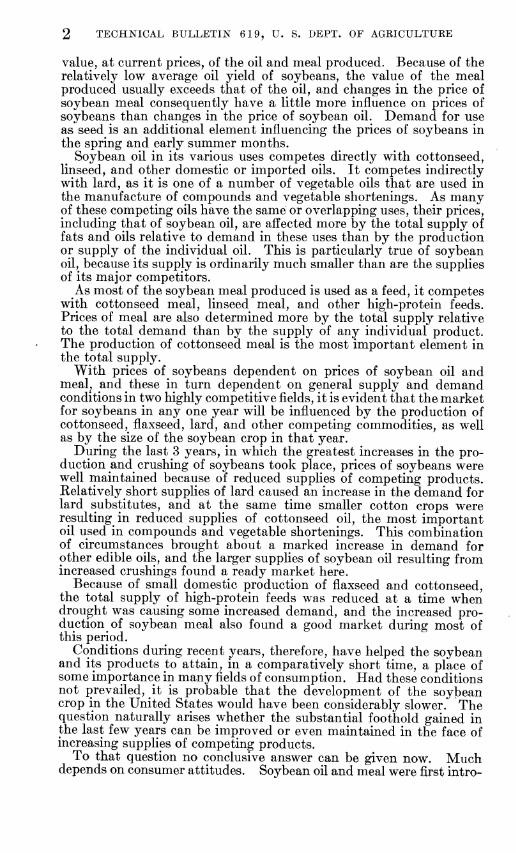
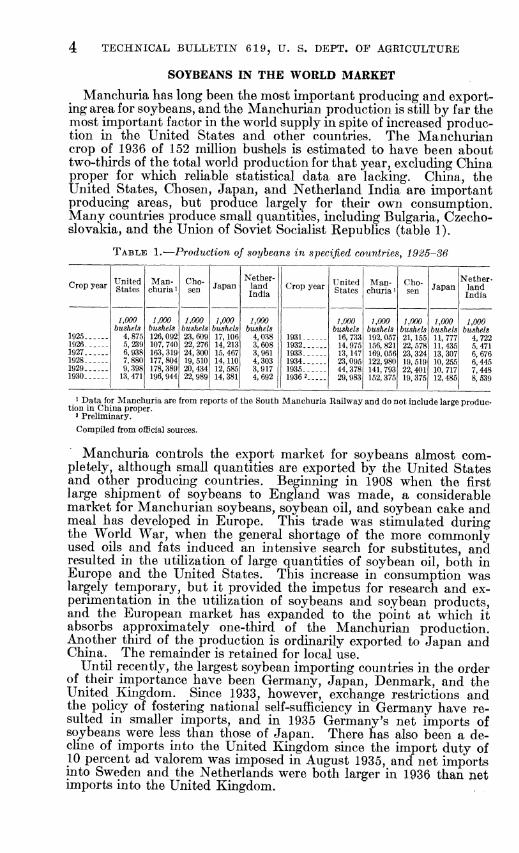
Manchuria has long been the most important producing and export- ing area for soybeans, and the Manchurian production is still by far the most important factor in the world supply in spite of increased produc- tion in the United States and other countries. The Manchurian crop of 1936 of 152 million bushels is estimated to have been about two-thirds of the total world production for that year, excluding China proper for which reliable statistical data are lacking. China, the United States, Chosen, Japan, and Netherland India are important producing areas, but produce largely for their own consumption. Many countries produce small quantities, including Bulgaria, Czecho- slovakia, and the Union of Soviet Socialist Republics (table 1).
TABLE 1.—Production of soybeans in specified countries: , 1925-36
Crop year United States
Man- churia 1
Cho- sen Japan
Nether- land India
Crop year United States
Man- churia 1
Cho- sen Japan
Nether- land India
1925 1926 1927 1928 1929 1930
1,000 bushels
4,875 5,239 6,938 7,880 9,398
13, 471
1,000 bushels 126,092 107, 740 163, 319 177, 804 178, 389 196, 944
1,000 bushels 23,609 22, 276 24, 300 19, 510 20, 434 22, 989
1,000 busheb 17,106 14, 213 15, 467 14,110 12, 585 14,381
1,000 bushels
4,038 3,608 3,961 4,303 3,917 4,692
1931 1932 1933 1934 1935 1936 2
1,000 bushels
16, 733 14,975 13,147 23,095 44,378 29,983
1,000 bushels 192,057 156, 821 169, 056 122, 980 141, 793 152, 375
1,000 bushels 21,155 22, 578 23,324 19, 519 22, 401 19, 375
1,000 bushels 11, 777 11, 435 13, 307 10, 255 10. 717 12, 485
1,000 bushels
4,722 5,471 6,676 6,445 7,448 8,539
1 Data for Manchuria are from reports of the South Manchuria Railway and do not include large produc- tion in China proper.
3 Preliminary.
Compiled from official sources.
Manchuria controls the export market for soybeans almost com- pletely, although small quantities are exported by the United States and other producing countries. Beginning in 1908 when the first large shipment of soybeans to England was made, a considerable market for Manchurian soybeans, soybean oil, and soybean cake and meal has developed in Europe. This trade was stimulated during the World War, when the general shortage of the more commonly used oils and fats induced an intensive search for substitutes, and resulted in the utilization of large quantities of soybean oil, both in Europe and the United States. This increase in consumption was largely temporary, but it provided the impetus for research and ex- perimentation in the utilization of soybeans and soybean products, and the European market has expanded to the point at which it absorbs approximately one-third of the Manchurian production. Another third of the production is ordinarily exported to Japan and China. The remainder is retained for local use.
Until recently, the largest soybean importing countries in the order of their importance have been Germany, Japan, Denmark, and the United Kingdom. Since 1933, however, exchange restrictions and the policy of fostering national self-sufficiency in Germany have re- sulted in smaller imports, and in 1935 Germany's net imports of soybeans were less than those of Japan. There has also been a de- cline of imports into the United Kingdom since the import duty of 10 percent ad valorem was imposed in August 1935, and net imports into Sweden and the Netherlands were both larger in 1936 than net imports into the United Kingdom.
SOYBEANS IK THE UNITED STATES
Manchuria is also the larg-est exporter of soybean oil and soybean cake and meal, but those countries which crush imported soybeans are additional elements in the export market for oil and cake. Until 1934, Germany was second to Manchuria in net exports of soybean oil; but with smaller quantities of soybeans imported for crushing during late years, imports of the oil have exceeded exports, and Denmark is now second to Manchuria in net exports. Denmark ex- ports a large part of the oil obtained from the soybeans imported by that country, but retains most of the cake and meal for use as feed in its extensive dairy and poultry industries. Japan also has a net export balance for soybean oil, but the other important crushing countries, including the United Kingdom, Sweden, and the Nether- lands, import more oil than they export. Most of the other Euro- pean countries are also importers of soybean oil, with no single country outstanding.
RELATION OF UNITED STATES TO WORLD MARKET FOR SOYBEANS
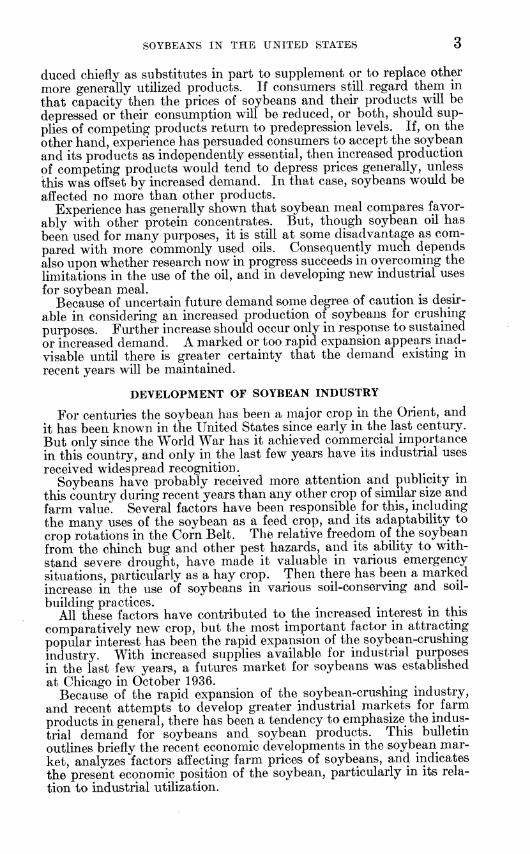
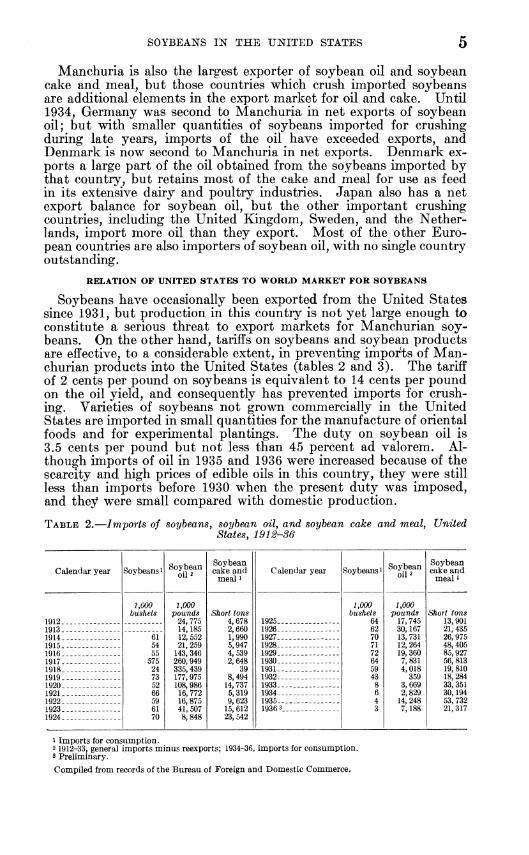
Soybeans have occasionally been exported from the United States since 1931, but production in this country is not yet large enough to constitute a serious threat to export markets for Manchurian soy- beans. On the other hand, tariffs on soybeans and soybean products are effective, to a considerable extent, in preventing imports of Man- churian products into the United States (tables 2 and 3). The tariff of 2 cents per pound on soybeans is equivalent to 14 cents per pound on the oil yield, and consequently has prevented imports for crush- ing. Varieties of soybeans not grown commercially in the United States are imported in small quantities for the manufacture of oriental foods and for experimental plantings. The duty on soybean oil is 3.5 cents per pound but not less than 45 percent ad valorem. Al- though imports of oil in 1935 and 1936 were increased because of the scarcity and high prices of edible oils in this country, they were still less than imports before 1930 when the present duty was imposed, and they were small compared with domestic production.
TABLE 2.—Imports of soybeans, soybean oil, and soybean cake and meal, United States, 1912-36
Calendar year Soybeans ^ Soybean oil 2
Soybean cake and
meal i Calendar year Soybeans i Soybean
oil 2
Soybean cake and
meal »
1912
1,000 bushels
1,000 pounds
24, 775 14,185 12, 552 21, 259
143, 346 260,949 335,439 177,975 108,986
16, 772 16,875 41, 507 8,848
Short tons 4,678 2,660 1,990 5,947 4,539 2,648
39 8,494
14, 737 5,319 9,623
15, 612 23, 542
1925 1926
1,000 bushels
64 62 70 71 72 64 59 43
8 6 4 3
1,000 pounds
17, 745 30,167 13, 731 12,264 19, 360 7,831 4,018
359 3,669 2,829
14, 248 7,188
Short tons 13,901
1913 -- 21, 435 1914 61
54 55
575 24 73 52 66 59 61 70
1927 26,975 1915 1928 48, 405 1916 1929 85,927 1917 1930 56, 813 1918 1931
1932 1933
19, 810 1919 18,284 1920 33, 351 1921 1934 - - - 30,194 1922 1935 53, 732 1923 1936 3 21,317 1924
1 Imports for consumption. 21912-33, general imports minus reexports; 1934-36, imports for consumption. s Preliminary. Compiled from records of the Bureau of Foreign and Domestic Commerce.

6 TECHNICAL BULLETIN 619, U. S. DEPT. OF AGRICULTURE
The tariff of $6 per ton on soybean cake and meal has been less effective in preventing imports. During the period 1933-36, the average annual imports amounted to 34,500 tons, the greater part being used on the Pacific coast. Domestic production of soybean meal during the same period averaged about eight times as large as imports.
TABLE 3.- -United States tariff rates on ¡soyheans, soybean oil, and soybean cake or ■mealy 1913-S7
Date effective Soybeans per pound
Soybean oil per pound
Soybean cake or meal per pound
Oct. 4, 1913 Cents
0) 0)
0.50 2.00
Cents 0)
3 2.67 2.50
*3.50
Cents (2)
0) s 0.30
May 28, 1921 Sept. 22, 1922 June IS, 1930
1 Free. a Under par. 560 of the Tariff Act of 1913, soybean cake was free of duty. Under par. 385, soybean meal
was dutiable at 15 percent ad valorem as an unenumerated manufactured article. These rates were not changed by the Emergency Tariff Act of 1921.
3 20 cents per gallon. 4 But not less than 45 percent ad valorem. fi Equivalent to $6 per short ton.
At present, with production in the United States ordinarily not in excess of domestic needs, and with tariffs fairly effective in preventing iniports, it is evident that the world supply of soybeans has little direct influence on the domestic market. In fact the domestic supplies of other oils, oilseed, and high-protein feeds will have a much greater influence than the Manchurian soybean crop, although total world supplies of all fats and oils will also be an important factor. But any marked increase in production beyond domestic requirements would force American producers to compete with Manchurian producers of soybeans in the world market. In that event, the Manchurian supply would become the dominant factor in the domestic situation.
SOYBEAN PRODUCTION IN THE UNITED STATES
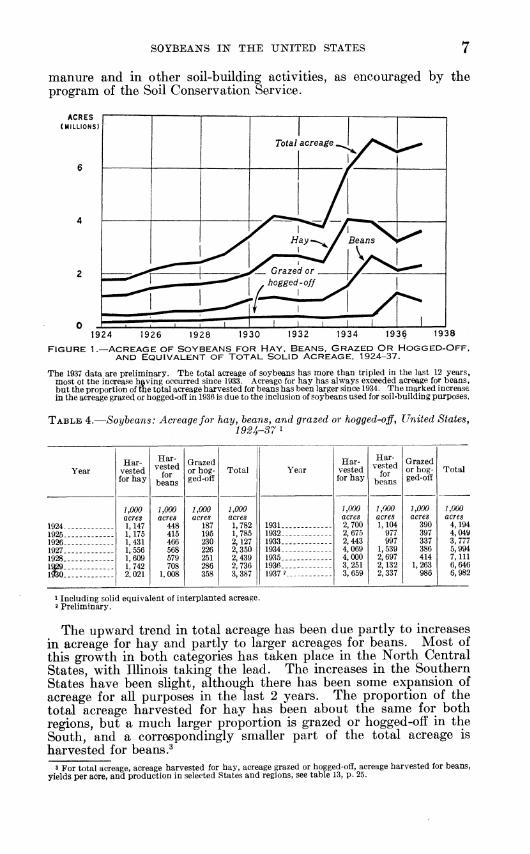
In the United States, there has been a marked increase in acreage planted to soybeans since 1924, the first year for which adequate data are available. As soybeans are frequently interplanted with corn and other crops, especially in the Southern States, the solid-acreage equi- valents of the interplanted acreage have been included in the total acreage figures. The equivalent of total solid acreage planted to soybeans in 1936 was 6.6 million acres, more than three and two-thirds times the 1924 acreage (table 4 and fig. 1), and for 1937 almost 7 millioD acres are indicated.
h\ the period 1924-34, two-thirds of the total acreage was ordinarily harvested for hay, about one-fourth was harvested for beans, and about one-tenth was not harvested either for hay or beans but was hogged-ofl* or grazed. In the last 2 years, however, the proportion harvested for hay has decreased to one-half, with the acreage for beans constituting about one-ttiird of the total. The acreage not harvested either for hay or beans siiowed a marked increase in 1936, representing 19 percent of the total. This was due to the use of soybeans as green
SOYBEANS IN THE UNITED STATES 7
manure and in other soil-building activities, as encouraged by the program of the Soil Conservation Service.
1924
FIGURE 1
1926 1928 1930 1932 1934 1936 1938
ACREAGE OF SOYBEANS FOR HAY, BEANS. GRAZED OR HOGGED-OFF, AND EQUIVALENT OF TOTAL SOLID ACREAGE. 1924-37.
The 1937 data are preliminary. The total acreage of soybeans has more than tripled in the last 12 years, most 01 the increase having occurred since 1933. Acreage for hay has always exceeded acreage for beans, but the proportion of the total acreage harvested for beans has been larger since 1934. The marked increase in the acreage grazed or hogged-off in 1936 is due to the inclusion of soybeans used for soil-building purposes.
TABLE 4.—Soybeans: Acreage for hay y heans, and grazed or hogged-off. United States^ 1924-37 1
Year Har-
vested for hay
Har- vested
for beans
Grazed or hog- ged-ofí
Total Year Har-
vested for hay
Har- vested
for beans
Grazed or hog- ged-oiï
Total
1924
1,000 acres 1,147 1,175 1,431 1,556 1,609 1,742 2.021
1,000 acres
448 415 466 568 579 708
1,008
1,000 acres
187 195 230 226 251 286 358
1,000 acres 1,782 1,785 2,127 2,350 2,439 2,736 3,387
1931
1,000 acres 2,700 2, 675 2,443 4,069 4,000 3,251 3,659
1,000 acres 1,104
977 997
1,539 2,697 2,132 2,337
1,000 acres
390 397 337 386 414
1,263 986
1,000 acres
4,194 1925 1932
1933 1934 1935
4,049 1926 3,777 1927 1928
5,994 7,111
1936 1937 2
6,646 IwO 6,982
1 Including solid equivalent of interplanted acreage. 2 Preliminary.
The upward trend in total acreage has been due partly to increases in acreage for hay and partly to larger acreages for beans. Most of this growth in both categories has taken place in the North Central States, with Illinois taking the lead. The increases in the Southern States have been slight, although there has been some expansion of acreage for all purposes in the last 2 years. The proportion of the total acreage harvested for hay has been about the same for both regions, but a much larger proportion is grazed or hogged-oiï in the South, and a correspondingly smaller part of the total acreage is harvested for beans .^
3 For total acreage, acreage harvested for hay, acreage grazed or hogged-off, acreage harvested for beans, yields per acre, and production in selected States and regions, see table 13, p. 25.
8 TECHNICAL BULLETIN 619, U. S. DEPT. OF AGRICULTURE
Increasing acreage has been partly responsible for the larger pro- duction of soybeans during recent years, but there has also been an increase in average yields as a result of better growing and harvesting practices, and the introduction of adapted high-yielding varieties and strains in the Middle West. In the period 1924-26, the average yield in the United States was a little over 11 bushels per acre compared with an average of more than 15 bushels per acre in 1934-36. A record high of 17.5 bushels per acre is indicated for 1937. The in- creased average yield in the United States is almost entirely the result of larger yields in Illinois and other North Central States, yields in the Southern States having remained very much the same since 1924. Yield per acre in the north-central region has averaged around 16 bushels lately with about 10 bushels the average in the Southern States. Lower yields in the Southern States are due chiefly to the fact that a large percentage of the acreage is devoted to so-called hay varieties which produce less seed than the yellow- seeded commercial varieties.
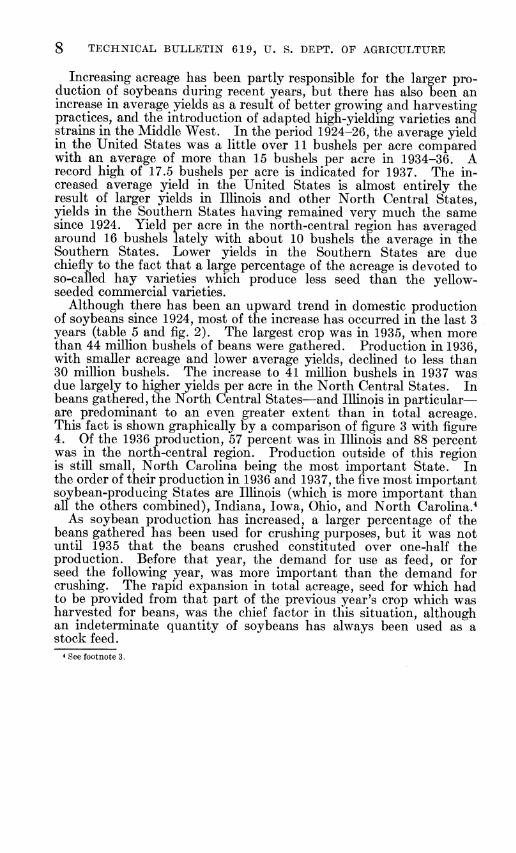
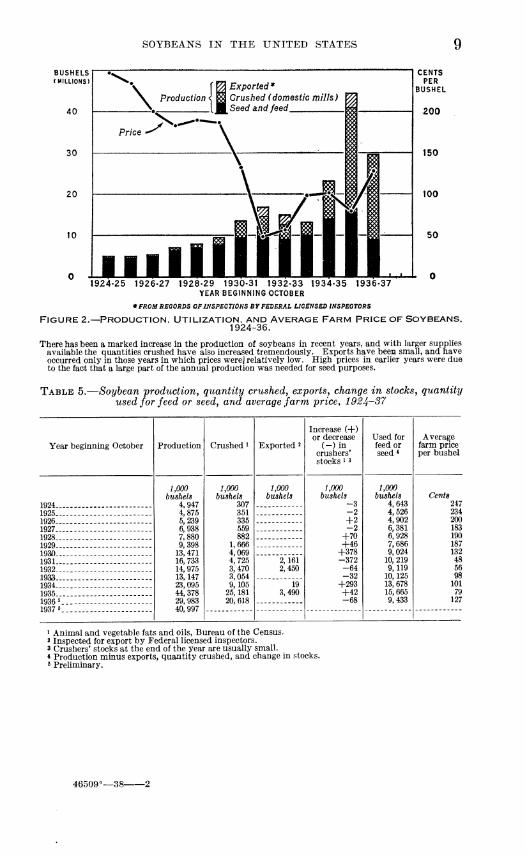
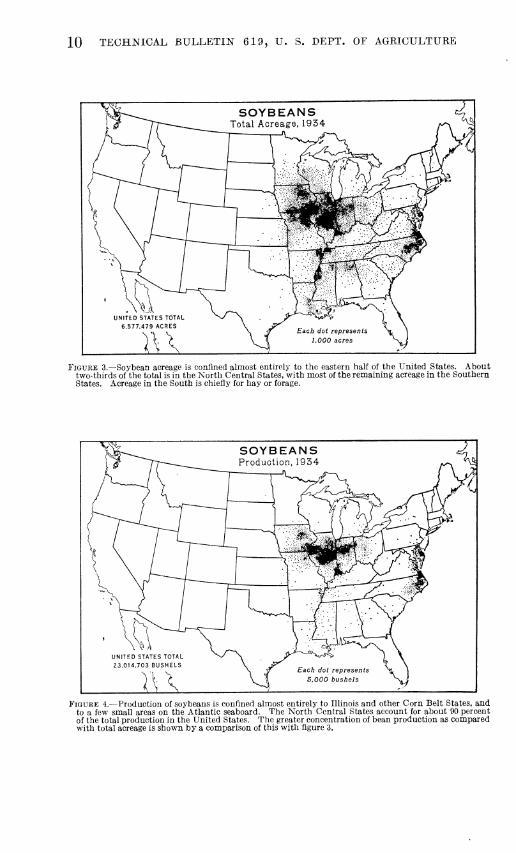
Although there has been an upward trend in domestic production of soybeans since 1924, most of the increase has occurred in the last 3 years (table 5 and fig. 2). The largest crop was in 1935, when more than 44 million bushels of beans were gathered. Production in 1936, with smaller acreage and lower average yields, declined to less than 30 million bushels. The increase to 41 million bushels in 1937 was due largely to higher yields per acre in the North Central States. In beans gathered, the North Central States—and Illinois in particular— are predominant to an even greater extent than in total acreage. This fact is shown graphically by a comparison of figure 3 with figure 4. Of the 1936 production, 57 percent was in Illinois and 88 percent was in the north-central region. Production outside of this region is still small. North Carolina being the most important State. In the order of their production in 1936 and 1937, the five most important soybean-producing States are Illinois (which is more important than all the others combined), Indiana, Iowa, Ohio, and North Carolina.^
As soybean production has increased, a larger percentage of the beans gathered has been used for crushing purposes, but it was not until 1935 that the beans crushed constituted over one-half the production. Before that year, the demand for use as feed, or for seed the following year, was more important than the demand for crushing. The rapid expansion in total acreage, seed for which had to be provided from that part of the previous year's crop which was harvested for beans, was the chief factor in this situation, although an indeterminate quantity of soybeans has always been used as a stock feed.
* See footnote 3.
SOYBEANS IN THE UNITED STATES
BUSHELS (MILLIONS)
40
30
20
10
\. Production
\ Exported* Crushed (domestic rnills)
[Seed and feed
CENTS PER
BUSHEL
200
150
100
50
1924-25 1926-27 1928-29 1930-31 1932-33 1934-35 1936-37 YEAR BEGINNING OCTOBER
• FROMBEOORDS OP 1N$PE0T¡0Í{S BY FEDERAL LICENSED ¡NSPEOTORS
FIGURE 2.—PRODUCTION. UTILIZATION. AND AVERAGE FARM PRICE OF SOYBEANS. 1924-36.
There has been a marked increase in the production of soybeans in recent years, and with larger supphes available the quantities crushed have also increased tremendously. Exports have been small, and have occurred only in those years in which prices werej relatively low. High prices in earlier years were due to the fact that a large part of the annual production was needed for seed purposes.
TABLE 5.—Soybean production^ quantity crushed, exports, change in stocks, quantity used for feed or seed, and average farm price, 1924-37
Year beginning October Production Crushed i Exported ^
Increase (+) or decrease
(-)in crushers' stocks 1 3
Used for feed or seed*
Average farm price per bushel
1924
i,000 bushels
4,947 4,875 5,239 6,938 7,880 9,398
13, 471 16, 733 14,975 13,147 23,095 44,378 29, 983 40,997
1,000 bushels
307 351 335 659 882
1,666 4,069 4,725 3,470 3,054 9,105
25,181 20, 618
1,000 bushels
1,000 bushels
-3 -2 +2 -2
+70 +46
+378 -372 -64 -32
+293 +42 -68
1,000 bushels
4,643 4,526 4,902 6,381 6,928 7,686 9,024
10, 219 9,119
10,125 13, 678 15, 665 9,433
Cents 247
1925 - - 234 1926 . . 200 1927 183 1928 190 1929 187 1930 132 1931 - 2,161
2,450 48
1932 . 56 1933 98 1934 19
3,490 101
1935 79 1936* 127 1937 fi
1 Animal and vegetable fats and oils, Bureau of the Census. 2 Inspected for export by Federal licensed inspectors. 3 Crushers' stocks at the end of the year are usually small. 4 Production minus exports, quantity crushed, and change in stocks. » Prehminary.
46509°—38-
10 TECHNICAL BULLETIN 619^ U. S. DEPT. OF AGRICULTURE
FIGURE 3.—Soybean acreage is confined almost entirely to the eastern half of the United States. About two-thirds of the total is in the North Central States, with most of the remaining acreage in the Southern States. Acreage in the South is chiefly for hay or forage.
S ̂ ^-^_ SOYBEANS 4
/
r^^^^^'TT-----^^ Productior 1,1934
^"^/^ Í r \ rVCf -^ <sl SH
C .• " L—r c. ^
■\ '\WV. K^
\r "r""^-—-—r- :V .^ lif^ V^
• './ß^ v) / 1 1 ^ -1^
Í ^^T'^x"^ )\- ̂ ^s^i;^ UNITED STATES TOTAL ^^V^ \ Ö^^-^^X^vT^ j 23,014,703 BUSHELS
\ J^ Each dot represents ^ \j( 5,000 bushels
FIGURE 4.—Production of soybeans is confined almost entirely to Illinois and other Corn Belt States, and to a few small areas on the Atlantic seaboard. The North Central States account for about 90 percent of the total production in the United States. The greater concentration of bean production as compared with total acreage is shown by a comparison of this with figure 3.
SOYBEANS IN THE UNITED STATES H
Significant quantities of soybeans from the crops of 1931, 1932, and 1935 were exported, but even in 1935, with a record production, only 3.5 miUion bushels were exported, or less than 8 percent of the crop. With a smaller production in 1936 and prices far in excess of the world price, no soybeans were inspected for export during the 1936-37 marketing year.
The soybean is an important food product in oriental countries. In the United States, although bean milk, bean curd, soy sauce, and other food products are manufactured to some extent, the quantity of soy- beans consumed directly by human beings is only a small fraction of the total available supply.
SOYBEANS USED FOR CRUSHING
Crushings of soybeans and the production of oil and meal have been much larger during the last 3 years than in previous years. The average annual quantity crushed m the United States during the period 1930-33 (years beginning in October) was 3.8 million bushels, or 26 percent of the total production. From the 1934 crop, 9 million bushels, and from the 1935 crop, 25 million bushels were crushed, representing 39 and 57 percent of production, respectively.^ Almost 70 percent of the 1936 crop was crushed, but the actual volume of crushmgs was smaller than in 1935-36 because of reduced production.
At present, the production of the yellow varieties of soybeans suit- able for crushmg is largely limited to the North Central States and North Carolina. In other parts of the United States, almost the entire acreage is devoted to the black- and brown-seed types which are well adapted for utilization as hay or forage, but are undesirable for crushing. Production of soybeans for crushing purposes in these areas will depend to a considerable extent on the adaptation of yellow varieties to the different climatic and growing conditions. In the Southern States, cottonseed-oil mills could easily be used for crushing soybeans, if supplies were made available.
The expeller method of obtaining the oil is most commonly used for soybeans in the United States, although the hydraulic-press and solvent-extraction methods are used to some extent. The hydraulic press is almost universally used in this country for expressing the oil from flaxseed and cottonseed, whereas the extraction method is more common in Europe than in the United States. The latter is the most efficient in extracting the oil as it leaves in the meal less than 5 percent of the oil content of the beans. The expeller and hydraulic-press methods leave in the cake from 21 to 27 percent of the oil contained in the soybeans.
Although the oil content of soybeans is around 18 or 19 percent on a natural moisture basis, the average yield with present crushing methods in the United States has been only 14 percent, or about 8.4 pounds of oil per 60-pound bushel. This is a much smaller yield than is obtained from most other oil-bearing seeds, although the 15 percent of oil obtained from cottonseed is not significantly greater. The yield of cake or meal is about 80 percent or 48 pounds per bushel. The remaining 6 percent represents waste or loss in processing.
* Including soybeans exported for crushing in foreign countries, the percentages are 40 for 1934 and 65 for 1935, compared with an average of 34 percent in 1930-33.
12 TECHNICAL BULLETIN 619, U. S. DEPT. OF AGRICULTURE
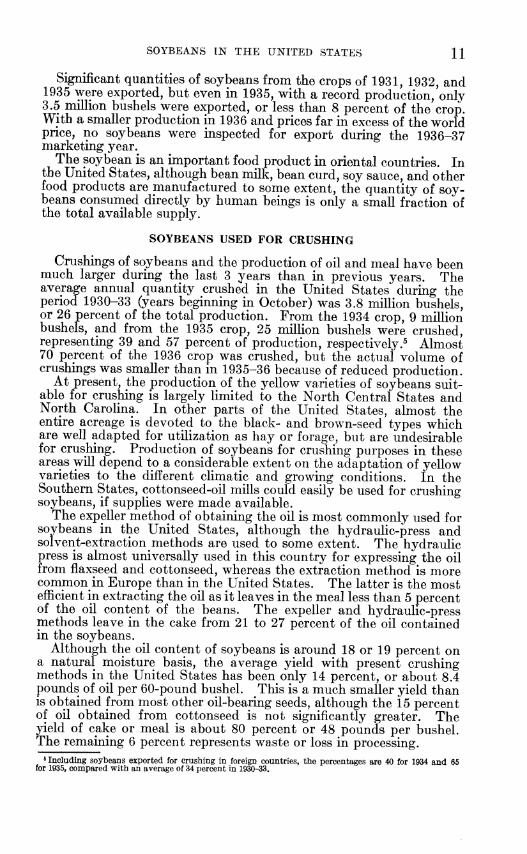
A pound of oil is worth from two to five times as much as a pound of meal, depending on the prevailing prices. But with the compara- tively low oil yield, the value of the oil from a bushel of soybeans is usually less than the value of the meal. The only time when this has not been the case in recent years was during a period of 9 months in 1935-36 when meal prices were exceptionally low (fig. 5). During the last 6 months of 1936, for example, a bushel of beans yielded on the average 69 cents worth of oil compared with 97 cents worth of meal. From the standpoint of total value, therefore, soybean meal must be considered the major product, with the oil merely a byproduct. If the solvent-extraction method of removing the oil from soybeans should become more widely used in this country, the average percent-
OCT. APR. OCT. APR. OCT. APR. OCT. APR. OCT. APR. OCT. APR. OCT. APR. OCT.
1930-31 1931-32 1932-33 1933-34 1934-35 1935-36 I93Q.-37
FIGURE 5.—VALUE OF OIL AND MEAL PRODUCED PER BUSHEL OF SOYBEANS. OCTOBER 1930-SEPTEMBER 1937.
Although a pound of soybean oil is worth more than a pound of soybean meal, the yield per bushel of soy - bean oil is not high enough for the value of the oil produced to equal that of the meal, unless meal prices are unusually low and oil prices high. This was the case from August 1935 to April 1936. Because the bushel value of the meal is ordinarily above that of the oil, prices of soybean meal have a little more influence on soybean prices than do prices of soybean oil.
age of oil extracted would tend to be somewhat higher than at present and the production of meaF correspondingly lower. It is probable that any increase in unit costs involved in the wider application of this method would be more than offset by increased returns due to the higher oil yield.
SOYBEAN OIL
When properly processed, soybean oil can be adapted to a wide variety of uses. It was first used on a large scale in the United States during the World War, when large quantities of imported oil went into the manufacture of soap, replacing oils and fats exported to Europe. Smaller quantities were used in the manufacture of certain edible products. The increased imports during this period are shown in table 2.
Consumption fell off again after the war and remained relatively small until 1929 when larger supplies became available as a result of
SOYBEANS IN THE UNITED STATES 13
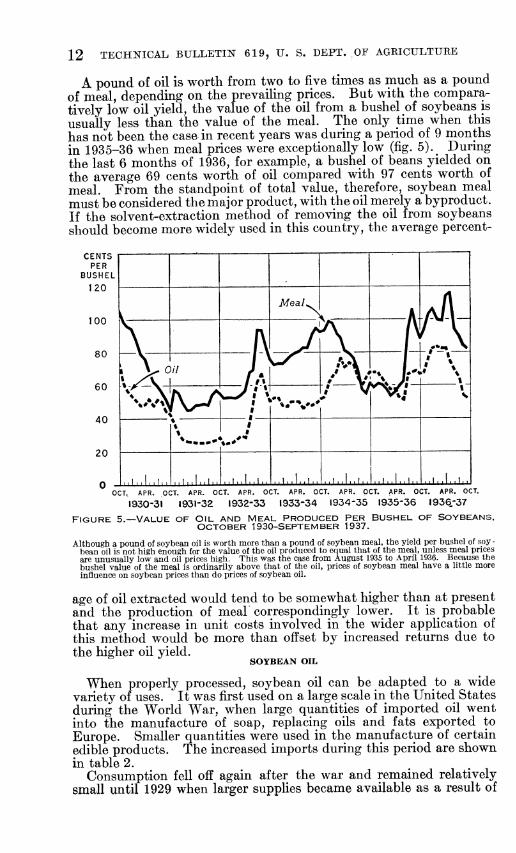
increasing domestic production of soybeans for crushing. From 1931 to 1934 the most important outlet for soybean oil was in the paint and other ^ drying-oil industries. Factory consumption declined slightly during this period, but the proportion used in the drying- oil industries increased steadily to 64 percent of the total in 1934, with
1931 1932 1933 1934 1935 1936 FIGURE 6.- -FACTORY CONSUMPTION OF SOYBEAN OIL BY GROUPS OF INDUSTRIES,
1931-36.
Before 193r), soybean oil was used mostly as a drying oil. Its use in this field has not decreased materially, but increases in production during recent years have been accompanied by stronger demand for edible oils. Consequently most of the larger supplies have entered into the manufacture of food products, chiefly lard substitutes, and soybean oil is now predominantly an edible oil.
only 15 percent going into edible products in that year (fig. 6 and table 6).
Domestic production of soybean oil has kept pace with that of soy- beans, and when soybean production increased in 1934 and again in 1935, the production of soybean oil also increased from 26 million
14 TECHNICAL BULLETIN 619, IT. S. DEPT. OF AGRICULTURE
pounds in the 1933-34 marketing year to 78 and 209 million pounds in 1934-35 and 1935-36, respectively (table 7). Production of oil from the 1936 soybean crop was 184 million pounds. Because of reduced supplies of lard and cottonseed oil, the demand for soybean oil for edible uses was expanding at the same time. As a result, most of the increased production went into food products, chiefly into lard substitutes. In 1935 and 1936, the quantity of soybean oil used as a drying oil was actually larger than in previous years, but the tremen- dous increase in its use in food products has made it predominantly an edible oil in the last 2 years. In 1936, 81 percent of the factory consumption of soybean oil was in food products, with only 9 percent used in the drying-oil industries.
TABLE 6.—Factory consumption of soybean oñy by classes o / products, 1931-36
Products 1931 1932 1933
Compounds and vegetable shortenings
1,000 pounds
10,869 623
Percent 39
2
1,000 pounds
4,889 3
180
Percent 19
(2) 1
1,000 pounds
489 7
460
Percent 2
Oleomargarine (») other edible 2
All food products . 11,492 3,816 8,901 2,051 1,625
41 14 32
7 6
5,072 5,571
11, 593 1,875 1,158
20 22 46
7 5
956 4,235
14, 274 2,626
867
4 Soap 19 Drying-oil industry ^ 62 Miscellaneous .. -- - 11 Loss, including foots 4
Total 27,885 100 25, 269 100 22,958 100
Products 1934 1935 1936
Compounds and vegetable shortenings Oleomargine
1,000 pounds
2,735 24
509
Percent 13
2
1,000 pounds
52, 452 1,740 9,421
Percent 57
2 10
1,000 pounds 113,897
14, 262 21, 598
Percent 61 8
other edible 12
All food products 3,268 1,354
13, 353 2,109
823
15 7
64 10 4
63, 613 2,549
17,871 1,665 5,468
69 3
20 2 6
149, 757 6,023
17,419 3,405 8,959
81 Soap 3 Drying-oil industry 1 - - 9 Miscellaneous. , .. - 2 Loss, including foots 6
Total 20, 907 100 91,166 100 184, 563 100
1 Includes paints and varnishes, linoleum and oilcloth, and printing inks. 2 Less than 0.5 percent.
Compiled from Factory Consumption of Primary Animal and Vegetable Fats and Oils by Classes of Products, Bureau of the Census, 1931-36.
TABLE 7- -Factory production, net import hean oil,
s, stocks, an 1922-36
d disappearance of crude soy-
Year beginning October
Factory produc-
tion
Net im- ports 1
Stocks at end of
year(Sep- tember
30)2
Comput- ed disap- pearance 3
Year beginning October
Factory produc-
tion
Net im- ports 1
Stocks at end of
year (Sep- tember
30)2
Comput- ed disap- pearance 2
1921
1,000 pounds
1,000 pounds
1,000 pounds
8,832 18,145 6,338 3,862
10,023 8,140 7,416
11, 731
1,000 pounds
"'"'33,'452 19, 270 19, 924 23,153 16, 394 10,039 11,487
1929
1,000 pounds 13, 424 34, 688 39, 946 29, 078 26, 196 78,123
208, 965 183, 711
1,000 pounds
5,814 197
4-2,339 1,422
4 -96 9,509 5,219
16,906
1,000 pounds
12, 986 16,000 16, 688 10, 895 14, 854 14, 226 39,172 36,044
1,000 pounds
17,983 1922 _ . . 1,693
760 2,268 2,639 2,658 4,373 7,284
41,072 6,703
15, 180 26, 675 11,853 4,942 8,518
1930 31, 871 1923 1931 36, 919 1924 1932 36,293 1925 1933 22, 141 1926 1934 88,260 1927--. 1928.
1935 1936 5
189, 238 203, 745
1 General imports minus domestic exports and reexports; beginning January 1934 imports for consump- tion minus domestic exports; crude and refined not separately reported.
2 Stocks of crude plus stocks of refined adjusted for 6-percent refining loss. 3 Factory production plus net imports (or minus net exports), plus stocks at end of previous year, minus
stocks at end of year. * Net exports. ^ Preliminary. Production and stocks data from Animal and Vegetable Fats and Oils, Bureau of the Census; Foreign trade data from Foreign Commerce and Navigation of the United States.
SOYBEANS IN THE UNITED STATES 15
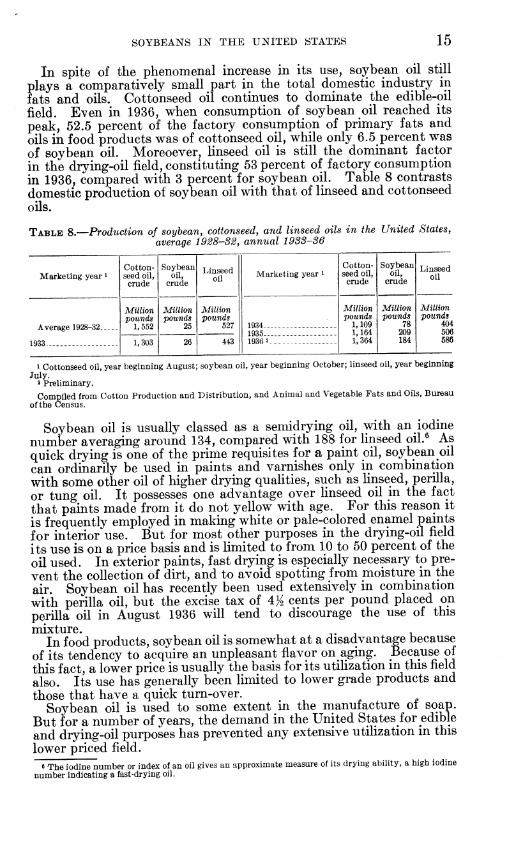
In spite of the phenomenal increase in its use, soybean oil still plays a comparatively small part in the total domestic industry in fats and oils. Cottonseed oil continues to dominate the edible-oil field. Even in 1936, when consumption of soybean oil reached its peak, 52.5 percent of the factory consumption of primary fats and oils in food products was of cottonseed oil, while only 6.5 percent was of soybean oil. Moreoever, linseed oil is still the dominant factor in the drying-oil field, constituting 53 percent of factory consumption in 1936, compared with 3 percent for soybean oil. Table 8 contrasts domestic production of soybean oil with that of linseed and cottonseed oils.
TABLE 8.—Production of soybeanj cottonseed, and linseed oils in the United States, average 1928-82, annual 1938-36
Marketing year i Cotton- seed oil, crude
Soybean oil,
crude Linseed
oil Marketing year i Cotton- seed oil, crude
Soybean oil
crude Linseed
oil
Average 1928-32
Million pounds
1,552
Million pounds
25
Million pounds
527 1934
Million pounds
1,109 1,164 1,364
Million pounds
78 209 184
Million pounds
404 1935 606
1933 1,303 26 443 19362 686
I Cottonseed oil, year beginning August; soybean oil, year beginning October; linseed oil, year beginning July.
Î Preliminary. Compiled from Cotton Production and Distribution, and Animal and Vegetable Fats and Oils, Bureau
of the Census.
Soybean oil is usually classed as a semidrying oil, with an iodine number averaging around 134, compared with 188 for linseed oil.^ As quick drying is one of the prime requisites for a paint oil, soybean oil can ordinarily be used in paints and varnishes only in combination with some other oil of higher drying quahties, such as linseed, perilla, or tung oil. It possesses one advantage over linseed oil in the fact that paints made from it do not yellow with age. For this reason it is frequently employed in making white or pale-colored enamel paints for interior use. But for most other purposes in the drying-oil field its use is on a price basis and is limited to from 10 to 50 percent of the oil used. In exterior paints, fast drying is especially necessary to pre- vent the collection of dirt, and to avoid spotting from moisture in the air. Soybean oil has recently been used extensively in combination with perilla oil, but the excise tax of 4K cents per pound placed on perilla oil in August 1936 will tend to discourage the use of this mixture.
In food products, soybean oil is somewhat at a disadvantage because of its tendency to acquire an unpleasant flavor on aging. Because of this fact, a lower price is usually the basis for its utilization in this field also. Its use has generally been limited to lower grade products and those that have a quick turn-over.
Soybean oil is used to some extent in the manufacture of soap. But for a number of years, the demand in the United States for edible and drying-oil purposes has prevented any extensive utiHzation in this lower priced field.
6 The iodine number or index of an oil gives an approximate measure of its drying ability, a high iodine number indicating a fast-drying oil.
16 TECHNICAL BULLETIN 619, U. S. DEPT. OF AGRICULTURE
With all these considerations in mind, it is evident that soybean oil must still be considered in this country chiefly as a substitute oil. There are a few minor uses for which it has been found to be more suitable than other oils, but for the most part it has been used as a substitute on the basis of its lower price. At various times during the last 25 years, it has found its chief outlet in each of the three major consumption fields for fats and oils—soap, the drying-oil industries, and food products. At present, therefore, soybean oiFs most im- portant advantage appears to be its versatility and ready adaptability to a wide variety of uses.
SOYBEAN MEAL
Soybean cake or meal, the product remaining after the oil has been separated, is used chiefly as a stock feed. As such, it competes with other domestically produced high-protein feeds, particularly linseed and cottonseed meals; and it is generally considered to be at least as valuable in dairy and other livestock feeds as either of these two meals.
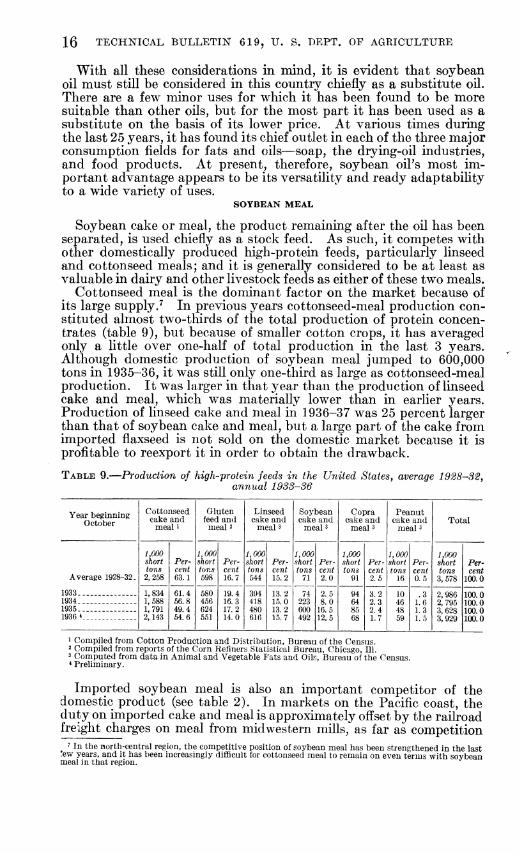
Cottonseed meal is the dominant factor on the market because of its large supply/ In previous years cottonseed-meal production con- stituted almost two-thirds of the total production of protein concen- trates (table 9), but because of smaller cotton crops, it has averaged only a little over one-half of total production in the last 3 years. Although domestic production of soybean meal jumped to 600,000 tons in 1935-36, it was still only one-third as large as cottonseed-meal production. It was larger in that year than the production of linseed cake and meal, which was materially lower than in earlier years. Production of linseed cake and meal in 1936-37 was 25 percent larger than that of soybean cake and meal, but a large part of the cake from imported flaxseed is not sold on the domestic market because it is profltable to reexport it in order to obtain the drawback.
TABLE 9.—Production of high~proteÍ7i feeds in the United States^ average 1928-S2y annual 1933-36
Year beginning October
Cottonseed cake and
meal i
Gluten feed and
meal 2
Linseed cake and
meal 3
Soybean cake and
meal 3
Copra cake and
meal 3
Peanut cake and
meal 3 Total
Average 1928-32.
1,000 short tons 2,258
Per- cent 63.1
1,000 short tons 598
Per- cent 16.7
1,000 short tons 544
Per- cent 15.2
1,000 short tons
71
Per- cent 2.0
1,000 short tons
91
Per- cent 2.5
1,000 short tons
16
Per- cent 0.5
1,000 short tons 3,578
Per- cent
100.0
1933 1,834 1,588 1,791 2,143
61.4 56.8 49.4 54.6
580 456 624 551
19.4 16.3 17.2 14.0
394 418 480 616
13.2 15.0 13.2 15.7
74 223 600 492
2.5 8.0
16.5 12.5
94 64 85 68
3.2 2.3 2.4 1.7
10 46 48 59
.3 1.6 1.3 1.5
2,986 2,795 3,628 3,929
100.0 100.0 100.0 100.0
1934 1935 1936*
1 Compiled from Cotton Production and Distribution, Bureau of the Census. 2 Compiled from reports of the Corn Refiners Statistical Bureau, Chicago, 111. 3 Computed from data in Animal and Vegetable Fats and Oils, Bureau of the Census. * Preliminary.
Imported soybean meal is also an important competitor of the domestic product (see table 2). In markets on the Pacific coast, the duty on imported cake and meal is approximately offset by the railroad freight charges on meal from midwestern mills, as far as competition
7 In the north-central region, the competitive position of soybean meal has been strengthened in the last !ev/ years, and it has been increasingly difficult for cottonseed meal to remain on even terms with soybean meal in that region.

SOYBEANS IN THE UNITED STATES 17
between the domestic and imported product is concerned. Conse- quently most of the imports are consumed on the Pacific coast near the ports of entry. Exports have been small relative to total produc- tion, and it is not probable that domestic soybean cake or meal will enter foreign markets to any larger extent in the near future.
Many industrial products have been developed from soybean meal, including glue and plastics. As a plastic, it is employed in the auto- mobile and electrical-appliance industries in the manufacture of various small articles, and has been the subject of experiment in other fields with varying degrees of success. An additional use is in the form of soybean flour, which is used in limited quantities in various food prod- ucts. Some further expansion in the domestic consumption of soy- bean flour seems probable. Although these and other industrial uses have attracted much attention, it is probable that considerably less than 10 percent of the total production of soybean meal is consumed in industry. Because of the large production in 1935-36, it is esti- mated that less than 3 percent was consumed in these uses.
FACTORS AFFECTING THE PRICE OF SOYBEANS
Three important factors directly influence soybean prices—the price of soybean meal, the price of soybean oil, and the demand for soybeans as seed. Although the last factor is still of some importance, especially in the spring and early summer months, it is not the dominant element that it used to be. With larger quantities of soybeans being crushed for oil and meal in the last 3 or 4 years, the prices of these two com- modities are the most important elements in the price farmers receive for their soybeans.^
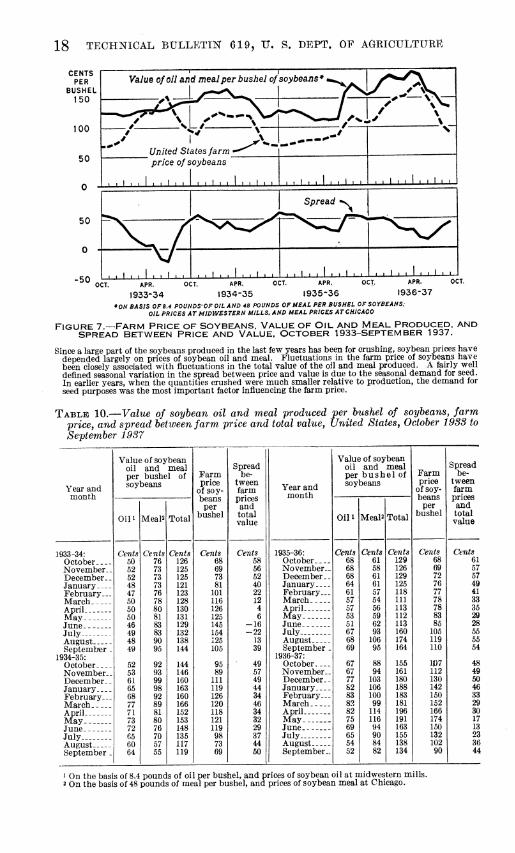
When the combined value of the oil and meal in a bushel of soybeans is computed by months on the basis of monthly average prices of meal and oil, it can be seen that the price of soybeans fluctuates in much the same way but at a somewhat lower level (fig. 7 and table 10). Thus, when the prices of oil and meal rose so as to cause the oil-and- meal value of 1 bushel of soybeans to increase from $1.55 in October 1936 to $1.88 in January 1937, the average price of soybeans in the United States rose from $1.07 to $1.42 per bushel during the same pe- riod. Because the bushel value of the meal is ordinarily considerably above that of the oil, it is the more important of the two factors, and soybean prices have been more closely associated with meal prices than with oil prices, especially during the last year.
The correlation between the oil-and-meal value and the price of soybeans is by no means perfect, largely because of the seasonal de- mand for seed. Because of this factor, there is a marked seasonal variation in the spread between price and value. The spread is great- est in the fall when most of the new crop is being sold for crushing. The average spread from October to December for the years 1934-36 was 53 cents.^ This represents the costs of marketing, transportation, storage, and processing, as well as the crushers' profits.
8 Oil and meal prices, however, have no direct influence on prices paid for the black- and brown-seed types, which are undesirable for crushing and are sold exclusively for planting.
9 Using Illinois prices instead of United States prices of soybeans, the average spread was 58 cents. Prices in Illinois are usually a little lower than average prices for the United States as a whole, because of the large production in that State, and the fact that a greater proportion of the production is crushed.
18 TECHNICAL BULLETIN 619, XT. S. DEPT. ÖV AGRICULTURE
APR. OCT. APR.
1933-34 1934-35 *0N BASIS OF8.4 POUNDS-QFOILAND 48 POUNDS OF MEAL PER BUSHEL OF SOYBEANS;
OIL PR JOES AT MIDWESTERN MILLS, AND MEAL PRICES AT CHICAGO
FIGURE 7.—FARM PRICE OF SOYBEANS. VALUE OF OIL AND MEAL PRODUCED. AND SPREAD BETWEEN PRICE AND VALUE. OCTOBER 1933-SEPTEMBER 1937.
Since a large part of the soybeans produced in the last few years has been for crushing, soybean prices have depended largely on prices of soybean oil and meal. Fluctuations in the farm price of soybeans have been closely associated with fluctuations in the total value of the oil and meal produced. A fairly well defined seasonal variation in the spread between price and value is due to the seasonal demand for seed. In earlier years, when the quantities crushed were much smaller relative to production, the demand for seed purposes was the most important factor influencing the farm price.
TABLE 10.—Value of soybean oil and meal produced per bushel of soybeans, farm pricey and spread between farm price and total valuey United Statesj October 1933 to September 1937
Value of soybean Value of soybean Spread oil and meal Spread oil and meal
r>p,r bushel of Farm be- per bush el of Farm be-
Year and month
soybeans price of soy-
tween farm Year and
month
soybeans price of soy- beans
tween farm
. ■■ beans prices per and per and
Olli Meal2 Total bushel total value
Oili Meal2 Total bushel total value
1933-34: Cents Cents Cents Cents Cents 1935-36: Cents Cents Cents Cents Cents October 50 76 126 68 58 October 68 61 129 68 61 November.. 52 73 125 69 56 November- 68 58 126 69 57 December. 52 73 125 73 52 December.. 68 61 129 72 57 January 48 73 121 81 40 January 64 61 125 76 49 February... 47 76 123 101 22 February..- 61 57 118 77 41 March. _ 50 78 128 116 12 March 57 54 111 78 33 April 50 80 130 126 4 April 57 56 113 78 35 May _- . 50 81 131 125 6 May 53 59 112 83 29 June ... 46 83 129 145 -16 June 51 62 113 85 28 July 49 83 132 154 -22 July 67 93 160 105 55 August 48 90 138 125 13 August 68 106 174 119 55 September . 49 95 144 105 39 September . 69 95 164 110 54
1934-35: 1936-37: October _. 52 92 144 95 49 October 67 88 155 107 48 November . 53 93 146 89 57 November.. 67 94 161 112 49 December.- 61 99 160 111 49 December.- 77 103 180 130 50 January 65 98 163 119 44 January 82 106 188 142 46 February... 68 92 160 126 34 February... 83 100 183 150 33 March. 77 89 166 120 46 March 82 99 181 152 29 April May
71 81 152 118 34 April 82 114 196 166 30 73 80 153 121 32 May 75 116 191 174 17
June. 72 76 148 119 29 June 69 94 163 150 13 July 65 70 135 98 37 July 65 90 155 132 23 August 60 57 117 73 44 August 54 84 138 102 36 September . 64 55 119 69 50 September.. 52 82 134 90 44
1 On the basis of 8.4 pounds of oil per bushel, and prices of soybean oil at midwestern mills. 2 On the basis of 48 pounds of meal per bushel, and prices of soybean meal at Chicago.
SOYBEANS IN THE UNITED STATES 19
During the spring and early summer months, this spread is reduced as the demand for soybeans for seed tends to raise their price without relation to the price of oil or meal. The average spread from April to June in 1935 and 1936 was only 31 cents/^ but the effect of seed demand was most marked in 1934, when the demand for soybeans as seed, brought about by the drought, raised the price considerably above the oil-and-meal value in June and July.
Prices for soybeans are largely dependent upon prices for oil and meal, which in turn depend on the supplies and prices of competing commodities, the most important of which are cottonseed oil and meal, and linseed oil and meal.
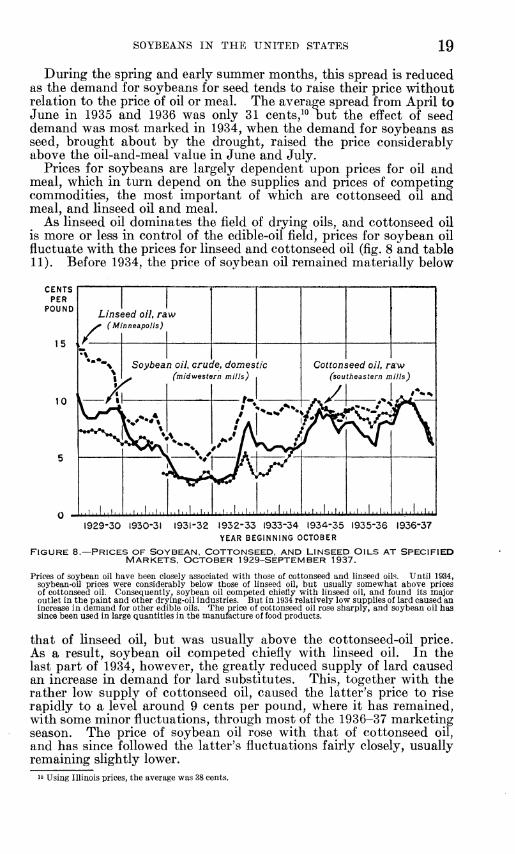
As linseed oil dominates the field of drying oils, and cottonseed oil is more or less in control of the edible-oil field, prices for soybean oil fluctuate with the prices for linseed and cottonseed oil (fig. 8 and table 11). Before 1934, the price of soybean oil remained materially below
CENTS PER
POUND
15 /-
Linseed oil, raw (Minneapolis)
Soybean oil, crude, domestic (midwestern milis)
Cottonseed oil, raw (southeastern mills)
1929-30 1930-31 1931-32 1932-33 1933-34 1934-35 1935-36 1936-37 YEAR BEGINNING OCTOBER
FIGURE 8. -PRICES OF SOYBEAN, COTTONSEED, AND LINSEED OILS AT SPECIFIED MARKETS, OCTOBER 1929-SEPTEMBER 1937.
Prices of soybean oil have been closely associated with those of cottonseed and linseed oils. Until 1934, soybean-oil prices were considerably below those of linseed oil, but usually somewhat above prices of cottonseed oil. Consequently, soybean oil competed chiefly with linseed oil, and found its major outlet in the paint and other drying-oil industries. But in 1934 relatively low supplies of lard caused an increase in demand for other edible oils. The price of cottonseed oil rose sharply, and soybean oil has since been used in large quantities in the manufacture of food products.
that of linseed oil, but was usually above the cottonseed-oil price. As a result, soybean oil competed chiefly with linseed oil. In the last part of 1934, however, the greatly reduced supply of lard caused an increase in demand for lard substitutes. This, together with the rather low supply of cottonseed oil, caused the latter's price to rise rapidly to a level around 9 cents per pound, where it has remained, with some minor fluctuations, through most of the 1936-37 marketing season. The price of soybean oil rose with that of cottonseed oil, and has since followed the latter's fluctuations fairly closely, usually remaining slightly lower.
10 Using Illinois prices, the average was 38 cents.
20 TECHNICAL BULLETIN 619, U. S. DEPT. OF AGRICULTURE
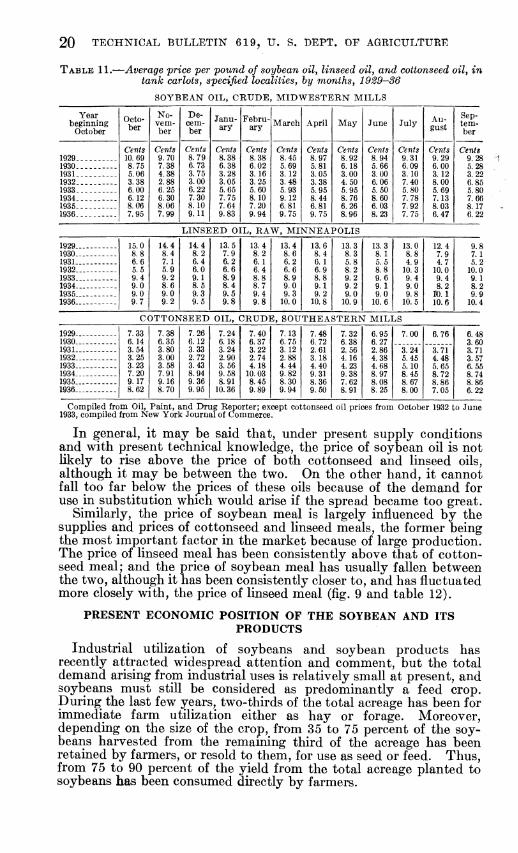
TABLE 11.—Average price per pound of soybean oily linseed oil, and cottonseed oily in tank carlots, specified localities, hy months, 1929-36
SOYBEAN OIL, CRUDE MIDWESTERN MILLS
Year beginning
October
Octo- ber
No- vem- ber
De- cem- ber
Janu- ary
Febru- ary March April May June July Au-
gust
Sep- tem- ber
1929 ---- Cents 10.69 8.75 5.06 3.38 6.00 6.12 8.06 7.95
Cents 9.70 7.38 4.38 2.88 6.25 6.30 8.06 7.99
Cents 8.79 6.73 3.75 3.00 6.22 7.30 8.10 9. U
Cents 8.38 6.38 3.28 3.05 5.65 7.75 7.64 9.83
Cents 8.38 6.02 3.16 3.25 5.60 8.10 7.20 9.94
Cents 8.45 5.69 3.12 3.48 5.93 9.12 6.81 9.75
Cents 8.97 5.81 3.05 3.38 5.95 8.44 6.81 9.75
Cents 8.92 6.18 3.00 4.50 5.95 8.76 6.26 8.96
Cents 8.94 5.66 3.00 6.06 5.50 8.60 6.03 8.23
Cents 9.31 6.09 3.10 7.40 5.80 7.78 7.92 7.75
Cents 9.29 6.00 3.12 8.00 5.69 7.13 8.03 6.47
Cents 9.28
1930 --- 5 28 1931 - - 3 22 1932 ._ 6.85 1933 5.80 1934 7 66 1935 8.17 1936 6 22
LINSEED OIL, RAW, MINNEAPOLIS
1929- 1930-. 1931- 1932- 1933- 1934- 1935- 1936-
15.0 14.4 14.4 13.5 13.4 13.4 13.6 13.3 13.3 13.0 12.4 8.8 8.4 8.2 7.9 8.2 8.6 8.4 8.3 8.1 8.8 7.9 6.6 7.1 6.4 6.2 6.1 6.2 6.1 5.8 5.5 4.9 4.7 5.5 5.9 6.0 6.6 6.4 6.6 6.9 8.2 8.8 10.3 10.0 9.4 9.2 9.1 8.9 8.8 8.9 8.8 9.2 9.6 9.4 9.4 9.0 8.6 8.5 8.4 8.7 9.0 9.1 9.2 9.1 9.0 8.2 9.0 9.0 9.3 9.5 9.4 9.3 9.2 9.0 9.0 9.8 Ï0. 1 9.7 9.2 9.5 9.8 9.8 10.0 10.8 10.9 10.6 10.5 10.6
9.8 7.1 5.2
10.0 9.1 8.2 9.9
10.4
COTTONSEED OIL, CRUDE, SOUTHEASTERN MILLS
1929- 1930- 1931- 1932- 1933- 1934- 1936- 1936_.
7.33 6.14 3.54 3.25 3.23 7.20 9.17 8.62
7.38 6.35 3.80 3.00 3.58 7.91 9.16 8.70
7.26 6.12 3.33 2.72 3.43 8.94 9.36 9.95
7.24 6.18 3.24 2.90 3.56 9.58 8.91
10.36
7.40 6.37 3.22 2.74 4.18
10.03 8.45
7.13 6.75 3.12 2.88 4.44 9.82 8.30 9.94
7.48 6.72 2.61 3.18 4.40 9.31 8.36 9.50
7.32 6.38 2.56 4.16 4.23 9.38 7.62 8.91
6.95 6.27 2.86 4.38 4.68 8.97 8.08 8.25
7.00
3.24 5.45 5.10 8.45 8.67 8.00
6.76
3.71 4.48 5.65 8.72 8.86 7.05
3.60 3.71 3.57 6.55 8.74 8.86 6.22
Compiled from Oil, Paint, and Drug Reporter; except cottonseed oil prices from October 1932 to June 1933, compiled from New York Journal of Commerce.
In general, it may be said that, under present supply conditions and with present technical knowledge, the price of soybean oil is not likely to rise above the price of both cottonseed and linseed oils, although it may be between the two. On the other hand, it cannot fall too far below the prices of these oils because of the demand for use in substitution which would arise if the spread became too great.
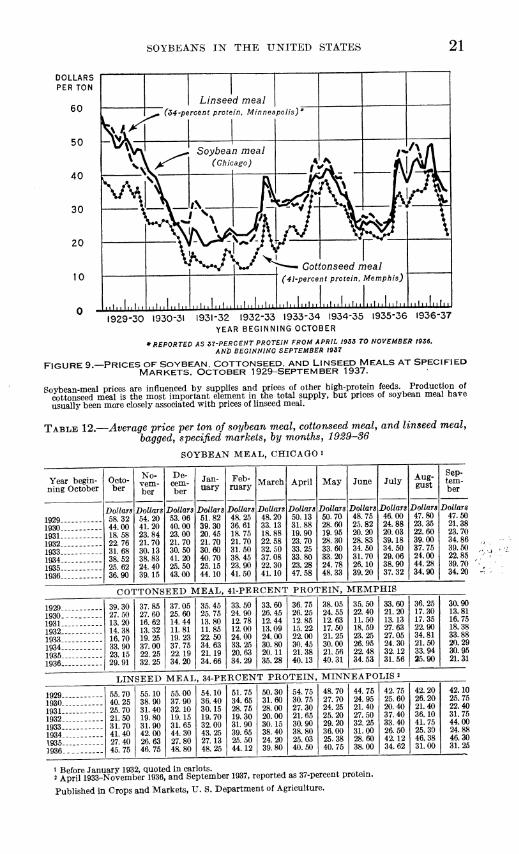
Similarly, the price of soybean meal is largely influenced by the supplies and prices of cottonseed and linseed meals, the former being the most important factor in the market because of large production. The price of linseed meal has been consistently above that of cotton- seed meal; and the price of soybean meal has usually fallen between the two, although it has been consistently closer to, and has fluctuated more closely with, the price of linseed meal (fig. 9 and table 12).
PRESENT ECONOMIC POSITION OF THE SOYBEAN AND ITS PRODUCTS
Industrial utilization of soybeans and soybean products has recently attracted widespread attention and comment, but the total demand arising from industrial uses is relatively small at present, and soybeans must still be considered as predominantly a feed crop. During the last few years, two-thirds of the total acreage has been for immediate farm utilization either as hay or forage. Moreover, depending on the size of the crop, from 35 to 75 percent of the soy- beans harvested from the remaining third of the acreage has been retained by farmers, or resold to them, for use as seed or feed. Thus, from 75 to 90 percent of the yield from the total acreage planted to soybeans has been consumed directly by farmers.
SOYBEANS IN THE UNITED STATES 21
Cottonseed meal (41-percent protein. Memphis)
J.jMlMl.J.J.JMlMl.J..I..'..l..l-'lMl.JMl..lMl..lMlMlitlnlMlMlMliiliilli[ii
1929-30 1930-31 1931-32 1932-33 1933-34 1934-35 1935-36 1936-37 YEAR BEGINNING OCTOBER
* REPORTED AS ST-PERCENT PROTEIN FROM APRIL 1933 TO NOVEMBER 1936. AND BEGINNING SEPTEMBER 1957
FIGURE 9 —PRICES OF SOYBEAN. COTTONSEED, AND LINSEED MEALS AT SPECIFIED MARKETS. OCTOBER 1929-SEPTEMBER 1937.
Sovbean-meal prices are influenced by supplies and prices of other high-protein feeds. Production of cottonseed meal is the most important element in the total supply, but prices of soybean meal have usually been more closely associated with prices of linseed meal.
TABLE 12.—Average price per ton of soybean meal, cottonseed mealy and linseed meal, bagged, specified markets, by months, 1929-36
SOYBEAN MEAL, CHICAGO i
Year begin- ning October
1929-. 1930- 1931- 1932- 1933- 1934- 1935-
Octo- ber
Dollars 58.32 44.00 18.58 22.76 31.68 38.52 25.62 36.90
No- vem- ber
Dollars 54.20 41.20 23.84 21.70 30.13 38.83 24.40 39.15
De- cem- ber
Dollars 53.06 40.00 23.00 21.70 30.50 41.20 25.50 43.00
Jan- uary
Dollars 51.82 39.30 20.45 21.70 30.60 40.70 25.15 44.10
Feb- ruary
Dollars 48.25 36.61 18.75 21.70 31.50 38.45 23.90 41.50
March
Dollars 48.20 33.13 18.88 22.58 32.50 37.08 22.30 41.10
April
Dollars 50.13 31.88 19.90 23.70 33.25 33.80 23.28 47.58
May
Dollars 60.70 28.60 19.95 28.30 33.60 33.20 24.78 48,33
June
Dollars 48.75 25.82 20.20 28.83 34.50 31.70 26.10 39.20
July
Dollars 46.00 24.88 20.03 39.18 34.50 29.06 38.90 37.32
Aug- gust
Dollars 47.80 23.35 22.60 39.00 37.75 24.00 44.28 34.90
Sep- tem- ber
Dollars 47.50 21.38 23.70 34.86 39.50 22.85 39.70 34.20
COTTONSEED MEAL, 41-PERCENT PROTEIN, MEMPHIS
1929- 1930. 1931- 1932- 1933- 1934- 1935- 1936-
39.30 37.86 37.06 27.60 27.60 25.60 13.20 16.62 14.44 14.38 13.32 11.81 16.70 19.25 19.23 33.90 37.00 37.76 23.16 22.25 22.19 29.91 32.26 34.20
35.46 25.75 13.80 11.85 22.50 34.63 21.19 34.66
33.50 24.90 12.78 12.00 24.00 33.25 20.63 34.29
33.60 26.45 12.44 13.09 24.00 30.80 20.11 35.28
36.75 26.25 12.85 15.22 22.00 30.45 21.38 40.13
38.05 24.55 12.63 17.50 21.25 30.00 21.56 40.31
35.50 22.40 11.60 18.69 23.25 26.95 22.48 34.53
33.60 21.20 13.13 27.63 27.06 24.30 32.12 31.66
36.25 17.30 17.36 22.90 34.81 21.60 33.94 26.90
30.90 13.81 16.75 18.38 33.88 20.29 30.95 21.31
LINSEED MEAL, 34-PERCENT PROTEIN, MINNEAPOLIS 2
1929- 1930- 1931- 1932- 1933- 1934- 1936-
55.70 40.25 25.70 21.60 31.70 41.40 27.40 45.76
66.10 38.90 31.40 19.80 31.90 42.00 26.63 46.75
56.00 37.90 32.10 19.15 31.66 44.30 27.80 48.80
64.10 36.40 30.16 19.70 32.00 43.25 27.13 48.26
61.76 34.66 28.75 19.30 31.90 39.65 25. 60 44.12
50.30 31.60 28.00 20.00 30.16 38.40 24.20 39.80
64.76 30.76 27.30 21.66 30.90 38.80 25.03 40.50
48.70 27.70 24.25 25.20 29.20 36.00 25.38 40.75
44.76 24.95 21.40 27.60 32.25 31.00 28.60 38.00
42.75 25.60 20.40 37.40 33.40 26.50 42.12 34.62
42.20 26.20 21.40 36.10 41.75 26.30 46.38 31.00
42.10 25.76 22.40 31.75 44.00 24.88 46.30 31.25
1 Before January 1932, quoted in car lots. . ^ „„ 4. 4. • 2 April 1933-Novembér 1936, and September 1937, reported as 37-percent protem.
Published in Crops and Markets, U. S. Department of Agriculture.

22 TECHNICAL BULLETIN 619, U. S. DEPT. OF AGRICULTURE
The remaining 10 to 25 percent has been used for crushing purposes. Of the products of crushing, about 45 percent of the value has been ascribable to the oil that is used entirely in industry, and 55 percent to the meal, over nine-tenths of which is returned to farmers as stock feed. Approximately one-half, therefore, of the demand for crushing is derived indirectljr from farmers. With these circumstances in mind, it is evident that industry has provided a rather small part of the total demand for soybeans during recent years, with farmers themselves the immediate or ultimate consumers of 90 to 95 percent of the yield from the total acreage of soybeans.
SOYBEAN OIL
Of the industrial demand, by far the greatest part is for soybean oil- It is important to note, therefore, that with present technical knowl- edge soybean oil is still essentially a substitute oil. The uses to which it has been found to be specially adapted supply an outlet for only a small part^ of the production. Most of the soybean oil now being consumed is used as a substitute, in whole or in part, for oils that are generally more expensive but better adapted to the purpose. In edible products it is at a disadvantage because of its tendency to acquire an unpleasant flavor on aging; consequently its use in this field is largely on the basis of its lower price. Efforts are being made to ehminate the flavor reversion, but thus far without much success. If and when suppUes of lard and cottonseed oil return to their former high levels, consumption of soybean oil in food products may decrease sharply unless this disadvantage is overcome in the meantime.
In paints and varnishes soybean oil is handicapped by a relativelv low drying power, and is mixed with other oils of higher drying quali- ties, chiefly on the basis of its lower price. Experiments have been undertaken to provide new and better methods for making use of soy- bean oil in the paint and other drying-oil industries. In the case of the paint industry, the popular preference for linseed oil must also be considered. Because of this, the progress of soybean oil in that industry must necessarily be gradual. If there should be a sudden decrease in demand for soybean oil in the edible field, it is probable that the drying-oil industries could absorb the surplus only at ma- terially lower prices.
SOYBEAN MEAL
At present, the industrial utilization of soybean meal constitutes only a small part of production, and consequently an outlet for most of the meal produced must be found in the highly competitive feed market. Domestic soybean meal competes not only with cottonseed meal, linseed meal, and other^ domestically produced high-protein feeds, but also with Manchurian soybean meal which enters the United States in fairly large quantities over the present relatively low tariff. Any marked increase in the domestic price of soybean meal usually^ attracts larger imports, which in turn tend to depress the domestic price. An expanded industrial market for soybean meal, which would remove a larger proportion of the production from feed channels, would be highly desirable from the viewpoint of both grower and processor.

SOYBEANS IN THE UNITED STATES 23
ELASTICITY OF DEMAND
Because of the highly competitive markets for soybean oil and soy- bean meal, and the subordinate position that each holds in its field so far as quantity produced is concerned, the demand for both oil and meal, and consequently the demand for soybeans for crushing, is rela- tively elastic. That is, an increase or decrease in the price of soybean oil or meal, relative to prices of competing products, would result in a marked change in consumption in the opposite direction. In the case of soybean oil, changes in relative prices may also result in shifts in consumption among food products, the drying-oil industries, and soap.
ELASTICITY OF SUPPLY
As indicated by the tremendous changes that occurred both in total acreage and in production during the last 3 years, the supply of soybeans is also highly elastic. Generally speaking, soybeans can be grown in practically all localities where corn can be grown, and con- sequently the acreage planted to soybeans could easily be expanded to several times the present acreage, if conditions warranted such an increase. Moreover, the production of beans is even more elastic than total acreage, for even if acreage remains the same, production can be increased or decreased by a change in the proportion of the total acreage that is harvested for beans. Increases are limited, however, by the extent to which growers are equipped to harvest beans. Production for crushing purposes in any one year will also be limited to the acreage of the yellow varieties. Finally, the supply available for crushing or export is still more elastic than production, since a variable quantity of soybeans is fed each year directly to live- stock instead of being sent to the crushing mill. The cake or meal is a valuable feedstuff, and there is little loss in feeding value when soybeans are crushed. In fact for some types of feeding, the meal has proved more desirable than the beans. Consequently, with any given production, changes in industrial demand for oil or meal tend to bring a larger or smaller part of the production to the crushing mills.
The statements in the previous paragraph are aptly illustrated by events during recent years. The year-to-year changes in total acreage since 1929 have been fairly large, but the percentage changes in production have usually exceeded those in acreage. The relative fluctuations in the quantity crushed or exported in most years, have been two or three times the changes in production. Thus, total acreage in 1934 was 59 percent larger than in 1933, while production increased 76 percent, and the quantity crushed and exported increased almost 200 percent. In 1935, acreage increased 19 percent, produc-v tion 92 percent, and the quantity crushed and exported 214 percent over the previous year.
SOYBEAN PRODUCTION
The marked increases in acreage and production that occurred in 1934 and 1935 were the result of several coincidental factors. Prices paid for the 1931 and 1932 crops of soybeans had been very low, but somewhat better prices had been received by growers in 1933. More- over, prices of soybeans since 1930 had been relatively more attractive than prices of corn. These circumstances tended to bring about an increase in the 1934 acreage harvested for beans. The largest increase in 1934, however, occurred in the acreage for hay. The effects of the
24 TECHNICAL BULLETIN 619, U. S. DEPT. OF AGRICULTURE
drought were evident early in the season, causing farmers to plant a tremendously increased acreage of soybeans as an emergency hay crop. ^ Finally, the program of the Agricultural Adjustment Admin- istration reinforced these factors by limiting the acreage of other crops.
^ In the last part of 1934, when the shortage of lard and cottonseed oil had become apparent, there was an increased demand for edible oils, including soybean oil. Because of the drought there was also a strong demand for soybean meal. Consequently, the market for soybeans was good, and relatively high prices were paid to growers although production was much larger than ever before. This was probably the chief reason for the big increase in the acreage harvested for beans in 1935, although the continuation of the agricultural- adjustment program and the hazard caused by the chinch bug were additional factors. With favorable growing conditions for other hay crops, the soybean acreage harvested for hay was reduced slightly from the high level of 1934.
Demand for soybean oil remained fairly good in the last half of 1935 but meal prices were very low, and the prices paid for the large 1935 production of soybeans were considerably lower than the 1934 prices. Reduced production in 1936 resulted partly from lower yields and partly from a smaller acreage. The latter was caused by the elimina- tion of the program of the Agricultural Adjustment Administration, and, to a lesser extent, by the somewhat lower prices paid for the previous year's crop. The fact that soybeans, when harvested for crushing, were classified as a soil-depleting crop under the soil-conserva- tion program may also have been a factor.
Reduced production, together with strong demand for both soy- bean oil and soybean meal, resulted in fairly high prices for the 1936 crop. But prices of corn and other feed grains were also relatively high in 1936, and farmers did not increase their total soybean acreage very much in 1937. Unusually high yields per acre, however, caused production to exceed the 1936 production by more than one-third.
It is evident that much of the increase in acreage and production that has occurred since 1933 has been of an emergency nature, or the result of unusual conditions. Moreover, the increased crushing of soybeans during the last several years has been accompanied by an increased demand for the products of crushing. The relatively short supply of edible fats and oils has provided a good market for soybean oil in food products; and reduced production of cottonseed and lin- seed meals, together with drought conditions in 1934 and 1936, has resulted in a strong demand for soybean cake and meal during most of this period. Whether or not the demand for soybean products is to remain at its present level wiU depend to a considerable extent on fu- ture domestic and world supplies of competing products—particularly lard, cottonseed, and flaxseed.
If these supplies^ should return to their predepression levels,^^ a material reduction in the demand for soybeans for crushing may be expected, unless improved methods of utiUzing soybean oil and meal in industry have been developed in the meantime. Extensive re-
" A record cotton crop in 1937 has already resulted in a large increase in the supply of cottonseed available for crushing, and prices of soybean oil and meal have fallen considerably from their 1936-37 levels. Pro- duction of lard, however, although apparently increasing, is still relatively low. Moreover, the domestic flaxseed crop in 1937 has not shown any significant increase over the low production of 1936, and the price of linseed oil has been 4 or 5 cents per pound higher than the price of soybean oil during the last quarter of 1937. If this large spread should continue, there might be some shift in soybean-oif consumption from edible products to the drying-oil industries.
SOYBEANS IK THE UNITED STATES 25
search is now being carried on by various public and private agencies which are trying to discover new uses for soybean oil and meal, and to improve the technical methods involved in present uses. It is impossible to foresee the extent to which these experiments will be successful during the next few years.
In view of the uncertaiuty as to future demand conditions, a marked or too rapid increase in the production of soybeans for crushing does not appear advisable. Although facilities are available for processing and marketing a much larger crop than has so far been produced, there has not been an opportunity to observe the marketing of the crop under normal competitive conditions. The quantity of soybeans that can be marketed at favorable prices compared with those pre- vailing for competing products has not yet been demonstrated; and it is not clear at present to what extent soybeans and soybean products may tend to replace other products. Experience in the next few years will probably give a more definite indication concerning the position that soybeans are to fill in American agriculture and industry.
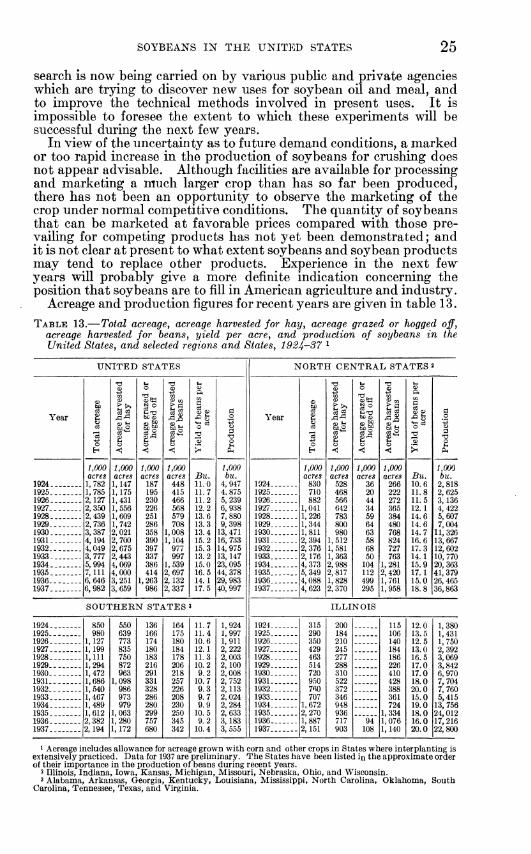
Acreage and production figures for recent years are given in table 13.
TABLE 13.—Total acreagey acreage harvested for hay^ acreage grazed or hogged off, acreage harvested for beans, yield per acre, and production of soybeans in the United States, and selected regions and States, 192^-37 ^
UNITED STATES
Year
1924. 1925. 1926. 1927. 1928. 1929. 1930. 1931. 1932., 1933. 1934. 1935. 1936-. 1937.
T? M ^ (H
S -2 p. 9^ œÇo ® M
3 o
^1 si p
h < < < >^ 1,000 1,000 1,000 1,000 acres acres acres acres Bu. 1,782 1,147 187 448 11.0 1,785 1,175 195 415 11.7 2,127 1,431 230 466 11.2 2,350 1,556 226 568 12.2 2,439 1,609 251 579 13.6 2,736 1,742 286 708 13.3 3,387 2,021 358 1,008 13.4 4,194 2,700 390 1,104 15.2 4,049 2,675 397 977 15.3 3,777 2,443 337 997 13.2 5,994 4,069 386 1,539 15.0 7,111 4,000 414 2,697 16.5 6,646 3,251 1,263 2,132 14.1 6,982 3,659 986 2,337 17.5
1,000 bu.
4,947 4.875 5,239 6,938 7,880 9,398
13,471 16, 733 14, 975 13, 147 23, 095 44, 378 29, 983 40, 997
SOUTHERN STATES 3
1924. 1925- 1926- 1927. 1928. 1929. 1930. 1931- 1932- 1933. 1934. 1935- 1936. 1937.
850 550 136 164 11.7 980 639 166 175 11.4
1,127 773 174 180 10.6 1,199 835 180 184 12.1 1,111 750 183 178 11.3 1,294 872 216 206 10.2 1,472 963 291 218 9.2 1,686 1,098 331 257 10.7 1,540 986 328 226 9.3 1,467 973 286 208 9.7 1,489 979 280 230 9.9 1,612 1,063 299 250 10.5 2,382 1,280 757 345 9.2 2,194 1,172 680 342 10.4
1,924 1,997 1,911 2,222 2,003 2,100 2,008 2,752 2,113 2,024 2,284 2,633 3,183 3,555
NORTH CENTRAL STATES a
Year
1924 1925 1926 1927 1928 1929 1930 1931. 1932 1933 1934 1935. 1936. 1937
1924 1925 1926. 1927. 1928. 1929 1930. 1931. 1932 1933 1934 1935 1936 1937.
1,000 acres
830 710 882
1,041 1,226 1,344 1,811 2,394 2,376 2,176 4,373 5,349 4,088 4,623
§s
1,000 acres
528 468 566 642 783 800 980
1,512 1, 581 1,363 2,988 2,817 1,828 2,370
T3
1,000 acres
36 20 44 34 59 64 63 58 68 50
104 112 499 295
of Sa i
1,000 acres
266 222 272 365 384 480 768 824 727 763
1,281 2,420 1,761 1,958
Bu. 10.6 11.8 11.5 12.1 14.6 14.6 14.7 16.6 17.3 14.1 15.9 17.1 15.0 18.8
1,000 bu.
2,818 2,625 3,136 4,422 5,607 7,004
11, 326 13,667 12,602 10, 770 20,363 41, 379 26, 465 36,863
315 290 350 429 463 514 720 950 760 707
1,672 2,270
887 2,151
200 184 210 245 277 288 310 522 372 346 948 936 717 903
94 108
115 106 140 184 186 226 410 428 388 361 724
1,334 1,076 1,140
12.0 13.5 12.5 13.0 16.5 17.0 17.0 18.0 20.0 15.0 19.0 18.0 16.0 20.0
1,380 1,431 1,750 2,392 3,069 3,842 6,970 7,704 7,760 5,415
13, 756 24,012 17, 216 22,800
i Acreage includes allowance for acreage grown with corn and other crops in States where interplanting is extensively practiced. Data for 1937 are preliminary. The States have been listed in the approximate order of their importance in the production of beans during recent years.
2 Illinois, Indiana, Iowa, Kansas, Michigan, Missouri, Nebraska, Ohio, and Wisconsin. 3 Alabama, Arkansas, Georgia, Kentucky, Louisiana, Mississippi, North Carolina, Oklahoma, South
Carolina, Tennessee, Texas, and Virginia.
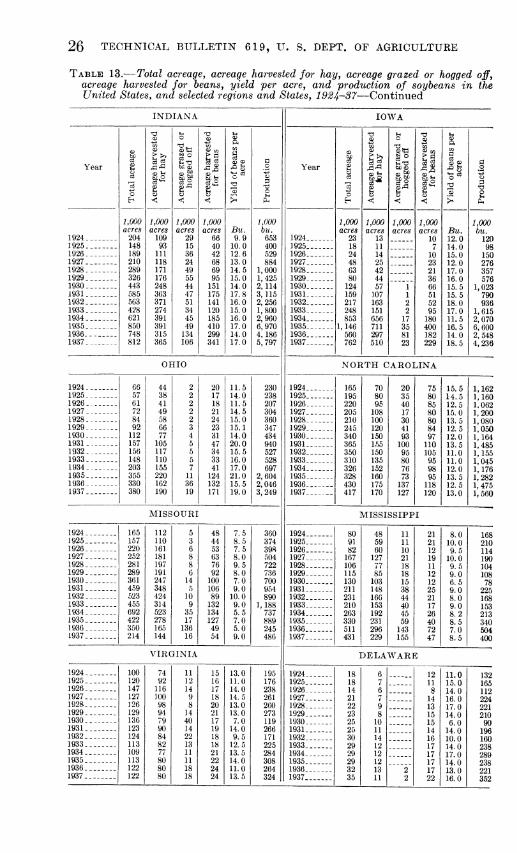
26 TECHNICAL BULLETIN 619, U. S. DEPT. OF AGRICULTURE
TABLE 13.—Total acreage., acreage harvested for hay y acreage grazed or hogged off, acreage harvested for beans, yield per acre, and production of soybeans in the United States, and selected regions and States, 1924-37—Continued
INDIANA
'V u TJ f~i
-M P* o5tl
Year 1 l?1 § S S ^c
13 £ s¿ C3^ 2 o H < <¡ < >^
1,000 1,000 1,000 1,000 acres acres acres acres Bu.
1924 204 109 29 66 9.9 1925 148 93 15 40 10.0 1926 189 111 36 42 12.6 1927 210 118 24 68 13.0 1928 289 171 49 69 14.5 1929 326 176 55 95 15.0 1930 443 248 44 151 14.0 1931 585 363 47 175 17.8 1932 563 371 51 141 16.0 1933 428 274 34 120 15.0 1934 621 391 45 185 16.0 1935 850 391 49 410 17.0 1936 748 315 134 299 14.0 1937 812 365 106 341 17.0
OHIO
1924 1925 1926 1927 1928 1929 1930 1931 1932 1933 1934 1935 1936 1937
MISSOURI
1924 1925 1926 1927 1928 1929 1930 1931 1932 1933 1934 1935 1936 1937
VIRGINIA
1924 1925 1926 1927 1928 1929 1930 1931 1932 1933 1934 1935 1936 1937
1,000 bu. 653 400 529 884
1,000 1,425 2,114 3,115 2,256 1,800 2,960 6,970 4,186 5,797
66 44 2 20 11.5 57 38 2 17 14.0 61 41 2 18 11.5 72 49 2 21 14.5 84 58 2 24 15.0 92 66 3 23 15.1 112 77 4 31 14.0 157 105 5 47 20.0 156 117 5 34 15.5 148 110 5 33 16.0 203 155 7 41 17.0 355 220 11 124 21.0 330 162 36 132 15.5 380 190 19 171 19.0
230 238 207 304 360 347 434 940 527 528 697
2,604 2,046 3,249
165 112 5 48 7.5 157 110 3 44 8.5 220 161 6 53 7.5 252 181 8 63 8.0 281 197 8 76 9.5 289 191 6 92 8.0 361 247 14 100 7.0 459 348 5 106 9.0 523 424 10 89 10.0 455 314 9 132 9.0 692 523 35 134 5.5 422 278 17 127 7.0 350 165 136 49 5.0 214 144 16 54 9.0
360 374 398 504 722 736 700 954 890
1,188 737 889 245 486
100 74 11 15 13.0 120 92 12 16 11.0 147 116 14 17 14.0 127 100 9 18 14.5 126 98 8 20 13.0 129 94 14 21 13.0 136 79 40 17 7.0 123 90 14 19 14.0 124 84 22 18 9.5 113 82 13 18 12.5 109 77 11 21 13.5 113 80 11 22 14.0 122 80 18 24 11.0 122 80 18 24 13.5
195 176 238 261 260 273 119 266 171 225 284 308 264 324
IOWA
Year
1924, 1925. 1926 1927 1928 1929 1930 1931 1932 1933 1934 1935 1936 1937
T3 Ui 'O u -2 B K 03 ^50 P OT
1 II Art e3
-22
^ 1* ©fl |ë o °^
o ü ^ < < < ><
1,000 1,000 1,000 1,000 acres acres acres acres Bu.
23 13 10 12.0 18 11 7 14.0 24 14 10 15.0 48 25 23 12.0 63 42 21 17.0 80 44 36 16.0 124 57 1 66 15.5 159 107 1 51 15.5 217 163 2 52 18.0 248 151 2 95 17.0 853 656 17 180 11.5
1,146 711 35 400 16.5 560 297 81 182 14.0 762 510 23 229 18.5
NORTH CAROLINA
1924, 1925 1926 1927. 1928 1929 1930, 1931. 1932. 1933 1934. 1935 1936. 1937.
165 70 20 75 15.5 195 80 35 80 14.5 220 95 40 85 12.5 205 108 17 80 15.0 210 100 30 80 13.5 245 120 41 84 12.5 340 150 93 97 12.0 365 155 100 110 13.5 350 150 95 105 11.0 310 135 80 95 11.0 326 152 76 98 12.0 328 160 73 95 13.5 430 175 137 118 12.5 417 170 127 120 13.0
MISSISSIPPI
1924 1925 1926 1927 1928 1929 1930 1931 1932 1933 1934 1935 1936. 1937.
80 48 11 21 8.0 91 59 11 21 10.0 82 60 10 12 9.5 167 127 21 19 10.0 106 77 18 11 9.5 115 85 18 12 9.0 130 103 15 12 6.5 211 148 38 25 9.0 231 166 44 21 8.0 210 153 40 17 9.0 263 192 45 26 8.2 330 231 59 40 8.5 511 296 143 72 7.0 431 229 155 47 8.5
DELAWARE
1924 1925. 1926 1927. 1928. 1929. 1930 1931. 1932. 1933. 1934. 1935. 1936. 1937.
IL O 15.0 14.0 16.0 17.0 14.0 6.0 14.0 10.0 14.0 17.0 14.0 13.0 16.0
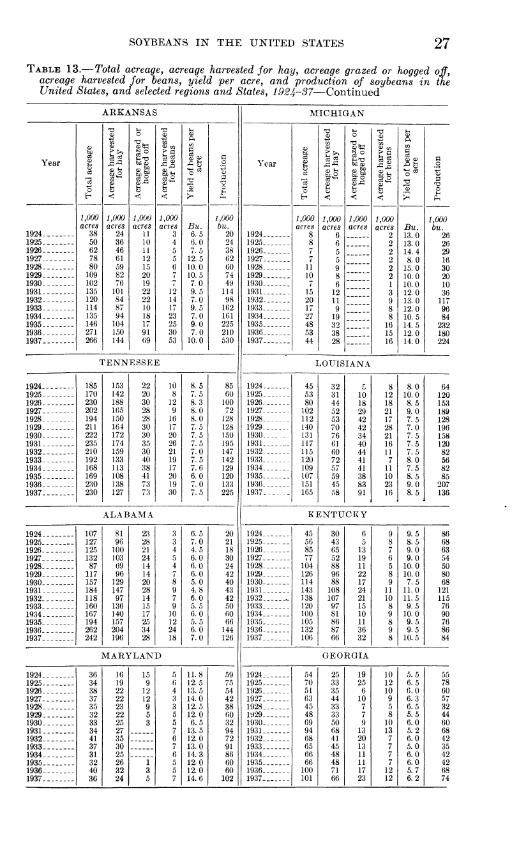
SOYBEANS IN THE UNITED STATES 27
TABLE 13.—Total acreage, acreage harvested for hay, acreage grazed or hogged off, acreage harvested for beans, yield per acre, and production of soybeans in the United States, and selected regions and States, 1924-37—Continued
ARKANSAS
Xi ^ T3 >H
cs <D <v
o «5« <ü c«
1 Co ® h "^ l5 1^ Sä P o«
o Ü Ü ^ » h < < < >^
1,000 1,000 1,000 1,000 acres acres acres acres Bu.
38 24 11 3 6.5 5Ü 36 10 4 6.0 62 46 11 5 7.5 78 61 12 5 12.5 80 59 15 6 10.0 109 82 20 7 10.5 102 76 19 7 7.0 135 101 22 12 9.5 120 84 22 14 7.0 114 87 10 17 9.5 135 94 18 23 7.0 146 104 17 25 9.0 271 150 91 30 7.0 266 144 69 53 10.0
TENNESSEE
185 153 22 10 8.5 170 142 20 8 7.5 230 188 30 12 8.3 202 165 28 9 8.0 194 150 28 16 8.0 211 164 30 17 7.5 222 172 30 20 7. 5 235 174 35 26 7.5 210 159 30 21 7.0 192 133 40 19 7.5 168 113 38 17 7.6 169 108 41 20 6.0 230 138 73 19 7.0 230 127 73 30 7.5
ALABAMA
107 81 23 3 6.5 127 96 28 3 7.0 125 100 21 4 4.5 132 103 24 5 6.0 87 69 14 4 6.0 117 96 14 7 6.0 157 129 20 8 5.0 184 147 28 9 4.8 118 97 14 7 6.0 160 136 15 9 5.5 167 140 17 10 6.0 194 157 25 12 5.5 262 204 34 24 6.0 242 196 28 18 7.0
MARYLAND
36 16 15 5 11.8 34 19 9 6 12.5 38 22 12 4 13.5 37 22 12 3 14.0 35 23 9 3 12.5 32 22 5 5 12.0 33 25 3 5 6.5 34 27 7 13.5 41 35 6 12.0 37 30 7 13.0 31 25 6 14.3 32 26 1 5 12.0 40 32 3 5 12.0 36 24 5 7 14.6
1,000 bu.
20 24 38 62 60 74 49 114 98 162 161 225 210 530
85 60 100 72 128 128 150 195 147 142 129 120 133 225
20 21 18 30 24 42 40 43 42 50 60 66 144 126
59 75 54 42 38 60 32 94 72 91 86 60 60
102
MICHIGAN
Year
1924. 1925. 1926. 1927. 1928. 1929. 1930. 1931. 1932. 1933. 1934. 1935. 1936. 1937.
1,000 acres
03 g
O) »1
^«2
1,000 acres
6 6 5 5 9
'O
S|
1,000 acres
le
1,000 acres
2 2 2 2 2 2 1 3
Bu. 13.0 13.0 14.4 8.0
15.0 10.0 10.0 12.0 13.0 12.0 10.5 14.5 12.0 14.0
LOUISIANA
1924 1925 1926 1927 1928 1929 1930 1931 1932 1933 1934 1935 1936 1937
45 32 r 8 8.0 53 31 10 12 10.0 80 44 18 18 8.5 102 52 29 21 9.0 112 53 42 17 7.5 140 70 42 28 7.0 131 76 34 21 7.5 117 61 40 16 7.5 115 60 44 11 7.5 120 72 41 7 8.0 109 57 41 11 7.5 107 59 38 10 8.5 151 45 83 23 9.0 165 58 91 16 8.5
KENTUCKY
1924 1925 1926 1927 1928 1929 1930. 1931 1932 1933. 1934 1935. 1936 1937.
45 30 6 9 9.5 56 43 5 8 8.5 85 65 13 7 9.0 77 52 19 6 9.0 104 88 11 5 10.0 126 96 22 8 10.0 114 88 17 9 7.5 143 108 24 11 11.0 138 107 21 10 11.5 120 97 15 8 9.5 100 81 10 9 10.0 105 86 11 8 9.5 132 87 36 9 9.5 106 66 32 8 10.5
GEORGIA
1924. 1925 1926. 1927. 1928 1929 1930 1931 1932. 1933 1934. 1935 1936. 1937.
54 25 19 10 5.5 70 33 25 12 6.5 51 35 6 10 6.0 63 44 10 9 6.3 45 33 7 5 6.5 48 33 7 8 5.5 69 50 9 10 6.0 94 68 13 13 5.2 68 41 20 7 6.0 65 45 13 7 5.0 66 48 11 7 6.0 66 48 11 7 6.0 100 71 17 12 5.7 101 66 23 12 6.2
1,000 bu.
26 26 29 16 30 20 10 36 117 96 84 232 180 224
64 120 153 189 128 196 158 120 82 56 82 85 207 136
86 68 63 54 50 80 68
121 115 76 90 76
55 78 60 57 32 44 60 68 42 35 42 42 68 74
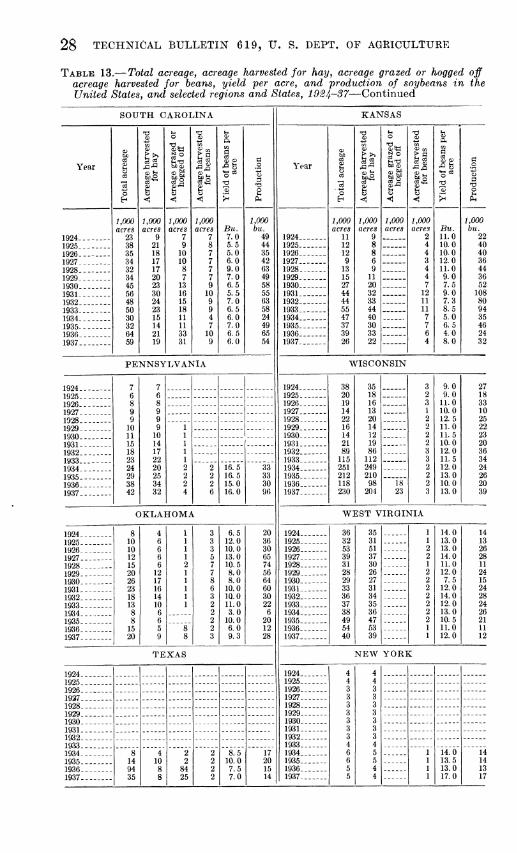
28 TECHNICAL BULLETIN 61Ô, tJ. S. DEPT. OE AGRICULTURE
TABLE 13.—Total acreage^ acreage harvested for hay^ acreage grazed or hogged off acreage harvested for beans, yield per acre, and production of soybeans in the United States, and selected regions and States, 1924-37—Continued
1924- 1925- 1926- 1927- 1928- 1929- 1930- 1931- 1932. 1933- 1934- 1935- 1936. 1937-
SOUTH CAROLINA
'Ö 1» XJ «-■
-M Tí
P^
Year II il 1Í Kl
II 1^ S-a P
o ^> Ü Ü o
H < < < >^
1,000 1,000 1,000 1,000 acres acres acres acres Bu.
1924 23 9 7 7 7.0 1925 38 21 9 8 5.5 1926 35 18 10 7 5.0 1927 34 17 10 7 6.0 1928 32 17 8 7 9.0 1929 34 20 7 7 7.0 1930 45 23 13 9 6.5 1931 56 30 16 10 5.5 1932 48 24 15 9 7.0 1933 50 23 18 9 6.5 1934 30 15 11 4 6.0 1935 32 14 11 7 7.0 1936 64 21 33 10 6.5 1937 59 19 31 9 6.0
PENNSYLVANIA
1924 7 7 1925 6 6 1926 8 8 1927 9 9 1928 9 9 1929 10 9 1930 11 10 1931 15 14 1932 18 17 1933 23 22 1934 24 20 1935 29 25 1936 38 34 1937 42 32
16.5 16.5 15.0 16.0
OKLAHOMA
1924 8 4 3 6.5 1925 10 6 3 12.0 1926 10 6 3 10.0 1927 12 6 5 13.0 1928 15 6 7 10.5 1929 20 12 7 8.0 1930 26 17 8 8.0 1931 23 16 6 10.0 1932 18 14 3 IQ.O 1933 13 10 2 11.0 1934 8 6 2 3.0 1935 8 6 2 10.0 1936 15 5 8 2 6.0 1937 20 9 8 3 9.3
TEXAS
8.5 10.0 7.5 7.0
1,000 bu.
49 44 35 42 63 49 58 55 63 58 24 49 65 54
Year
KANSAS
1924. 1925. 1926. 1927. 1928 1929. 1930. 1931. 1932. 1933. 1934 1935. 1936. 1937.
1,000 acres
11 12 12 9
13 15 27 44 44 55 47 37 39 26
1,000 acres
1,000 acres
1,000 acres
2 4 4 3 4 4 7
12 11 11
7 7
Bu. 11.0 10.0 10.0 12.0 11.0 9.0 7.5 9.0 7.3 8.5 5.0 6.5 4.0 8.0
WISCONSIN
1924 38 35 3 9.0 1925 20 18 2 9.0 1926 19 16 3 11.0 1927 14 13 1 10.0 1928 22 20 2 12.5 1929 16 14 2 11.0 1930 14 12 2 11.5 1931 21 19 2 10.0 1932 89 86 3 12.0 1933 115 112 3 11.5 1934 251 249 2 12.0 1935 212 210 2 13.0 1936 118 98 18 2 10.0 1937 230 204 23 3 13.0
WEST VIRGINIA
1924 36 35 1 14.0 1925 32 31 1 13.0 1926 53 51 2 13.0 1927 39 37 2 14.0 1928 31 30 1 11.0 1929 28 26 2 12.0 1930 29 27 2 7.5 1931 33 31 2 12.0 1932 36 34 2 14.0 1933 37 35 2 12.0 1934 38 36 2 13.0 1935 49 47 2 10.5 1936 54 53 1 11.0 1937 40 39 1 12.0
NEW YORK
1924. 1925. 1926. 1927. 1928 1929 1930. 1931. 1932 1933. 1934. 1935. 1936. 1937.
14.0 13.5 13.0 17.0
SOYBEANS IN THE UNITED STATES 29
SELECTED LIST OF REFERENCES 12
AMERICAN SOYBEAN ASSOCIATION. PROCEEDINGS OF ANNUAL MEETINGS. 1925-30, 1935-36.
BARR, J. E. MARKETING SOYBEANS, BASIS U. S. STANDARDS. 6 pp. U. S. Bur. Agr.
Econ. 1932. [Mimeographed.]
WHAT PRICE SOYBEANS? U. S. Bur. Agr. Econ. 1933. [Mimeographed.]
MARKETING SOYBEANS. Grain and Feed Jours., ConsoHdated 72 (2): 72. 1934.
BowDiDGE, ELIZABETH.
THE SOYA BEAN, ITS HISTORY, CULTIVATION (IN ENGLAND), AND USES. 83 pp. London. 1935.
BURLISON, W. L. RECENT DEVELOPMENTS IN THE UTILIZATION OF SOYBEAN OIL IN PAINT. 111.
Agr. Expt. Sta. Cir. 438, 8 pp., illus. 1935.
THE SOYBEAN; A PLANT IMMIGRANT MAKES GOOD. 111. Agr. Expt. sta. Cir. 461, 15 pp., illus. 1936.
DURKEE, M. M. SOYBEAN OIL IN THE FOOD INDUSTRY. Indus, and Engin. Chem. 28: 898-903,
illus. 1936. GRAY, GEORGE DOUGLAS.
ALL ABOUT THE SOYA BEAN, IN AGRICULTURE, INDUSTRY, AND COMMERCE. 140 pp., illus. London. 1936.
HORVATH, A. A. THE SOYBEAN POINTS THE WAY TO AGRICULTURAL RECOVERY. Sci. Monthly
43: 63-69. 1936. JAMIESON, GEORGE S.
VEGETABLE FATS AND OILS; THE CHEMISTRY, PRODUCTION, AND UTILIZATION OF VEGETABLE FATS AND OILS FOR EDIBLE, MEDICINAL, AND TECHNICAL PURPOSES. 444 pp., illus. New York. 1932.
JOHNSON, E. F. IS THE SOYBEAN OVER-EXPLOITED? Grain and Feed Rev. 26 (5): 14-18.
1937. KING, B. M.
SOYBEAN HAY PRODUCTION. Mo. Agr. Col. Ext. Cir. 336. 4 pp., illus. 1936. MCCLELLAND, C. K.
SOYBEAN VARIETIES FOR HAY, SEED, AND OIL PRODUCTION. Ark. Agr. Expt. Sta. Bull. 334, 42 pp., illus. 1936.
McGuiRE, RAY F. SOYBEAN VALUES. 15 pp., iUus. Soybean Prod. Adv. Bd. Cedar Rapids,
Iowa. 1934. MILLS, ZELLAR R.
COMMERCIAL GROWING OF SOYBEANS IN IOWA. Soybean Prod. Adv. Bd. co- operating with Soybean Products, Inc. Cedar Rapids, Iowa. 1934.
MORRISON, F. B. FEEDS AND FEEDING; A HANDBOOK FOR THE STUDENT AND STOCKMAN. ED.
20, unabridged, 1050 pp., illus. Ithaca, N. Y. MORSE, W. J.
SOYBEAN CULTURE AND VARIETIES. U. S. Dept. Agr. Farmers* Bull. 1520, 34 pp., illus. 1927.
SOYBEAN HAY AND SEED PRODUCTION. U. S. Dept. Agr. Farmers' Bull. 1605, 13 pp., illus. 1929.
SOYBEAN UTILIZATION. U. S. Dept. Agr. Farmers' Bull. 1617, 28 pp., illus. 1930. (Revised, 1932.)
PIPER, CHARLES V., and MORSE, WILLIAM J. THE SOYBEAN. 329 pp., illus. New York. 1923.
Ross, R. C. SOYBEAN COSTS AND PRODUCTION PRACTICES. 111. Agr. Expt. Sta. Bull. 428,
pp. 343-388, illus. 1936.
12 Numerous publications of the State experiment stations and extension services which deal mainly with the technical aspects of the cultivation of soybeans in the indi vidual States are not included.
30 TP:CHNiaAL BULLETIN 619, U. S. DEPT. OF AGRICULTURE
RUSK, H. P., NEVENS, W. B., KAMMLADE, W. G., EDMONDS, J. L., CRAWFORD, C. W., CARROLL, W. E., and SLOAN, H. J.
UTILIZING THE SOYBEAN CROP IN LIVESTOCK FEEDING*. A STATEMENT OF ITS VALUE FOR DAIRY CATTLE, BEEF CATTLE, SHEEP, HORSES, SWINE, AND POULTRY. IlL Agr. Expt. Sta. Cir. 369, 44 pp., illus. 1931.
STEWART, C. L., BURLISON, W. L., NORTON, L. J., and WHALEN, O. L. SUPPLY AND MARKETING OF SOYBEANS AND SOYBEAN PRODUCTS. 111. Agr.
Expt. sta. Bull. 386, pp. 429-544, illus. 1932. STEWART, JOHN R. r. T-. . a T:^ ^ • u^i ^ u
THE SOYA BEAN AND MANCHURIA. Far Eastem Survey; iortmghtly Research Service, American Council, Institute of Pacific Relations 5: 221-226. October 21, 1936.
SWEENEY, O. R., and ARNOLD, L. K. PROCESSING THE SOYBEAN. lowa State Col. Engin. Ext. Serv. Bull. 103,
rev., 59 pp., illus. 1935. (Iowa State Col. Off. Pub. v. 34, No. 14.) UNITED STATES AGRICULTURAL ADJUSTMENT ADMINISTRATION.
SALUTE TO THE WONDER BEAN. U. S. Agr. Adjustment Admin. Consumers' Guide 3 (6) : 3-7, 22, illus. 1936.
UNITED STATES BUREAU OF AGRICULTURAL ECONOMICS. HANDBOOK OF OFFICIAL UNITED STATES STANDARDS FOR SOYBEANS. Effec-
tive September 3, 1935. 20 pp. 1935.
THE SOYBEAN OUTLOOK FOR 1938. 7 pp. 1937. [Mimeographed.]
W^ï^^' E. E. T , ^ T^ • ni. 9« SOYBEAN OIL AND THE PAINT INDUSTRY. ludus. and Eugm. Chem. ¿0:
903-906, illus. 1936.
ORGANIZATION OF THE UNITED STATES DEPARTMENT OF AGRICULTURE WHEN THIS PUBLICATION WAS LAST PRINTED
Secretary of Agriculture HENRY A. WALLACE.
Under Secretary M. L. WILSON.
Assistant Secretary HARRY L. BROWN.
Director of Extension Work C. W. WARBURTON.
Director of Finance W. A. JUMP.
Director of Information M.S. EISENHOWER.
Director of Personnel W. W. STOCKBERGER.
Director of Research JAMES T. JARDINE.
Solicitor MASTíN G. WHITE.
Agricultural Adjustment Administration H. R. TOLLEY, Administrator. Bureau of Agricultural Economics A. G. BLACK, Chief. Bureau of Agricultural Engineering S. H. MCCRORY, Chief. Bureau of Animal Industry JOHN R. MOHLER, Chief. Bureau of Biological Survey IRA N. GABRIELSON, Chief. Bureau of Chemistry and Soils HENRY G. KNIGHT, Chief. Commodity Exchange Administration J. W. T. DUVEL, Chief. Bureau of Dairy Industry O. E. REED, Chief. Bureau of Entomology and Plant Quarantine, LEE A. STRONG, Chief. Office of Experiment Station s JAMESJ. J ARDINE. Chief. Farm Security Administration W. W. ALEXANDER, Administrator. Food and Drug Administration WALTER G. CAMPBELL, Chief. Forest Service FERDINAND A. SILCOX, Chief. Bureau of Home Economics LOUISE STANLEY, Chief. Library CLARIBEL R. BARNETT, Librarian. Bureau of Plant Industry E. C. AUCHTER, Chief. Bureau of Public Roads THOMAS H. MACDONALD, Chief. Soil Conservation Service H.H. BENNETT, Chief. Weather Bureau WILLIS R. GREGG, Chief.
This bulletin is a contribution from
Bureau of Agricultural Economics A. G. BLACK, Chief. 31
U. S. GOVERNMENT PRINTING OFFICE: 1338
For sale by the Superintendeut Of ppciiments^ Washington, D. C. - - - - Price 5 cent§